ARE WE JUST GUESSING? AN EXPLORATORY STUDY OF MINNESOTA EMERGENCY MANAGERS’ PERCEPTIONS OF CITIZEN PREPAREDNESS A Thesis Submitted to the Graduate Faculty of the North Dakota State University of Agriculture and Applied Science By Breanna Colette Koval In Partial Fulfillment of the Requirements for the Degree of MASTER OF SCIENCE Major Department: Emergency Management November 2015 Fargo, North Dakota
Transcript
ARE WE JUST GUESSING? AN EXPLORATORY STUDY OF MINNESOTA EMERGENCY
MANAGERS’ PERCEPTIONS OF CITIZEN PREPAREDNESS
A Thesis
Submitted to the Graduate Faculty
of the
North Dakota State University
of Agriculture and Applied Science
By
Breanna Colette Koval
In Partial Fulfillment of the Requirements
for the Degree of
MASTER OF SCIENCE
Major Department:
Emergency Management
November 2015
Fargo, North Dakota
North Dakota State University
Graduate School
Title
ARE WE JUST GUESSING? AN EXPLORATORY STUDY OF MINNESOTA
EMERGENCY MANAGERS’ PERCEPTIONS OF CITIZEN PREPAREDNESS
By
Breanna Colette Koval
The Supervisory Committee certifies that this disquisition complies with North Dakota State
University’s regulations and meets the accepted standards for the degree of
MASTER OF SCIENCE
SUPERVISORY COMMITTEE:
Jessica Jensen
Chair
George Youngs
Daniel J. Kelnow
Carol Cwiak
Mark Harvey
Approved:
11/5/2015 Daniel J. Klenow
Date Department Chair
iii
ABSTRACT
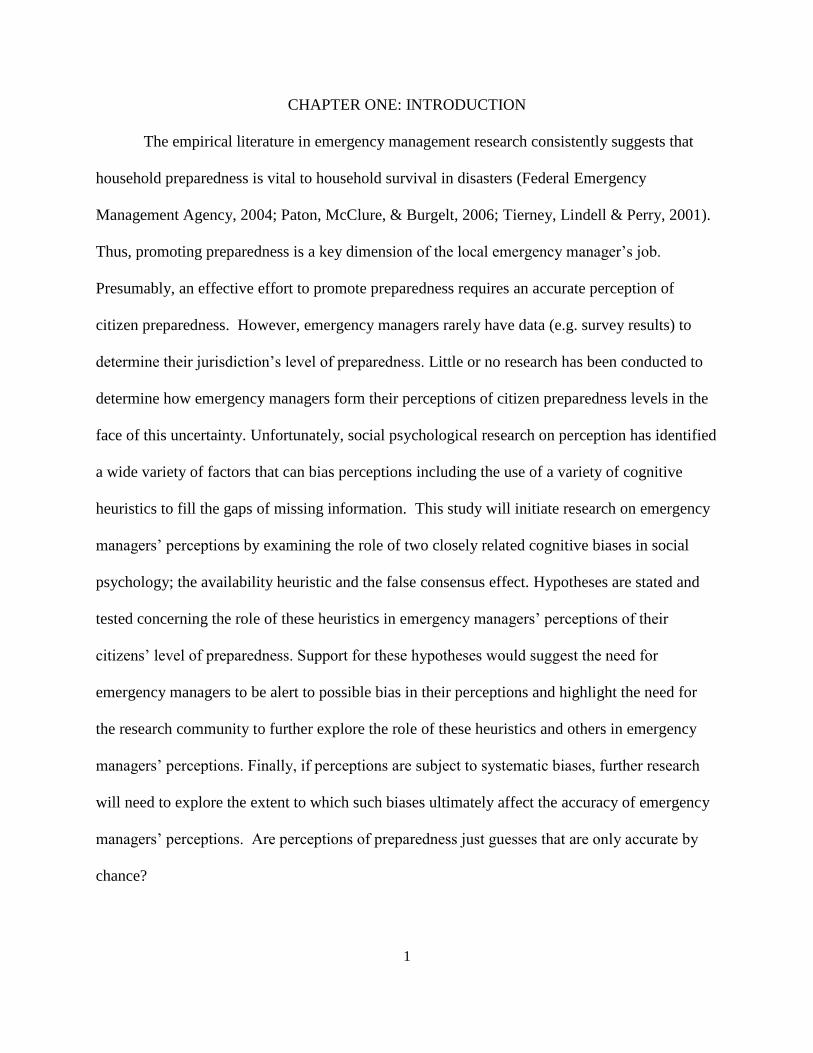
Emergency management research suggests that citizen preparedness is paramount to
household survival in disasters. Thus, having a citizenry that is well prepared is ideal for
individuals who work directly in emergency management and disaster response roles. At the
lowest governmental level, it is the local emergency manager who is tasked with the job of
promoting preparedness to their respective jurisdictions. However, to effectively promote
preparedness to citizens, it is presumed that an emergency manager would need a fairly accurate
perception of citizen preparedness. However, emergency managers rarely have data to determine
their jurisdiction’s level of preparedness. Without data to inform a perception, how does an
emergency manager determine the preparedness of his or her jurisdiction? This study explores
two possible cognitive heuristics that could play a role in how county-level emergency managers
form their perceptions of preparedness; the availability heuristic and the false consensus effect.
iv
ACKNOWLEDGEMENTS
This disquisition, which was intended to take three years and actually took six, would
never have been possible without the continued support from Dr. George Youngs. Without his
encouragement and upbeat attitude, I am not sure that I would have been able to do a project of
this magnitude and so far outside of my comfort zone. His guidance through this process was
invaluable. A “Thank You” will never express my gratitude!
I would also like to thank my husband for sticking with me on this long and crazy
graduate school adventure! He supported me through my victories and was a shoulder to cry on
when I hit a setback. Without his love and support I would have never been able to emotionally
survive this project. Thank You!
v
TABLE OF CONTENTS
ABSTRACT ................................................................................................................................... iii
ACKNOWLEDGEMENTS ........................................................................................................... iv
LIST OF TABLES ....................................................................................................................... viii
Unit of Analysis ...................................................................................................................................... 22
Population ............................................................................................................................................... 22
Further Research ..................................................................................................................................... 56
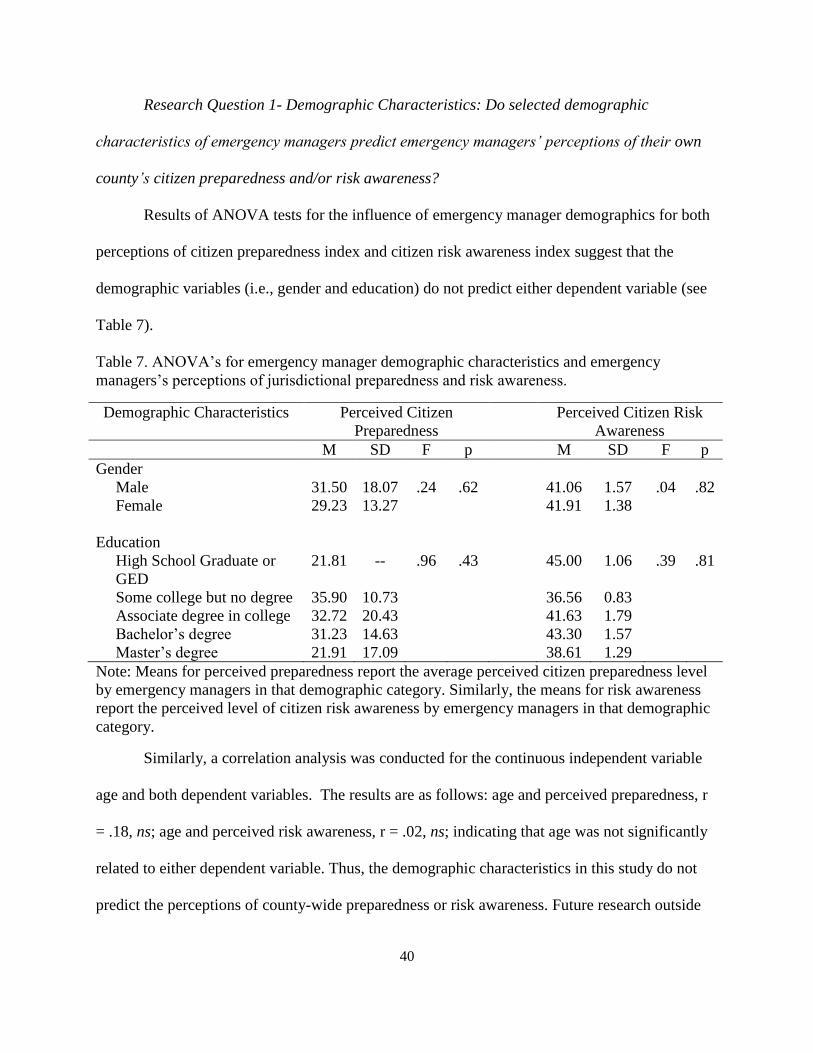
Results of ANOVA tests for the influence of emergency manager demographics for both
perceptions of citizen preparedness index and citizen risk awareness index suggest that the
demographic variables (i.e., gender and education) do not predict either dependent variable (see
Table 7).
Table 7. ANOVA’s for emergency manager demographic characteristics and emergency
managers’s perceptions of jurisdictional preparedness and risk awareness.
Demographic Characteristics Perceived Citizen
Preparedness
Perceived Citizen Risk
Awareness
M SD F p M SD F p
Gender
Male 31.50 18.07 .24 .62 41.06 1.57 .04 .82
Female 29.23 13.27 41.91 1.38
Education
High School Graduate or
GED
21.81 -- .96 .43 45.00 1.06 .39 .81
Some college but no degree 35.90 10.73 36.56 0.83
Associate degree in college 32.72 20.43 41.63 1.79
Bachelor’s degree 31.23 14.63 43.30 1.57
Master’s degree 21.91 17.09 38.61 1.29
Note: Means for perceived preparedness report the average perceived citizen preparedness level
by emergency managers in that demographic category. Similarly, the means for risk awareness
report the perceived level of citizen risk awareness by emergency managers in that demographic
category.
Similarly, a correlation analysis was conducted for the continuous independent variable
age and both dependent variables. The results are as follows: age and perceived preparedness, r
= .18, ns; age and perceived risk awareness, r = .02, ns; indicating that age was not significantly
related to either dependent variable. Thus, the demographic characteristics in this study do not
predict the perceptions of county-wide preparedness or risk awareness. Future research outside
41
the scope of this study needs to assess whether the demographic characteristics of the emergency
manager affect perceptions of demographic subgroups within the county (e.g., do perceptions of
female citizens’ preparedness and risk awareness differ by gender of the emergency manager?)
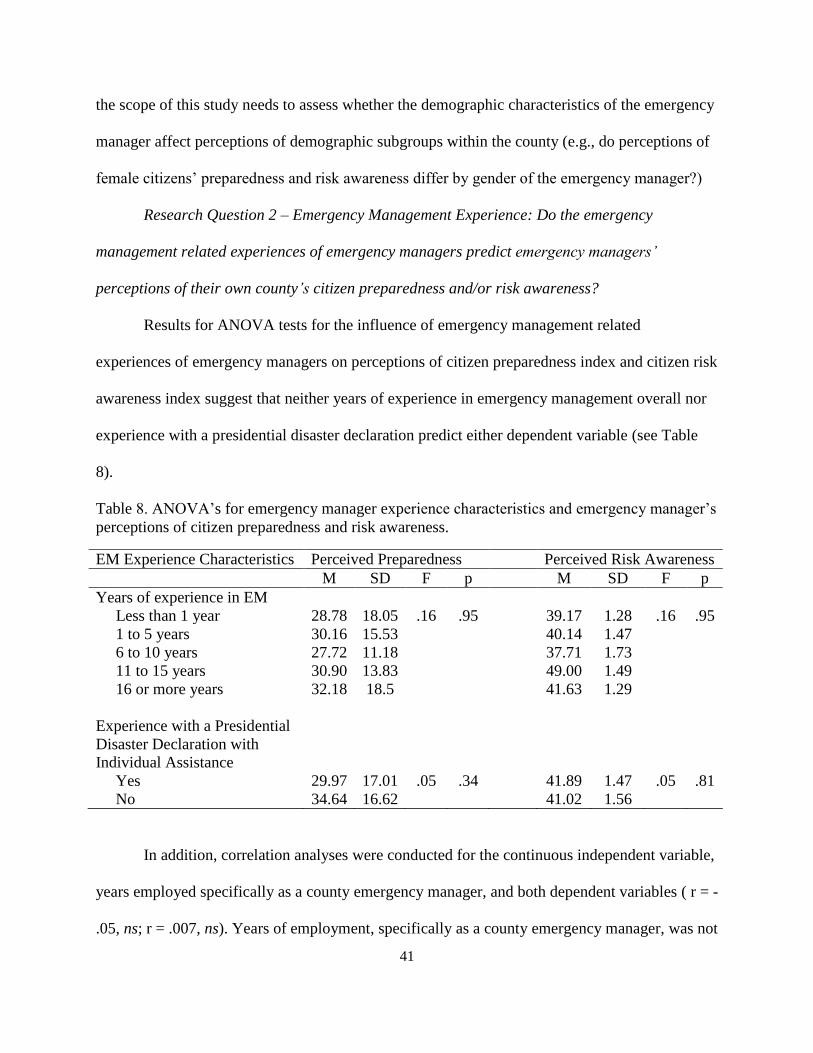
Research Question 2 – Emergency Management Experience: Do the emergency
management related experiences of emergency managers predict emergency managers’
perceptions of their own county’s citizen preparedness and/or risk awareness?
Results for ANOVA tests for the influence of emergency management related
experiences of emergency managers on perceptions of citizen preparedness index and citizen risk
awareness index suggest that neither years of experience in emergency management overall nor
experience with a presidential disaster declaration predict either dependent variable (see Table
8).
Table 8. ANOVA’s for emergency manager experience characteristics and emergency manager’s
perceptions of citizen preparedness and risk awareness.
EM Experience Characteristics Perceived Preparedness Perceived Risk Awareness
M SD F p M SD F p
Years of experience in EM
Less than 1 year 28.78 18.05 .16 .95 39.17 1.28 .16 .95
1 to 5 years 30.16 15.53 40.14 1.47
6 to 10 years 27.72 11.18 37.71 1.73
11 to 15 years 30.90 13.83 49.00 1.49
16 or more years 32.18 18.5 41.63 1.29
Experience with a Presidential
Disaster Declaration with
Individual Assistance
Yes 29.97 17.01 .05 .34 41.89 1.47 .05 .81
No 34.64 16.62 41.02 1.56
In addition, correlation analyses were conducted for the continuous independent variable,
years employed specifically as a county emergency manager, and both dependent variables ( r = -
.05, ns; r = .007, ns). Years of employment, specifically as a county emergency manager, was not
42
significantly related to either dependent variable. Thus, neither experience in emergency
management, overall, specific experience as an emergency manager in a given county, nor
experience at some point with a presidentially declared disaster affected emergency managers’
perceptions of citizen preparedness or risk awareness. As noted earlier, research on self-reported
citizen preparedness is disappointing and one might expect more seasoned emergency managers’
perceptions to be enhanced by encountering this reality first-hand, but this does not appear to be
the case.
Research Question 3 – Emergency Management Office Structure: Do the structural
characteristics of the emergency managers’ county office predict emergency managers’
perceptions of their own county’s citizen preparedness and/or risk awareness?
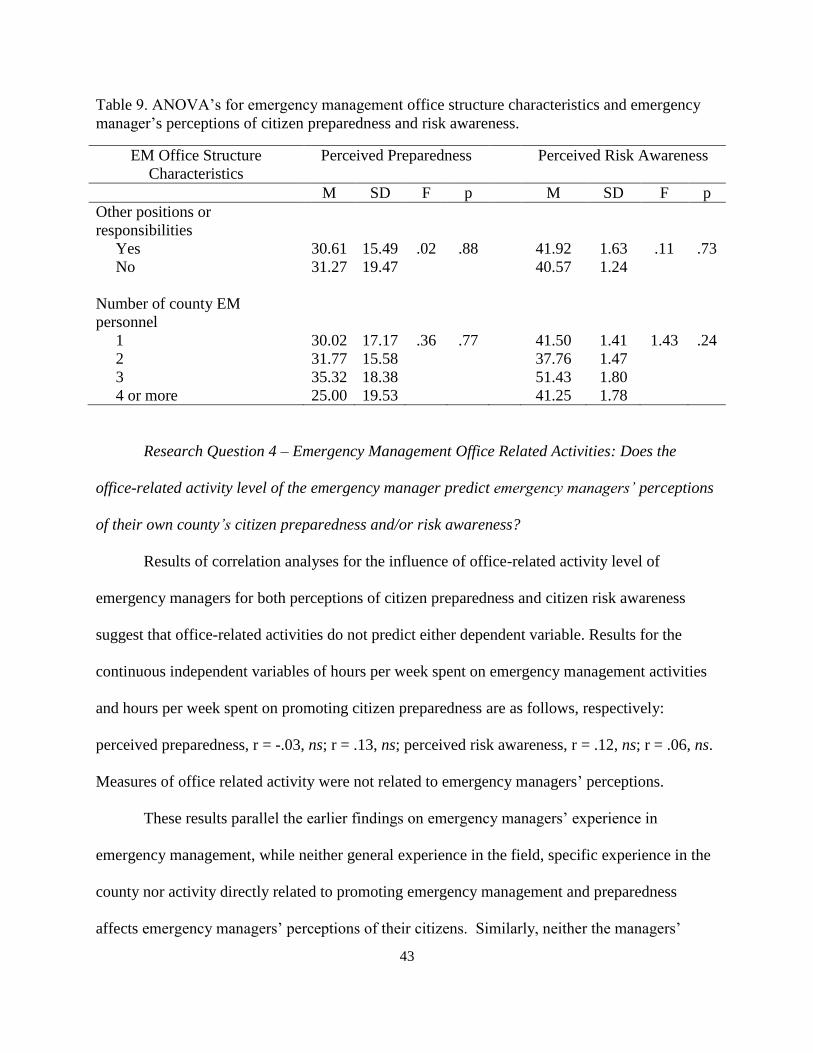
Results for ANOVA tests for the influence of structural characteristics of emergency
manager’s county office for both perceptions of citizen preparedness and citizen risk awareness
suggest that structural characteristics do not predict either dependent variable (see Table 9).
Emergency managers’ perception of county preparedness and risk awareness did not differ for
emergency managers who did or did not hold other positions nor did these perceptions differ by
the size of emergency manager’s office.
43
Table 9. ANOVA’s for emergency management office structure characteristics and emergency
manager’s perceptions of citizen preparedness and risk awareness.
EM Office Structure
Characteristics
Perceived Preparedness Perceived Risk Awareness
M SD F p M SD F p
Other positions or
responsibilities
Yes 30.61 15.49 .02 .88 41.92 1.63 .11 .73
No 31.27 19.47 40.57 1.24
Number of county EM
personnel
1 30.02 17.17 .36 .77 41.50 1.41 1.43 .24
2 31.77 15.58 37.76 1.47
3 35.32 18.38 51.43 1.80
4 or more 25.00 19.53 41.25 1.78
Research Question 4 – Emergency Management Office Related Activities: Does the
office-related activity level of the emergency manager predict emergency managers’ perceptions
of their own county’s citizen preparedness and/or risk awareness?
Results of correlation analyses for the influence of office-related activity level of
emergency managers for both perceptions of citizen preparedness and citizen risk awareness
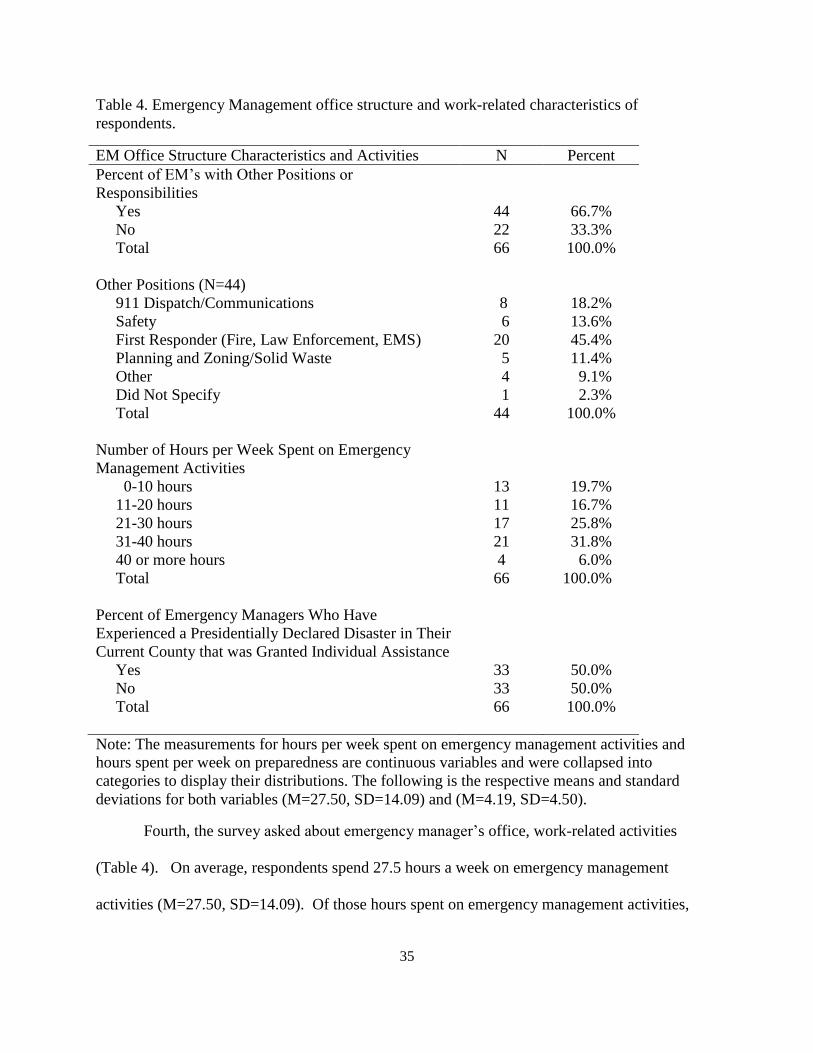
suggest that office-related activities do not predict either dependent variable. Results for the
continuous independent variables of hours per week spent on emergency management activities
and hours per week spent on promoting citizen preparedness are as follows, respectively:
perceived preparedness, r = -.03, ns; r = .13, ns; perceived risk awareness, r = .12, ns; r = .06, ns.
Measures of office related activity were not related to emergency managers’ perceptions.
These results parallel the earlier findings on emergency managers’ experience in
emergency management, while neither general experience in the field, specific experience in the
county nor activity directly related to promoting emergency management and preparedness
affects emergency managers’ perceptions of their citizens. Similarly, neither the managers’
44
ascribed (gender and age), nor his or her achieved (education) characteristics affect managers’
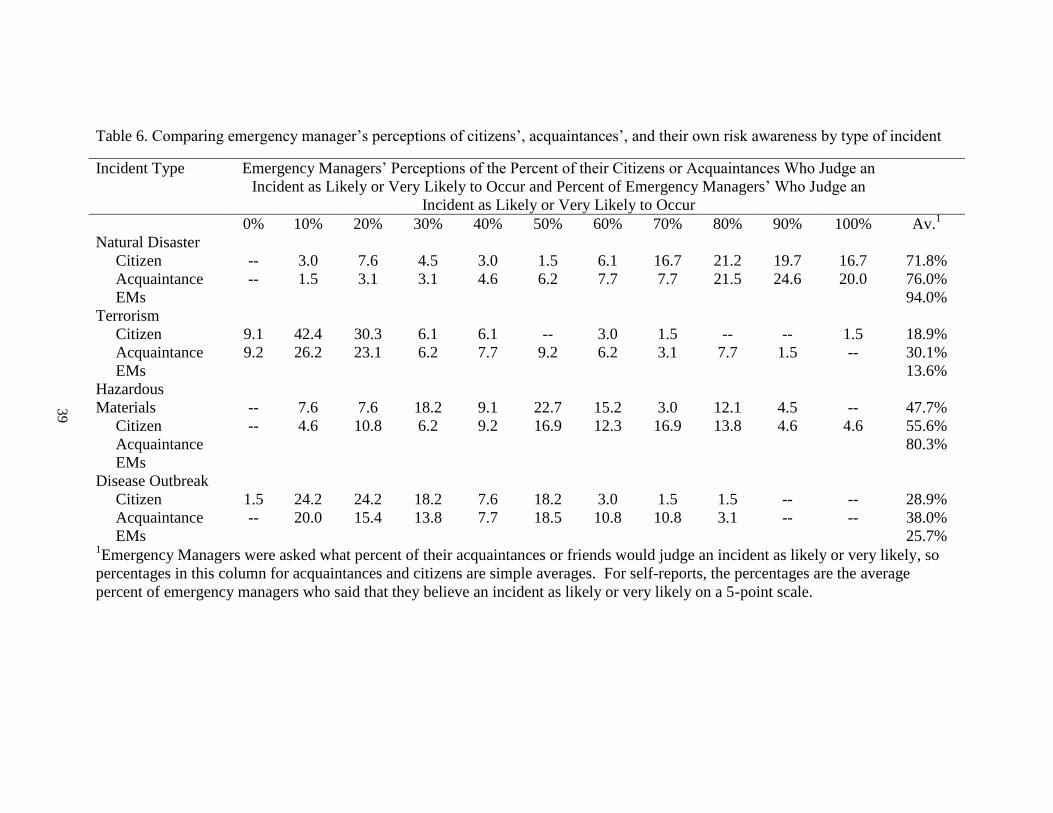
perceptions of their citizens. However, Tables 5 and 6 clearly showed variations in emergency
managers’ perceptions but the results so far provided little insight into the source of that
variability. The variability is not due to the emergency managers’ personal demographic
characteristics, nor his or her office structure, nor the manager’s experience in his or her office,
nor in his or her level of activity in the office. Perhaps the variability is simply due to the actual
preparedness levels and levels of risk awareness really being different from county-to-county.
This possibility is explored in the next research question.
Research Question 5 – Variability in County Demographics: Do the preparedness-
related demographic characteristics of the counties predict emergency managers’ perceptions of
their own county’s citizen preparedness and/or risk awareness?
This research question is basically asking whether emergency managers’ perception of
their counties reflect the reality of what is happening at the county level. To directly answer this
question would require surveys to be conducted in each county so that there could be a direct
comparison of survey results with emergency managers’ perceptions. As noted earlier such a
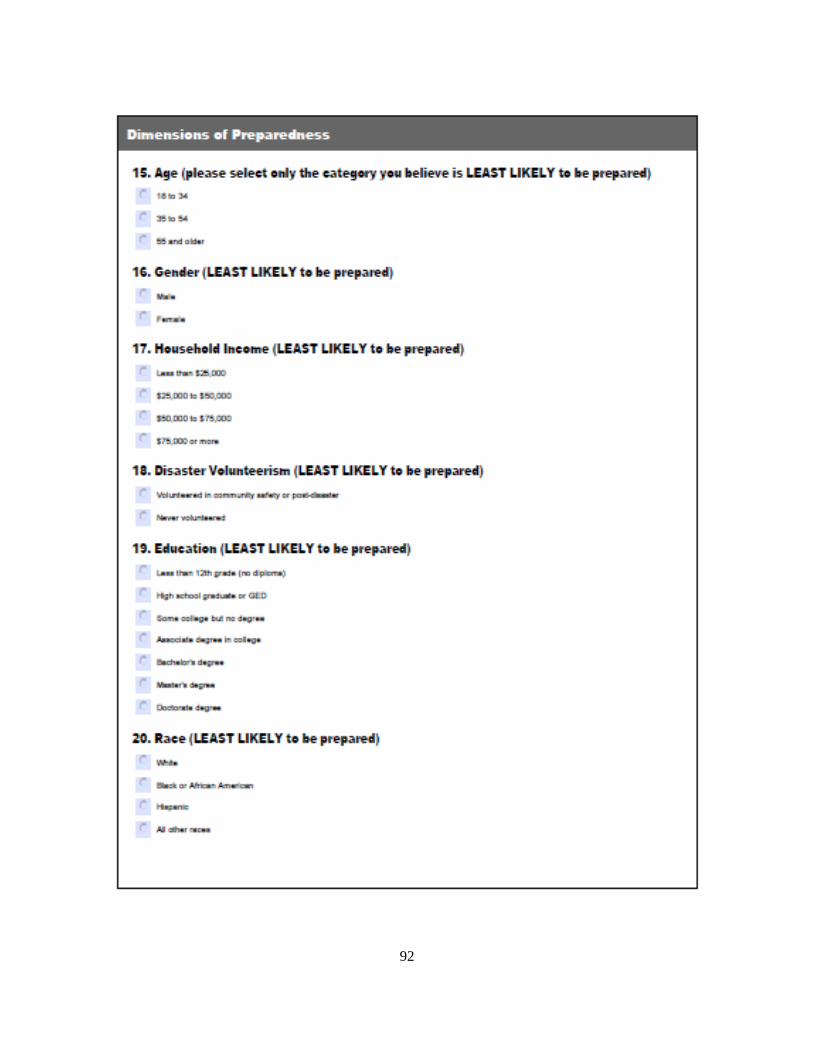
project would be costly and time prohibitive. Alternatively, it was possible to identify from the
FEMA survey (Federal Emergency Management Agency, 2009), the category in each of several
demographics that actually reflected the least prepared group nationally and then determine the
percent of each county’s population in that category. If emergency managers’ perceptions of
preparedness were reality-based their perceptions should vary with variations from county-to-
county in the percentage of county citizens in the least prepared category for any given
demographic characteristic mentioned in the FEMA surveys.
45
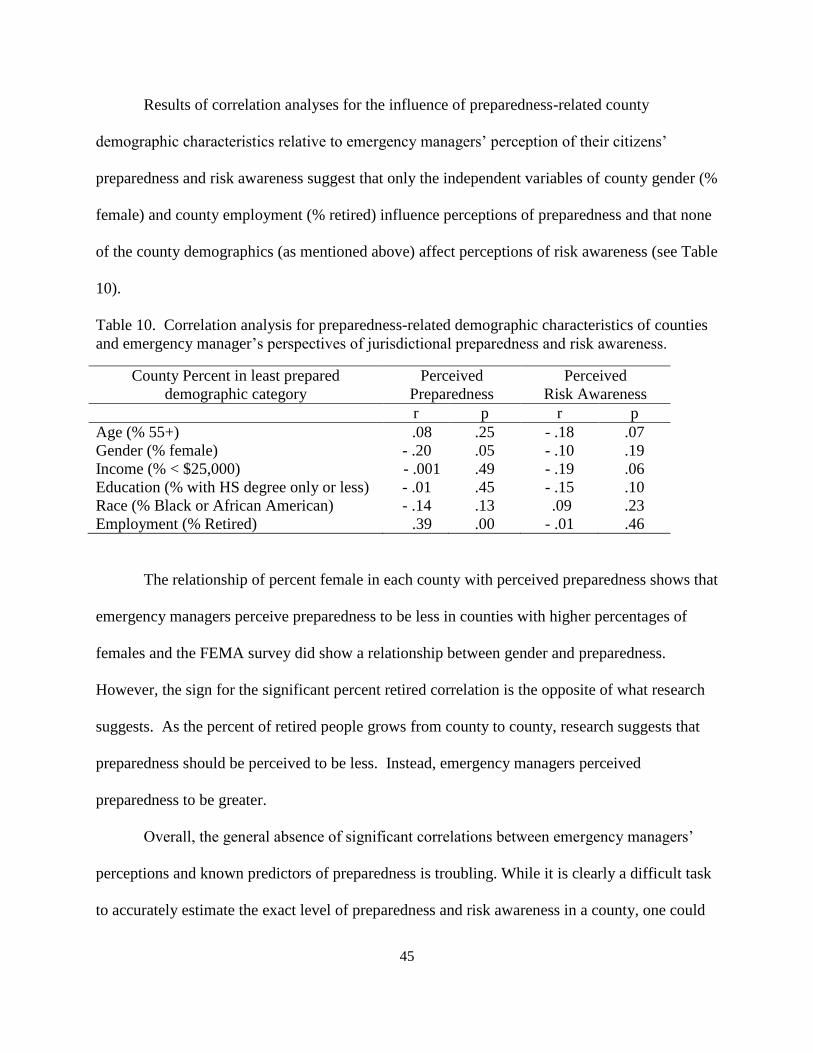
Results of correlation analyses for the influence of preparedness-related county
demographic characteristics relative to emergency managers’ perception of their citizens’
preparedness and risk awareness suggest that only the independent variables of county gender (%
female) and county employment (% retired) influence perceptions of preparedness and that none
of the county demographics (as mentioned above) affect perceptions of risk awareness (see Table
10).
Table 10. Correlation analysis for preparedness-related demographic characteristics of counties
and emergency manager’s perspectives of jurisdictional preparedness and risk awareness.
County Percent in least prepared
demographic category
Perceived
Preparedness
Perceived
Risk Awareness
r p r p
Age (% 55+) .08 .25 - .18 .07
Gender (% female) - .20 .05 - .10 .19
Income (% < $25,000) - .001 .49 - .19 .06
Education (% with HS degree only or less) - .01 .45 - .15 .10
Race (% Black or African American) - .14 .13 .09 .23
Employment (% Retired) .39 .00 - .01 .46
The relationship of percent female in each county with perceived preparedness shows that
emergency managers perceive preparedness to be less in counties with higher percentages of
females and the FEMA survey did show a relationship between gender and preparedness.
However, the sign for the significant percent retired correlation is the opposite of what research
suggests. As the percent of retired people grows from county to county, research suggests that
preparedness should be perceived to be less. Instead, emergency managers perceived
preparedness to be greater.
Overall, the general absence of significant correlations between emergency managers’
perceptions and known predictors of preparedness is troubling. While it is clearly a difficult task
to accurately estimate the exact level of preparedness and risk awareness in a county, one could
46
still anticipate sensitivity to demographic predictions of preparedness in a county such that there
would be correlations across counties between estimates of citizen preparedness and county-level
demographic predictions of such. This generally was not the case. So, are emergency managers’
perceptions simply random guesses unrelated to experience and/or on the ground reality or is
there some other source of data used by emergency managers that might suggest a pattern behind
what otherwise appears to be mere guessing?
The hypotheses to follow predict that emergency managers’ perceptions are patterned and
based on data, but on data sources much closer to home. The hypotheses are independent of the
research questions. They would be offered whether the research questions were found to be
answered positively or negatively. Still the hypotheses become more interesting if supported,
given the pattern of findings so far.
Hypotheses
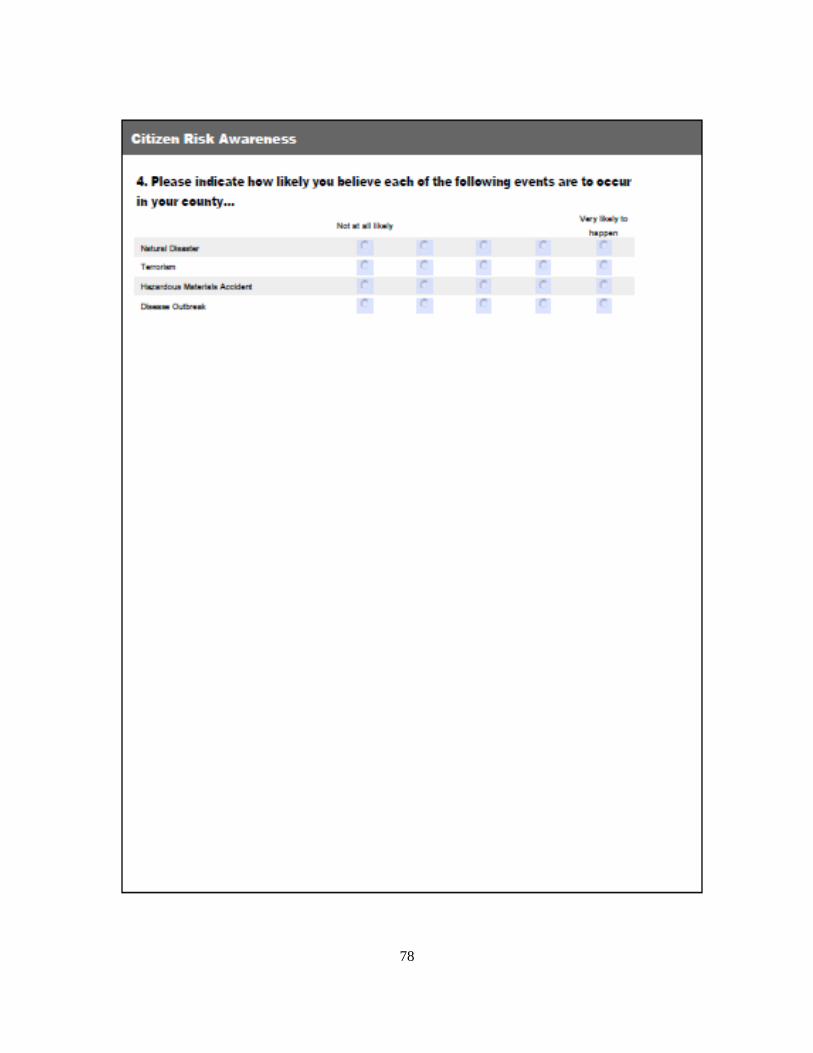
False Consensus Hypothesis: Emergency managers’ self-reports of their own risk
awareness level and preparedness level will correlate positively with emergency managers’
perceptions of their own county’s citizen risk awareness level and preparedness level,
respectively.
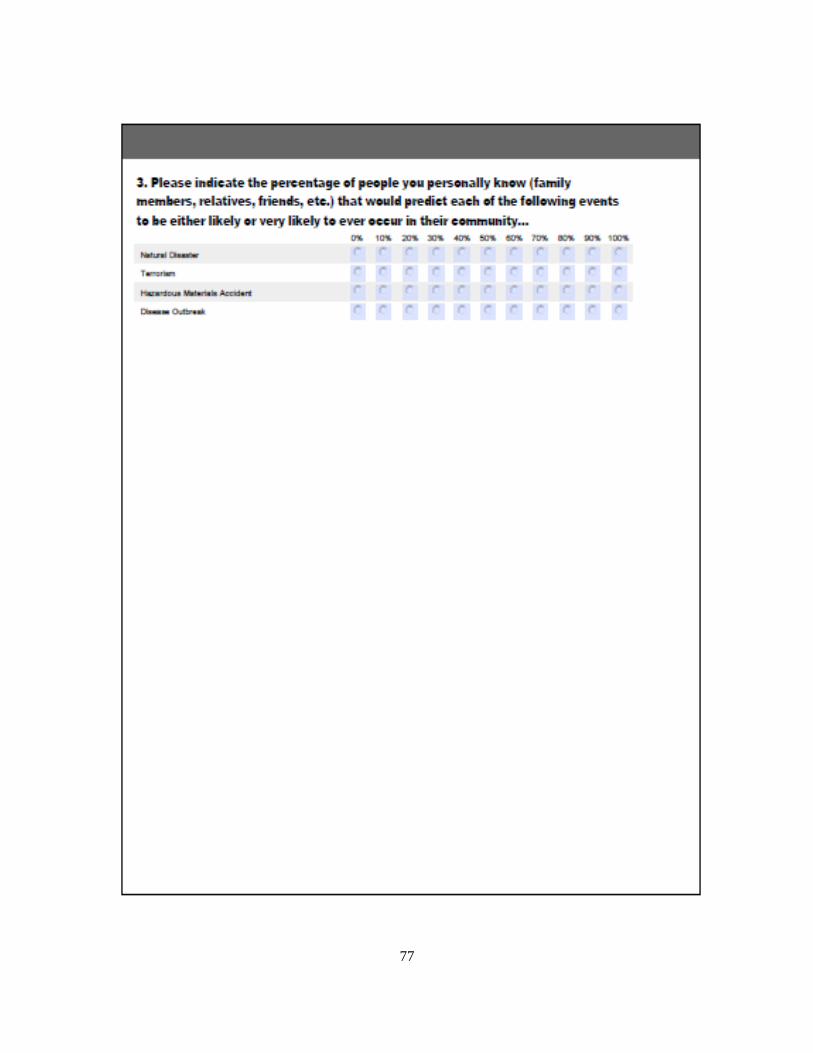
Availability Hypothesis: Emergency managers’ perceptions of their friends’ and family’s
risk awareness level and preparedness level well correlate positively with emergency managers’
perceptions of their own county’s citizen risk awareness and preparedness level, respectively.
Correlational data support both the False Consensus Hypothesis and the Availability
Hypothesis. For risk awareness, the correlations of emergency managers’ self-perception of risk
awareness (False Consensus Hypothesis) and their perceptions of their friends’ and family’s risk
awareness (Availability Hypothesis) are both significantly related to emergency managers’
47
perceptions of citizen risk awareness (r = .22, p < .05; r = .21, p < .05, respectively). Similarly,
for preparedness, the correlations of emergency managers’ own preparedness level and their
perceptions of their friends’ and family’s preparedness level are both significantly related to
emergency managers’ perceptions of jurisdictional preparedness (r = .29, p < .01; r = .79, p <
.001, respectively). Based on the correlations alone, emergency managers’ perceptions of their
jurisdictions appear to be related to both their self-perceptions and their perceptions of their
acquaintances as these two heuristic hypotheses suggest. Especially dramatic is the large
correlation between emergency managers’ perception of their friends’ and family’s preparedness
and emergency managers’ perceptions of citizen preparedness strongly supporting the
plausibility of the Availability Hypothesis.
A stronger test of the two hypotheses is to control on other factors that might explain
variation in emergency managers’ perceptions of their jurisdictions via the use of multiple
regression to see if the correlational relationships remain (Table 11). Two multiple regression
models were created, one using emergency managers’ perceptions of their county’s risk
awareness as a dependent variable and one using their perceptions of their county’s preparedness
level as a dependent variable. For each model, only those factors found to be significantly
related to the respective dependent variable as assessed in the above research questions were
used as controls. In the first model, no potential control factors proved significant in the above
analyses, so the model simply included the independent variables for the two hypotheses (i.e.,
emergency managers’ self-reported risk awareness and their perception of their acquaintances’
risk awareness). For the second model, two factors were found to be significantly related to
emergency managers’ perceptions of jurisdictional preparedness (i.e., county-level percent
female and percent retired) and were included along with the two appropriate independent
48
variables for the two hypotheses (i.e., emergency managers’ self-reported preparedness and
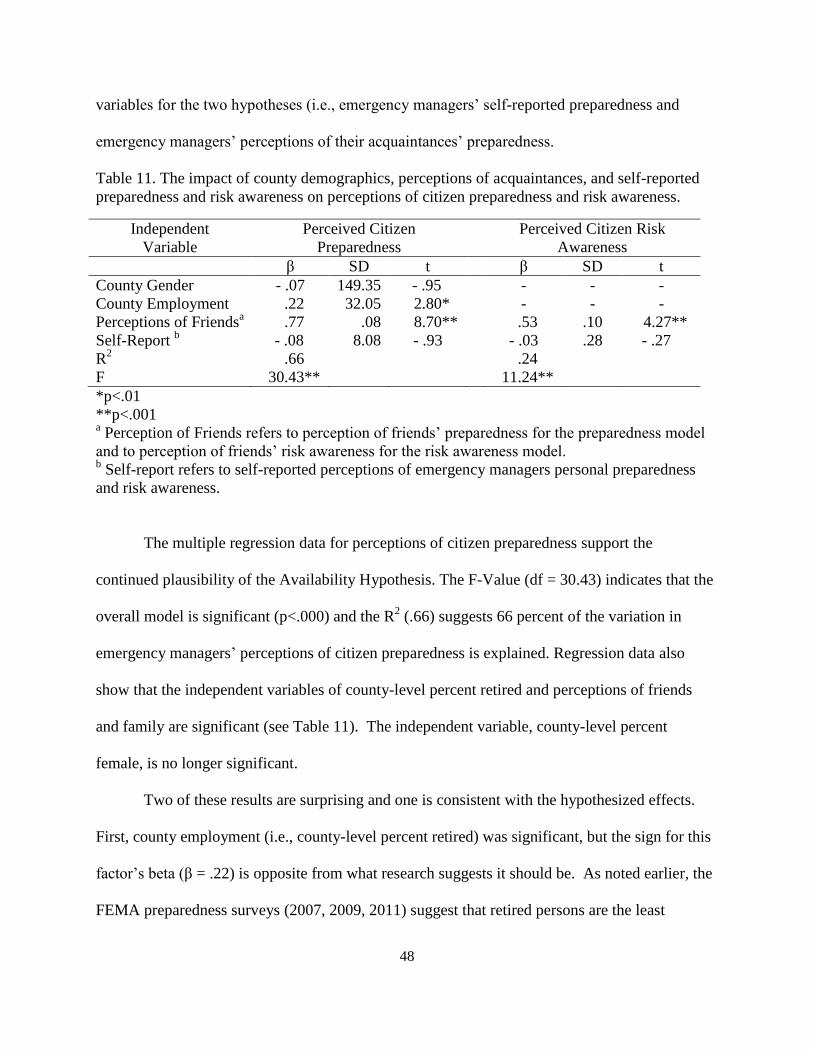
emergency managers’ perceptions of their acquaintances’ preparedness.
Table 11. The impact of county demographics, perceptions of acquaintances, and self-reported
preparedness and risk awareness on perceptions of citizen preparedness and risk awareness.
Independent
Variable
Perceived Citizen
Preparedness
Perceived Citizen Risk
Awareness
β SD t β SD t
County Gender - .07 149.35 - .95 - - -
County Employment 0.22 32.05 02.80* - - -
Perceptions of Friendsa
0.77 000.08 008.70** 0.53 .10 04.27**
Self-Report b
- .08 008.08 - .93 - .03 .28 - .27
R2
F
0.66
30.43**
0.24
011.24**
*p<.01
**p<.001 a Perception of Friends refers to perception of friends’ preparedness for the preparedness model
and to perception of friends’ risk awareness for the risk awareness model. b Self-report refers to self-reported perceptions of emergency managers personal preparedness
and risk awareness.
The multiple regression data for perceptions of citizen preparedness support the
continued plausibility of the Availability Hypothesis. The F-Value (df = 30.43) indicates that the
overall model is significant (p<.000) and the R2 (.66) suggests 66 percent of the variation in
emergency managers’ perceptions of citizen preparedness is explained. Regression data also
show that the independent variables of county-level percent retired and perceptions of friends
and family are significant (see Table 11). The independent variable, county-level percent
female, is no longer significant.
Two of these results are surprising and one is consistent with the hypothesized effects.
First, county employment (i.e., county-level percent retired) was significant, but the sign for this
factor’s beta (β = .22) is opposite from what research suggests it should be. As noted earlier, the
FEMA preparedness surveys (2007, 2009, 2011) suggest that retired persons are the least
49
prepared among categories of employment status, so the sign of their category should be
negatively, not positively, related to perceptions of county-wide citizen preparedness. The
significant beta shows that emergency managers are sensitive to the size of this employment
category in their counties but draw conclusions about the size of this category and its impact on
county-wide preparedness that are opposite of what research suggests is true. The second
surprise is the absence of a significant beta for emergency managers’ self-reported preparedness.
The False Consensus Hypothesis is not supported for perceptions of citizen preparedness.
In contrast, the results clearly support the Availability Hypothesis. The beta for
perceptions of friends’ preparedness is significant and large. This is an important factor in
emergency managers’ perceptions of county preparedness as predicted by the Availability
Hypothesis.
Multiple regression data for perceived citizen risk awareness also supports the
Availability Hypothesis. The model examined the independent variables of perceptions of
friend’s risk awareness and self-reported risk awareness. The F-value (df = 11.24) indicates that
the model is significant (p < .001) and the R2 suggests that 24% of the overall variance in
emergency managers’ perceptions of citizen preparedness is explained. Data also shows that
perceptions of friends’ risk awareness is significant while self-reported risk awareness is no
longer significant (see Table 11). Thus, the continued significance of perceptions of friend’s risk
awareness related to citizen risk awareness supports the viability of the Availability Hypothesis.
Similar to the regression data for variables related to perceptions of citizen preparedness, the data
show large differences in the beta values for the independent variables related to citizen risk
awareness: perceptions of friends risk awareness (β = .53) and self-reported risk awareness (β = -
.03). The large difference in beta values suggests that the independent variable, perceptions of
50
friends risk awareness, has a substantial impact on the dependent variable compared to self-
reported risk awareness.
Thus, the multiple regression analyses for both perceptions of citizen preparedness and
perceptions of citizen risk awareness support the Availability Hypothesis, but not the False
Consensus Hypothesis. In both regression runs, the independent variables for emergency
managers’ self-reported preparedness and risk awareness were shown as not significant. There is
little evidence that emergency managers are using either their own preparedness level or their
own risk awareness as a basis for estimating the preparedness level or risk awareness of citizens
in their jurisdiction.
Finally, comparing the regression models for preparedness and risk awareness estimates
reveal interesting similarities and differences. Both models are significant and much of the
variability in emergency manager’s perceptions for both dependent variables can be explained.
However, far more variability can be explained for perceptions of citizen preparedness (i.e., 66%
of the variance in perceived jurisdictional preparedness is explained by its model while only 24%
of variance in perceived jurisdictional risk awareness is explained by the model). There is much
left to be done beyond verifying the relevance of the availability heuristic in identifying strong
predictors of emergency managers’ perceptions of their county’s risk awareness, especially since
none of the factors examined as part of the earlier discussed exploratory research questions
proved to be a significant predictor.
51
CHAPTER FIVE: DISCUSSION
Research in social psychology suggests that human perceptions of social reality are often
incorrect. A particularly promising approach to understanding this accuracy gap is our use of
cognitive heuristics such as the availability heuristic and false consensus effect. This study
examined whether these cognitive heuristics impact how county emergency managers perceive
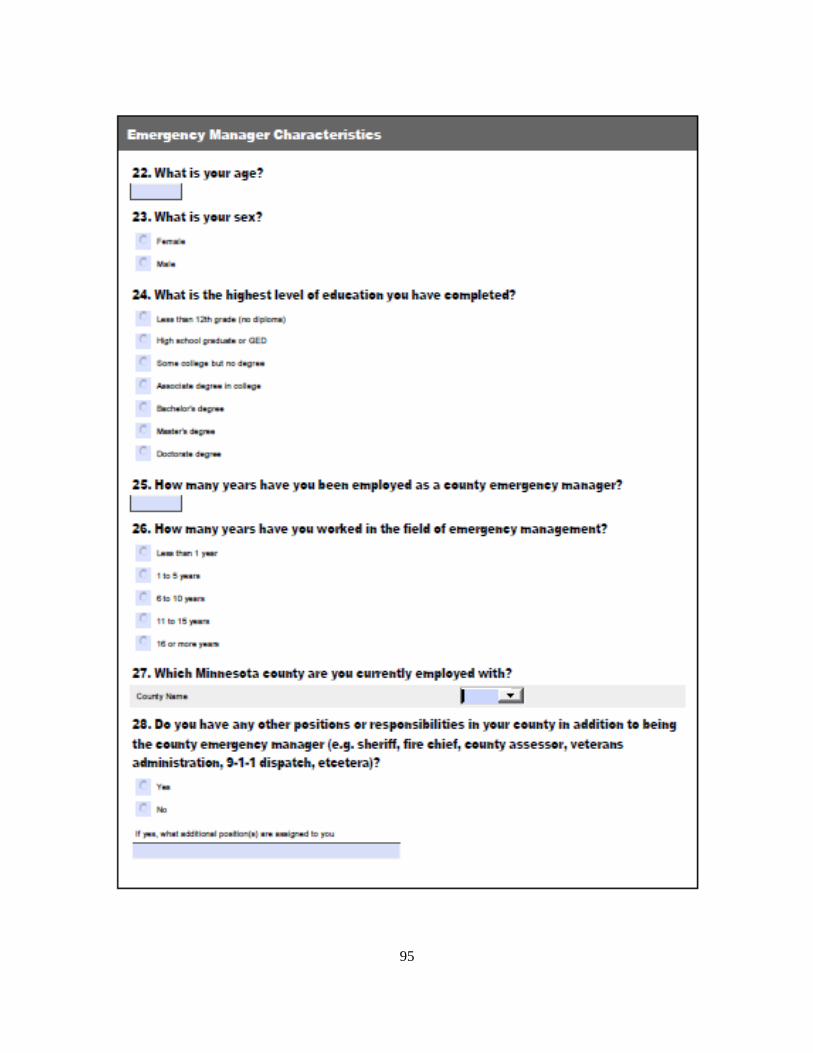
citizen risk awareness and citizen preparedness. The research sample for this study was county
emergency managers in the state of Minnesota. The research addressed the following five
questions: 1) Do demographic characteristics of emergency managers’ predict their perceptions
of their county’s preparedness and/or risk awareness; 2) Do emergency management-related
experiences of emergency managers’ predict their perceptions of their county’s preparedness
and/or awareness; 3) Do the structural characteristics of the emergency manager’s county office
predict perceptions of county preparedness and/or risk awareness; 4) Does the office-related
activity level of emergency managers predict their perceptions of their county’s preparedness
and/or risk awareness; and 5) Do the preparedness-related demographic characteristics of the
counties predict emergency managers’ perceptions of their county’s preparedness and/or risk
awareness. The data analysis revealed that emergency manager’s demographic characteristics do
not predict their perceptions of county preparedness or risk awareness. Similarly, neither general
experience in emergency management, specific experience as an emergency manager in a given
county, experience at some point with a presidentially declared disaster, structural characteristics
of emergency managers’ county office, nor office-related activity levels predict perceptions of
citizen preparedness or risk awareness. Thus, none of the emergency manager’s background
characteristics, office structure characteristics, or emergency management-related activity levels
play a role in perceptions of citizens’ preparedness or risk awareness.
52
Finally, shifting the focus from the emergency manager to citizen characteristics, still
only two significant correlations emerged. County-level gender (percent female citizens) and
employment (percent retired citizens) were significantly correlated to perceptions of citizen
preparedness but not risk awareness. In sum, the exploratory research questions in this study
were generally answered in the negative.
Two hypotheses were tested in this study. Both dealt with how emergency managers
were expected to formulate perceptions of their jurisdictions in the face of uncertainty or lack of
information to confirm their perceptions. The hypotheses are the False Consensus Hypothesis
and the Availability Hypothesis. The False Consensus Hypothesis predicts that emergency
managers’ self-reports of their own risk awareness level and preparedness level will correlate
positively with emergency managers’ perceptions of their county’s risk awareness level and
preparedness level, respectively. The Availability Hypothesis predicts that emergency
managers’ perceptions of their friends and family’s risk awareness level and preparedness level
will correlate positively with emergency managers’ perceptions of their county’s risk awareness
and preparedness level, respectively. The multiple regression analysis shows that the Availability
Hypothesis is supported and the False Consensus Hypothesis is not. The analysis revealed
exceptionally high impacts of perceptions of friends and family preparedness and risk awareness
levels on perceptions of citizen preparedness and risk awareness. The models for citizen
preparedness and citizen risk awareness were significant with substantial R2 values (66%, citizen
preparedness; 24%, citizen risk awareness). Thus, the Availability Hypothesis is supported
across two perceptual phenomena, preparedness and risk awareness, with perceptions of ones’
friends’ and family’s behavior as the most important predictor of both perceptual phenomena.
53
Availability Heuristic
Because there is no prior research exploring cognitive heuristics utilized by emergency
managers when forming perceptions of citizen preparedness or risk awareness, it was prudent to
start this exploration with a very commonly used heuristic, the availability heuristic. As stated
by Tversky and Kahneman (1973) “a person is said to employ the availability heuristic
whenever he estimates frequency or probability by the ease with which instances or associations
could be brought to mind” (pg. 208). In other words, individuals base their own perceptions of
others behavior, its frequency or probability, on their ability to recall instances when the
behavior was previously seen, for example, in their own social circle. These perceptions would
then be used to describe the behaviors of an unknown group. Previous research conducted by
Folkes (1988), on how consumers perceive risks of product failure states that “consumers may
estimate product failure by determining how easy it is to recall such incidents. When retrieval
seems easy, the event will be judged probable; when retrieval seems difficult, the event will be
judged improbable” (pg. 13). The present research worked to see if the same cognitive bias
could be applied to the way emergency managers view citizen preparedness and risk awareness
in their jurisdictions. To make that determination it was necessary to see if emergency managers
were basing their perceptions of citizen preparedness, an outside group where the actual level of
preparedness is likely to be an undetermined quantity, on their perceptions of the behaviors of
emergency managers’ acquaintances, an in-group where behaviors are likely to be much easier to
recall.
It was predicted that the results of the study would indeed indicate that emergency
managers are basing their perceptions of citizen preparedness and risk awareness on the
behaviors of their acquaintances (friends and family) because the behaviors of acquaintances
54
would be much easier to recall than those of the general public. The results suggest that the
availability heuristic plays a significant role in the way emergency managers form their
perceptions of both citizen preparedness and risk awareness.
The support for the availability hypothesis in this study sends a warning message to
professionals who are placed in the role of making judgments about the frequency or likelihood
of an event or behavior in uncertain situations. Such judgments are not automatically incorrect.
It may be that the level of preparedness, in the case of emergency management, is the same for
citizens as for the emergency manager’s acquaintances. However, the concern is the possibility
that the source of the data being used to make such a judgment (i.e., behaviors of friends and
acquaintances rather than the general public) is either unrecognized by the professional as the
source of his or her perceptions and possibly incorrect as a prediction of how prepared the
general public is.
False Consensus Effect
Another heuristic that was examined in this study that was speculated to play a role in the
formation of an emergency manager’s perception of citizen preparedness and risk awareness was
the false consensus effect. In a broad sense, the false consensus effect is described by Ross,
Green, and House (1977) as the tendency for individuals to perceive “their own behavioral
choices and judgments are relatively common and appropriate to existing circumstances while
viewing alternative responses as uncommon, deviant, or inappropriate” (p. 280). In other words,
individuals tend to perceive the behaviors of others to be similar to their own.
It was predicted that the results of the study would support the False Consensus
Hypothesis. The expectation was that there would be correlation between emergency managers’
self-reports of preparedness or risk awareness and the managers’ perceptions of their citizens’
55
preparedness or risk awareness, respectively. However this Hypothesis also implies a correlation
between emergency managers’ self-perceptions and managers’ perceptions of their friends and
acquaintances. In fact, Dawes’ research (1989) would lead us to expect an even stronger
correlation for the latter as opposed to the former relationship. The results offered no support for
these expectations. Thus, the results of the data suggest that the false consensus effect does not
play a significant role in the way emergency managers form their perceptions of both citizen
preparedness and risk awareness.
It is interesting to speculate that there may be an integrative explanation for why the
Availability Hypothesis worked and the False Consensus Hypothesis did not. The integrative
notion is to suggest that the emergency manager’s fundamental viewpoint of his or her county’s
residents is as an outsider or a uniquely trained individual that should be expected to see the
world differently than others do. Support for the Availability Hypothesis makes sense from this
perspective because the support shows that the emergency manager sees both their
friends/acquaintances and the rest of the county’s residents as similar to each other, that is, both
groups are “outsider” to the emergency manager’s world so that information on one group
(acquaintances) generalizes in the emergency manager’s mind to the other groups. Similarly, the
lack of support for the False Consensus Hypothesis is consistent with the emergency manager
seeing himself or herself as an outsider and dissimilar to all the others (i.e., both friends and
family, and citizens). The emergency manager does not see his or her own experience as
applicable to “outsiders” whether friends, acquaintances or the general citizenry. It may be that
the False Consensus Hypothesis is only predictive when the person perceives others and
themselves as part of the same in-group. This interpretation is consistent with Dawes’ (1989)
speculation about the false consensus effect. Dawes (1989) argued that the false consensus effect
56
is most likely to work if there is “a positive correlation across subjects (within items) between
their own endorsements of a behavior or attitude item and their estimates of the endorsement
frequency in a specified group of which they are a member” (italics added) (pg. 1). Thus,
according to Dawes (1989) the false consensus effect would be unlikely to apply to a situation
where the perceiver is an expert and both friends and family and citizens are outgroup, non-
experts. In contrast, the emergency manager may feel comfortable (at least subconsciously) in
using his/her own available group (i.e. friends and family) to predict behavior of another less
available outside group, the citizens, thus supporting the prediction of the Availability
Hypothesis.
Further Research
This study opens the door for much additional research on the role of cognitive heuristics
in the many important decisions an emergency manager makes. For example, the optimism bias
(DeJoy, 1989; McKenna, 1993;Weinsten, 1908) could be causing an over estimation of
preparedness or risk awareness based on emergency managers’ desire to see well prepared
citizens, especially after working with citizen groups on preparedness. A related bias, the