Page 1
Managing Pure and Statistical Equity Arbitrage Opportunities
Within The South African Environment
Submitted in accordance with the requirements
for the degree of:
Doctor of Business Leadership
At
University of South Africa
School of Business Leadership
Prepared by Peter John Cronje
Promoter
Prof J.J.L. Cronje
November 2004
Page 2
MANAGING PURE AND STATISTICAL EQUITY ARBITRAGE OPPORTUNITIES WITHIN THE SOUTH AFRICAN ENVIRONMENT- CRONJE, P (2004)
ii
Declaration
Student number 7427115
I declare that Managing Pure and Statistical Equity Arbitrage Opportunities
Within The South African Environment is my own work and that all sources that I
have used or quoted have been indicated and acknowledged by means of complete
references
Peter John Cronje Date
Page 3
MANAGING PURE AND STATISTICAL EQUITY ARBITRAGE OPPORTUNITIES WITHIN THE SOUTH AFRICAN ENVIRONMENT- CRONJE, P (2004)
iii
Acknowledgements
I would like to thank the following people for their contribution and support in
completing this research:
• Prof Tom Cronje my promoter, you did a sterling job in guiding me through this
process, thank you for your assistance, patience and time.
• The JSE and SAFEX for the trade and SENS data that they provided.
• My parents for their support.
• The DBL colloquium team for their valued input in terms of the research
directions that should receive focus.
• To all the respondents who completed the research questionnaire, thank you for
the time you spent completing the questionnaire.
• To Sonja Prinsloo, no more late nights and weekends spent behind books, we
can get a life now.
Page 4
MANAGING PURE AND STATISTICAL EQUITY ARBITRAGE OPPORTUNITIES WITHIN THE SOUTH AFRICAN ENVIRONMENT- CRONJE, P (2004)
iv
Summary
The analysis undertaken, firstly aims to identify the extent to which equities, their
indexes and their derivatives priced in accordance with their fair value. Secondly,
presuming that the traded values of the instruments do not in all instances equate to
the fair value, the research aims to develop an effective means to identify and
manage profitable opportunities arising from the mispricing.
General concepts relating to profitability, trade identification, risk and continuous
improvement of the processes are addressed. This includes recommendations on the
management of the risks through a structured reporting process.
The research looks at arbitrage trading in the South African market from the
perspective of an empirical review into the market’s participation in equity and equity
derivative arbitrage. In addition to this empirical analysis, a time series analysis into
various arbitrage strategies is conducted with the view to determining their relative
profitability.
The first component of the empirical research focuses on the arbitrage trading
strategies adopted by a sample of 80 institutions. Where the institutions trade
arbitrage strategies, the research undertook to establish what methods are used to
identify, trade and manage the index arbitrage, single stock futures arbitrage, risk
arbitrage, statistical arbitrage and volatility arbitrage trading opportunities that present
themselves within the South African Market.
Information gathered did not only focus on the actual trading strategies but also
determined the relative cost structures, profitability and risk management processes
that are employed to support these trading initiatives.
The time series analysis focused on index futures, single stock futures, risk, dual
listed and statistical arbitrage methods, and reflects the results before and after
transaction costs. These arbitrage strategies were applied to the ALSI Top 40 index
or its associated shares and generally spanned a period of about four years.
Finally the research presents an arbitrage business model that is aimed at providing
a blue print for arbitrage trading which covers:
Page 5
MANAGING PURE AND STATISTICAL EQUITY ARBITRAGE OPPORTUNITIES WITHIN THE SOUTH AFRICAN ENVIRONMENT- CRONJE, P (2004)
v
• new arbitrage strategy implementation,
• market risk,
• execution,
• profit,
• traders,
• cost,
Finally, the research provides a multiple regression method for application in
identifying further arbitrage trading opportunities within the South African
environment.
Page 6
MANAGING PURE AND STATISTICAL EQUITY ARBITRAGE OPPORTUNITIES WITHIN THE SOUTH AFRICAN ENVIRONMENT- CRONJE, P (2004)
vi
TABLE OF CONTENTS
CHAPTER 1...................................................................................................................1
1. INTRODUCTION......................................................................................................1
1.1 Background..................................................................................................1
1.2 Problem Statement......................................................................................3
1.3 Purpose Of The Research...........................................................................6
1.4 Methodology ................................................................................................7
1.5 Structure of the Research ...........................................................................8
CHAPTER 2.................................................................................................................10
2. AN OVERVIEW OF EQUITY ARBITRAGE MANAGEMENT TECHNIQUES AND
PROCESSES...............................................................................................................10
2.1 Introduction ................................................................................................10
2.2 Categories of Arbitrage..............................................................................112.2.1 Pure Arbitrage Defined .............................................................................................................12
2.2.2 Types of Pure Arbitrage............................................................................................................12
2.2.2.1 Single Stock and Index Futures Arbitrage.....................................13
2.2.2.2 Covered Arbitrage On Dual Listed Securities................................162.2.3 Statistical Arbitrage Defined.....................................................................................................17
2.2.4 Types of Statistical Arbitrage...................................................................................................17
2.2.4.1 Statistical Arbitrage In The Underlying Shares And Their
Derivatives.....................................................................................................18
2.2.4.2 Option Arbitrage.............................................................................21
2.2.4.3 Risk Arbitrage.................................................................................23
2.3 Occurrences Of Equity Arbitrage Types And Their Duration....................29
2.4 Instruments Used In The Exploitation Of Equity Arbitrage Opportunities 302.4.1 Underlying Securities ................................................................................................................30
2.4.2 Futures and Forwards ...............................................................................................................38
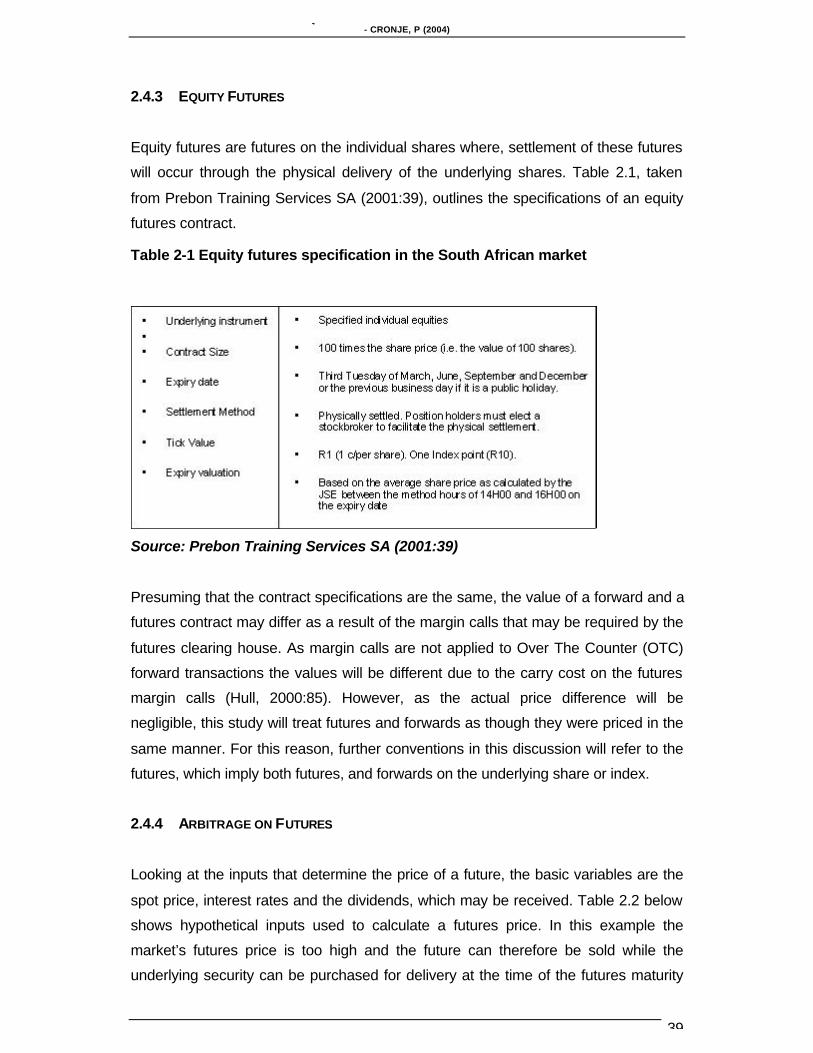
2.4.3 Equity Futures ............................................................................................................................39
2.4.4 Arbitrage on Futures ..................................................................................................................39
2.4.5 Share Futures Arbitrage ...........................................................................................................41
2.4.6 Stock Indices ..............................................................................................................................41
2.4.7 Futures Prices of Stock Indices ...............................................................................................42
2.4.8 Index Arbitrage...........................................................................................................................43
2.4.8.1 Delivery of Futures .........................................................................492.4.9 Options and Warrants ...............................................................................................................50
2.4.9.1 Effects Of Market Changes On the value of Options ....................52
Page 7
MANAGING PURE AND STATISTICAL EQUITY ARBITRAGE OPPORTUNITIES WITHIN THE SOUTH AFRICAN ENVIRONMENT- CRONJE, P (2004)
vii
2.4.9.2 Bounds of Options Prices ..............................................................52
2.4.9.3 Effect of Dividends .........................................................................54
2.5 Equity Arbitrage Trading Practices............................................................552.5.1 Processes Used To Manage Equity and Equity Derivative Arbitrage ...............................56
2.5.2 Risk Management Process ......................................................................................................56
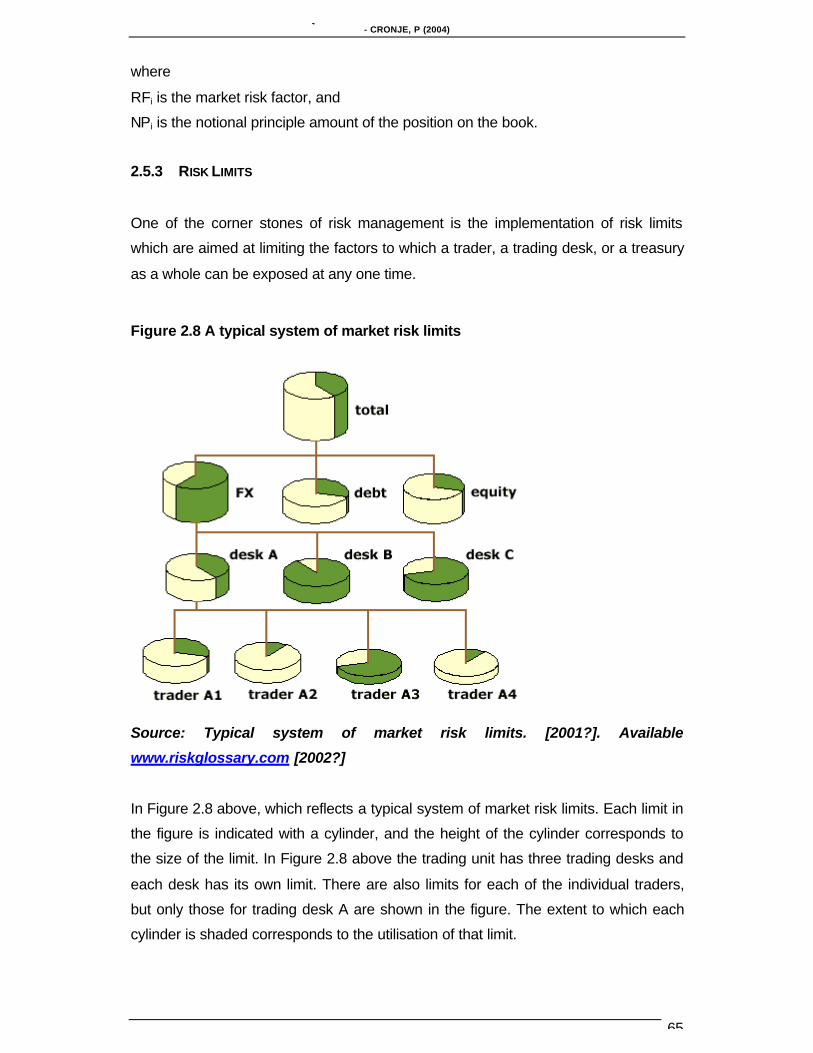
2.5.3 Risk Limits ...................................................................................................................................65
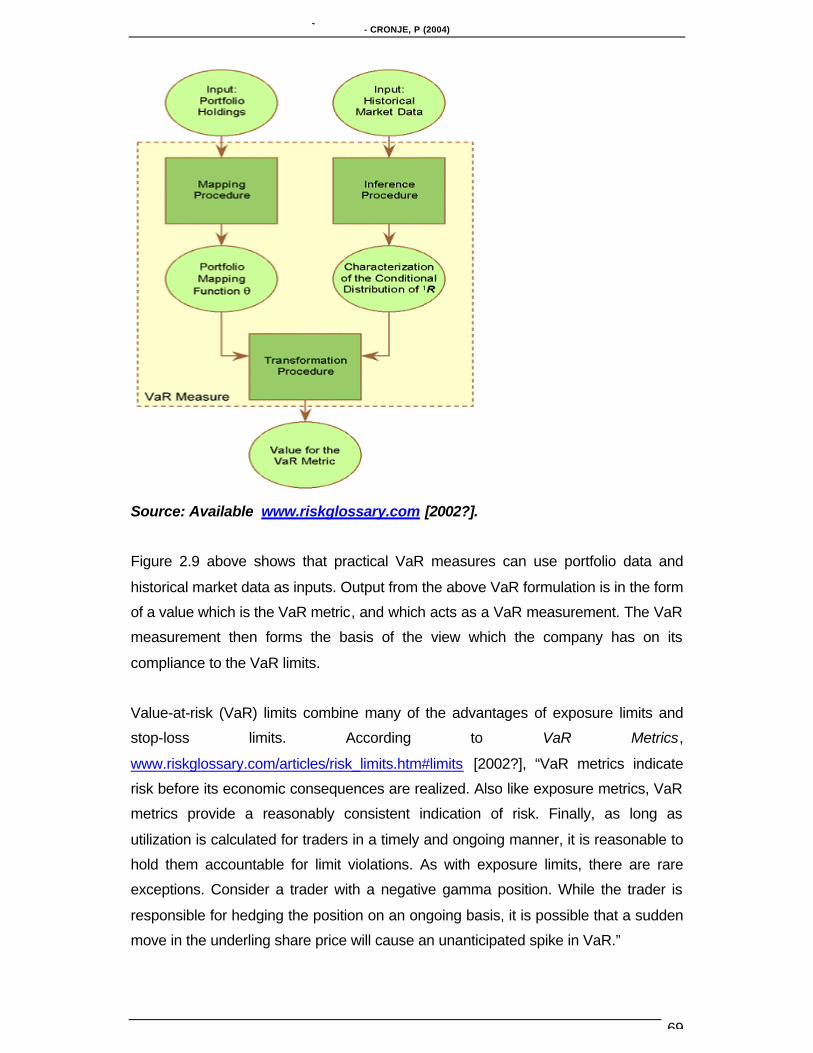
2.5.3.1 Liquidity ..........................................................................................67
2.5.3.2 Sensitivity .......................................................................................68
2.5.3.3 Value At Risk (VaR) .......................................................................682.5.4 Trading Risks ..............................................................................................................................70
2.5.4.1 Volatility (σ) ....................................................................................71
2.5.4.2 Historical Volatility ..........................................................................72
2.5.4.3 Implied Volatility .............................................................................74
2.5.4.4 Execution Risk ...............................................................................75
2.5.4.5 Greeks............................................................................................75
2.5.4.6 Delta (∆) .........................................................................................76
2.5.4.7 Gamma( Γ )....................................................................................78
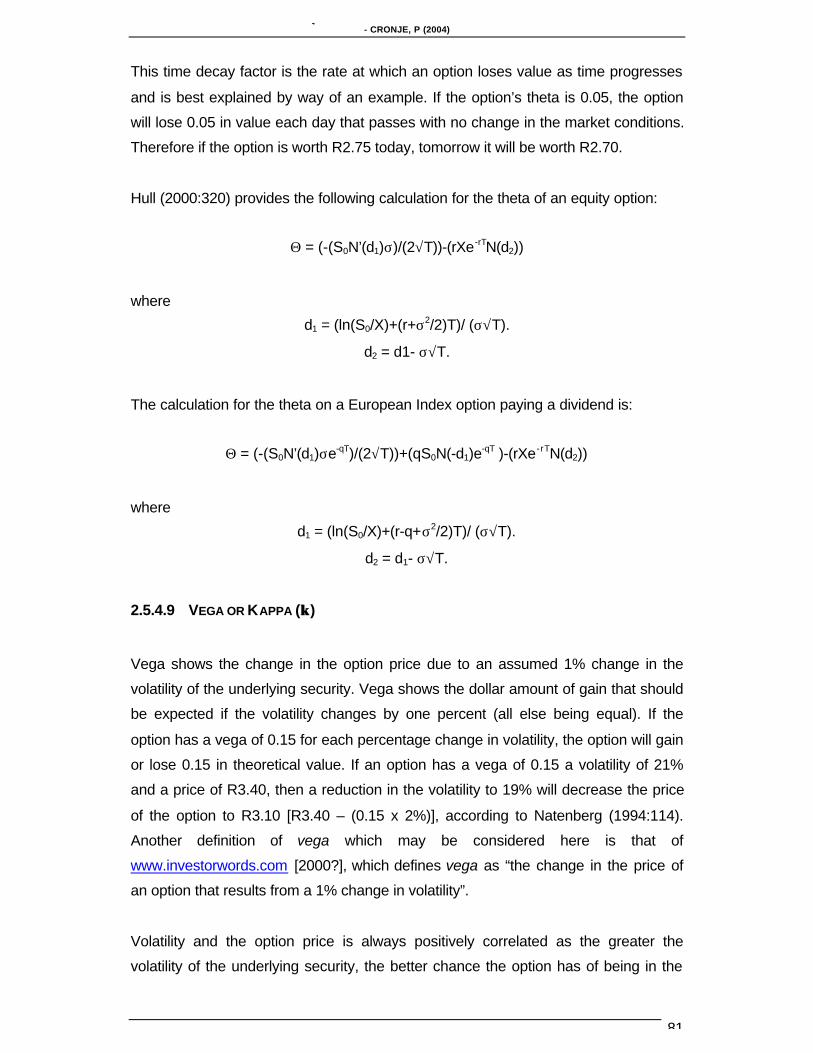
2.5.4.8 Theta (Θ) ........................................................................................80
2.5.4.9 Vega or Kappa (κ)..........................................................................81
2.5.4.10 Rho...............................................................................................82
2.5.4.11 Partial Differential Hedge.............................................................832.5.5 Dealing and delta hedging processes ....................................................................................83
2.5.5.1 The carrying costs .........................................................................86
2.5.5.2 Variation costs ...............................................................................862.5.6 Arbitrage Identification and Profitability Measurement Systems........................................88
2.5.6.1 Internal Rate of Return (IRR).........................................................88
2.5.6.2 Capital Allocation............................................................................89
2.6 Summary ...................................................................................................90
CHAPTER 3.................................................................................................................92
3. RESEARCH METHODOLOGY.................................................................................92
3.1 Introduction ................................................................................................92
3.2 Definition of the Research Areas ..............................................................92
3.3 Arbitrage Management Processes and Systems .....................................933.3.1 Sample and Target Population ................................................................................................93
3.3.2 Research Design and Data Collection Methodology............................................................96
3.3.3 Pre-testing the Questionnaire and the Validity of the Questionnaire ................................98
3.3.4 Results Of The Content Validity Testing................................................................................99
3.3.5 Analysis Of The Findings ....................................................................................................... 100
Page 8
MANAGING PURE AND STATISTICAL EQUITY ARBITRAGE OPPORTUNITIES WITHIN THE SOUTH AFRICAN ENVIRONMENT- CRONJE, P (2004)
viii
3.4 Questionnaire Content.............................................................................1003.4.1 Equity Derivative and Arbitrage Processes ........................................................................ 100
3.4.1.1 Trading Processes .......................................................................100
3.4.1.2 Identification Processes...............................................................101
3.4.1.3 Profitability Simulations ................................................................101
3.4.1.4 Trader’s Discretion.......................................................................102
3.4.1.5 Executing Trades to Ensure Arbitrage.........................................102
3.4.1.6 Stop Losses .................................................................................103
3.4.1.7 Duration of Trades .......................................................................1033.4.2 General Risk Management Processes ................................................................................ 104
3.4.2.1 Processes Adopted in Measuring Risk........................................104
3.4.2.2 Limits ............................................................................................105
3.4.2.3 Delta .............................................................................................105
3.4.2.4 Gamma ........................................................................................106
3.4.2.5 Volatility........................................................................................106
3.4.2.6 Vega .............................................................................................106
3.4.2.7 Rho...............................................................................................1073.4.3 Cost Profit Measurement Processes ................................................................................... 107
3.4.3.1 Measuring Equity Trading Costs .................................................108
3.4.3.2 Measuring Profitability..................................................................108
3.5 Identification of Arbitrage Opportunities ..................................................1093.5.1 Research Design and Data Collection Methodology......................................................... 110
3.5.1.1 JSE Securities Exchange (SA) ....................................................111
3.5.1.2 South African Futures Exchange (Safex) ....................................112
3.5.1.3 Dividend Yields and Dividends ....................................................112
3.5.1.4 Risk Free Rates ...........................................................................113
3.5.1.5 Stop Loss Strategy.......................................................................113
3.5.1.6 Number of Trades and Volume Traded.......................................114
3.5.1.7 Transaction Costs ........................................................................115
3.5.1.8 Profitability....................................................................................116
3.5.1.9 Index and Single Stock Futures...................................................116
3.5.1.10 Risk or Merger Arbitrage............................................................118
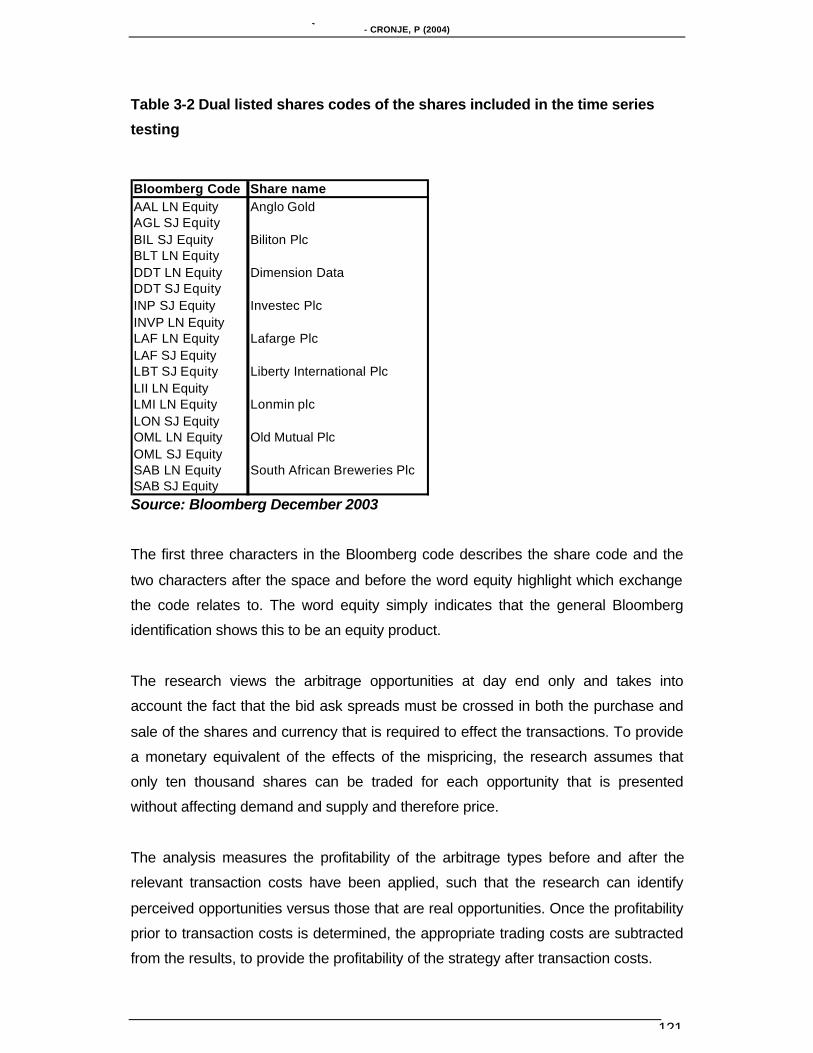
3.5.1.11 Dual Listed Arbitrage..................................................................120
3.5.1.12 Statistical Arbitrage ....................................................................122
3.6 Summary of Research Methodology .......................................................124
CHAPTER 4...............................................................................................................126
4. RESEARCH FINDINGS........................................................................................126
Page 9
MANAGING PURE AND STATISTICAL EQUITY ARBITRAGE OPPORTUNITIES WITHIN THE SOUTH AFRICAN ENVIRONMENT- CRONJE, P (2004)
ix
4.1 Introduction ..............................................................................................126
4.2 Responses by the sample .......................................................................126
4.3 Arbitrage Business Structures.................................................................1274.3.1 Business Structures and Strategies .................................................................................... 128
4.3.2 Equity Arbitrage Structures and Trading............................................................................. 129
4.4 Trading Processes...................................................................................1294.4.1 Index and SSF Arbitrage ....................................................................................................... 129
4.4.1.1 Identification Processes...............................................................130
4.4.1.2 Trader’s discretion .......................................................................130
4.4.1.3 Hedging and Stop Losses ...........................................................131
4.4.1.4 Number of Trades and their Duration ..........................................131
4.4.1.5 Profitability and Risks...................................................................1344.4.2 Risk and Merger Arbitrage .................................................................................................... 135
4.4.2.1 Identification Processes...............................................................136
4.4.2.2 Trader’s discretion .......................................................................136
4.4.2.3 Hedging and Stop Losses ...........................................................137
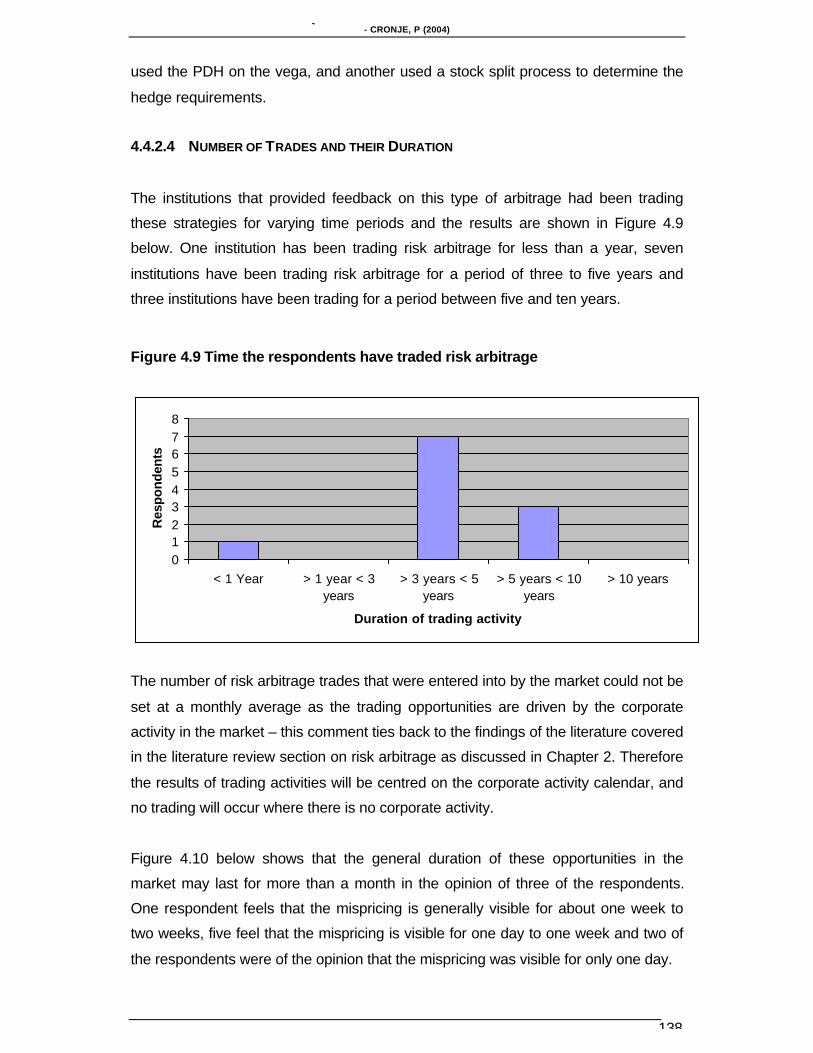
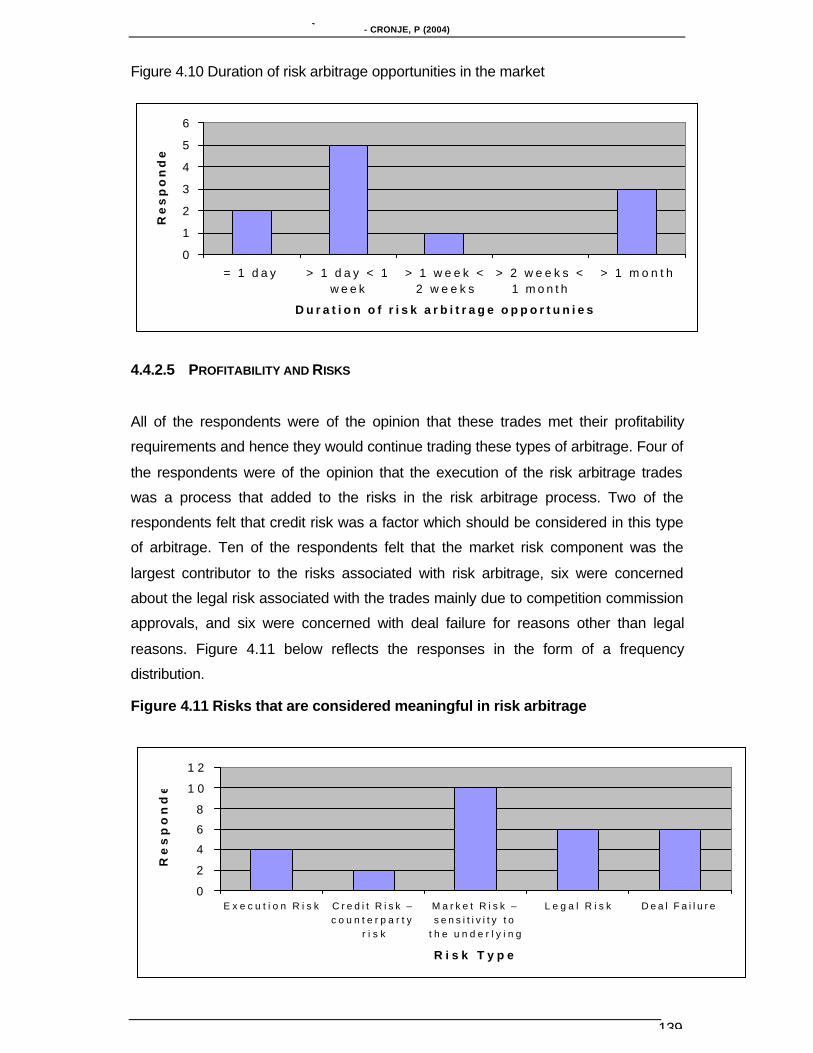
4.4.2.4 Number of Trades and their Duration ..........................................138
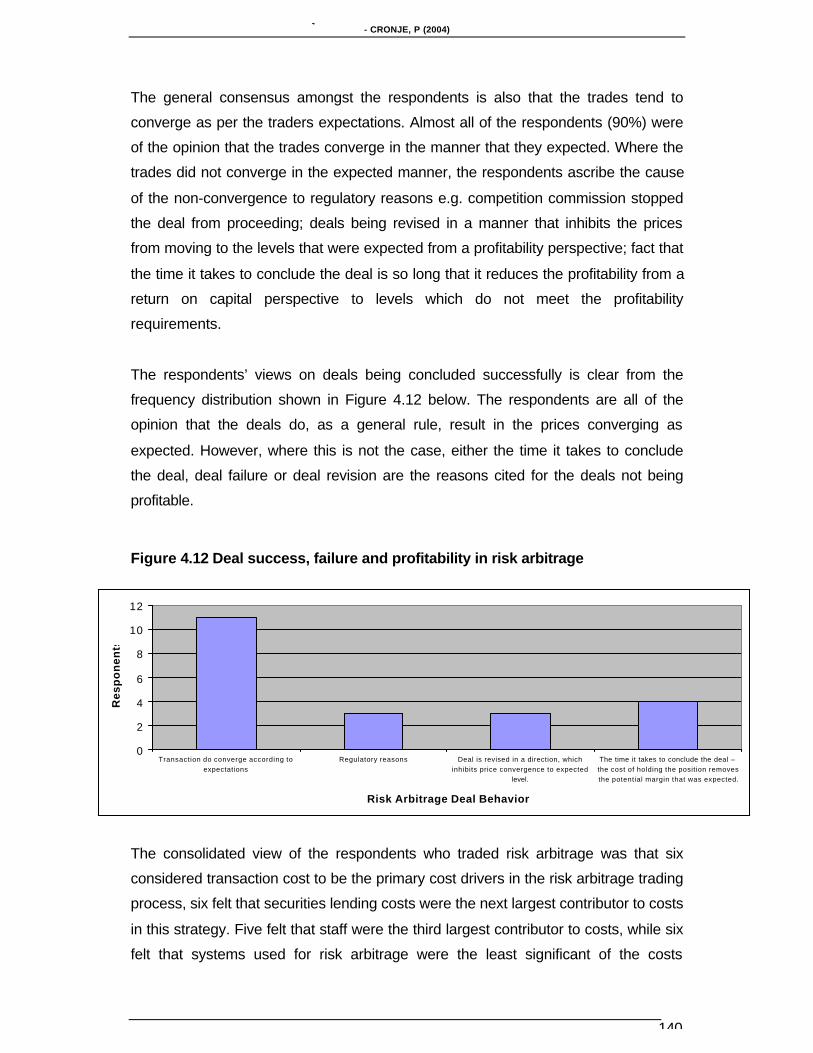
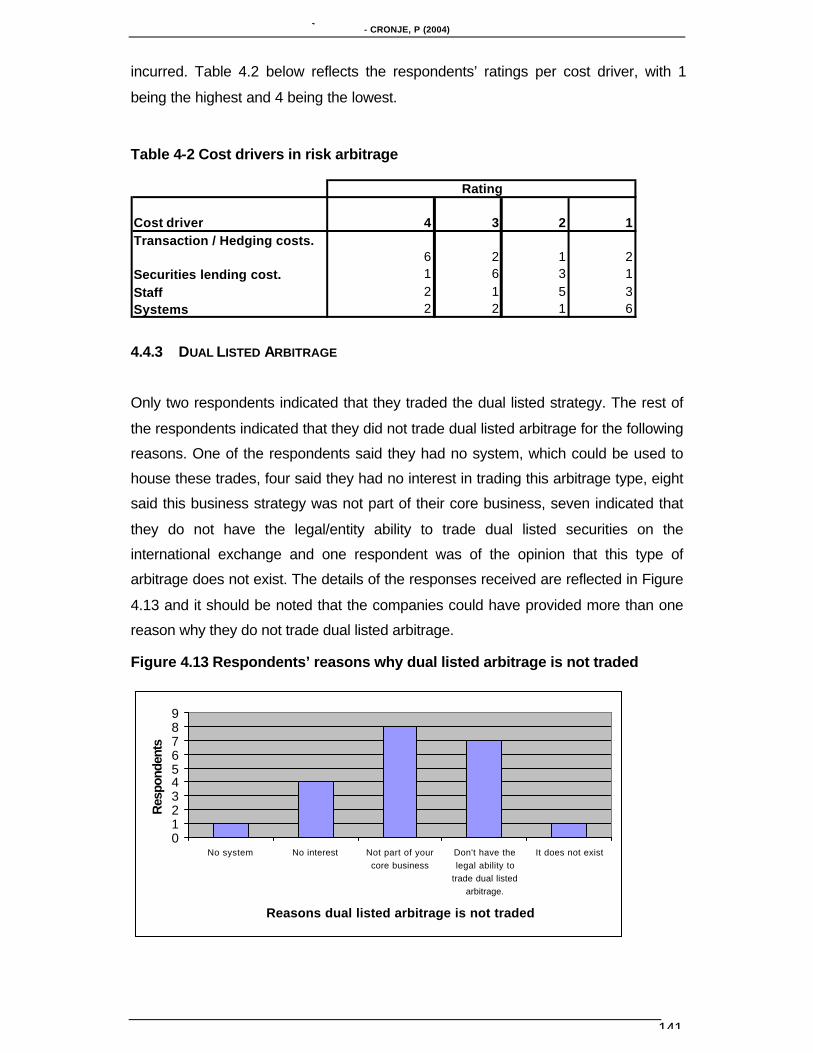
4.4.2.5 Profitability and Risks...................................................................1394.4.3 Dual Listed Arbitrage.............................................................................................................. 141
4.4.3.1 Identification Processes...............................................................142
4.4.3.2 Trader’s discretion .......................................................................142
4.4.3.3 Hedging and Stop Losses ...........................................................142
4.4.3.4 Number of Trades And The Trading Period ................................143
4.4.3.5 Profitability and Risks...................................................................1434.4.4 Statistical Arbitrage................................................................................................................. 143
4.4.4.1 Identification Processes...............................................................144
4.4.4.2 Trader’s discretion .......................................................................145
4.4.4.3 Hedging and Stop Losses ...........................................................145
4.4.4.4 Number of Trades and their Duration ..........................................146
4.4.4.5 Profitability and Risks...................................................................1484.4.5 Volatility Arbitrage................................................................................................................... 149
4.4.5.1 Identification Processes...............................................................150
4.4.5.2 Trader’s discretion .......................................................................150
4.4.5.3 Hedging and Stop Losses ...........................................................151
4.4.5.4 Number of Trades and their Duration ..........................................152
4.4.5.5 Profitability and Risks...................................................................1534.4.6 Arbitrage Risk Processes ...................................................................................................... 154
4.4.6.1 Trading costs ...............................................................................154
Page 10
MANAGING PURE AND STATISTICAL EQUITY ARBITRAGE OPPORTUNITIES WITHIN THE SOUTH AFRICAN ENVIRONMENT- CRONJE, P (2004)
x
4.4.6.2 Processes Adopted in Measuring Risk........................................155
4.4.6.3 Limits and sensitivity ....................................................................155
4.4.6.4 Partial Differential Hedge (PDH) ..................................................156
4.4.6.5 Greeks..........................................................................................156
4.4.6.6 Profit Control Processes ..............................................................157
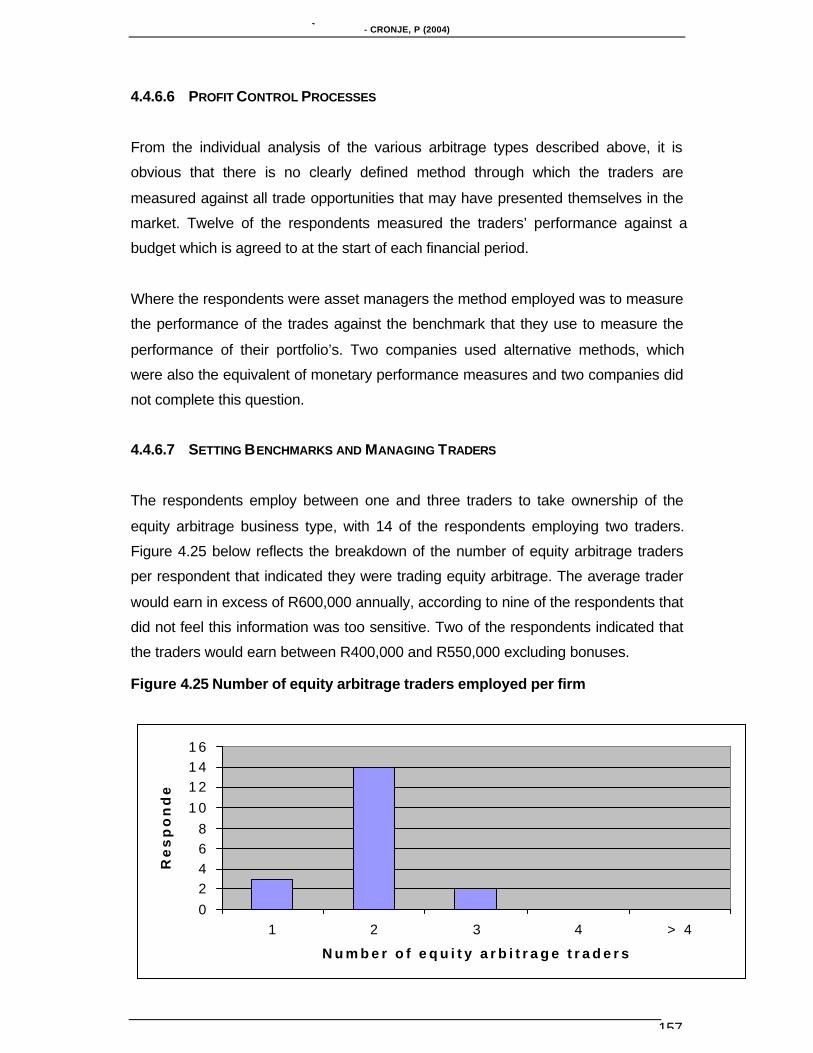
4.4.6.7 Setting Benchmarks and Managing Traders...............................157
4.4.6.8 Simulations and Monte Carlo Profit Maximising..........................158
4.4.6.9 Measuring Profitability..................................................................158
4.5 Results of Time Series Analysis ..............................................................1594.5.1 Statistical Analysis and Profitability Of Arbitrage Types................................................... 159
4.5.2 Analysis of Findings Relating to Index and Single Stock Futures .................................. 159
4.5.2.1 General.........................................................................................159
4.5.2.2 Number of Trades ........................................................................160
4.5.2.3 Volume Traded.............................................................................164
4.5.2.4 Transaction Costs ........................................................................164
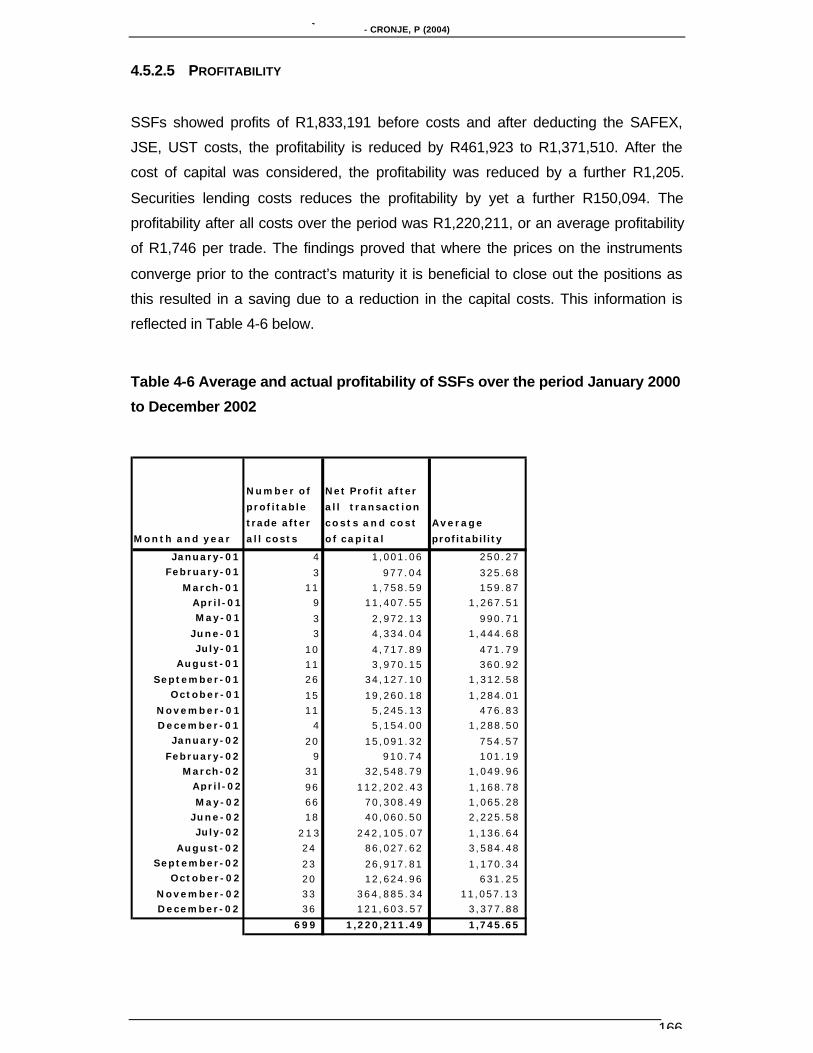
4.5.2.5 Profitability....................................................................................166
4.5.2.6 Conclusions regarding SSF’s arbitrage and index arbitrage.......1694.5.3 Analysis of Findings Relating to Risk or Merger Arbitrage............................................... 170
4.5.3.1 General Comments......................................................................170
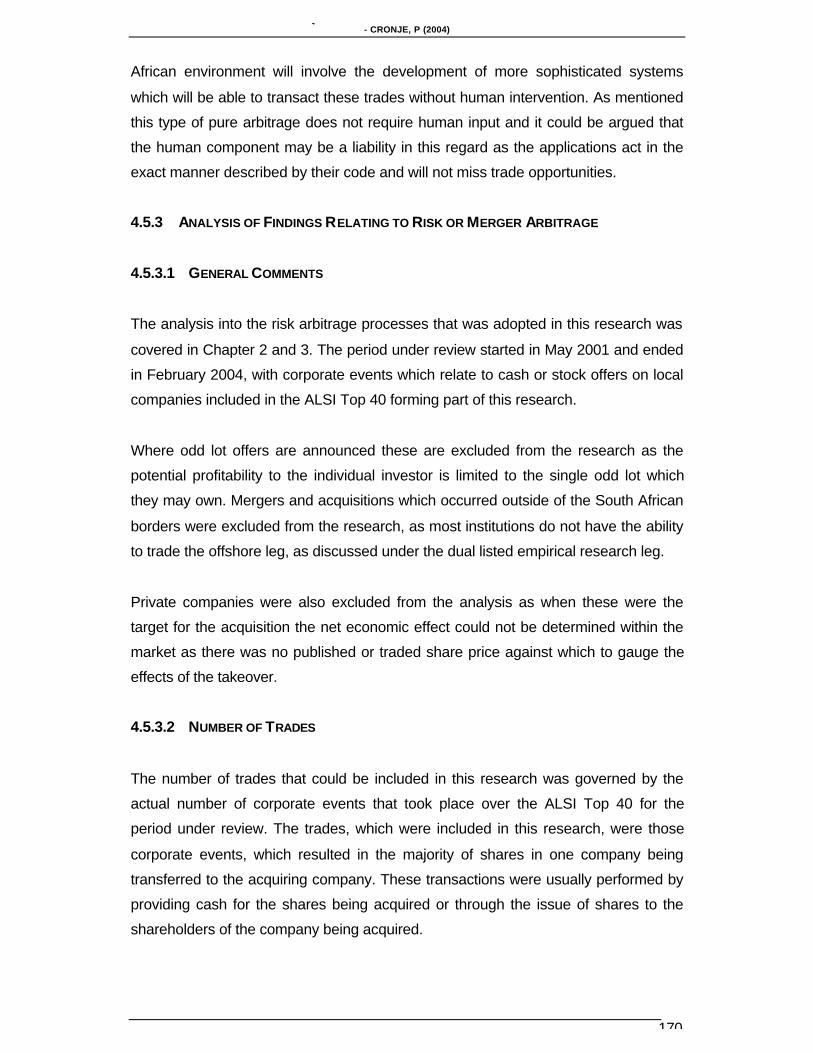
4.5.3.2 Number of Trades ........................................................................170
4.5.3.3 Volume Traded.............................................................................171
4.5.3.4 Transaction Costs ........................................................................172
4.5.3.5 Profitability....................................................................................173
4.5.3.6 Conclusion regarding Risk Arbitrage ...........................................1744.5.4 Analysis of Findings Relating to Dual Listed Arbitrage..................................................... 175
4.5.4.1 General Comments......................................................................175
4.5.4.2 Number of Trades ........................................................................175
4.5.4.3 Volume Traded.............................................................................177
4.5.4.4 Transaction Costs ........................................................................177
4.5.4.5 Profitability....................................................................................177
4.5.4.6 Conclusion regarding Dual Listed Arbitrage................................1794.5.5 Analysis of Findings Relating to Statistical Arbitrage........................................................ 179
4.5.5.1 General Comments......................................................................179
4.5.5.2 Number of Trades ........................................................................181
4.5.5.3 Volumes Traded...........................................................................184
4.5.5.4 Transaction Costs ........................................................................185
4.5.5.5 Profitability....................................................................................185
4.5.5.6 Conclusions regarding Statistical Arbitrage.................................189
Page 11
MANAGING PURE AND STATISTICAL EQUITY ARBITRAGE OPPORTUNITIES WITHIN THE SOUTH AFRICAN ENVIRONMENT- CRONJE, P (2004)
xi
CHAPTER 5...............................................................................................................191
5. A MODEL FOR THE EFFECTIVE MANAGEMENT OF ARBITRAGE TRADING................191
5.1 Introduction ..............................................................................................191
5.2 Equity Arbitrage Business Structures .....................................................1915.2.1 Creation of a System And Static Data ................................................................................. 192
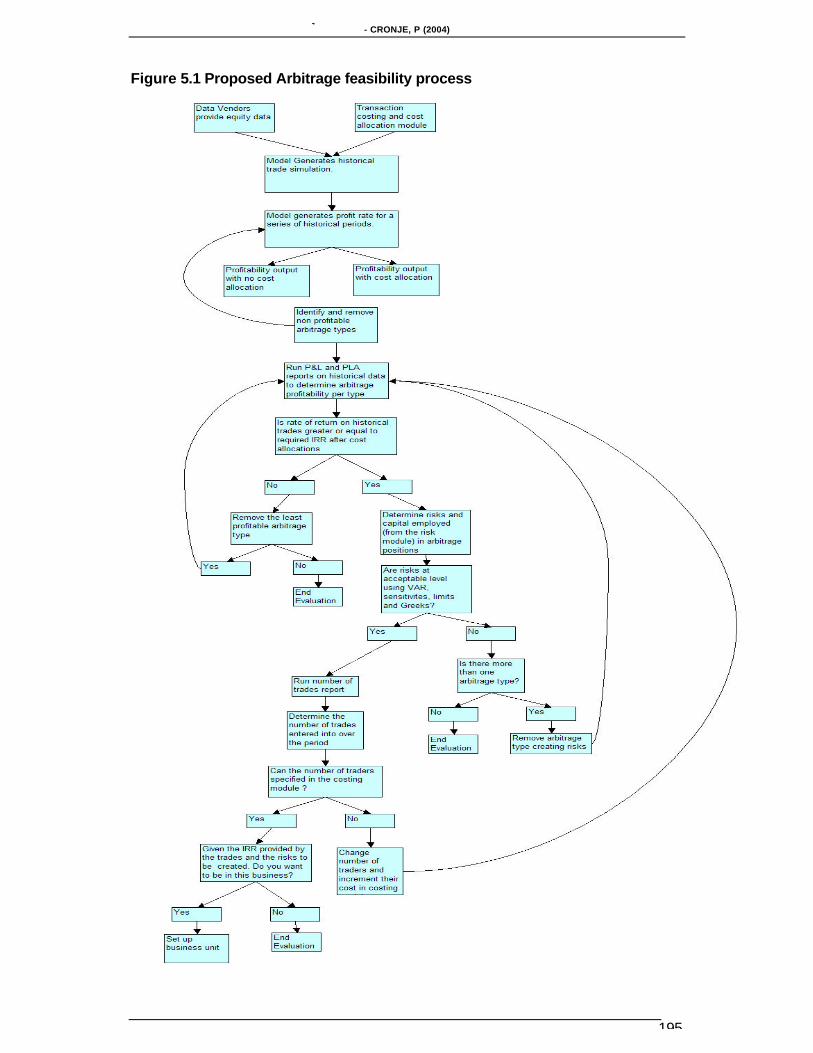
5.2.2 Arbitrage Feasibility Process ................................................................................................ 194
5.2.3 Simulations and Monte Carlo Analysis Tools ..................................................................... 196
5.2.4 Trade Identification Processes ............................................................................................. 197
5.2.5 Stop Loss Process.................................................................................................................. 200
5.2.6 Market Risk Measurement and Limits ................................................................................. 201
5.2.7 Transaction Costs................................................................................................................... 203
5.2.8 Profitability................................................................................................................................ 204
5.2.9 Performance against Real Benchmarks ............................................................................. 206
5.2.10 Conclusion regarding The Trade, Risk And Profit Processes .................................... 206
5.3 A Proposed statistical arbitrage identification Method ............................207
5.4 Arbitrage strategy and structure- the future of the business ..................211
5.5 Summary .................................................................................................212
CHAPTER 6...............................................................................................................213
6. SUMMARY, CONCLUSIONS AND RECOMMENDATIONS ........................................213
6.1 Introduction ..............................................................................................213
6.2 Summary of Findings...............................................................................2146.2.1 Findings pertaining to the research questionnaire ............................................................ 214
6.2.2 Time Series Findings ............................................................................................................. 216
6.2.2.1 Futures Arbitrage..........................................................................216
6.2.2.2 Index Arbitrage.............................................................................217
6.2.2.3 Risk Arbitrage...............................................................................218
6.2.2.4 Dual listed Arbitrage.....................................................................218
6.2.2.5 Statistical Arbitrage ......................................................................219
6.3 Conclusions .............................................................................................220
6.4 Recommendations For Further Research ..............................................222
BIBLIOGRAPHY .......................................................................................................224
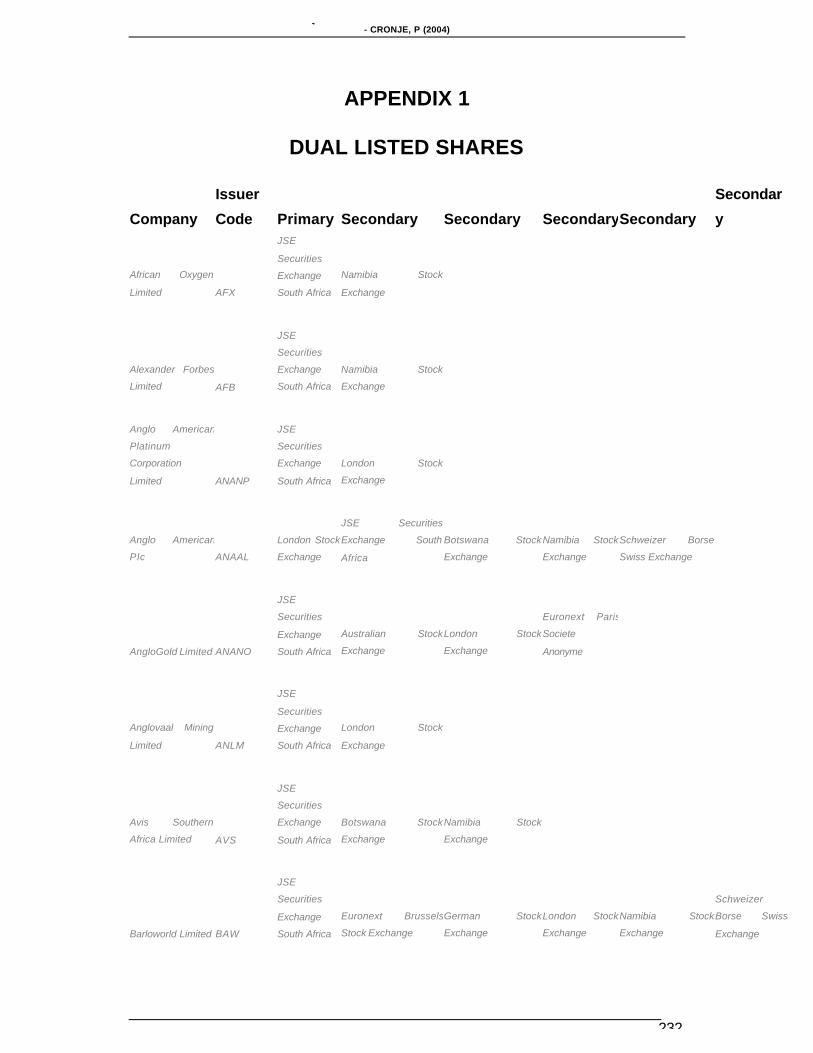
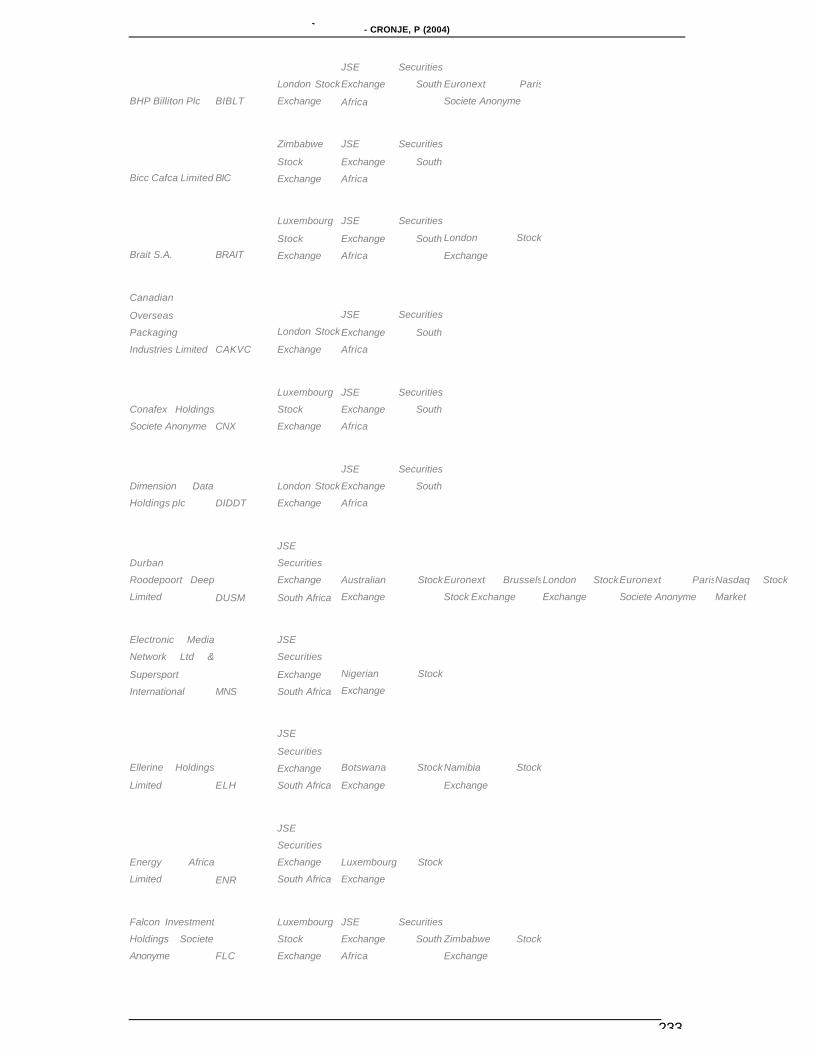
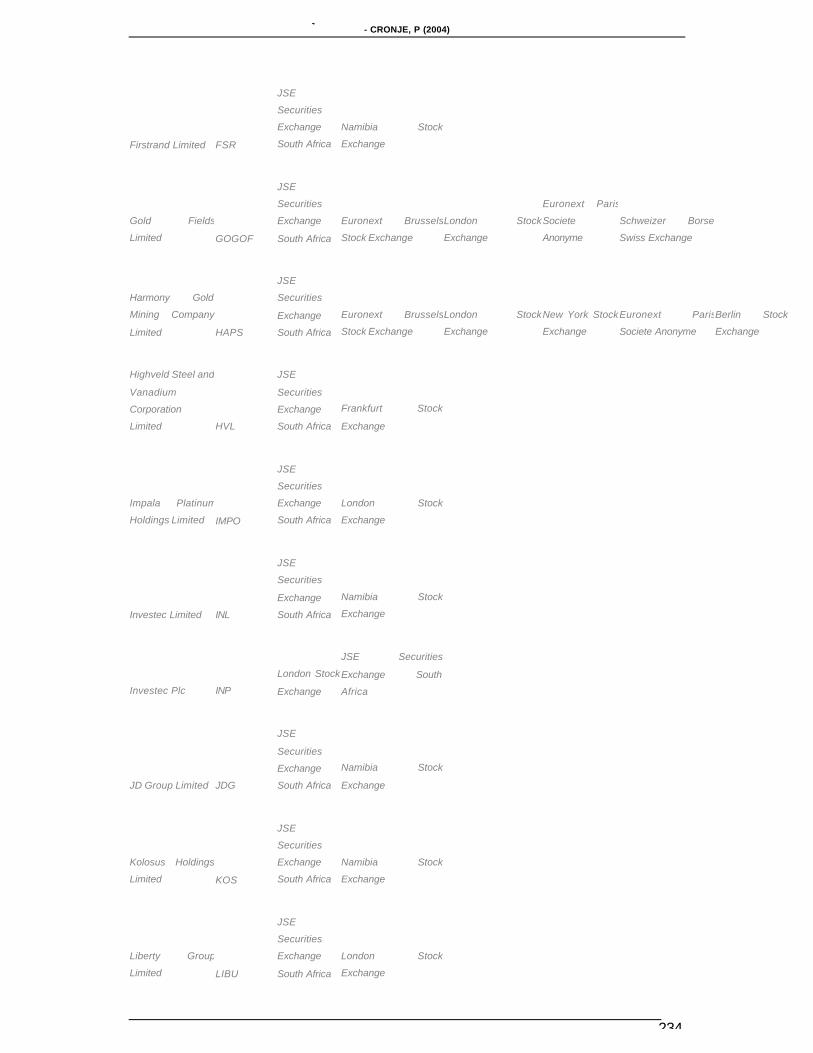
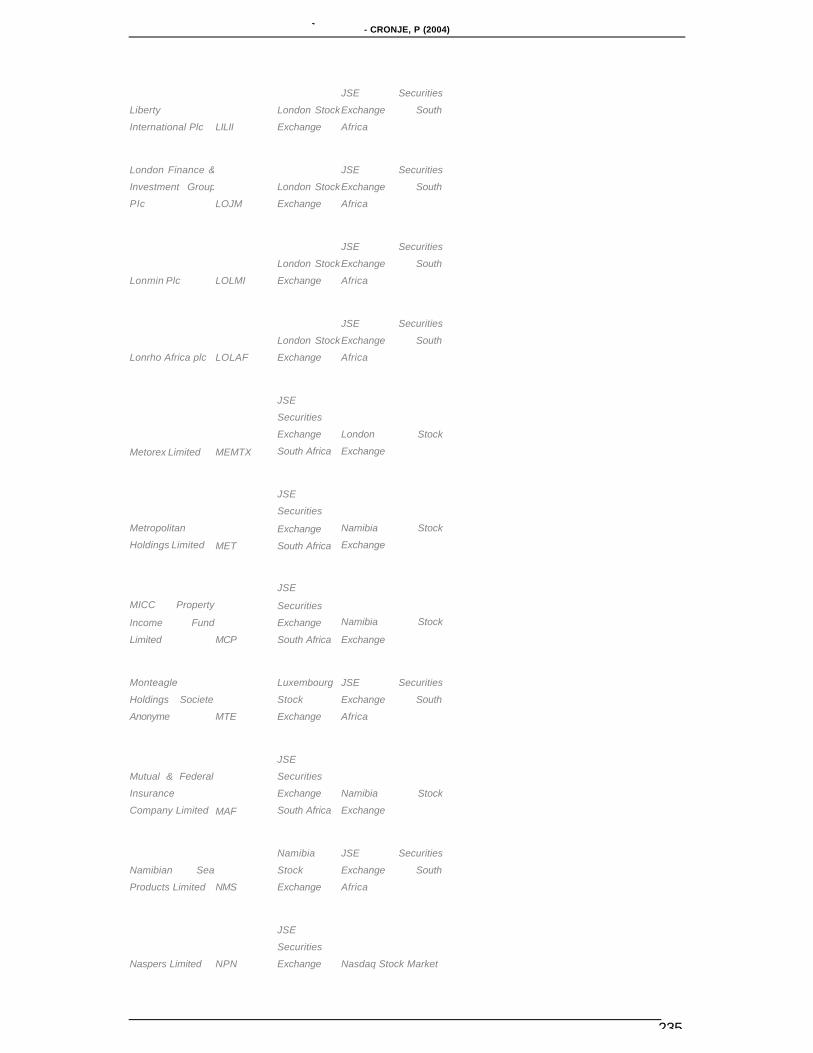
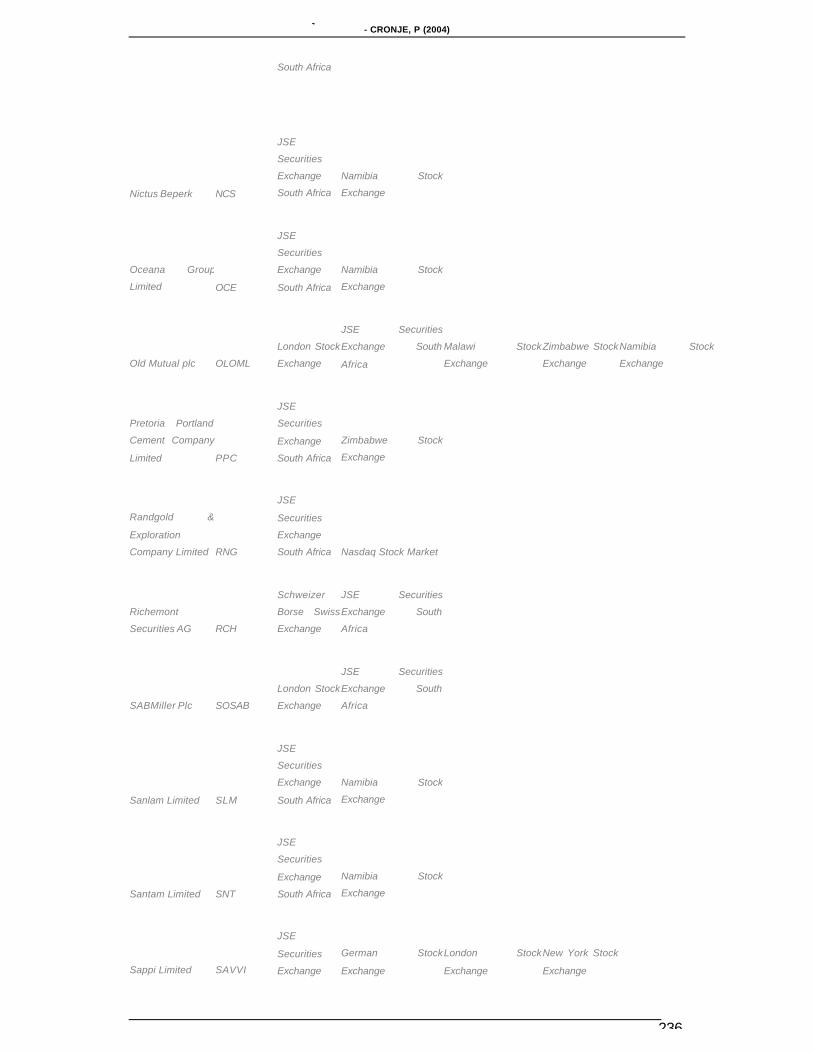
APPENDIX 1..............................................................................................................232
DUAL LISTED SHARES...........................................................................................232
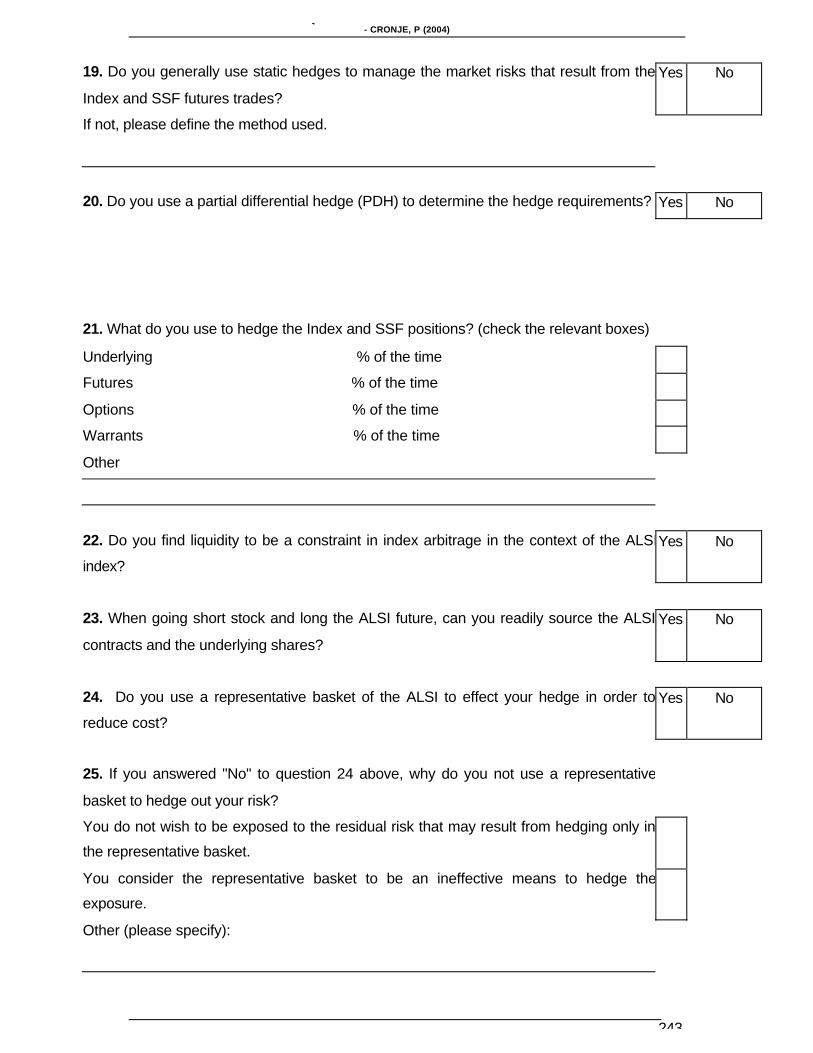
APPENDIX 2..............................................................................................................239
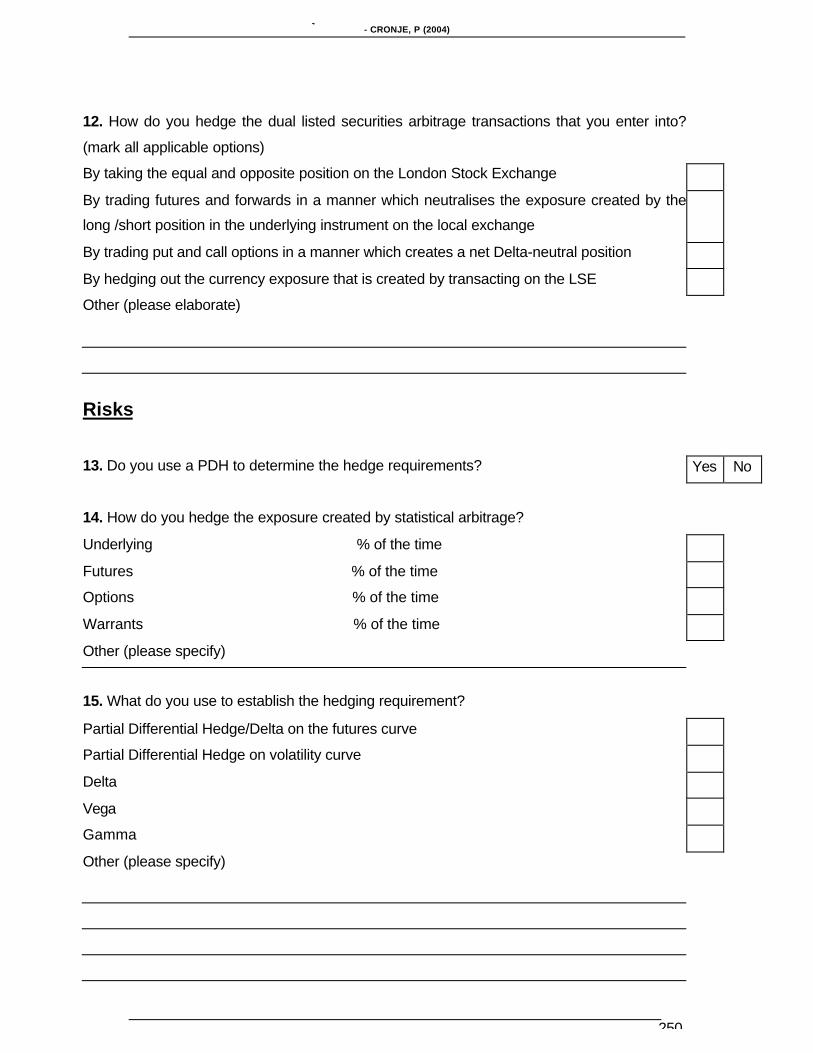
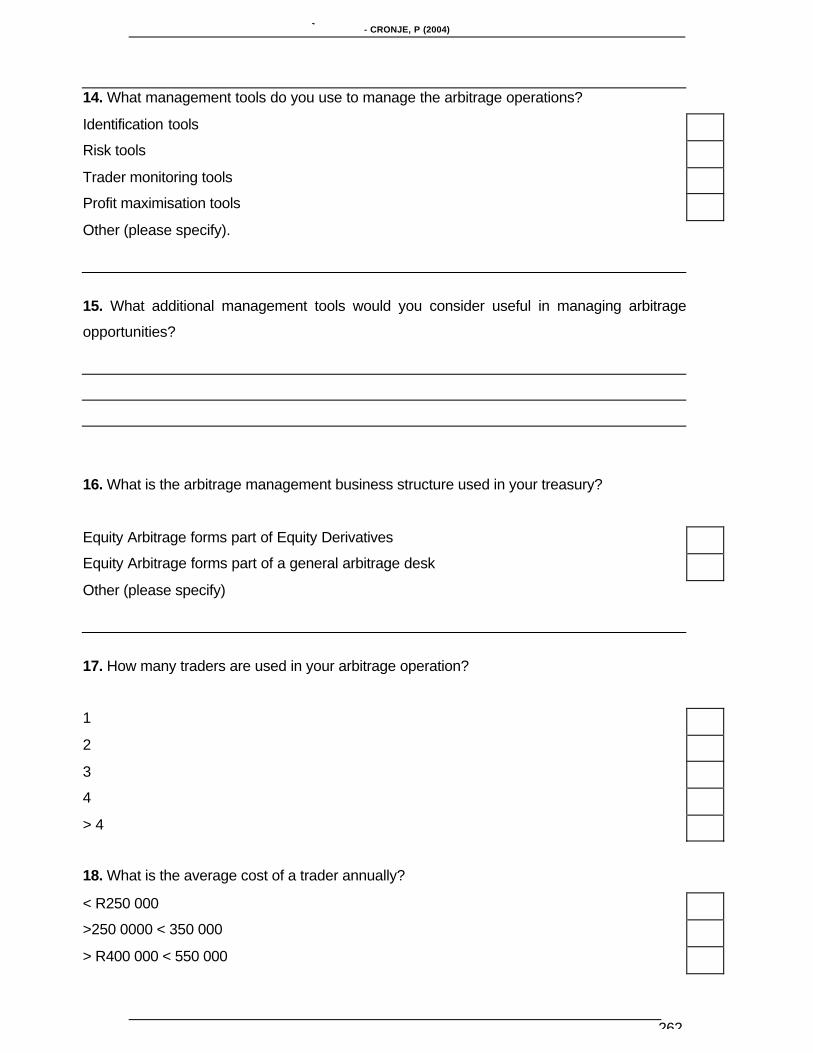
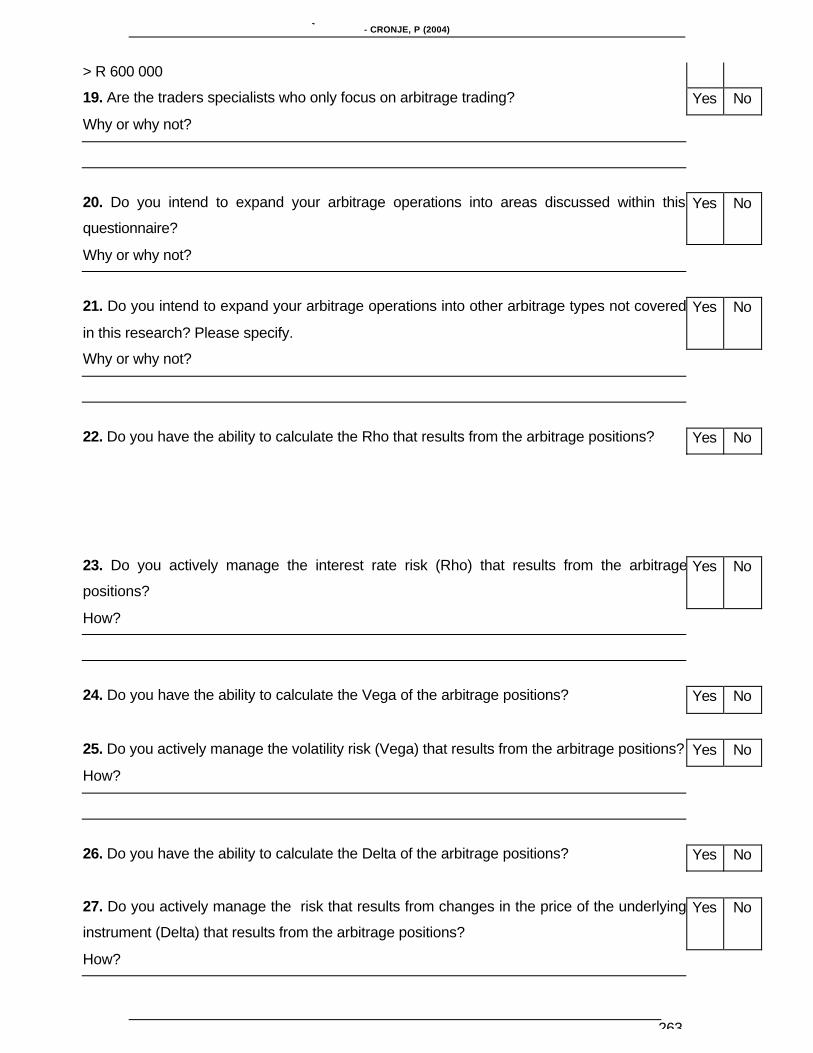
RESEARCH QUESTIONNAIRE ...............................................................................239
APPENDIX 3..............................................................................................................265
CONTENT VALIDITY QUESTIONNAIRE.................................................................265
Page 12
MANAGING PURE AND STATISTICAL EQUITY ARBITRAGE OPPORTUNITIES WITHIN THE SOUTH AFRICAN ENVIRONMENT- CRONJE, P (2004)
xii
LIST OF TABLES
Table 2-1 Equity futures specification in the South African market ............................39
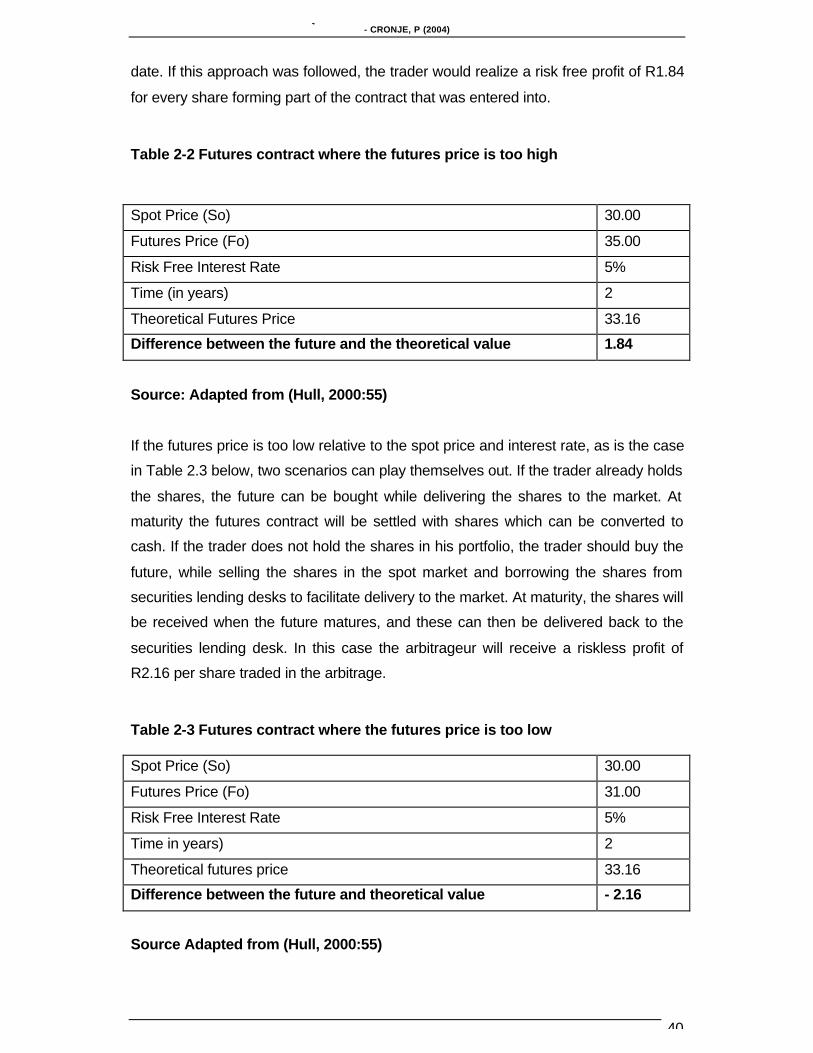
Table 2-2 Futures contract where the futures price is too high...................................40
Table 2-3 Futures contract where the futures price is too low....................................40
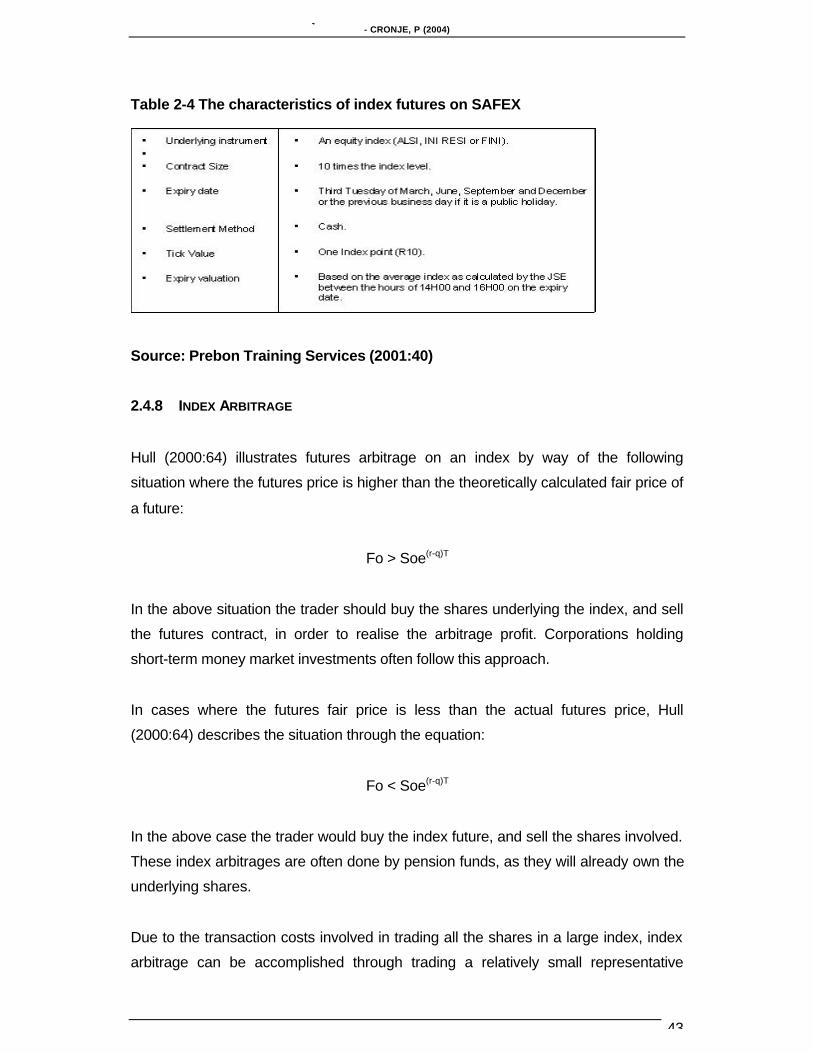
Table 2-4 The characteristics of index futures on SAFEX..........................................43
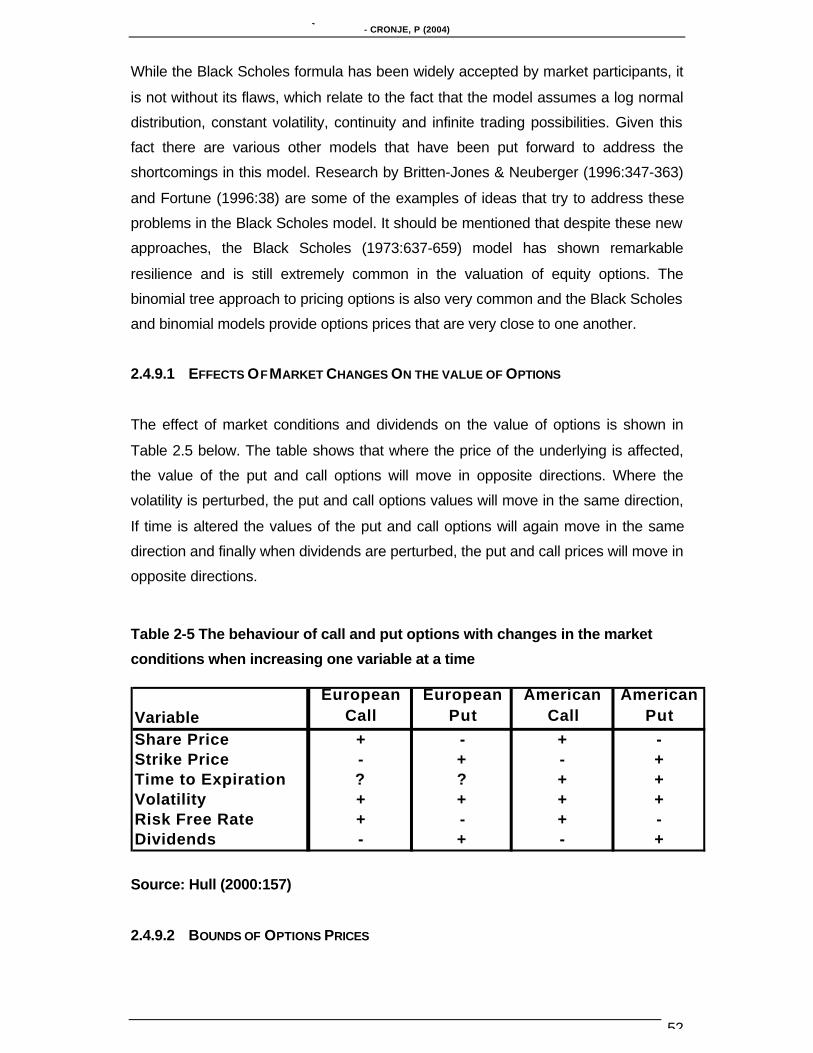
Table 2-5 The behaviour of call and put options with changes in the market
conditions when increasing one variable at a time..............................................52
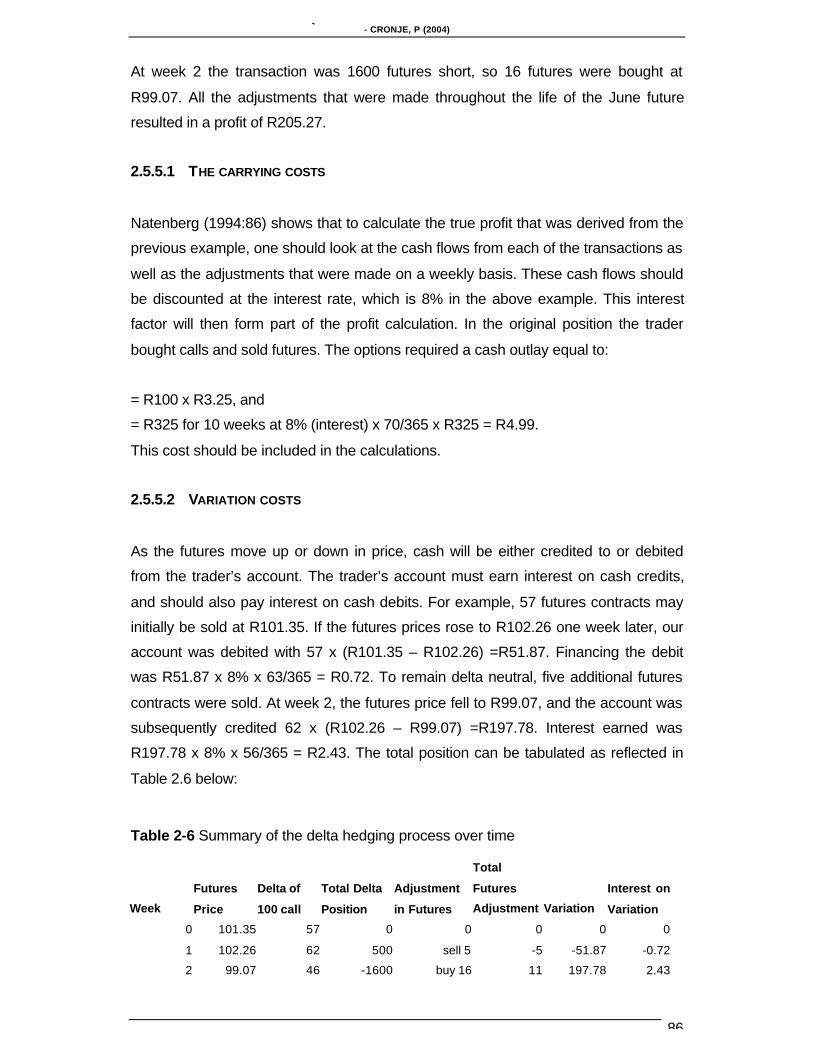
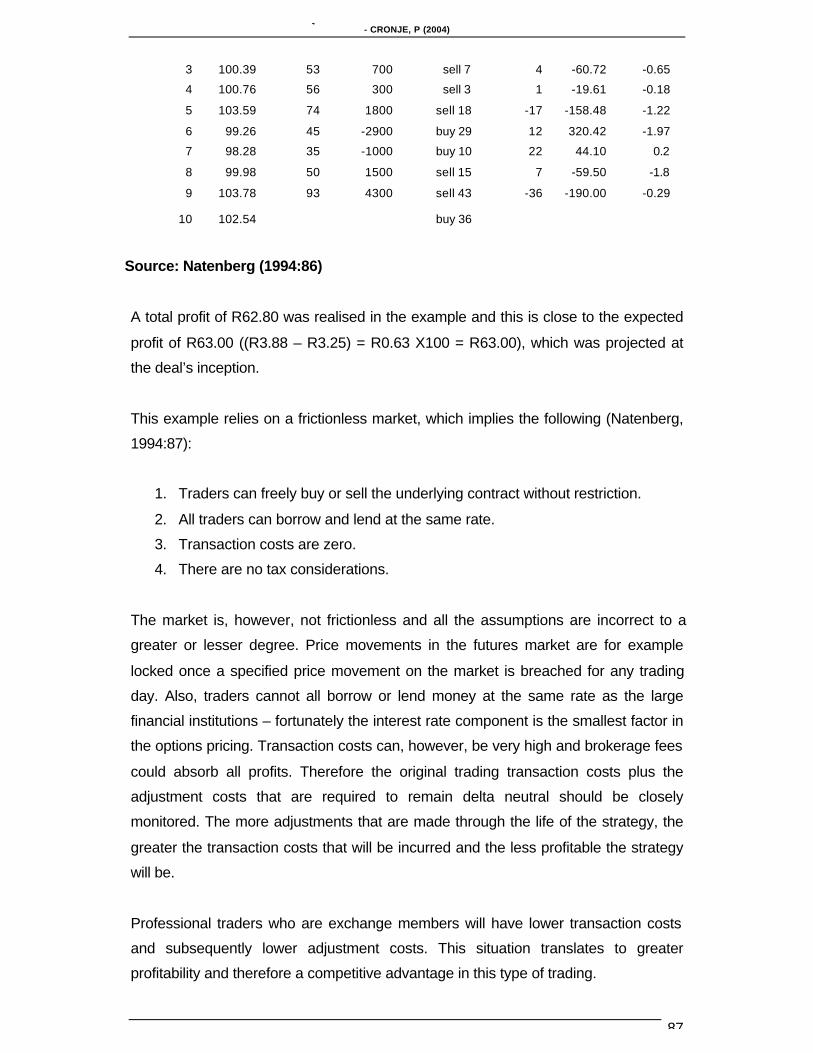
Table 2-6 Summary of the delta hedging process over time......................................86
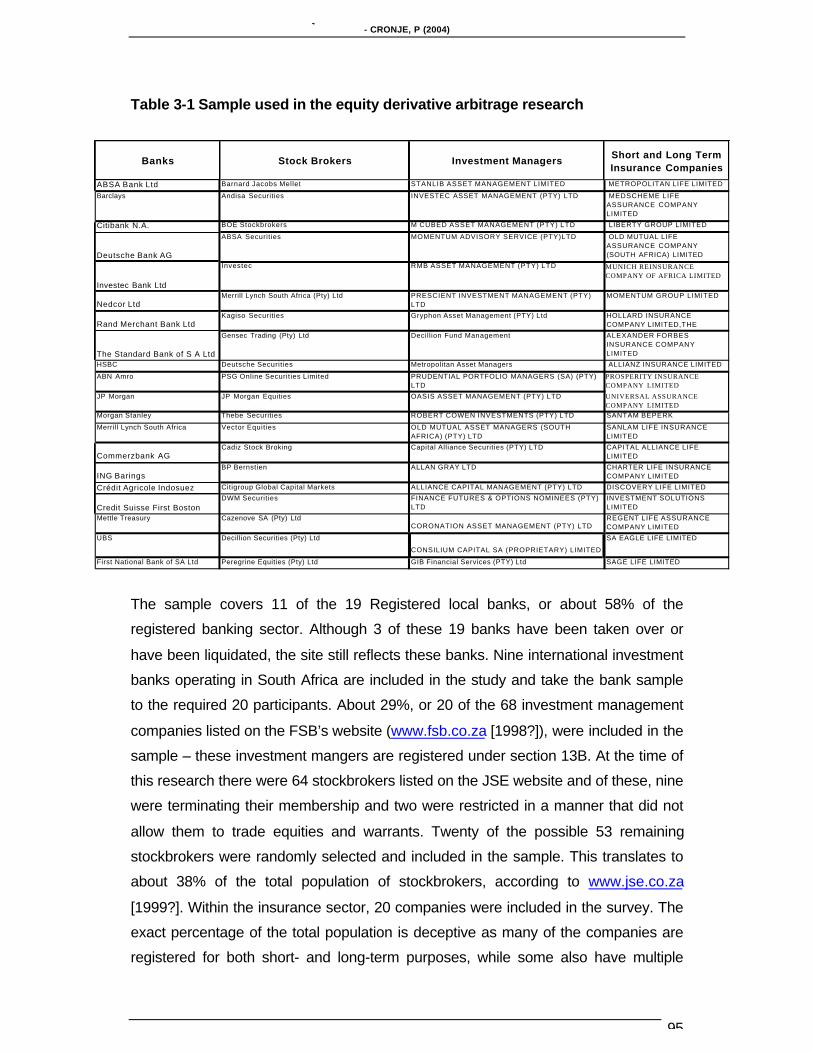
Table 3-1 Sample used in the equity derivative arbitrage research ...........................95
Table 3-2 Dual listed shares codes of the shares included in the time series testing
............................................................................................................................121
Table 4-1 Cost drivers in futures arbitrage ................................................................135
Table 4-2 Cost drivers in risk arbitrage......................................................................141
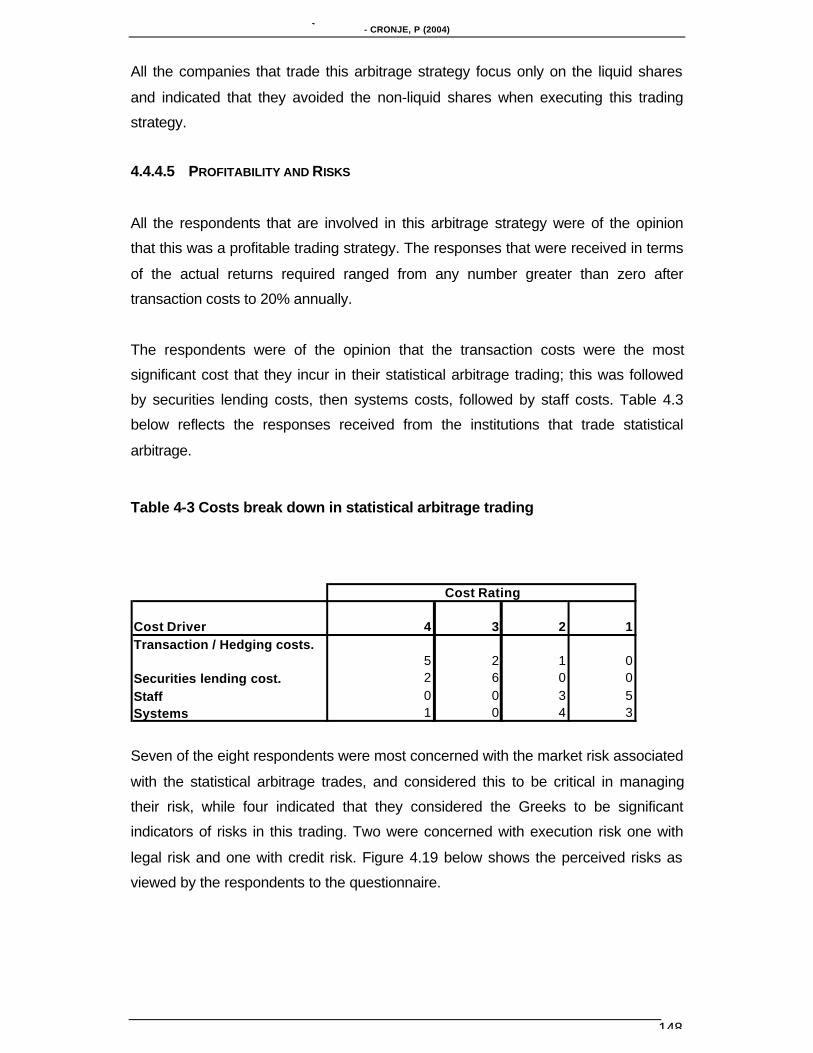
Table 4-3 Costs break down in statistical arbitrage trading ......................................148
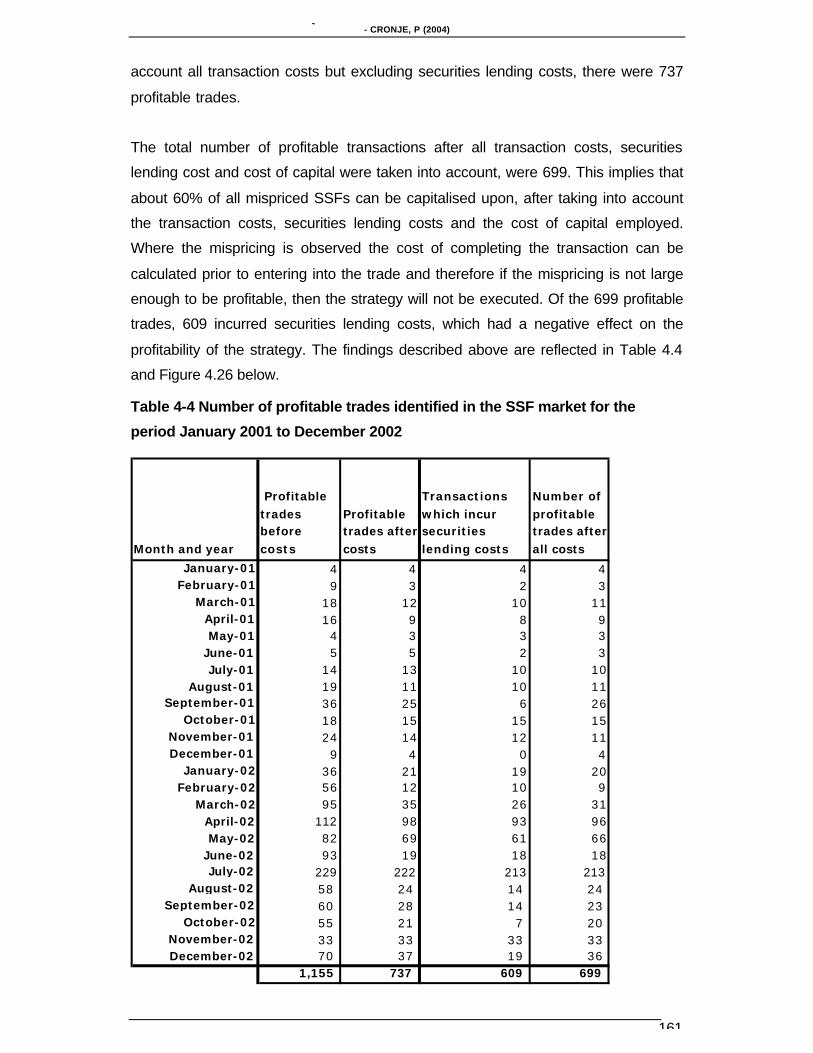
Table 4-4 Number of profitable trades identified in the SSF market for the period
January 2001 to December 2002.......................................................................161
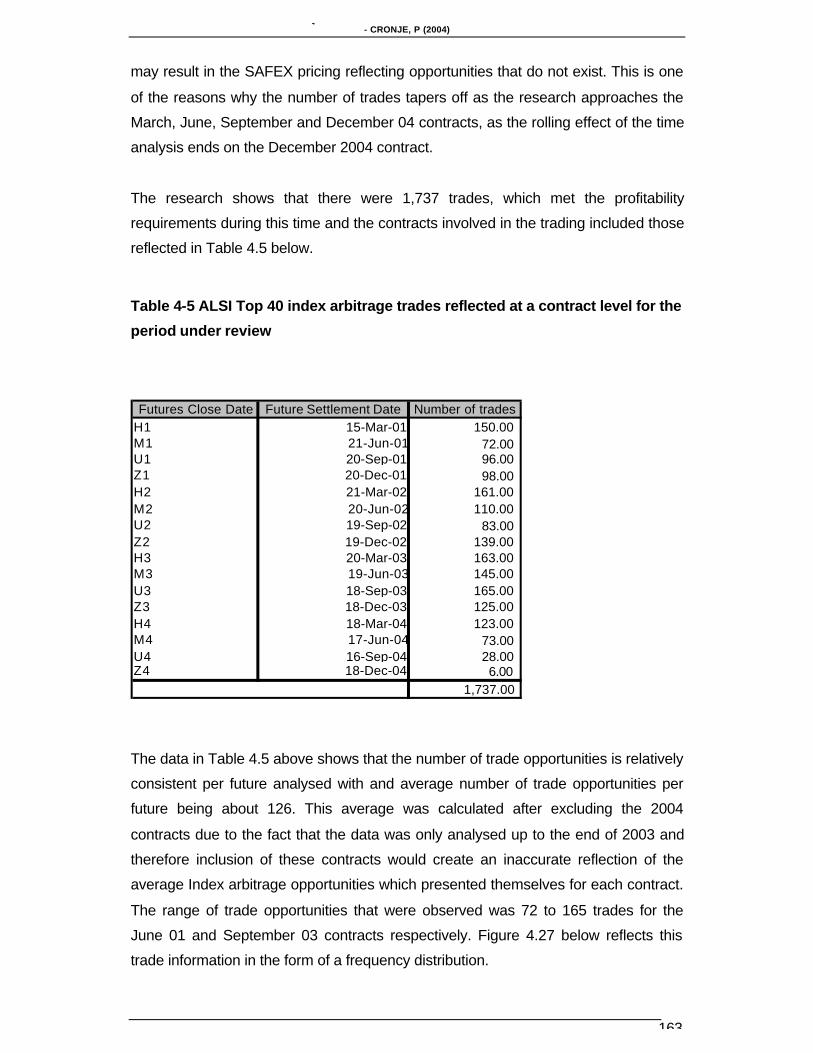
Table 4-5 ALSI Top 40 index arbitrage trades reflected at a contract level for the
period under review ............................................................................................163
Table 4-6 Average and actual profitability of SSFs over the period January 2000 to
December 2002 ..................................................................................................166
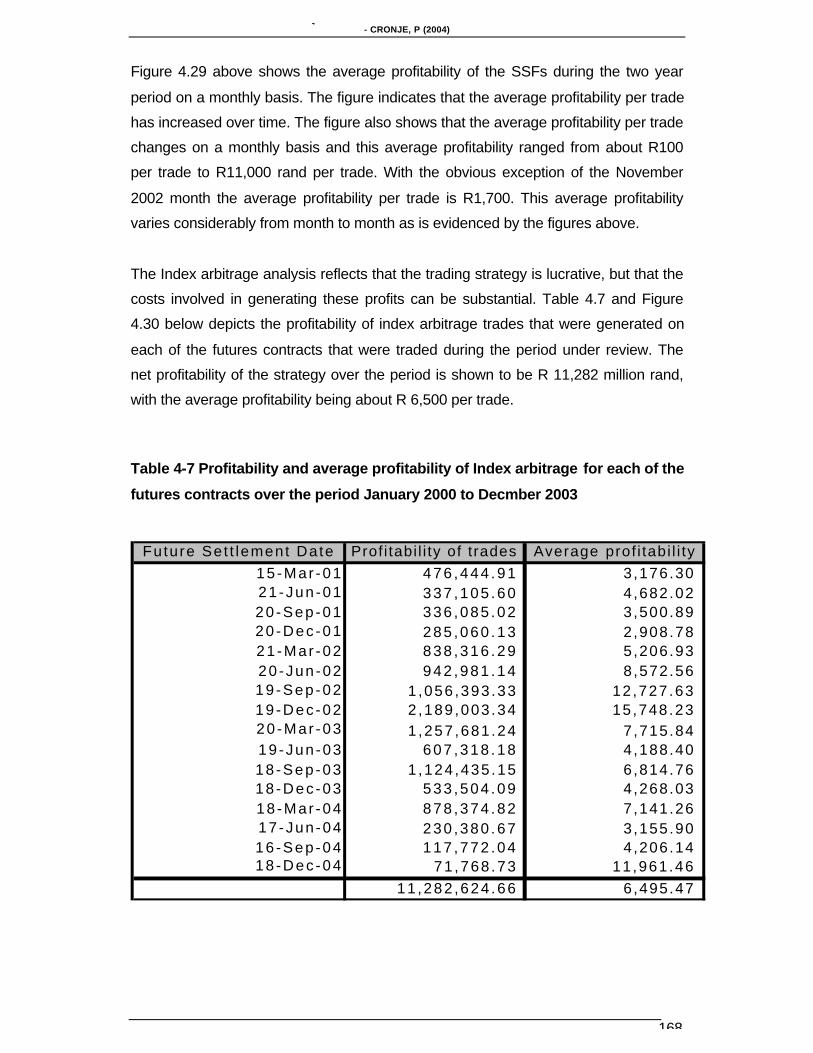
Table 4-7 Profitability and average profitability of Index arbitrage for each of the
futures contracts over the period January 2000 to Decmber 2003 ...................168
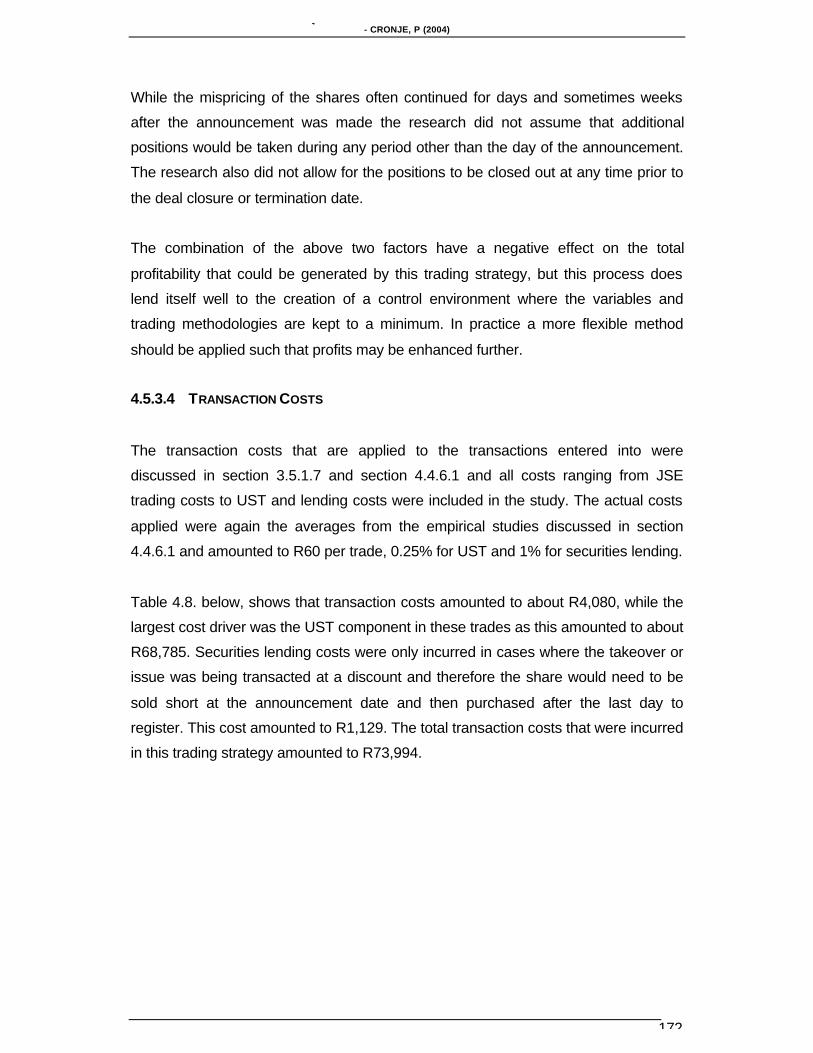
Table 4-8 Analysis of costs incurred in risk arbitrage................................................173
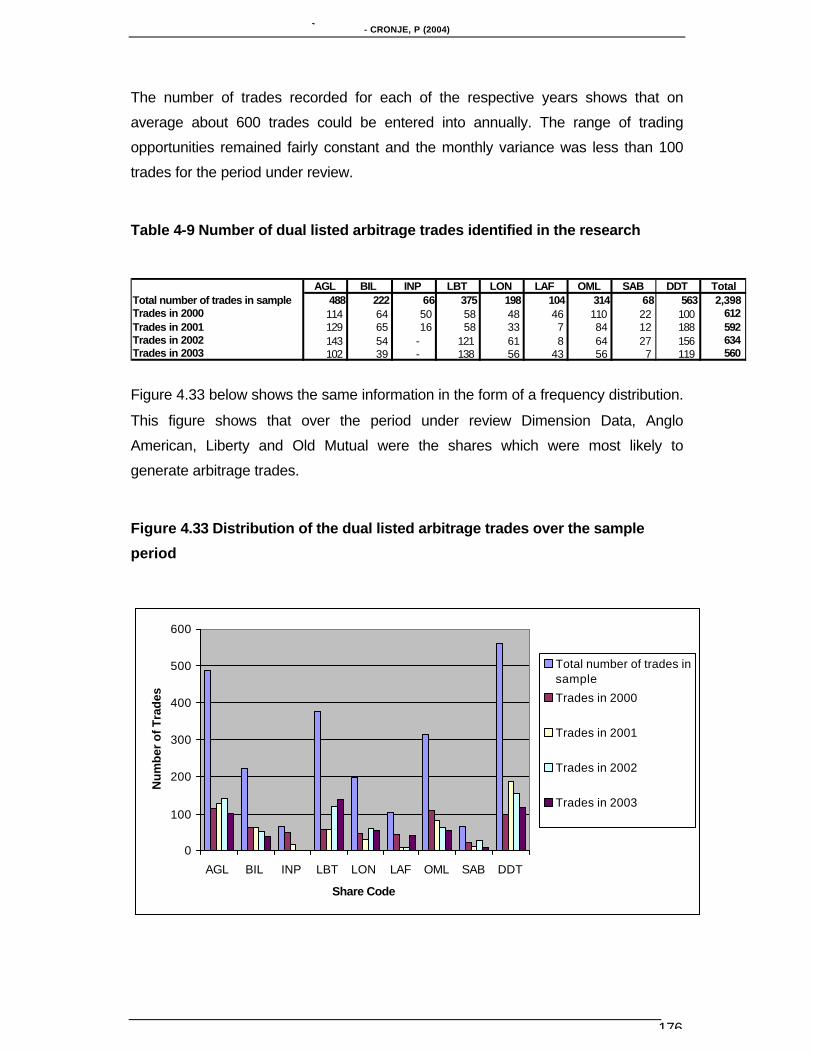
Table 4-9 Number of dual listed arbitrage trades identified in the research.............176
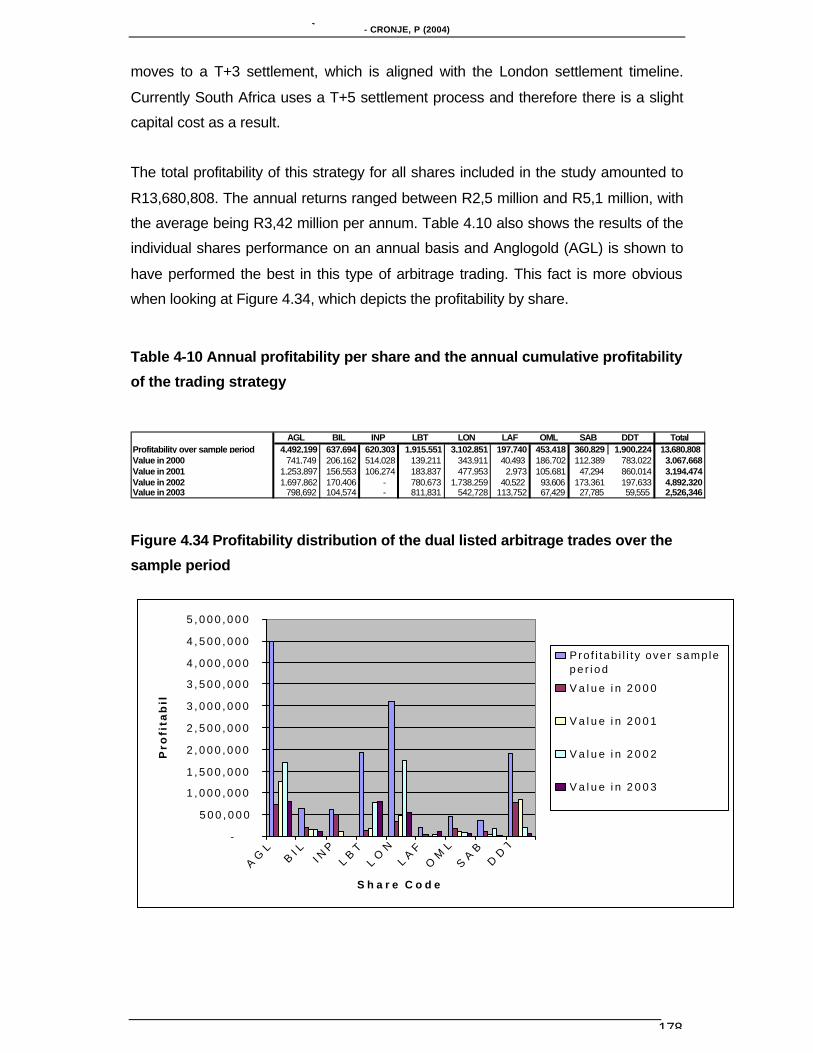
Table 4-10 Annual profitability per share and the annual cumulative profitability of the
trading strategy ...................................................................................................178
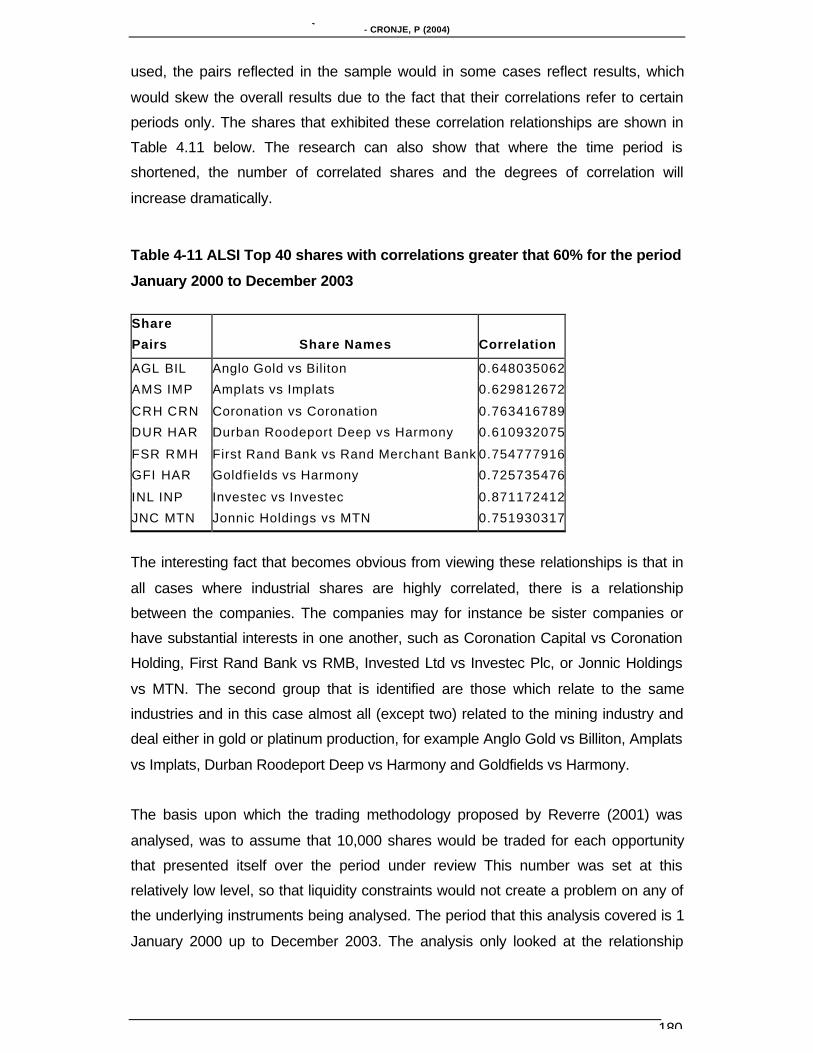
Table 4-11 ALSI Top 40 shares with correlations greater that 60% for the period
January 2000 to December 2003.......................................................................180
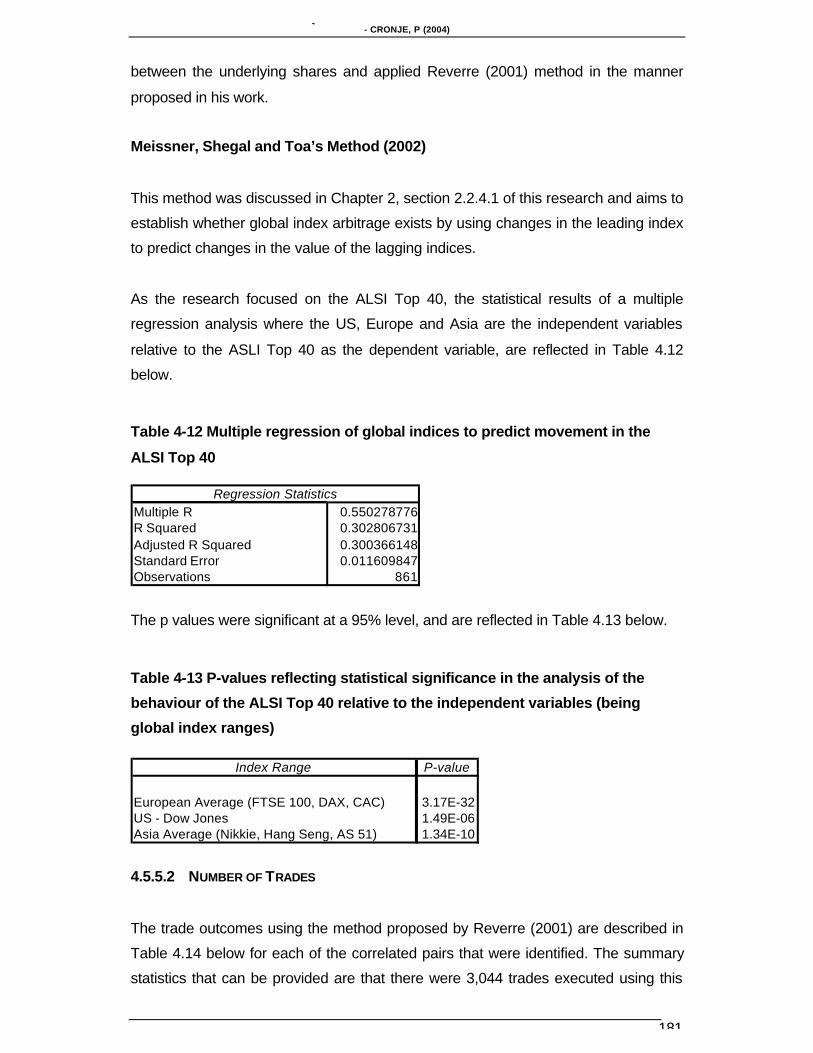
Table 4-12 Multiple regression of global indices to predict movement in the ALSI Top
40 ........................................................................................................................181
Table 4-13 P-values reflecting statistical significance in the analysis of the behaviour
of the ALSI Top 40 relative to the independent variables (being global index
ranges)................................................................................................................181
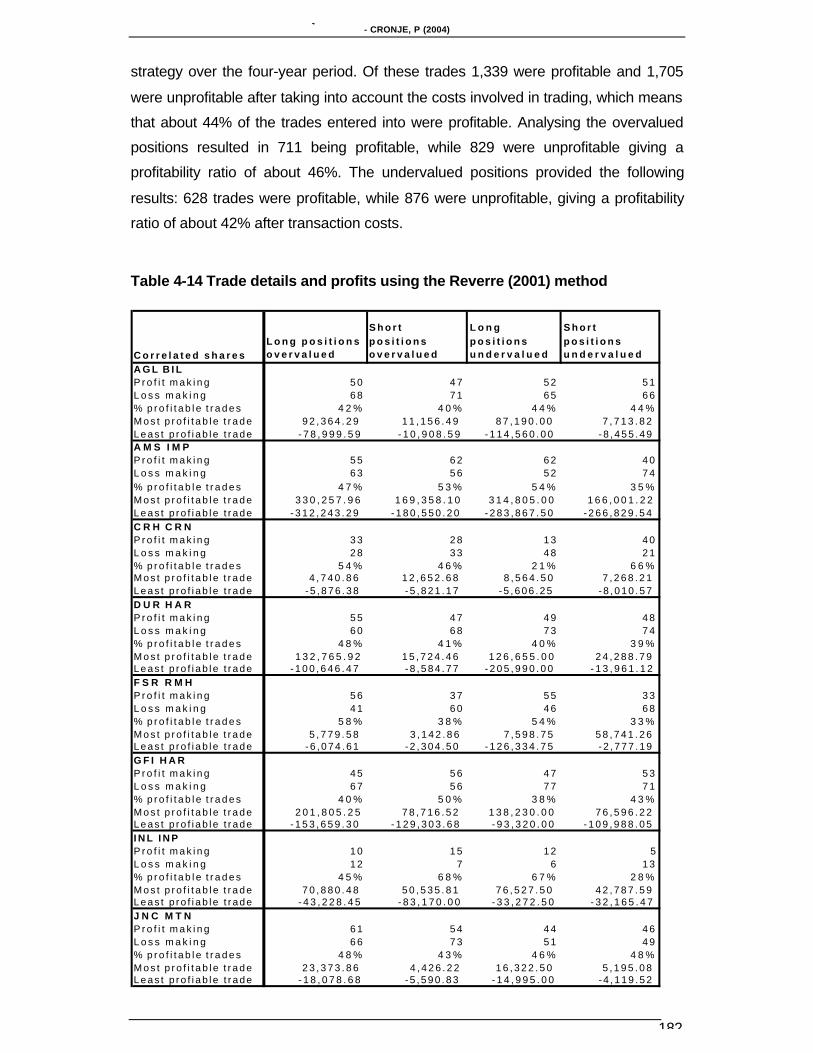
Table 4-14 Trade details and profits using the Reverre (2001) method ...................182
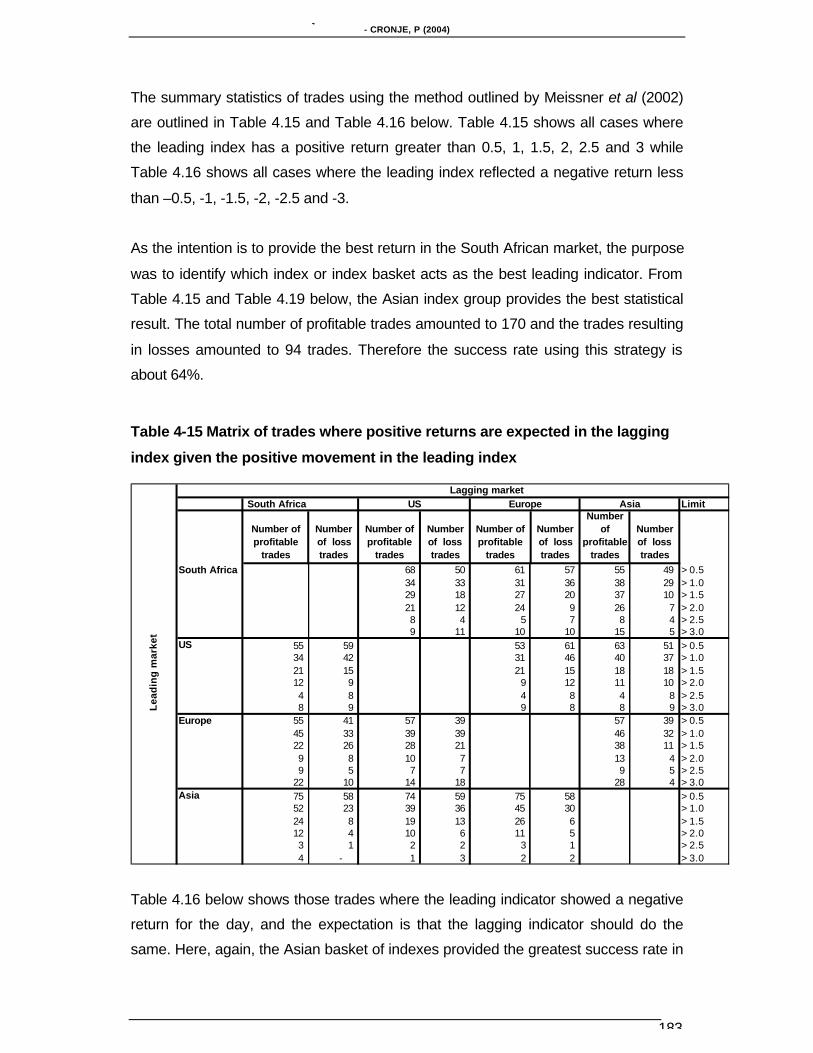
Table 4-15 Matrix of trades where positive returns are expected in the lagging index
given the positive movement in the leading index..............................................183
Page 13
MANAGING PURE AND STATISTICAL EQUITY ARBITRAGE OPPORTUNITIES WITHIN THE SOUTH AFRICAN ENVIRONMENT- CRONJE, P (2004)
xiii
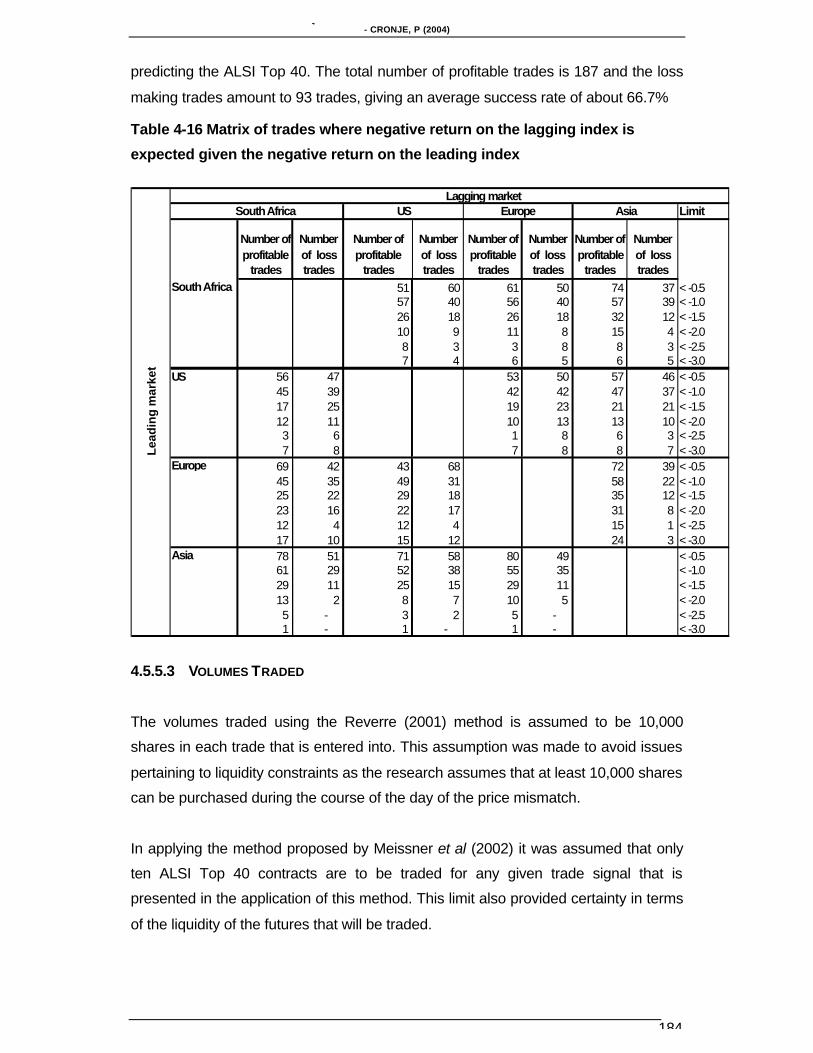
Table 4-16 Matrix of trades where negative return on the lagging index is expected
given the negative return on the leading index ..................................................184
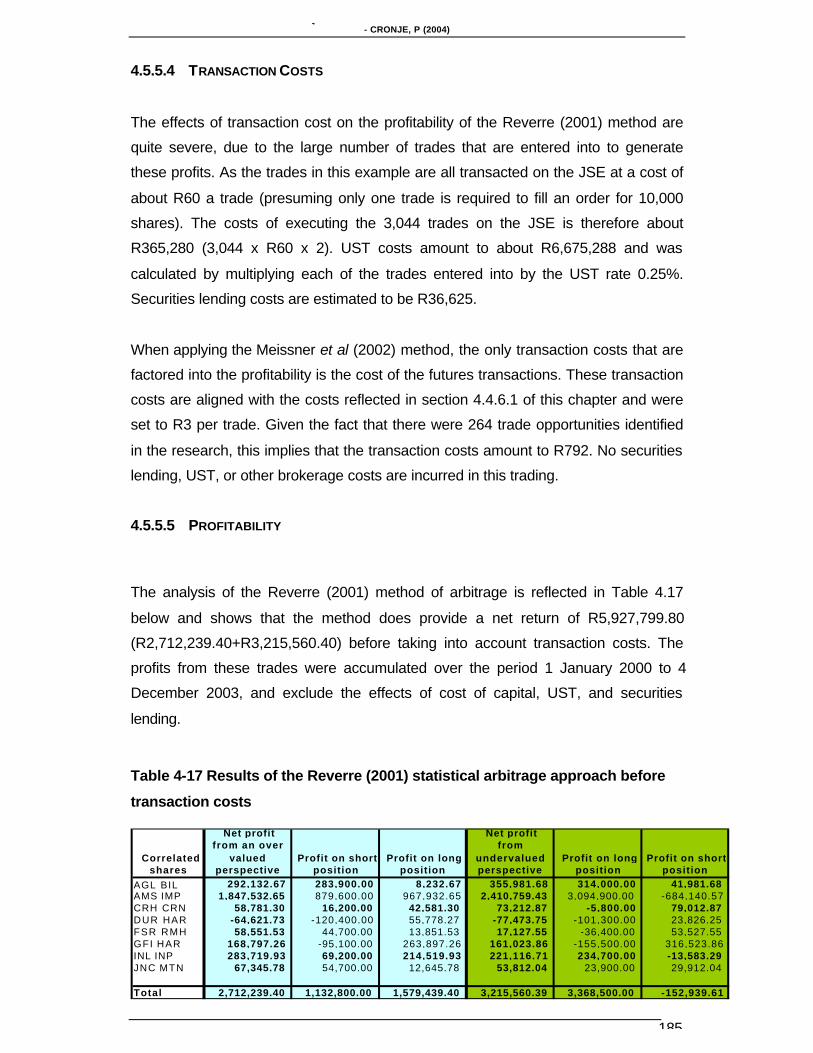
Table 4-17 Results of the Reverre (2001) statistical arbitrage approach before
transaction costs .................................................................................................185
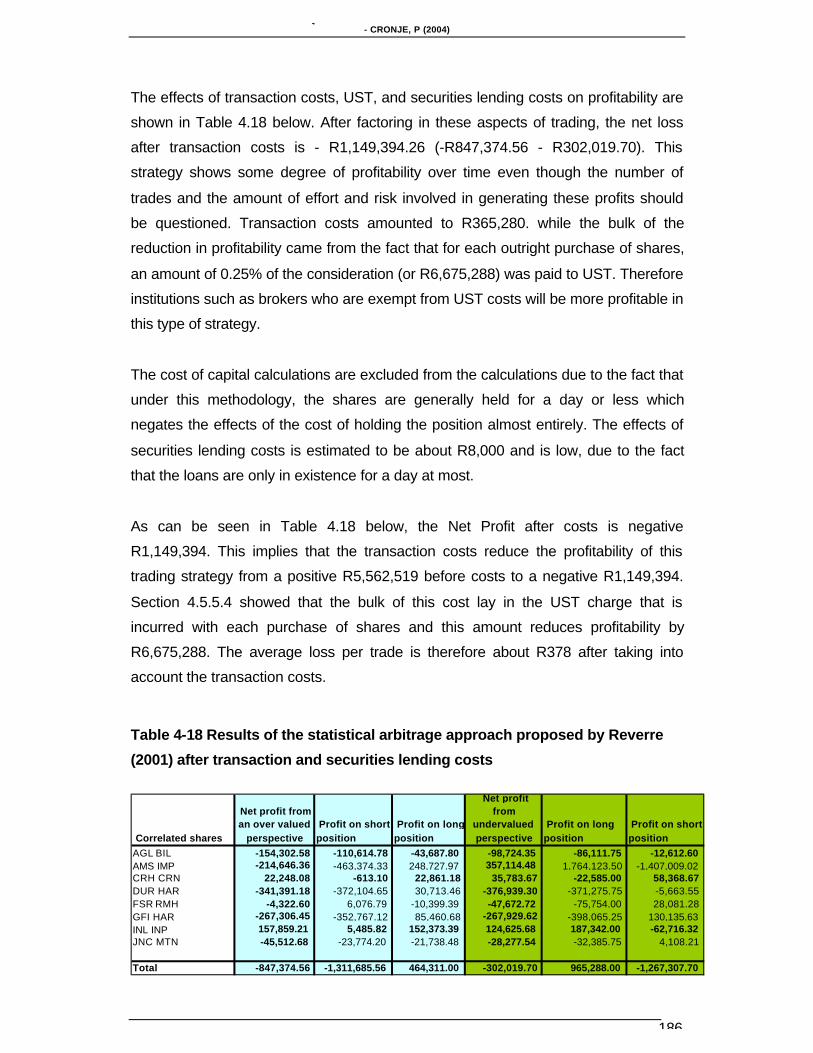
Table 4-18 Results of the statistical arbitrage approach proposed by Reverre (2001)
after transaction and securities lending costs ....................................................186
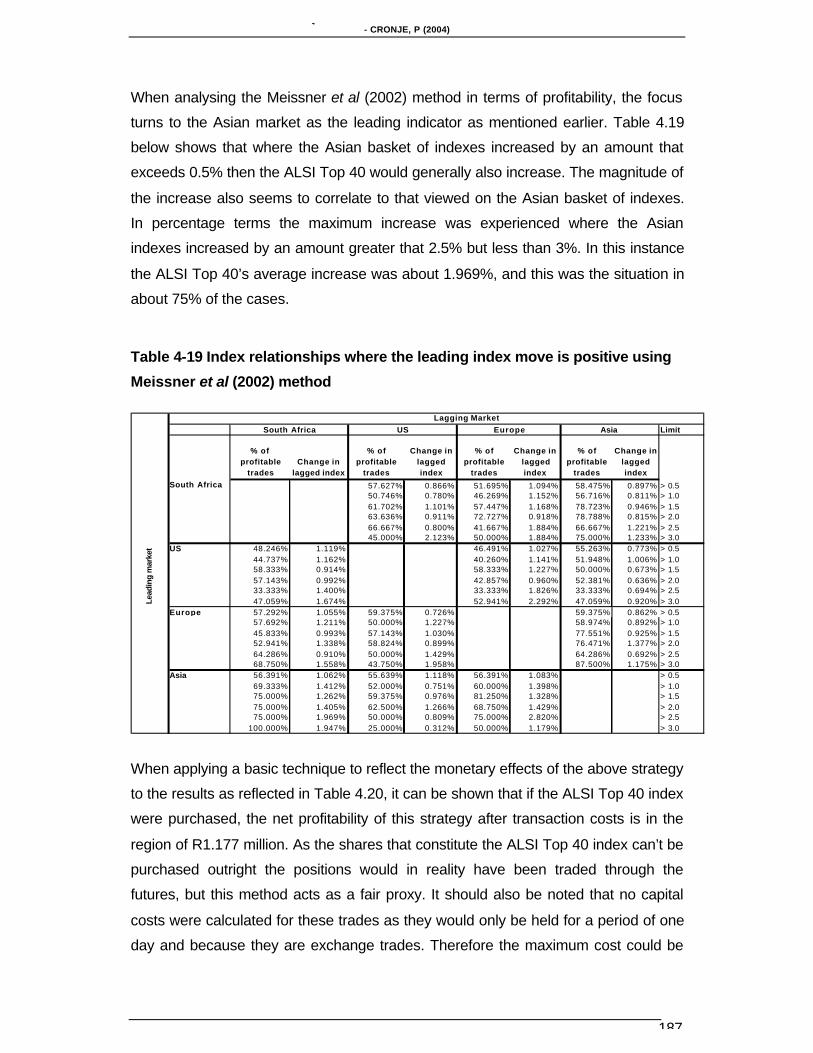
Table 4-19 Index relationships where the leading index move is positive using
Meissner et al (2002) method.............................................................................187
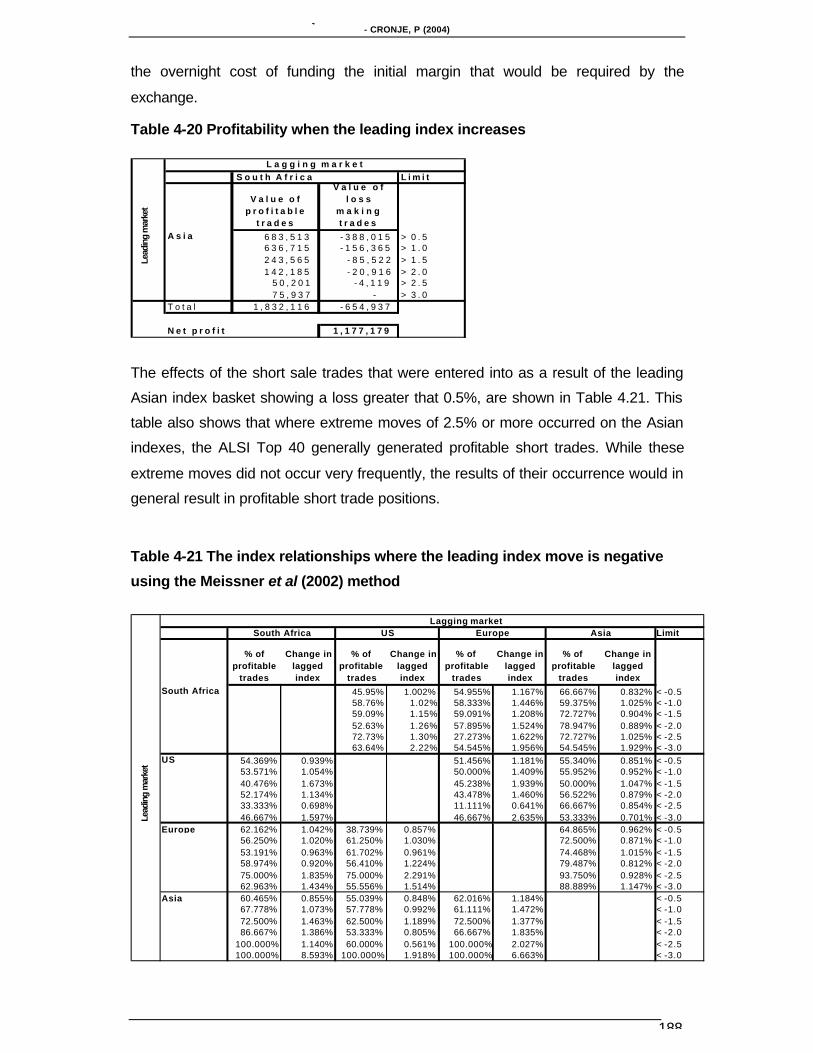
Table 4-20 Profitability when the leading index increases........................................188
Table 4-21 The index relationships where the leading index move is negative using
the Meissner et al (2002) method.......................................................................188
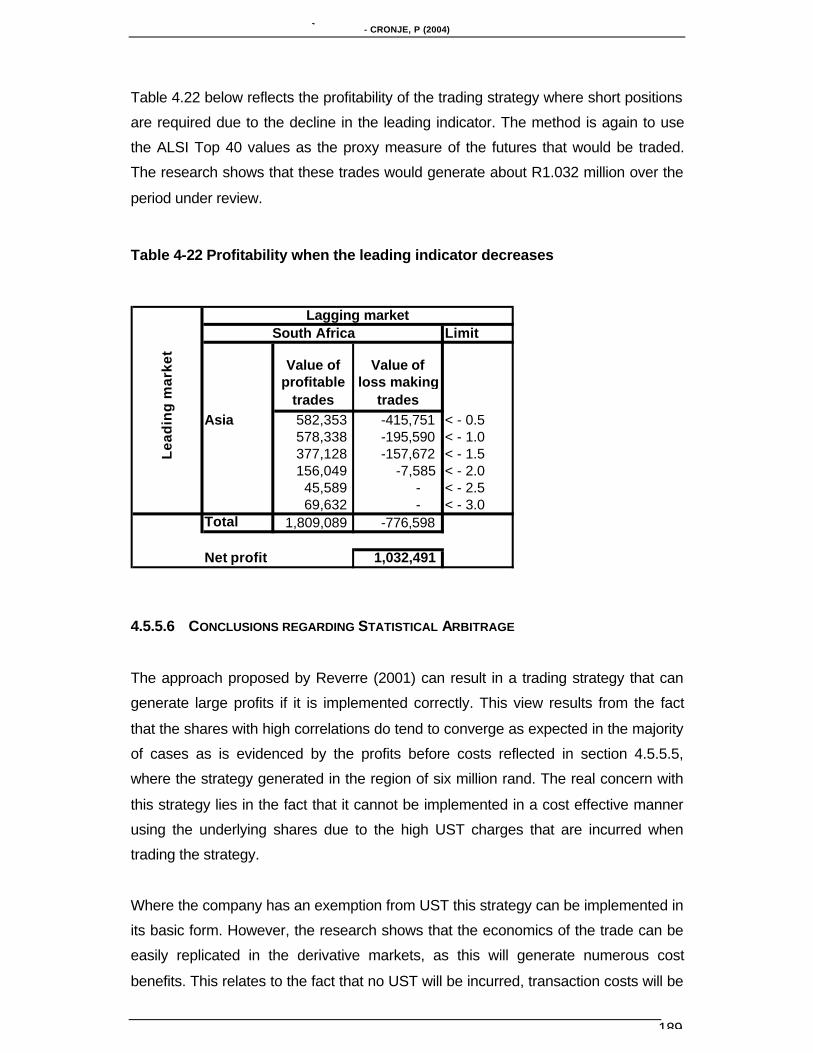
Table 4-22 Profitability when the leading indicator decreases .................................189
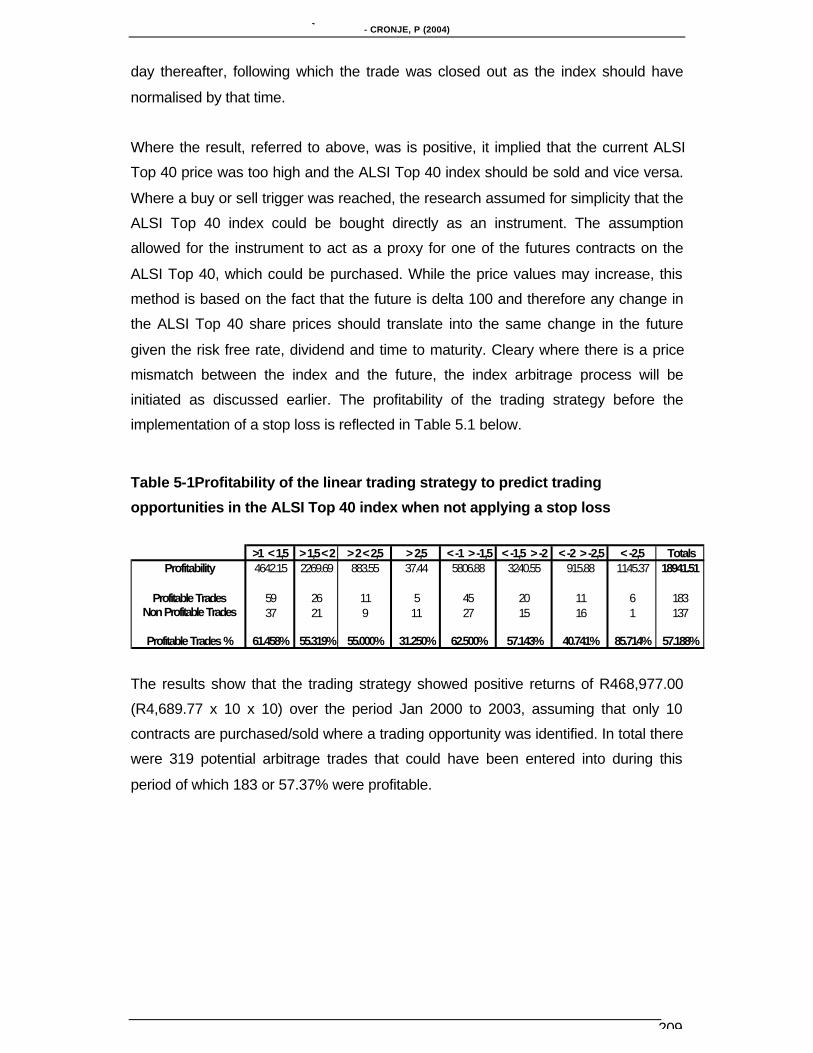
Table 5-1Profitability of the linear trading strategy to predict trading opportunities in
the ALSI Top 40 index when not applying a stop loss.......................................209
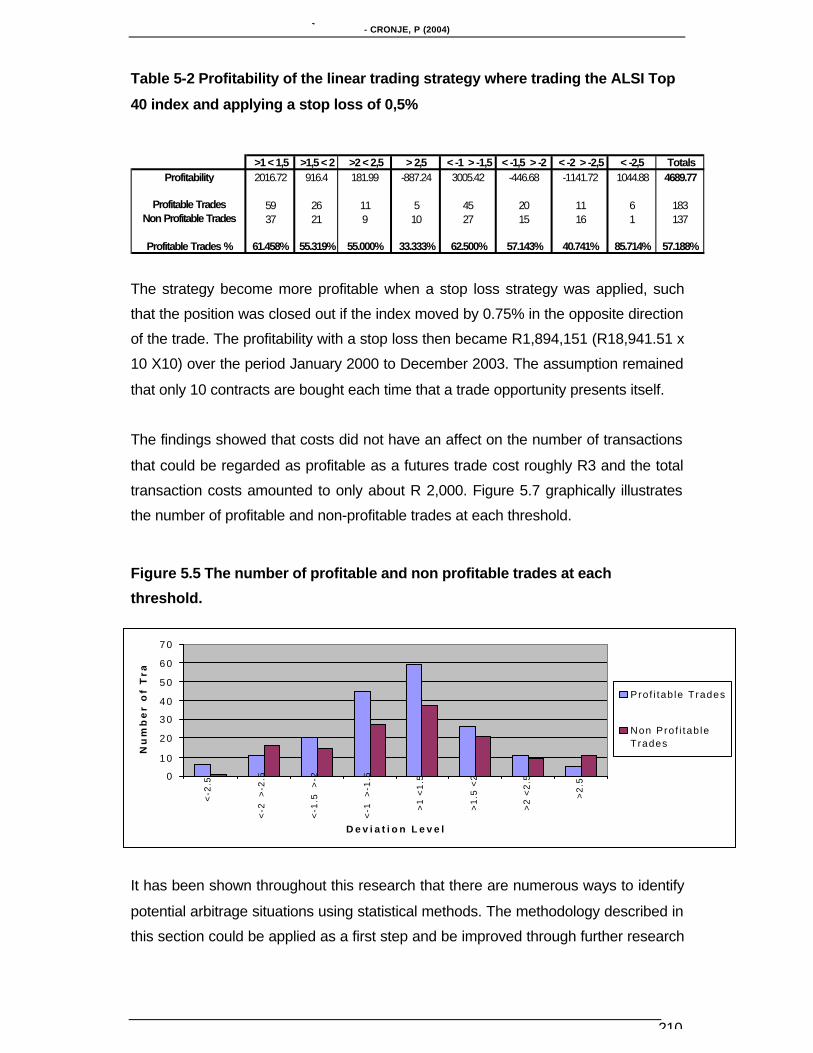
Table 5-2 Profitability of the linear trading strategy where trading the ALSI Top 40
index and applying a stop loss of 0,5%..............................................................210
Page 14
MANAGING PURE AND STATISTICAL EQUITY ARBITRAGE OPPORTUNITIES WITHIN THE SOUTH AFRICAN ENVIRONMENT- CRONJE, P (2004)
xiv
LIST OF FIGURES
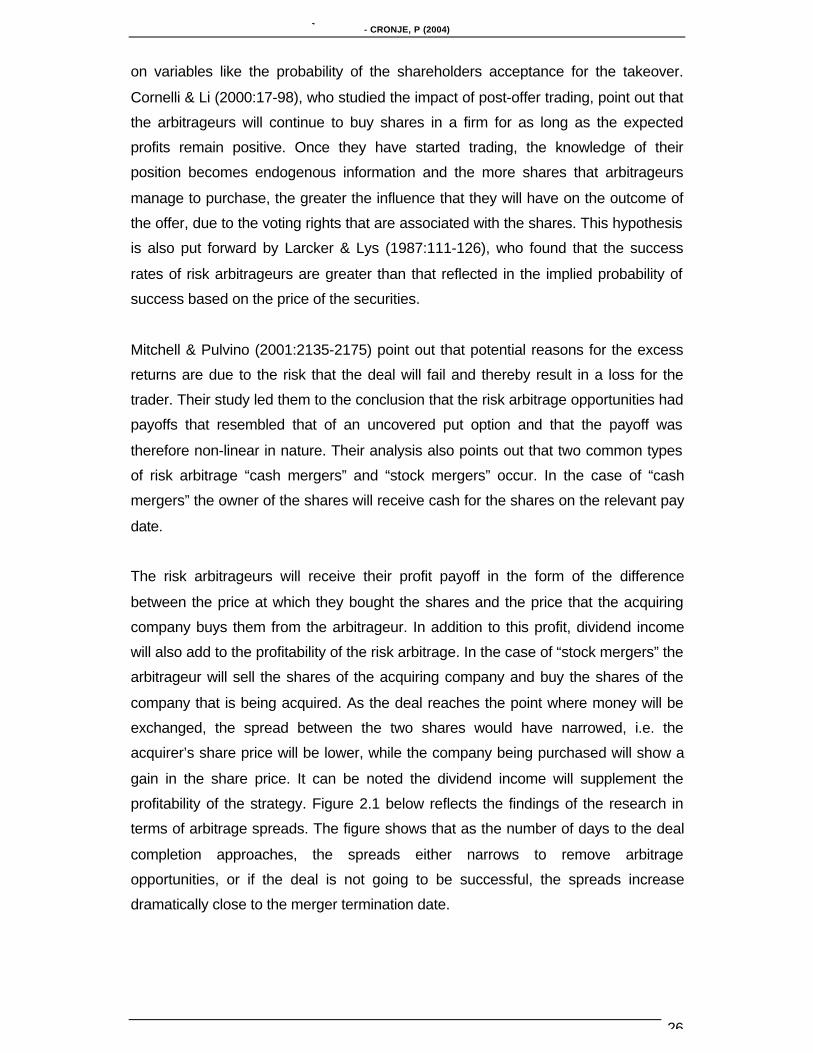
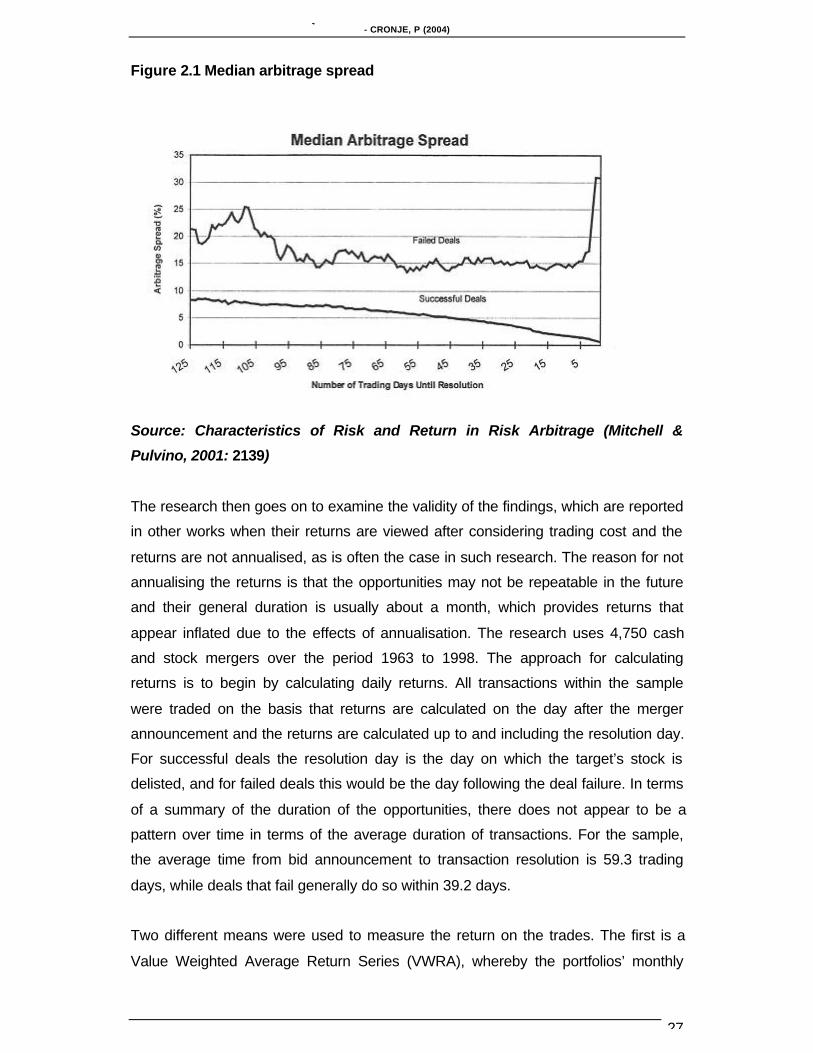
Figure 2.1 Median arbitrage spread.............................................................................27
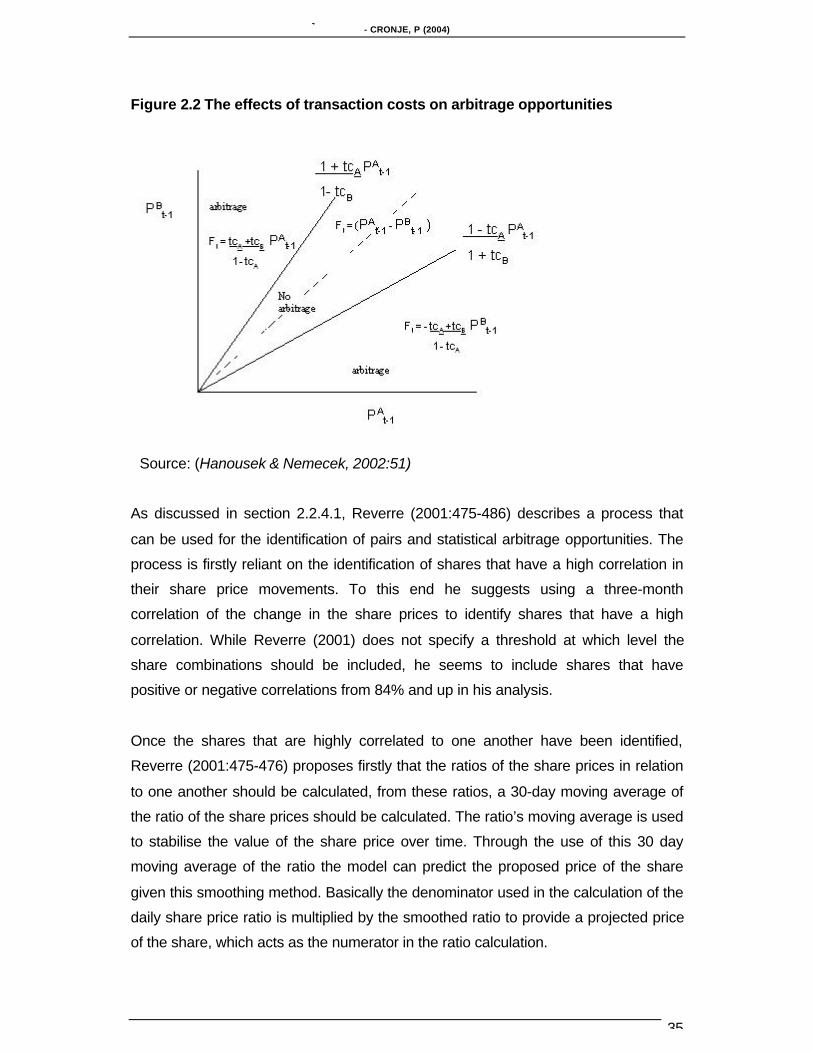
Figure 2.2 The effects of transaction costs on arbitrage opportunities .......................35
Figure 2.3 Behaviour of the price of a futures contract...............................................38
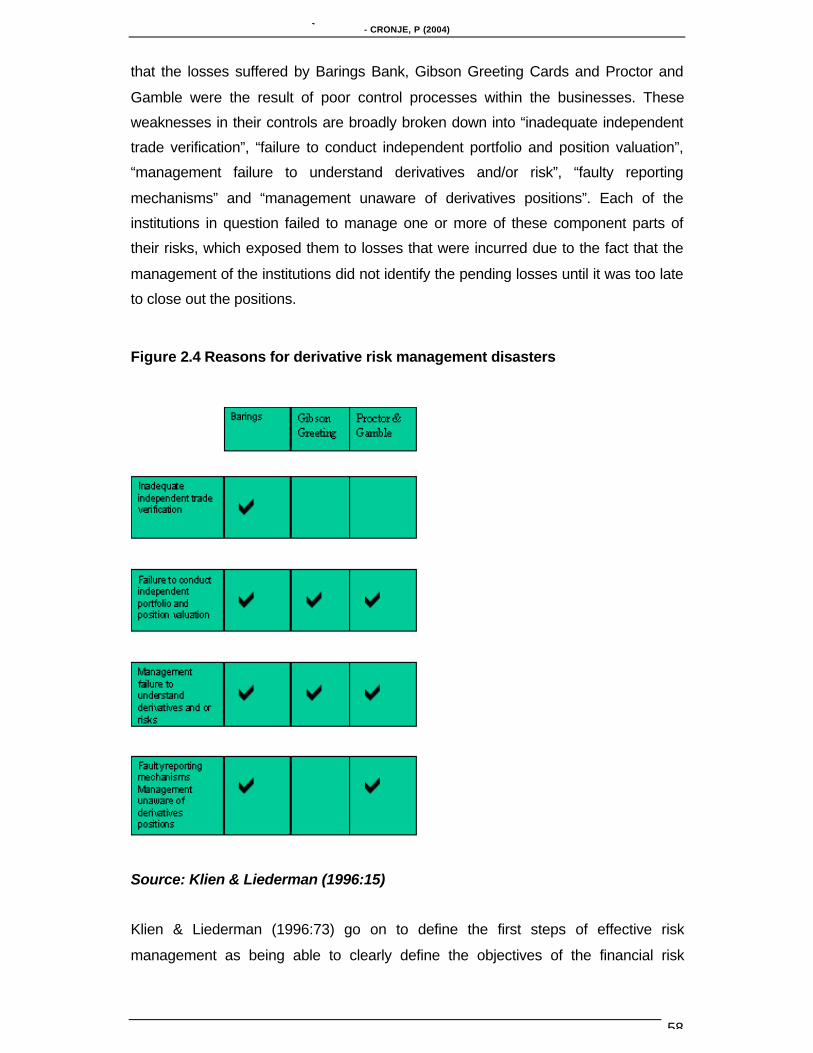
Figure 2.4 Reasons for derivative risk management disasters...................................58
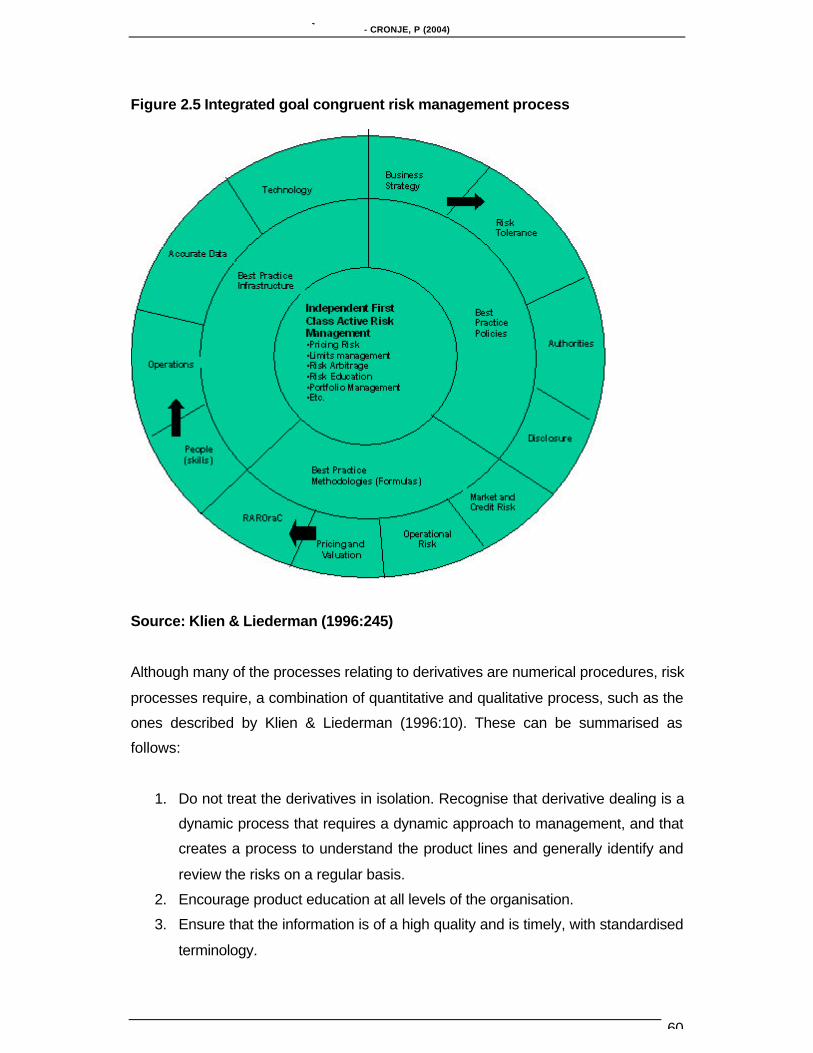
Figure 2.5 Integrated goal congruent risk management process ...............................60
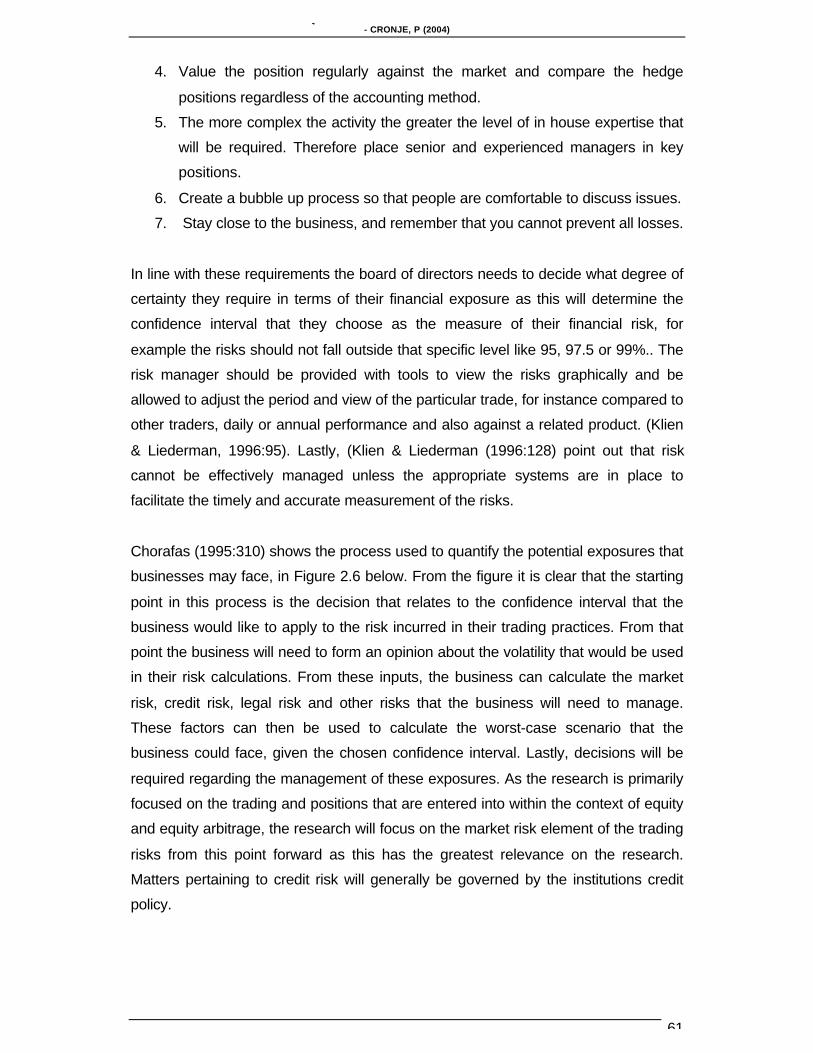
Figure 2.6 A step wise approach to the quantification of trading risks .......................62
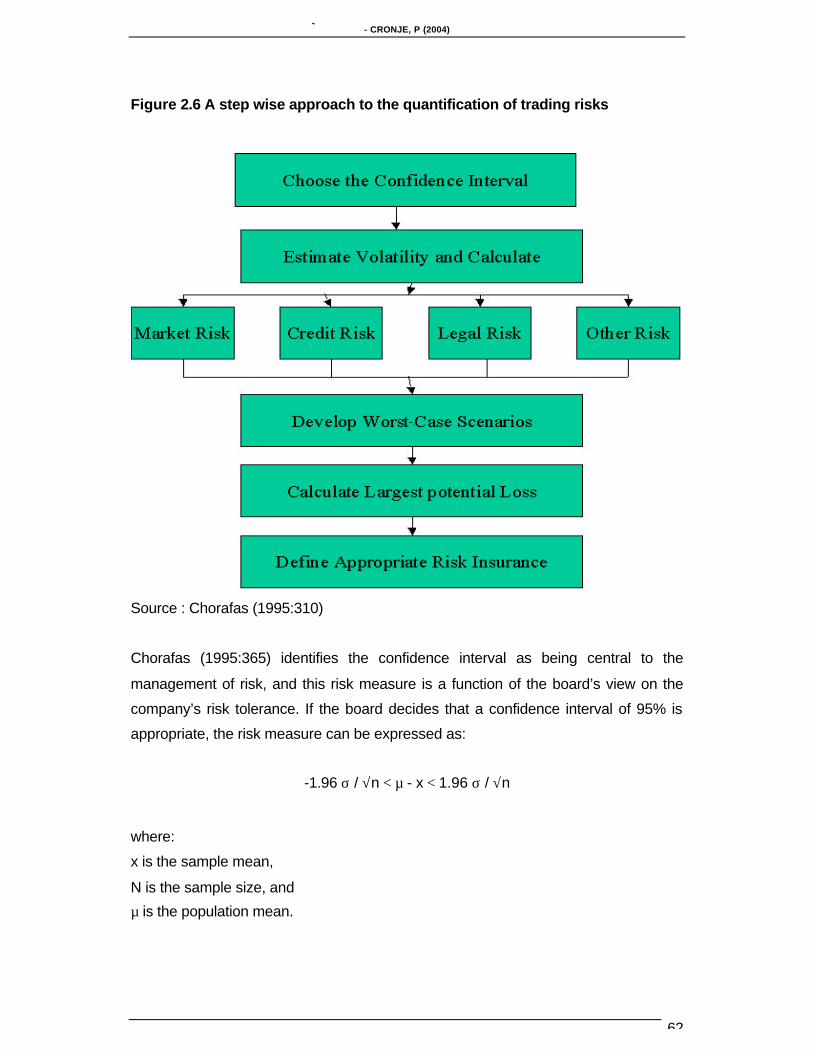
Figure 2.7 Market risk factors with historical volatility at about 17 percent at three
levels of confidence intervals................................................................................64
Figure 2.8 A typical system of market risk limits .........................................................65
Figure 2.9 Historical VAR formulation process ...........................................................68
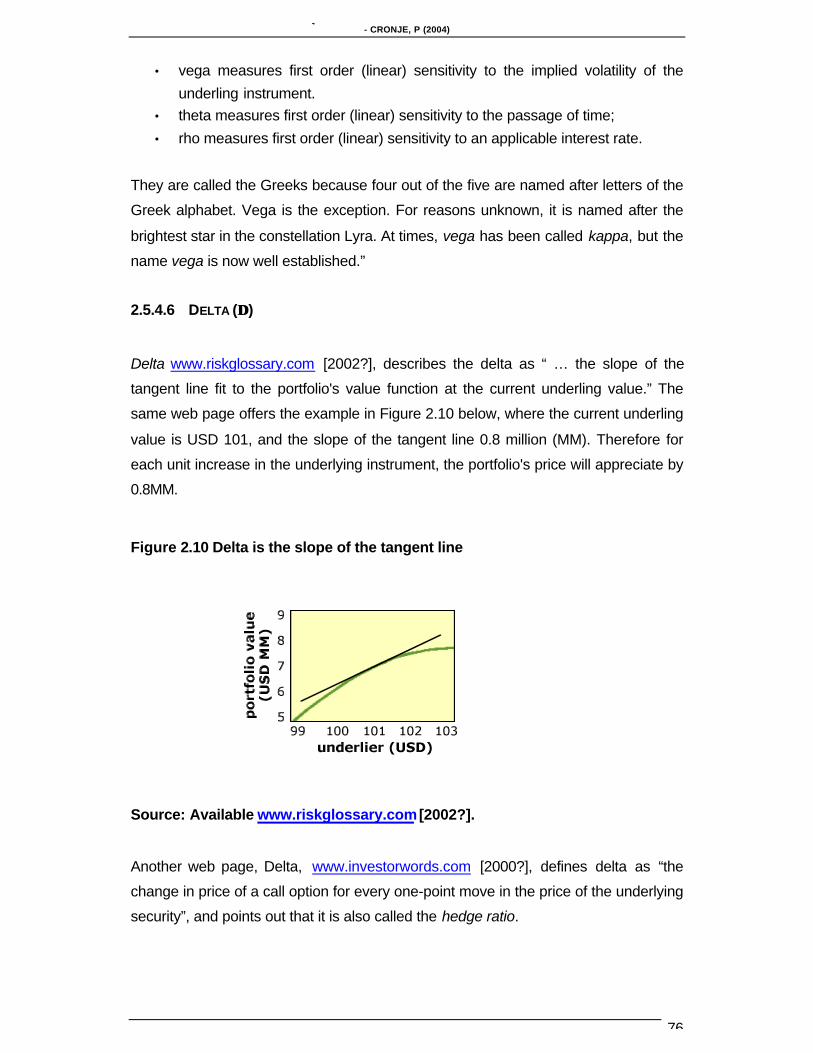
Figure 2.10 Delta is the slope of the tangent line........................................................76
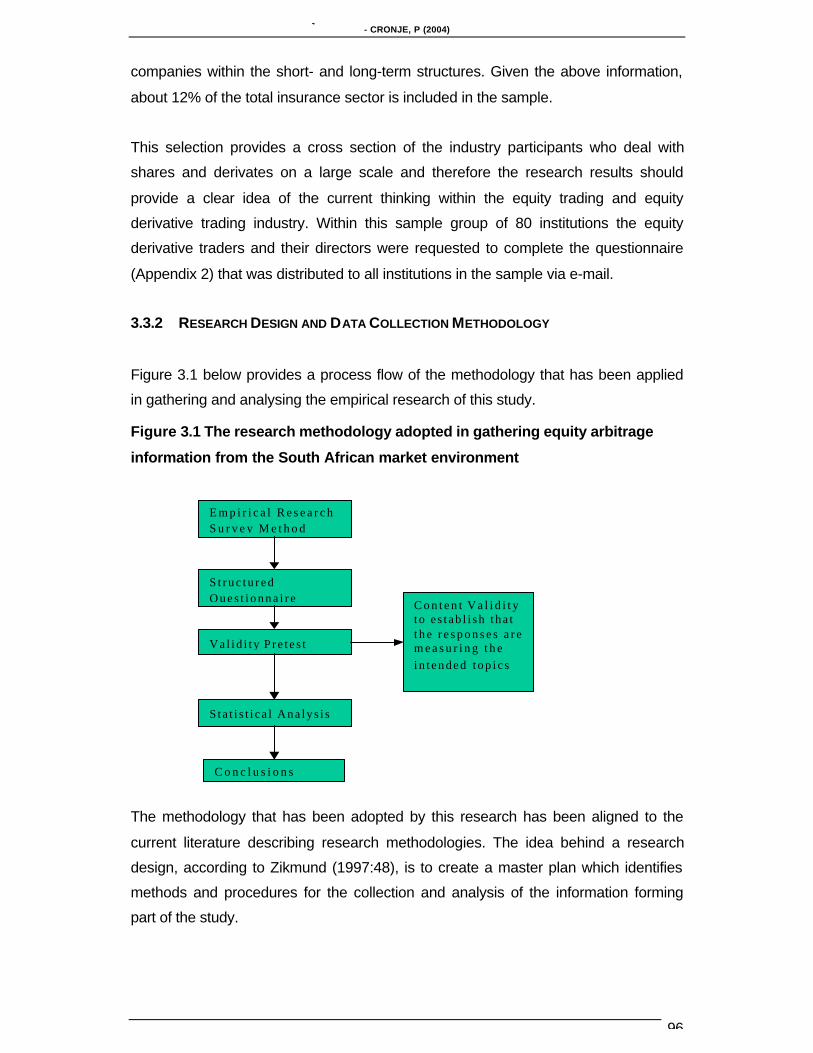
Figure 3.1 The research methodology adopted in gathering equity arbitrage
information from the South African market environment .....................................96
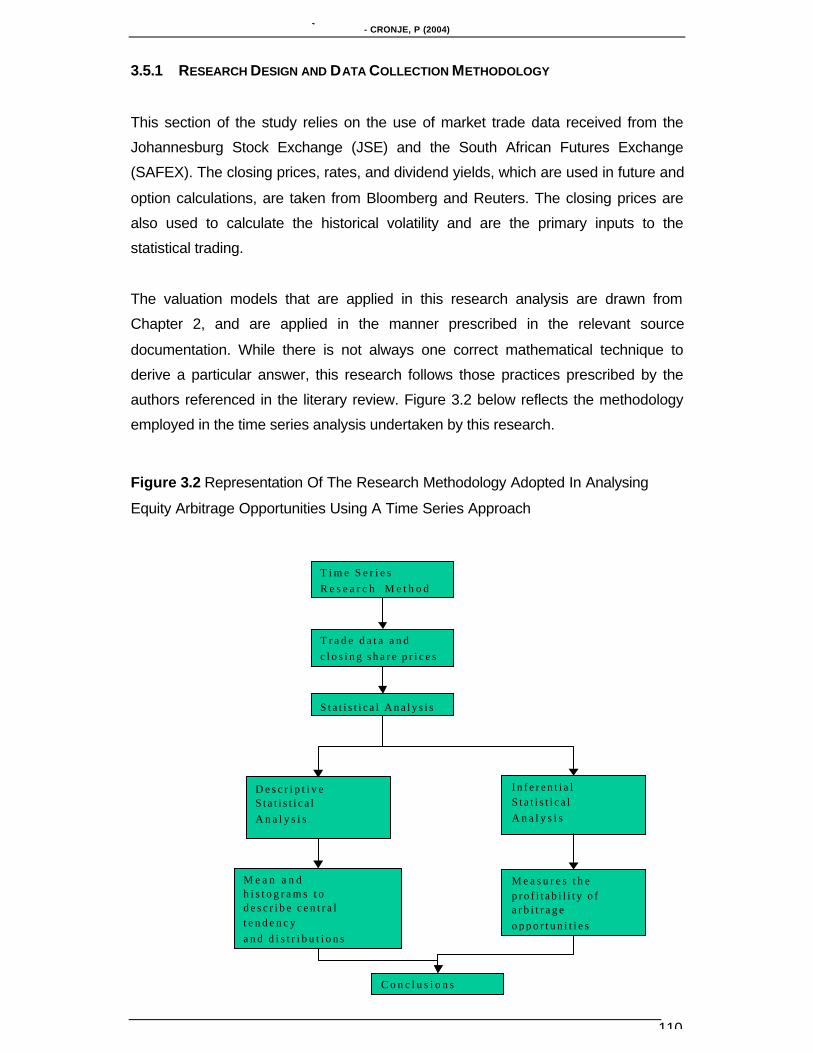
Figure 3.2 Representation Of The Research Methodology Adopted In Analysing
Equity Arbitrage Opportunities Using A Time Series Approach........................110
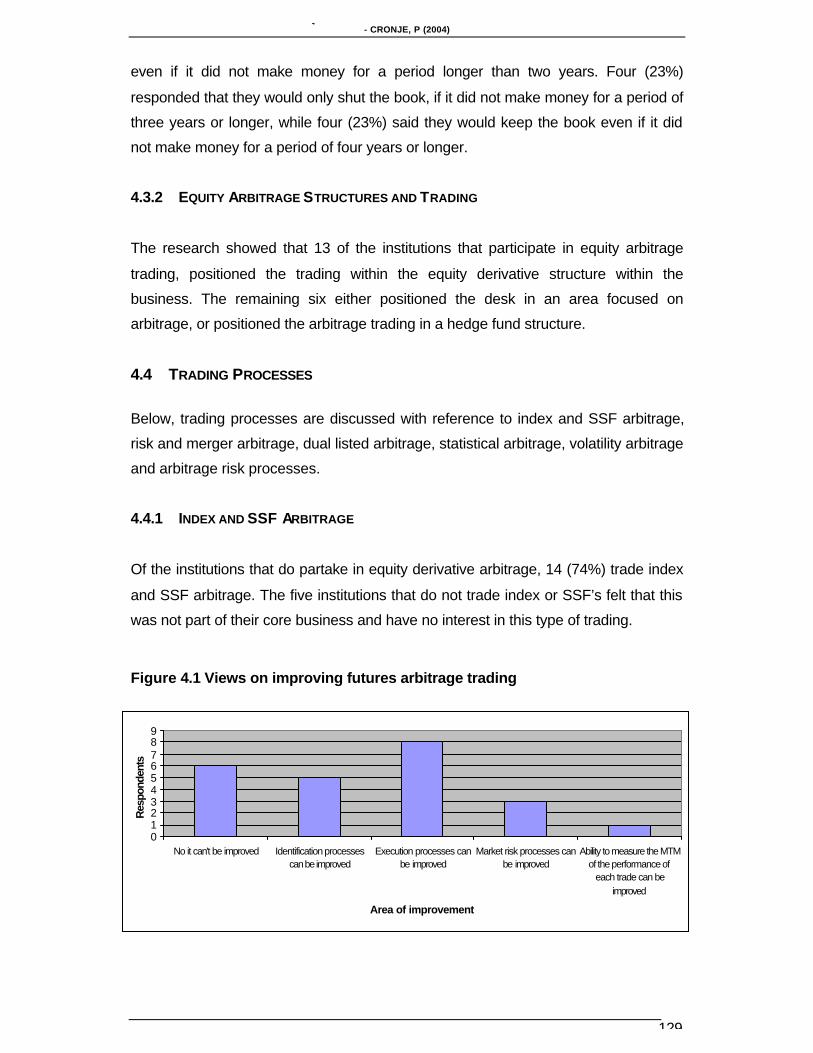
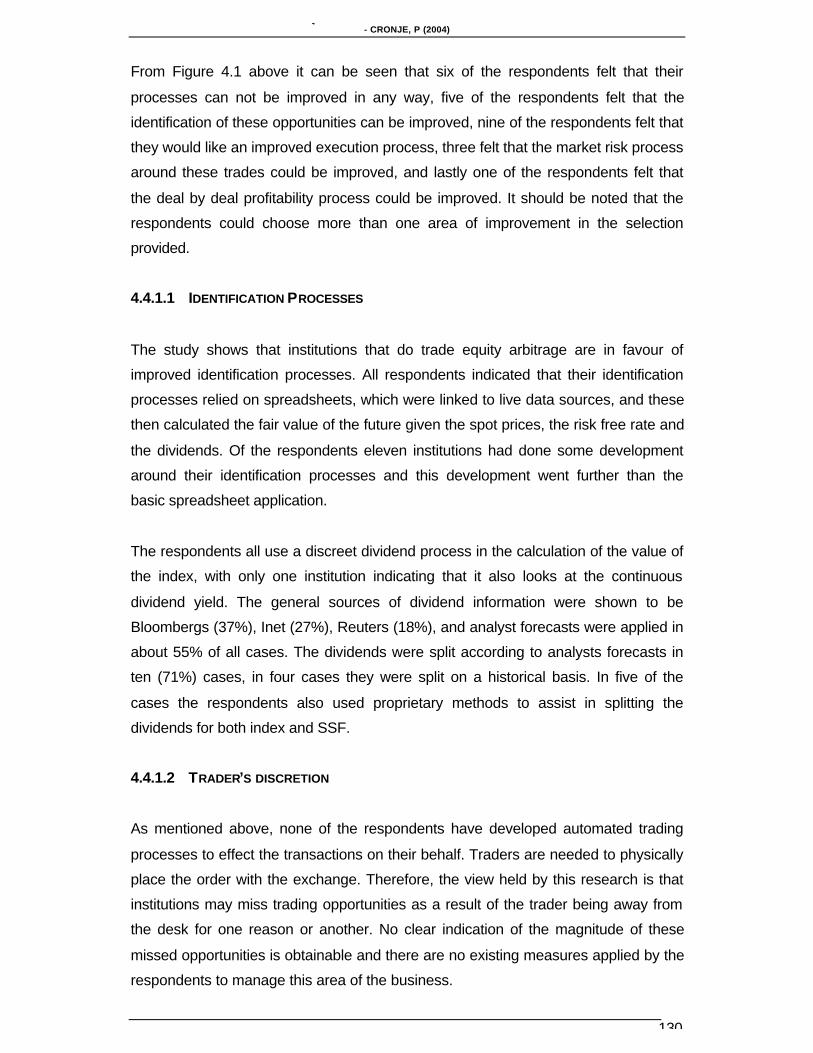
Figure 4.1 Views on improving futures arbitrage trading...........................................129
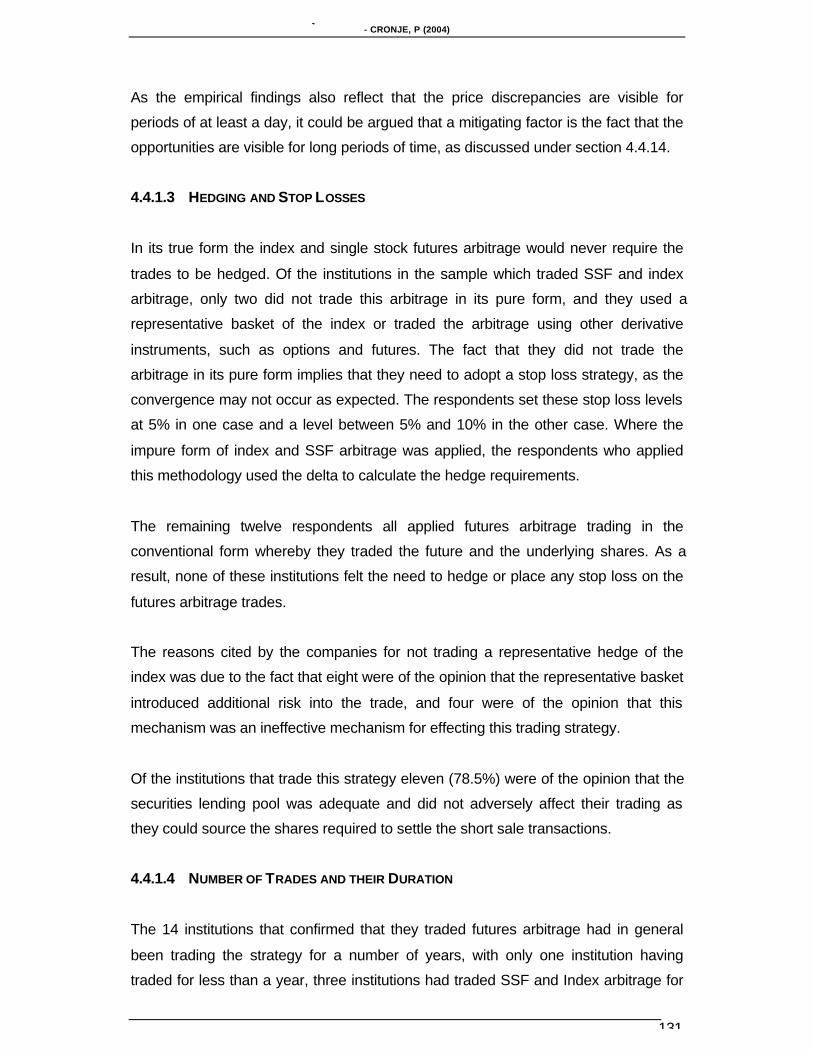
Figure 4.2 Futures arbitrage trading duration............................................................132
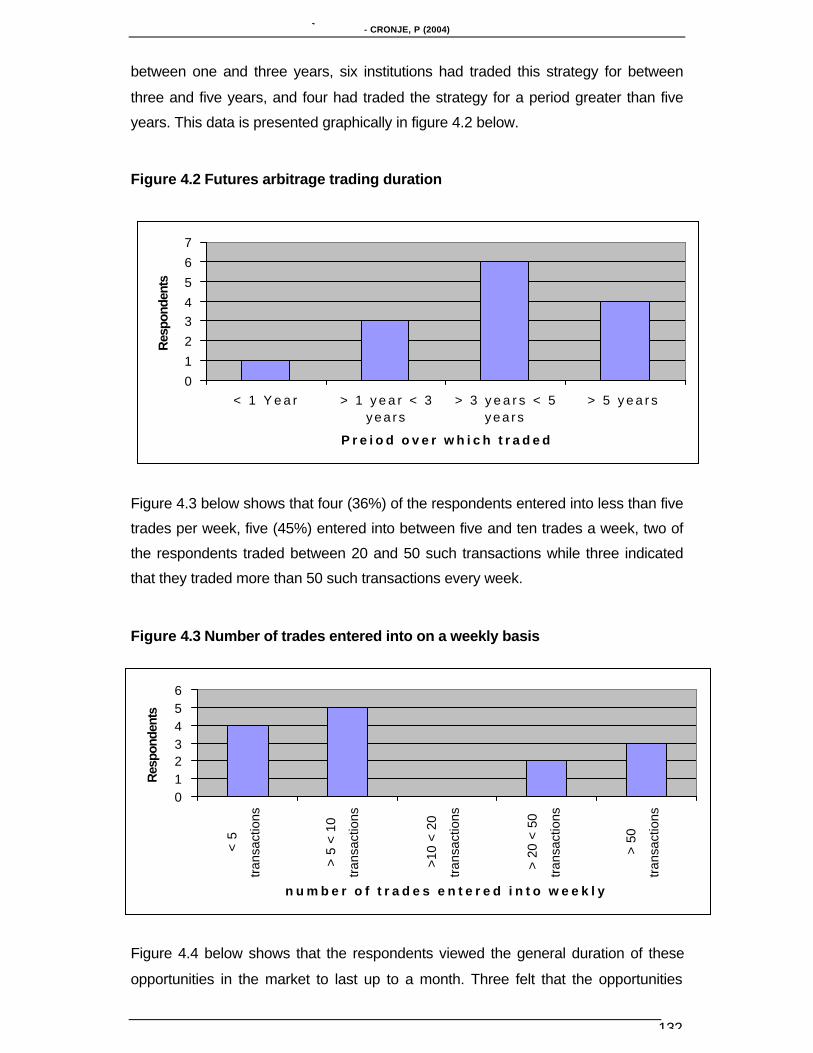
Figure 4.3 Number of trades entered into on a weekly basis ...................................132
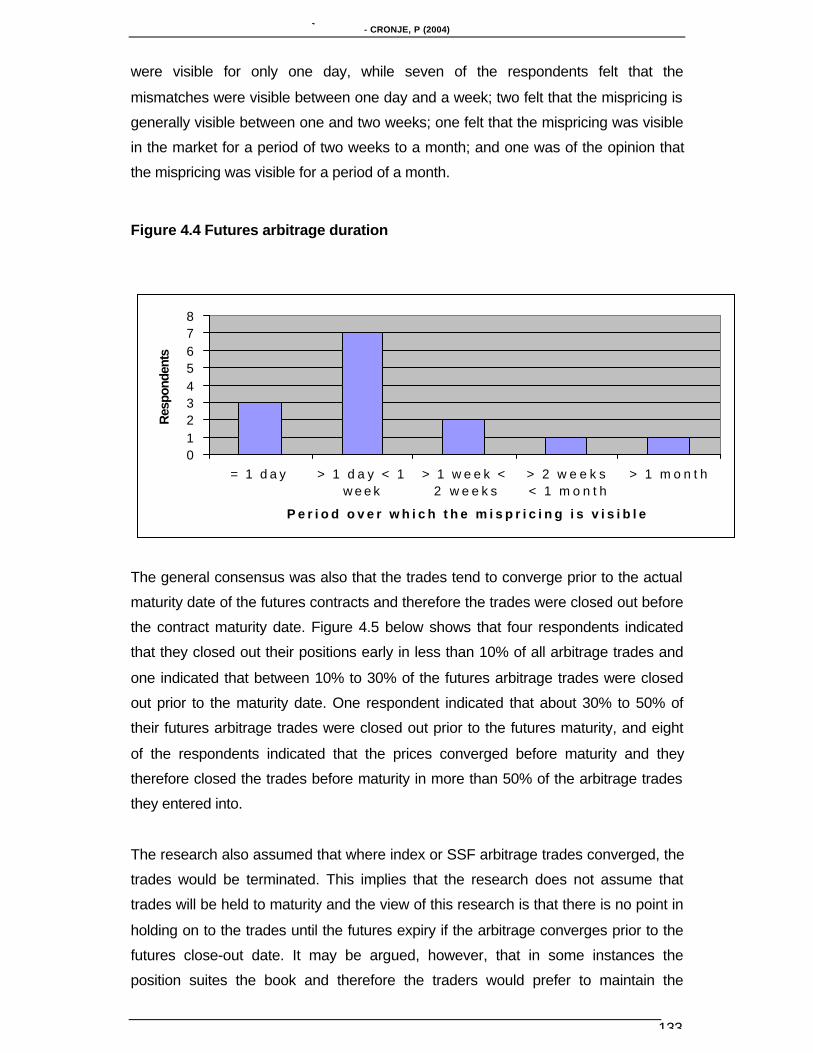
Figure 4.4 Futures arbitrage duration ........................................................................133
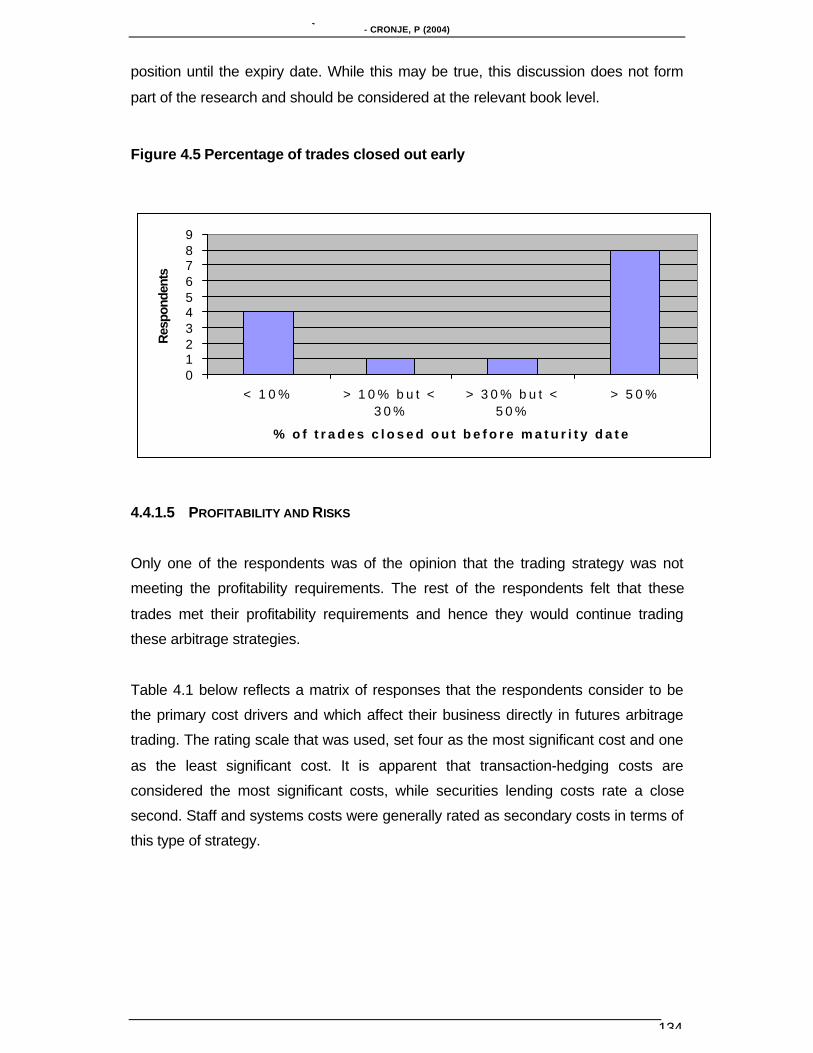
Figure 4.5 Percentage of trades closed out early......................................................134
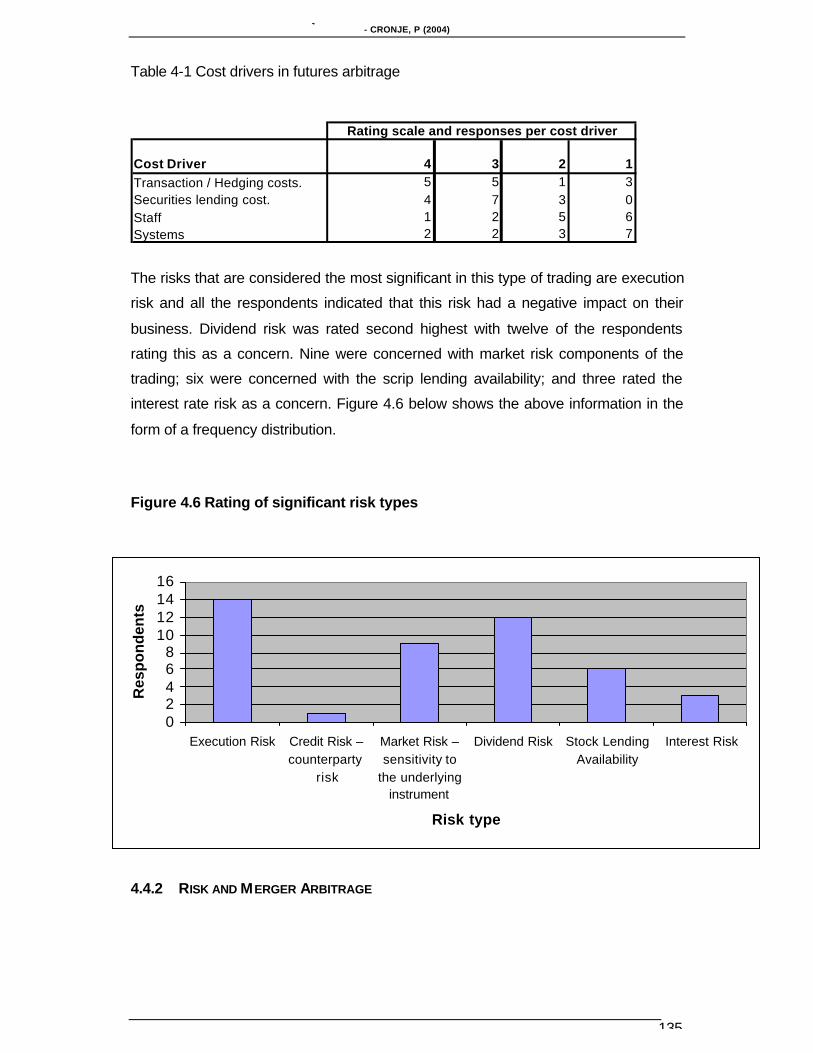
Figure 4.6 Rating of significant risk types..................................................................135
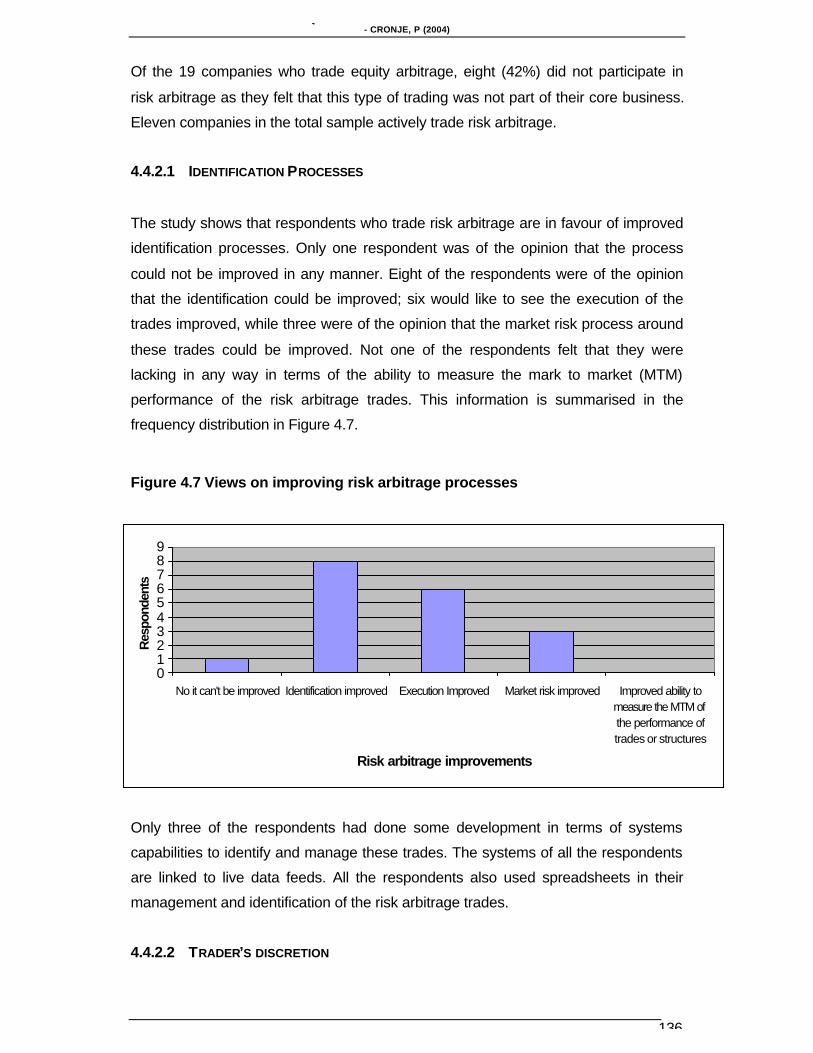
Figure 4.7 Views on improving risk arbitrage processes ..........................................136
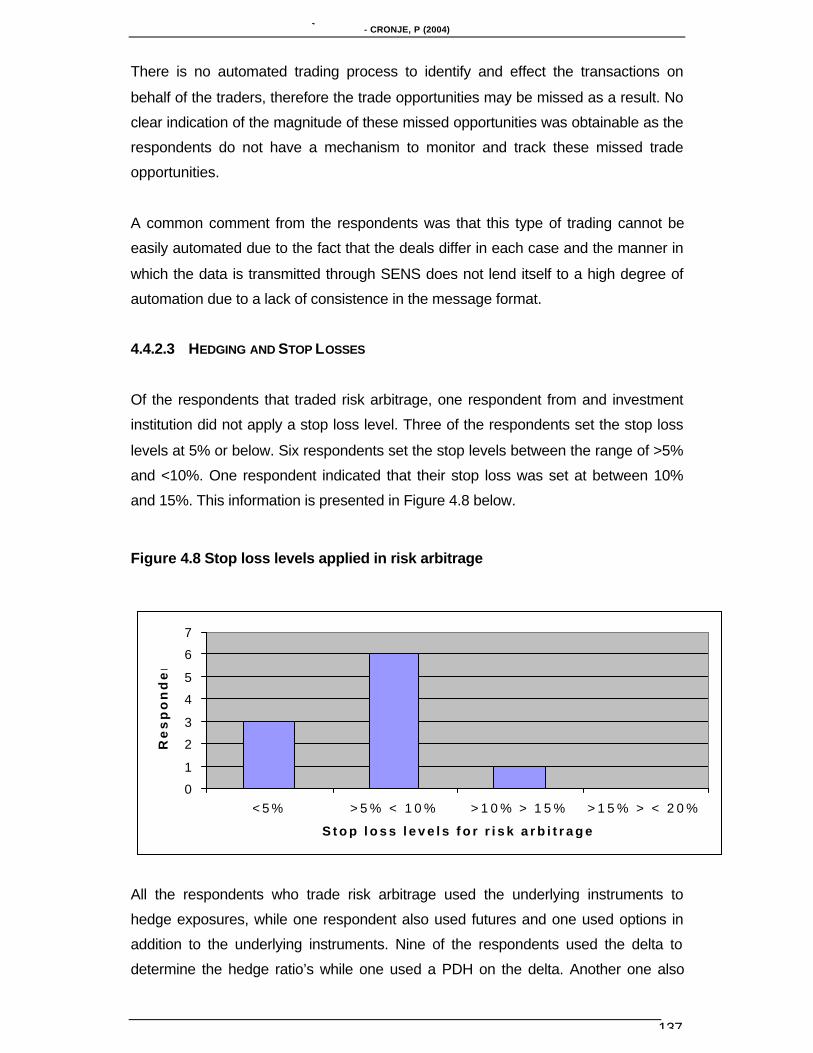
Figure 4.8 Stop loss levels applied in risk arbitrage..................................................137
Figure 4.9 Time the respondents have traded risk arbitrage....................................138
Figure 4.10 Duration of risk arbitrage opportunities in the market............................139
Figure 4.11 Risks that are considered meaningful in risk arbitrage..........................139
Figure 4.12 Deal success, failure and profitability in risk arbitrage...........................140
Figure 4.13 Respondents’ reasons why dual listed arbitrage is not traded..............141
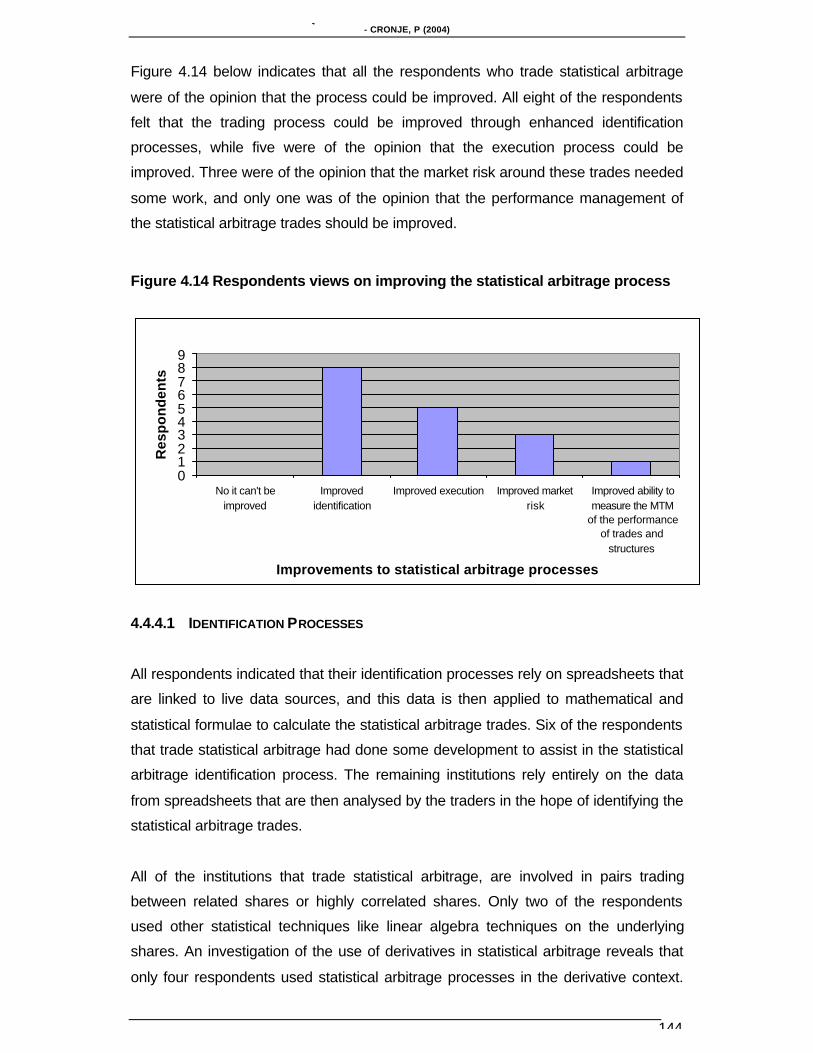
Figure 4.14 Respondents views on improving the statistical arbitrage process ......144
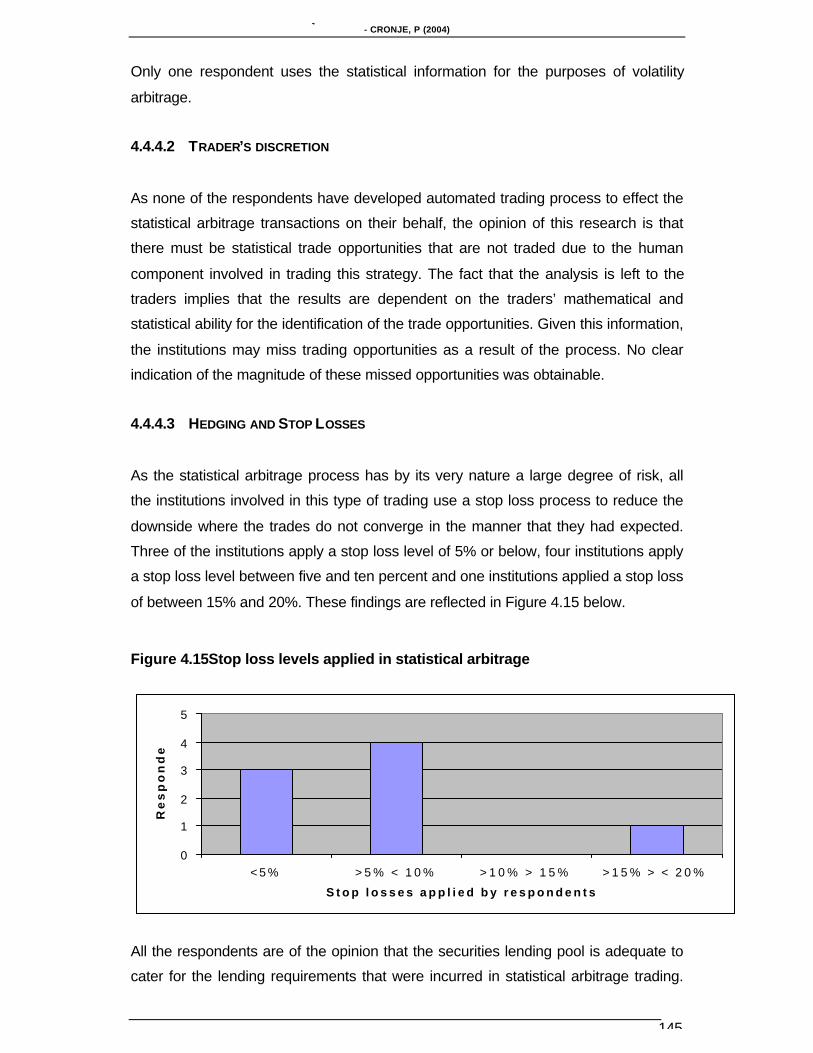
Figure 4.15Stop loss levels applied in statistical arbitrage........................................145
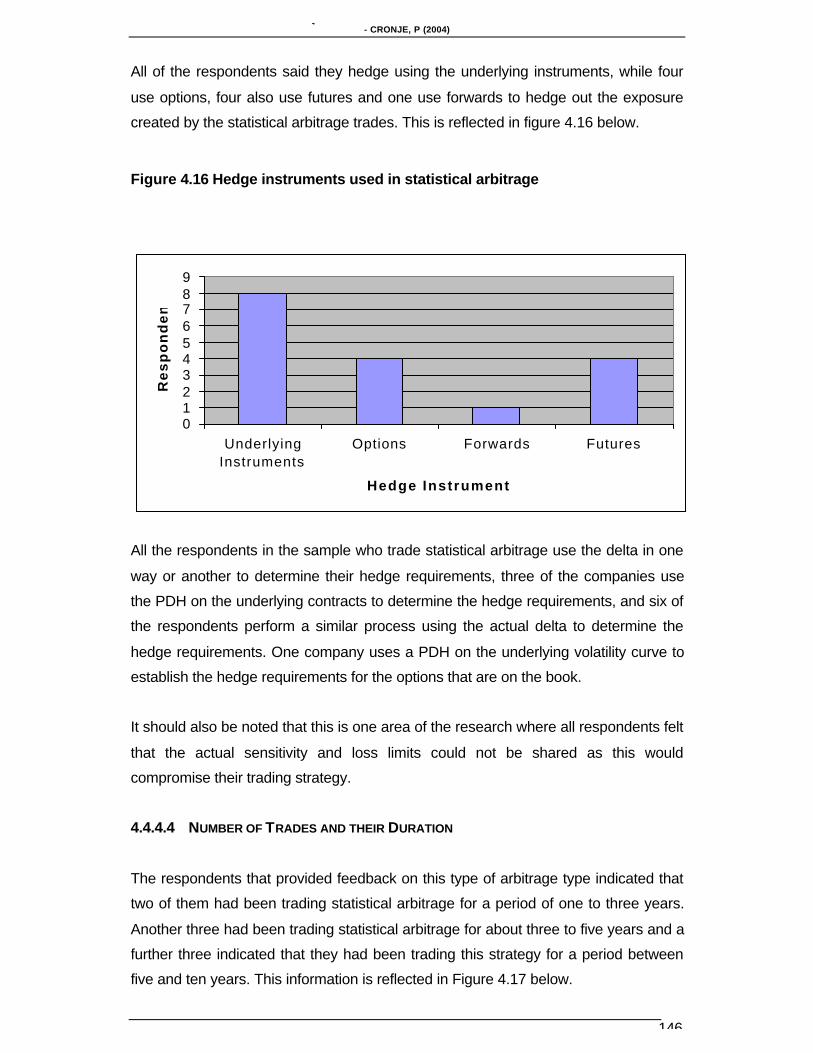
Figure 4.16 Hedge instruments used in statistical arbitrage.....................................146
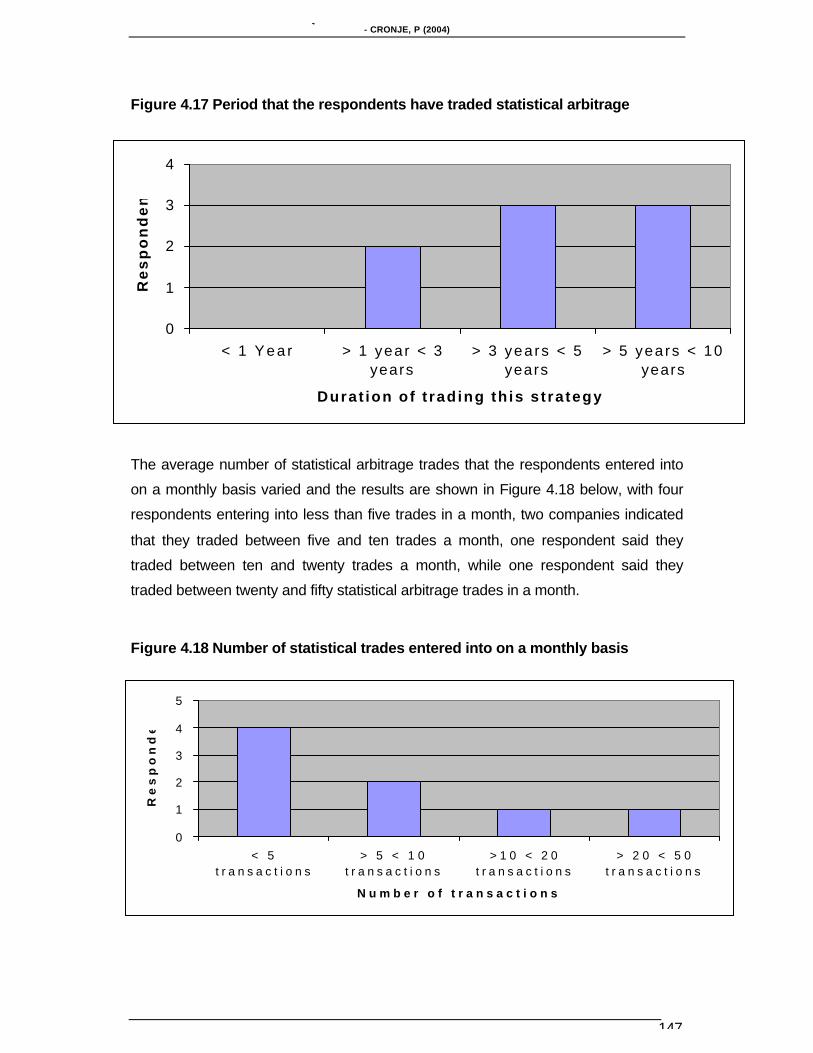
Figure 4.17 Period that the respondents have traded statistical arbitrage...............147
Figure 4.18 Number of statistical trades entered into on a monthly basis................147
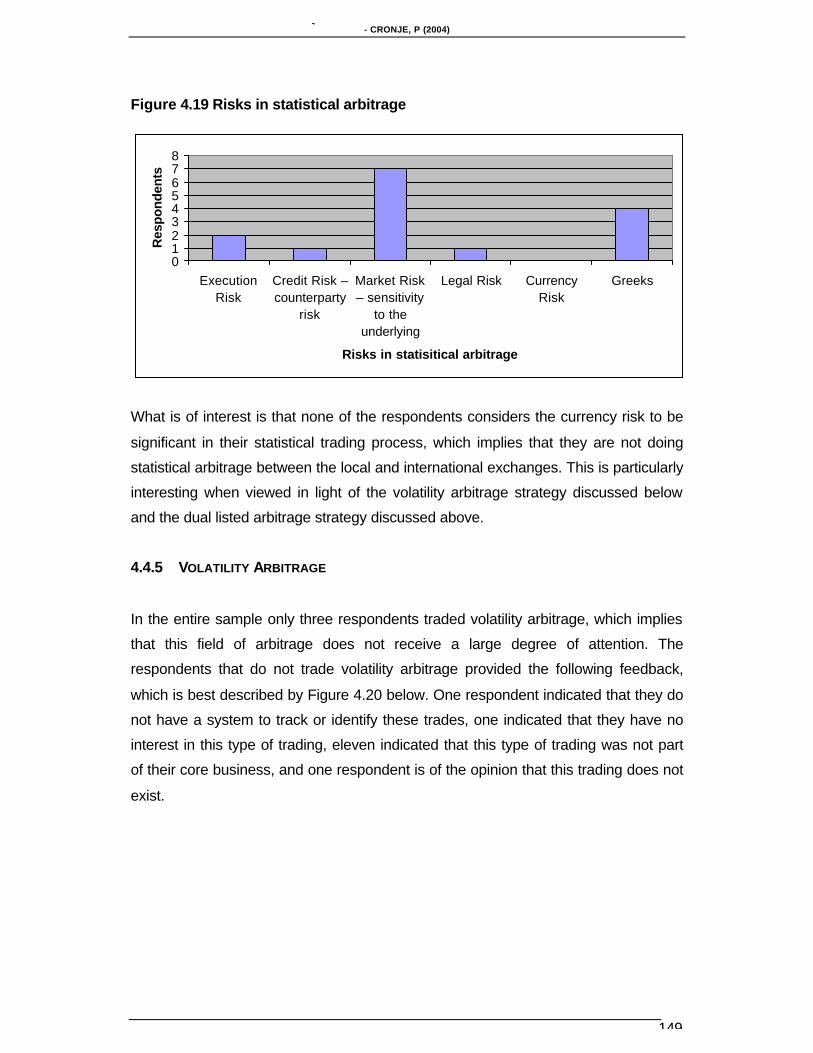
Figure 4.19 Risks in statistical arbitrage....................................................................149
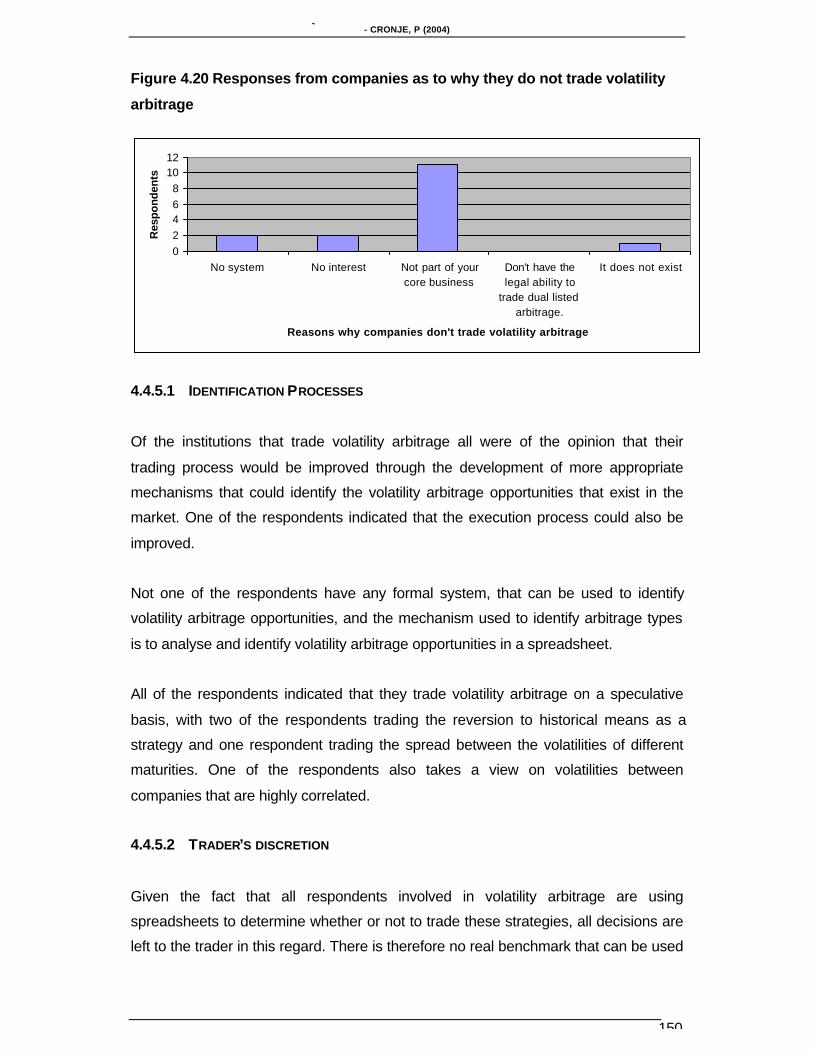
Figure 4.20 Responses from companies as to why they do not trade volatility
arbitrage..............................................................................................................150
Page 15
MANAGING PURE AND STATISTICAL EQUITY ARBITRAGE OPPORTUNITIES WITHIN THE SOUTH AFRICAN ENVIRONMENT- CRONJE, P (2004)
xv
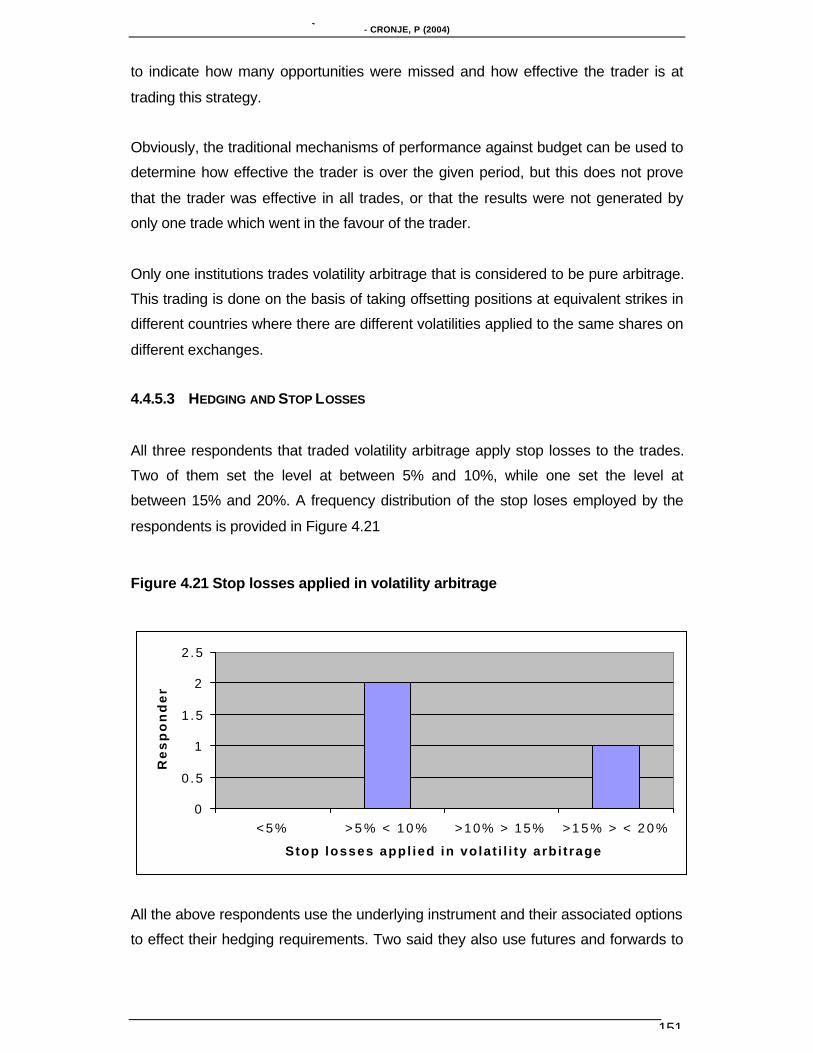
Figure 4.21 Stop losses applied in volatility arbitrage ...............................................151
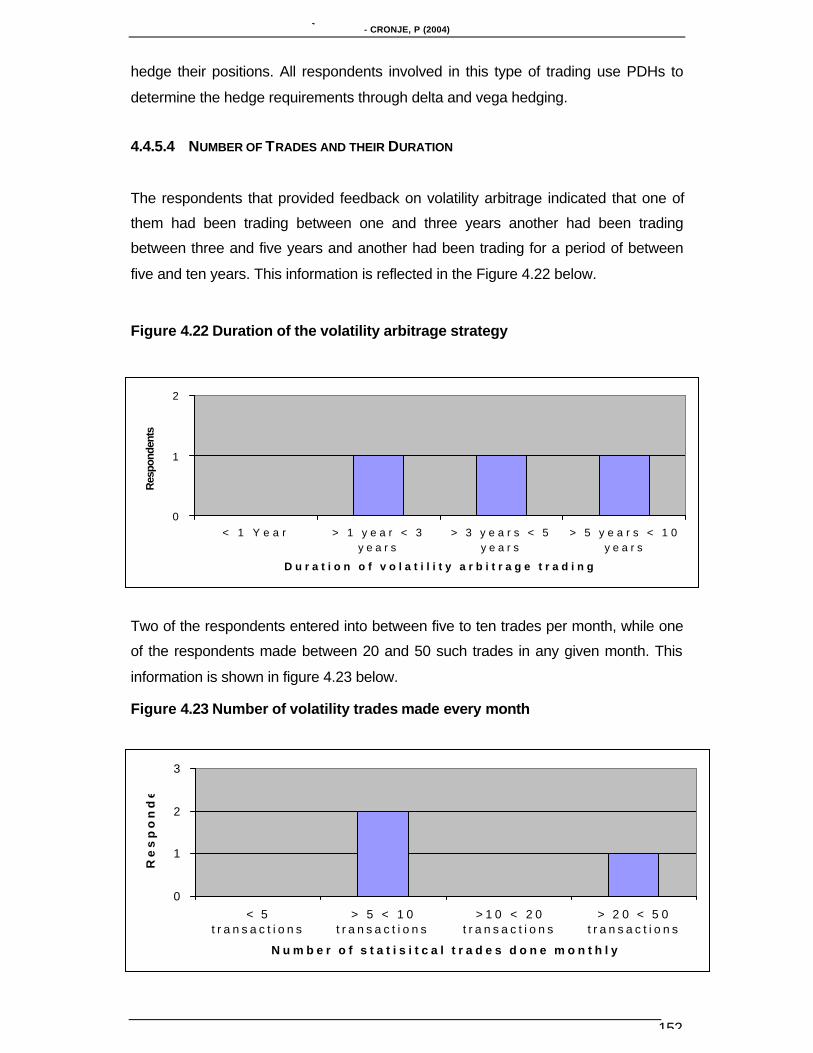
Figure 4.22 Duration of the volatility arbitrage strategy.............................................152
Figure 4.23 Number of volatility trades made every month ......................................152
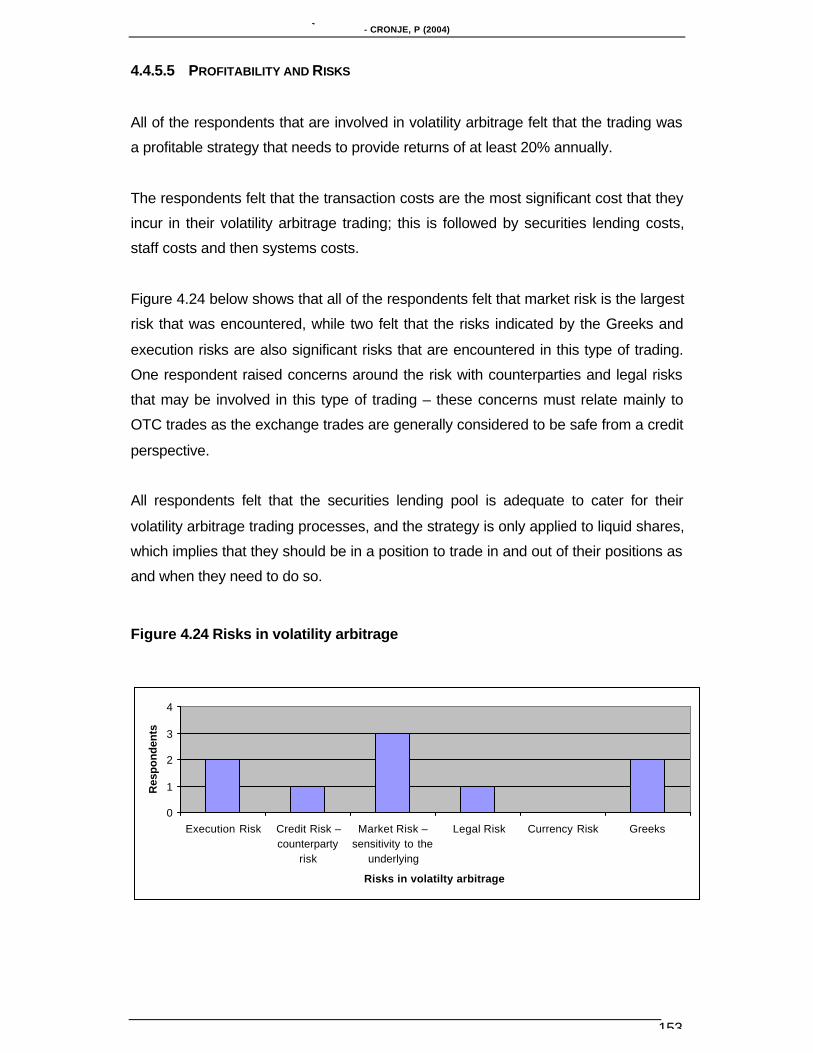
Figure 4.24 Risks in volatility arbitrage......................................................................153
Figure 4.25 Number of equity arbitrage traders employed per firm..........................157
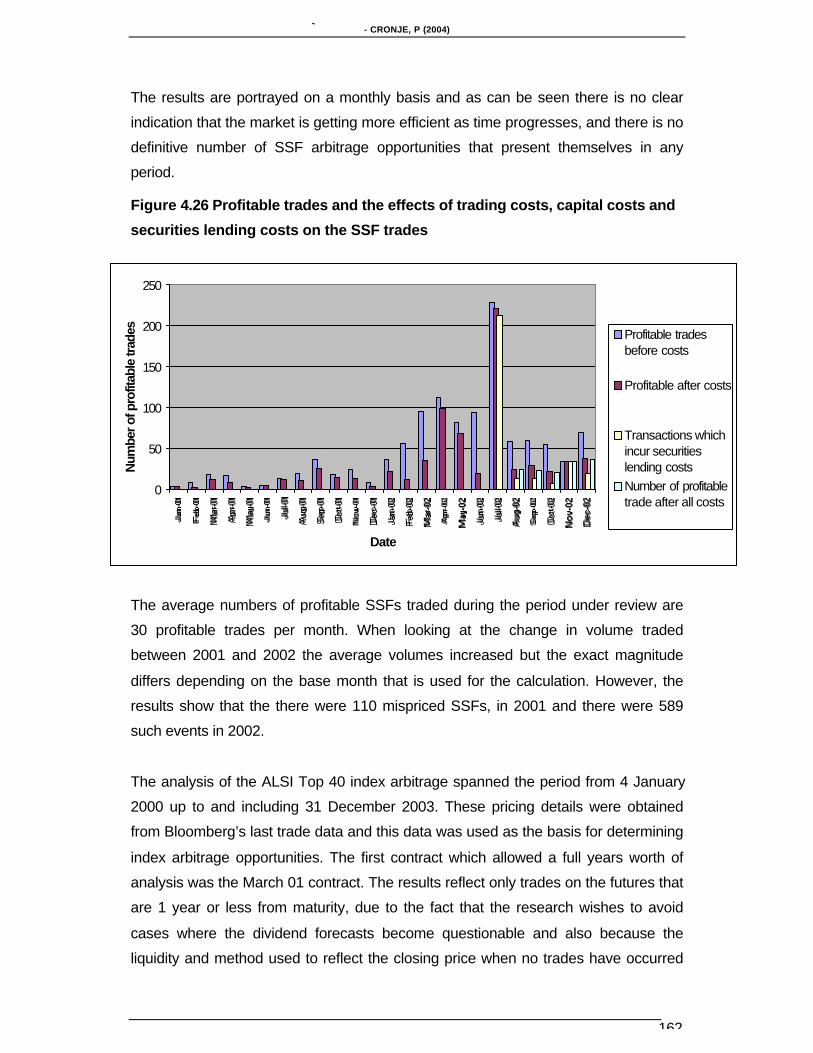
Figure 4.26 Profitable trades and the effects of trading costs, capital costs and
securities lending costs on the SSF trades........................................................162
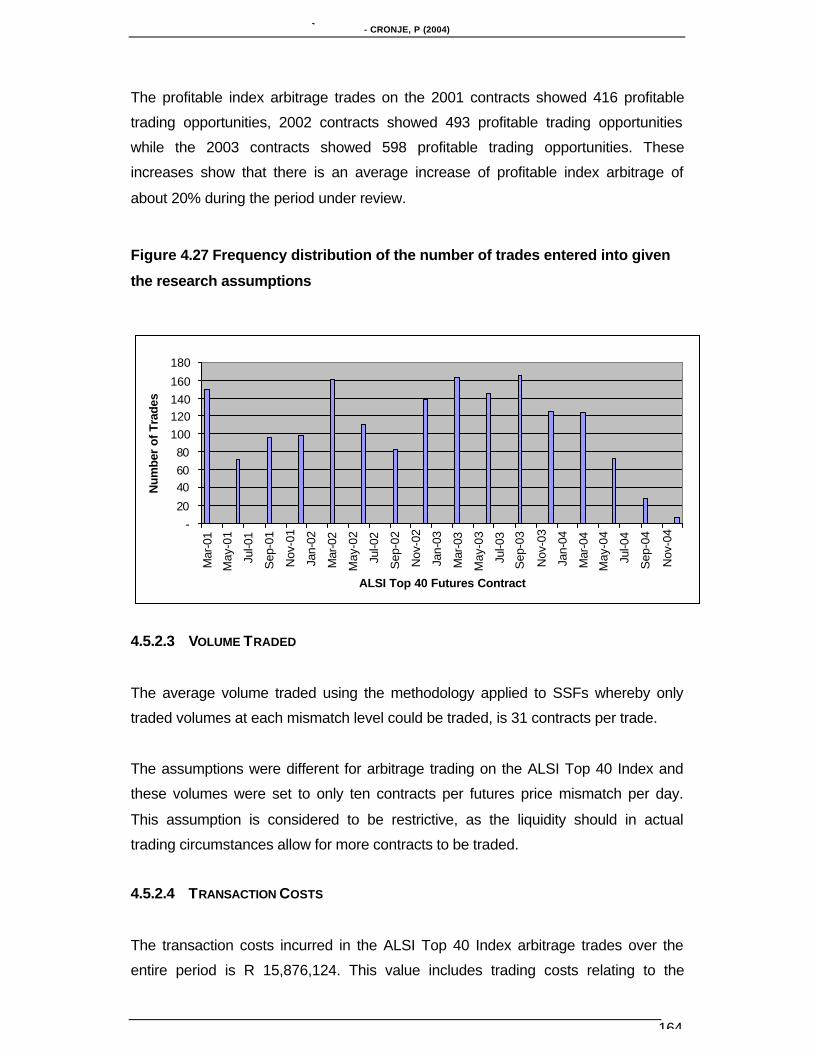
Figure 4.27 Frequency distribution of the number of trades entered into given the
research assumptions ........................................................................................164
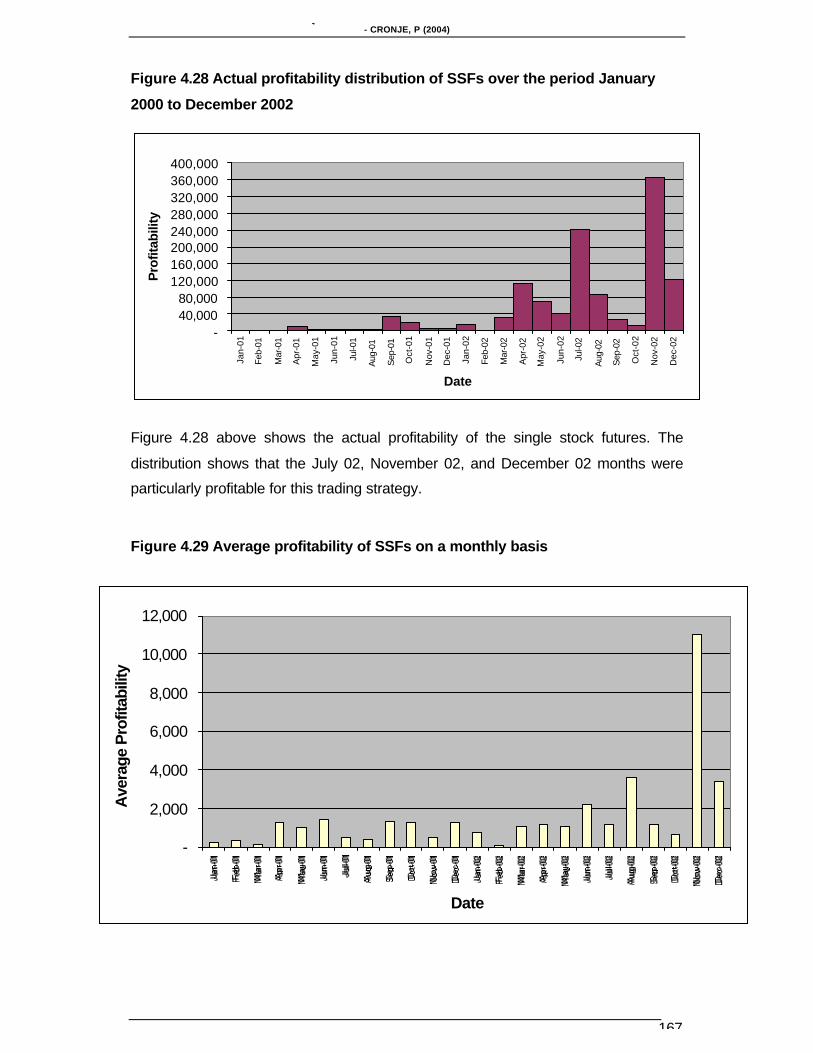
Figure 4.28 Actual profitability distribution of SSFs over the period January 2000 to
December 2002 ..................................................................................................167
Figure 4.29 Average profitability of SSFs on a monthly basis ..................................167
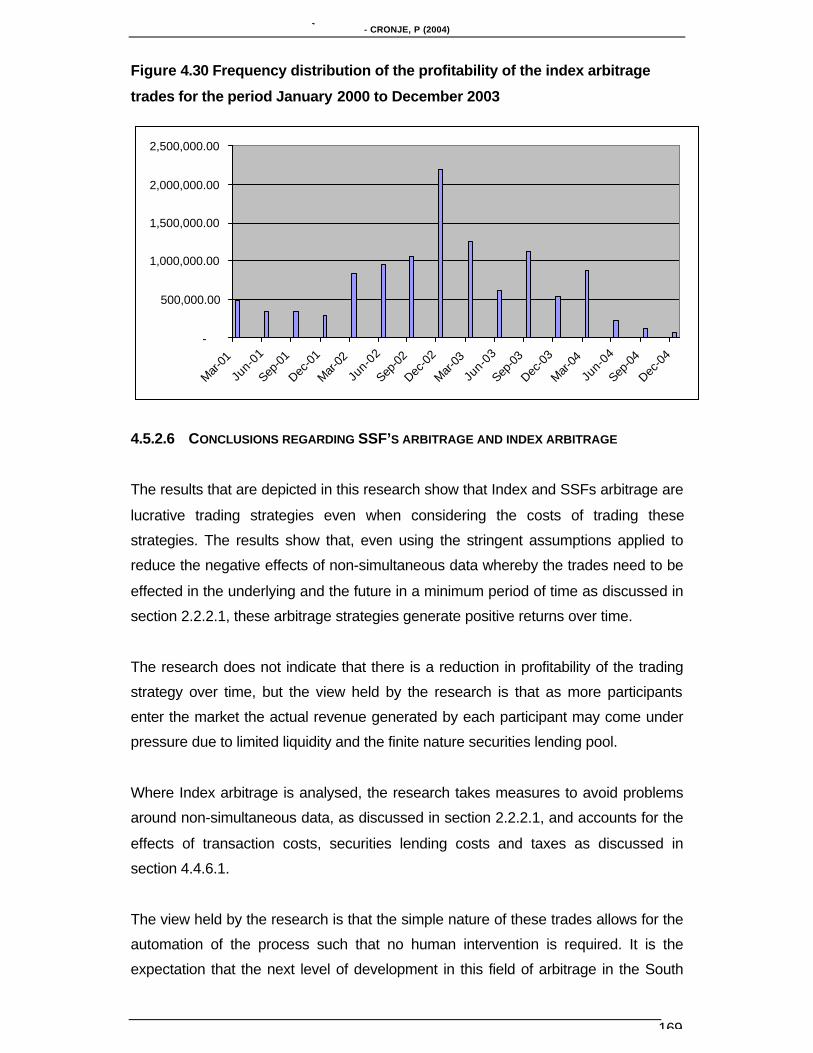
Figure 4.30 Frequency distribution of the profitability of the index arbitrage trades for
the period January 2000 to December 2003......................................................169
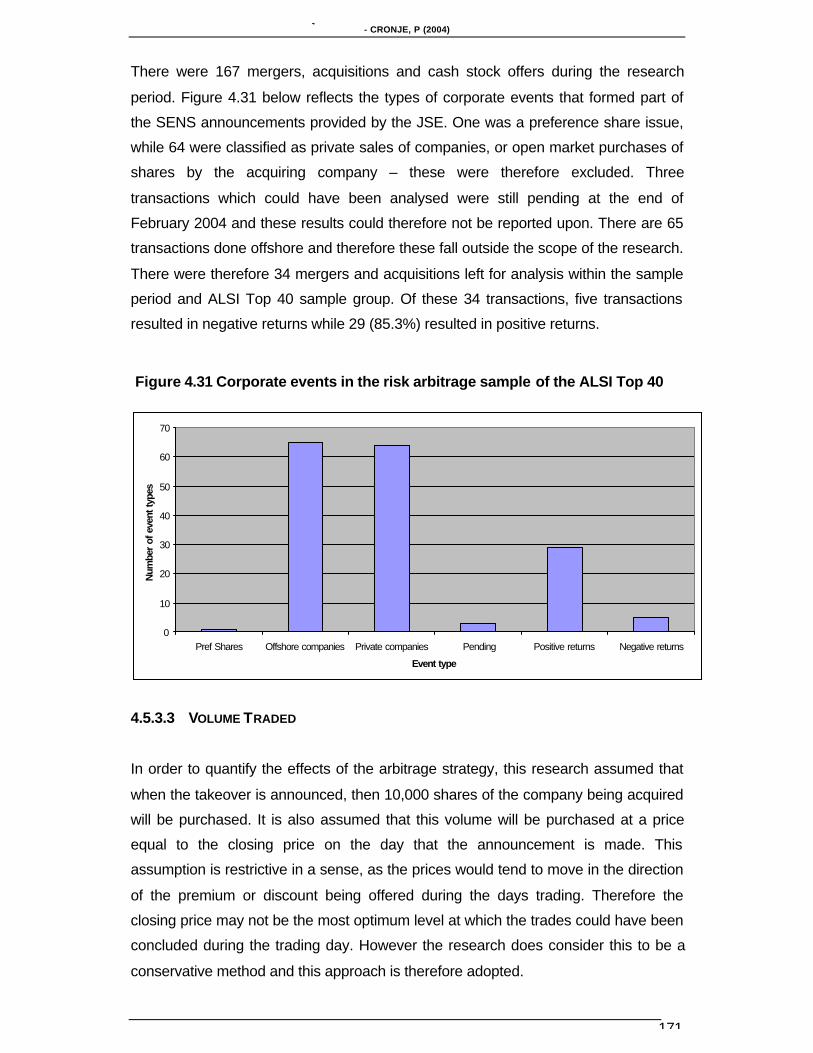
Figure 4.31 Corporate events in the risk arbitrage sample of the ALSI Top 40 ......171
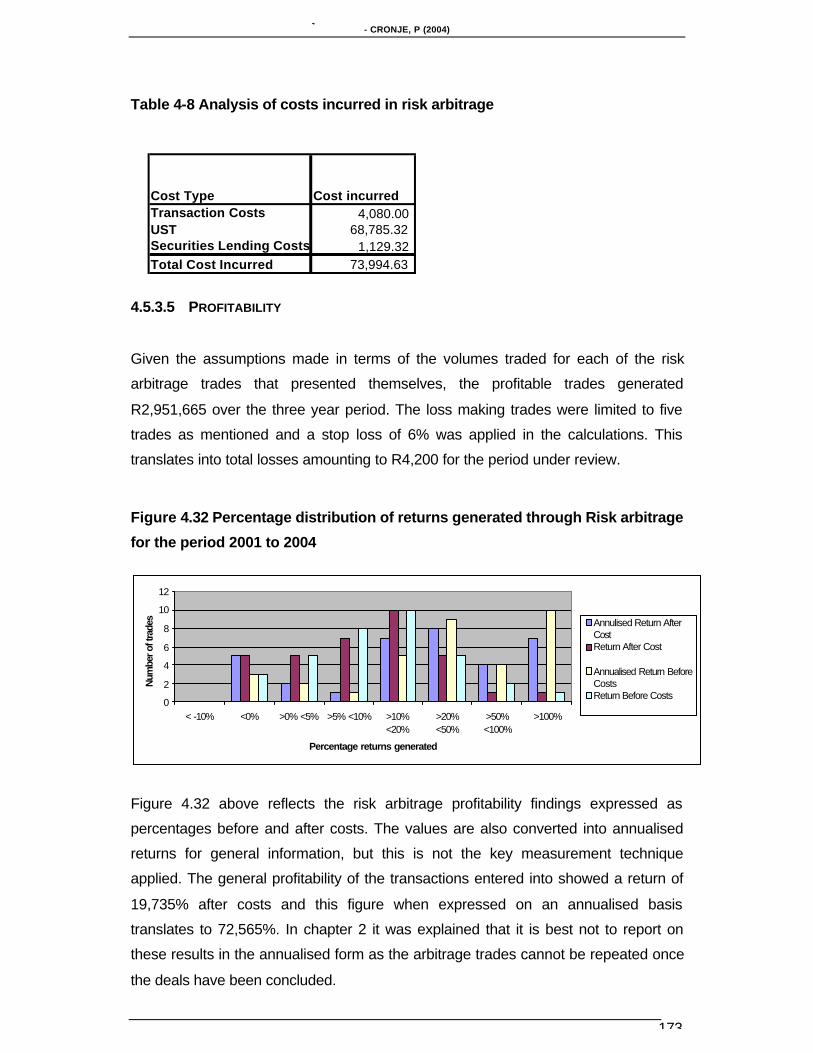
Figure 4.32 Percentage distribution of returns generated through Risk arbitrage for
the period 2001 to 2004......................................................................................173
Figure 4.33 Distribution of the dual listed arbitrage trades over the sample period .176
Figure 4.34 Profitability distribution of the dual listed arbitrage trades over the sample
period ..................................................................................................................178
Figure 5.1 Proposed Arbitrage feasibility process ....................................................195
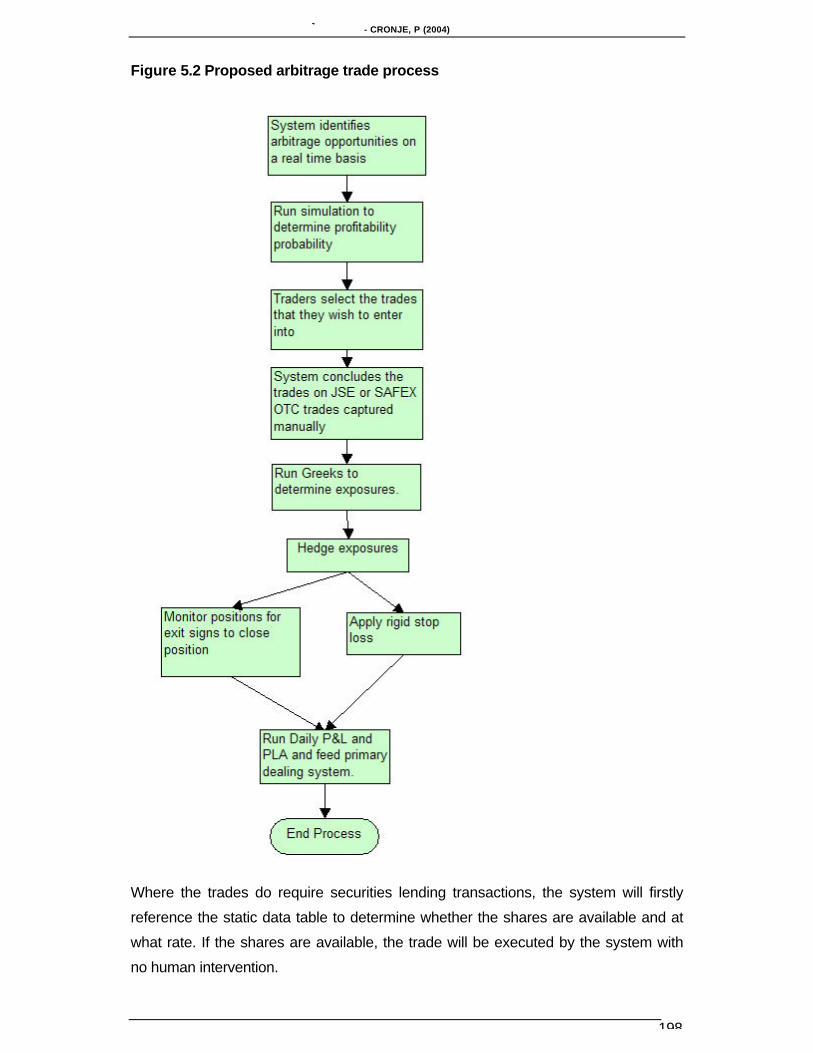
Figure 5.2 Proposed arbitrage trade process ...........................................................198
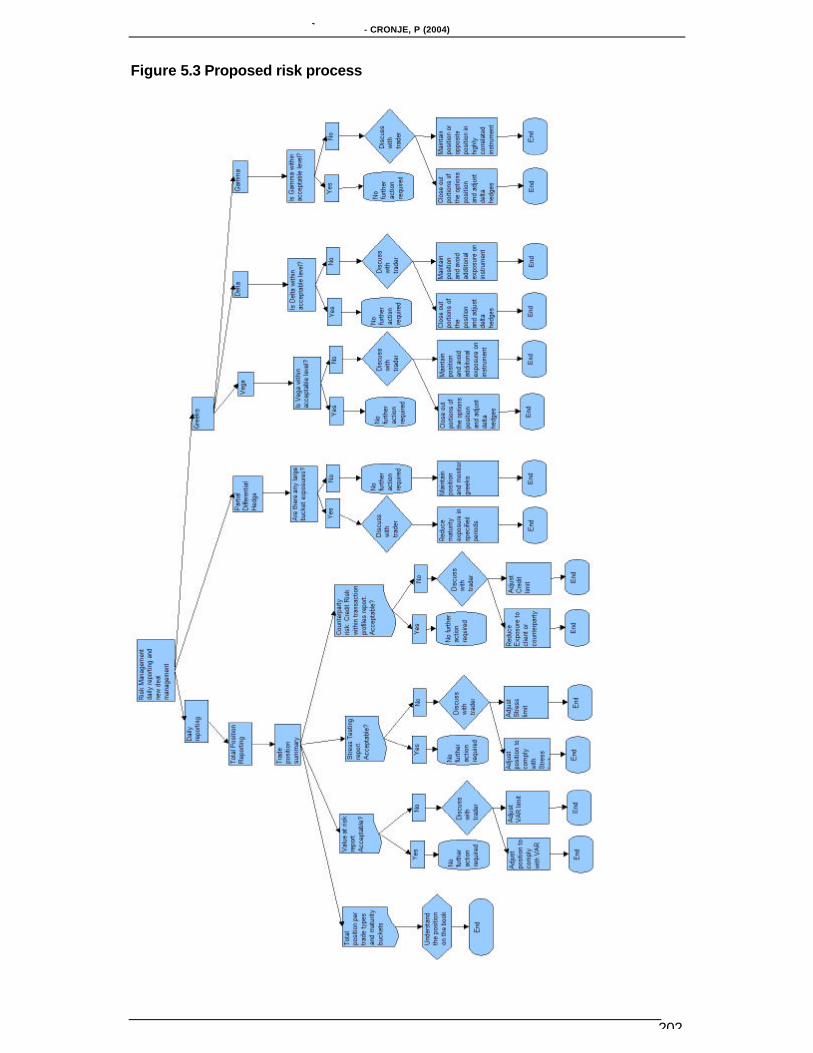
Figure 5.3 Proposed risk process..............................................................................202
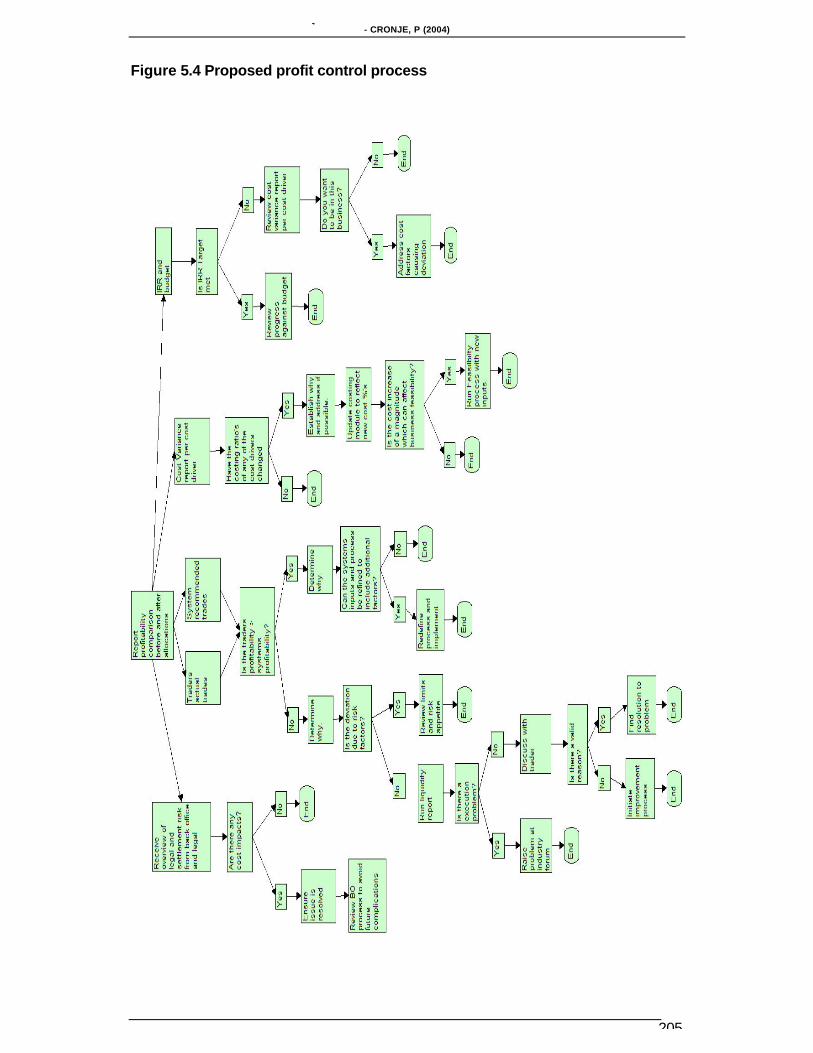
Figure 5.4 Proposed profit control process ...............................................................205
Figure 5.5 The number of profitable and non profitable trades at each threshold....210
Page 16
MANAGING PURE AND STATISTICAL EQUITY ARBITRAGE OPPORTUNITIES WITHIN THE SOUTH AFRICAN ENVIRONMENT- CRONJE, P (2004)
1
CHAPTER 1
1. INTRODUCTION
1.1 BACKGROUND
The concepts which underpin derivative contracts have been used for centuries and
can be traced back to articles relating to the Tulip futures market, which developed in
Holland in the 17th century. In the 20th century, the global financial markets have
undergone dramatic changes and shocks, as a direct result of the proliferation of
derivative instruments. The general acceptance of derivative instruments into the
financial structures of the global marketplace started in the mid nineteen hundreds,
through the introduction of currency futures markets. These futures markets were
followed by the development of interest rate products such as forward rate
agreements (FRAs) and swaps. The trading of options was formally introduced with
the creation of a standardised means to price these instruments, which was provided
by Fisher Black and Myron Scholes (1973) through the Black Scholes Model. Equity
derivatives were the next phase in the derivative evolution and were followed by the
most current derivative paradigms, namely credit derivatives and exotic derivatives.
Miller (1997:4-7) ascribes the “derivative revolution” to one or a combination of the
following factors:
• The move to floating exchange rate systems from the Bretton Woods financial
system allowed currencies to better reflect their true value and provided impetus
for larger currency futures markets.
• The development of computers and information technology allowed for improved
communication and the ability to easily price derivative structures within the global
market place.
• The regulation and in some cases the deregulation of derivative instruments,
provided further impetus to the derivative evolution.
In the South African context, the introduction of financial derivatives was only partially
inhibited by the country’s global isolation resulting from the United Nations sanctions,
which ended in 1994. Following South Africa’s formal reintroduction into the global
economy, product developments by financial institutions in the field of financial
derivatives have allowed them to effectively integrate into the global environment.
The economy does, however, still suffer from certain regulatory constraints, which
Page 17
MANAGING PURE AND STATISTICAL EQUITY ARBITRAGE OPPORTUNITIES WITHIN THE SOUTH AFRICAN ENVIRONMENT- CRONJE, P (2004)
2
impede its ability to effectively compete with other economies in the world. These
constraints include exchange control regulations, which inhibit the market from freely
competing in a true market type environment. This interventionist approach also
impacts on the product ranges, which the institutions may put forward to their clients.
The South African economy is categorised as a developing economy and a
developing country by rating agencies such as Moody’s and Standard and Poor’s. On
the 25 February 2000 South Africa’s country rating was upgraded by Standard and
Poor’s to a BBB and was then again upgraded to a BBB “Stable” rating in May 2003
according to Bloomberg sources. While these upgrades were considered to be
extremely positive for the country, the essence of this developing country status is,
however, still indicative of the fact that South Africa suffers from the dilemmas that
usually burden the developing nations.
Inflation and currency instability are examples of factors that negatively affect the
South African economy and its financial markets, according to the South African
Reserve Bank (2002). More specifically, traders in the South African financial
markets often cite the lack of liquidity as a cause of the market’s inefficiency. This
lack of liquidity directly affects market depth and is combined with high levels of
volatility within the equity trading environment. Additional complications which are
often cited are that the exogenous factors which influence the economy are not in the
government’s direct control. The emerging market economies, which are going
through a period of economic instability, may therefore be the cause of South Africa’s
economic instability. Recent examples of these regional exogenous factors would
include the controversial land reform programmes adopted by Zimbabwe, which
destabilise the Southern African Development Community (SADEC). Further afield
the economic instability seen in Argentina and Brazil in the period May to June 2002
affected the South African Rand and had a detrimental impact on the bond markets,
with the Emerging Bond Market index spreads widening from about 800 to about
1200 during this period, according to Bloomberg’s data. This widening of the spreads
was due to bonds from emerging markets being sold off by international investors
during the emerging market crises. These and many other factors affect the way the
developed world views developing countries and their inherent risks.
Developing nations are considered more risky than their developed nation
counterparts; therefore, when dealing in developing countries, it is standard practice
for traders to deal at a risk-adjusted level, which aims to compensate investors for
Page 18
MANAGING PURE AND STATISTICAL EQUITY ARBITRAGE OPPORTUNITIES WITHIN THE SOUTH AFRICAN ENVIRONMENT- CRONJE, P (2004)
3
the greater levels of risk they face within such environments. These increased
returns are visible in the larger trading spreads observed in developing countries and
therefore where prices are quoted at the incorrect levels, this mispricing could result
in extremely profitable arbitrage opportunities.
Developed markets have adapted to take advantage of these situations by exploiting
these price disparities, which in turn help the markets to remain efficient. These
arbitrage operations therefore help to create a market that tends towards a form of
market efficiency as described by the Efficient Market Hypothesis discussed by Rielly
and Brown (1997:208). Research has shown that the international arbitrage funds,
such as Royal Bank of Canada ARC Fund Limited, and specialist companies, such
as GIB Inc., are providing returns in excess of those provided by the market in
general as a result of arbitrage trading. This has resulted in global institutions writing
systems that would enable them to automate some portions of their arbitrage trading
operations.
The South African financial market has developed the ability to deal with the common
types of pure arbitrage situations that are present within the market. As with the
international markets, the exploitation of the arbitrage opportunities helps to bring
about a greater degree of efficiency within the South African market. In preliminary
discussions and interviews held with South African banking groups and risk
consulting institutions, it was however determined that the systems that are used in
South African arbitrage operations are rather crude and the processes are manual in
their identification and execution.
1.2 PROBLEM STATEMENT
The South African financial market is classified as an emerging market within the
global economy. Global trends have shown that these types of environments tend to
provide excess returns through market inefficiencies, which may be capitalised upon
through arbitrage operations. These opportunities have remained topical since the
late nineteen eighties, as is reflected in an article in the Economist of 21 July 1990
(1990:16) and they are still topical, as is visible in current articles like that of Siew
(2003) which covers .
Initiatives to improve the equity market’s efficiency are visible in the automation that
has been introduced through the introduction of the Share Transactions Totally
Page 19
MANAGING PURE AND STATISTICAL EQUITY ARBITRAGE OPPORTUNITIES WITHIN THE SOUTH AFRICAN ENVIRONMENT- CRONJE, P (2004)
4
Electronic (STRATE) settlement system and the replacement of the Johannesburg
Equities Trading System (JETS) with the Sequence Electronic Trading System
(SETS), according to www.STRATE.co.za [2000?] and www.JSE.co.za [1999?].
Despite these initiatives currency instability combined with liquidity and volatility
factors continue to affect the pricing of South African equities and their associated
derivative instruments. Given the above arguments, the South African financial
market may display a greater degree of disparity between the quoted prices of the
equities and their related derivative instruments. The size of the price disparities
should therefore allow for profitable and sustainable arbitrage operations within the
market in the same manner as those reflected in research relating to the international
markets.
The most effective manner in which to harness these price distortions with the view
to generating a profit while providing adequate risk, profitability and general
management structures are therefore scrutinised. In preliminary interviews with
South African financial institutions, auditing institutions and a risk-consulting firm, it
became apparent that not one of the South African institutions has formally identified
an end-to-end methodology to identify and maximise the profitability of these
arbitrage opportunities over time. In addition to this fact there is currently no known
formal systems development in progress to attempt to provide such an arbitrage
solution which will assist in the management of the arbitrage process.
It seems that the existing models used in the South African environment are
rudimentary and based on quantitative models embedded in spreadsheets which link
to live data sources. The results generated from these spreadsheets are used by the
traders in conjunction with their view of the market prior to entering into the trade.
The validity of the assumptions and the position’s performance is then driven through
the mark to market performance of the desks. No mechanisms are in place to
measure the potential profits or losses that may result by trading all or certain trade
types, and there are only limited mechanisms that can be used to maximise the
returns that are generated through the arbitrage opportunities that may be exploited.
Formal research that has been undertaken in the South African environment does
not cover “Equity Derivative Arbitrage”, and searches of the National Research
Foundation’s (NRF) database netted no results of studies that approach arbitrage
from the perspective that this research will follow. The current and completed studies
do in some cases reference arbitrage, but only through the Arbitrage Pricing Theory
Page 20
MANAGING PURE AND STATISTICAL EQUITY ARBITRAGE OPPORTUNITIES WITHIN THE SOUTH AFRICAN ENVIRONMENT- CRONJE, P (2004)
5
or through dividend arbitrage processes. The formal management process of
arbitrage trading within a treasury environment has not received any research focus
to date.
Within the international environment, discussions with representatives of
multinational investment banks highlighted the fact that they are developing limited
treasury structures and systems capabilities usually referred to as programme
trading, that are aimed at capitalising on pure arbitrage concepts and to a limited
degree statistical arbitrage concepts. In these cases the system can follow a rigid
pricing process, which allows it to act without human supervision (Business Week.
1989:186; Board & Sutcliffe (1996:29). These arbitrage strategies are generally fairly
simple and generic in nature and include index, single stock futures and dual listed
arbitrage opportunities.
These preliminary interviews also highlighted the fact that the automation of
processes by international companies do not span the entire range of arbitrage
opportunities and do not provide an intelligent and efficient manner in which the
business could analyse the relative profitability of arbitrage opportunities or the
trader’s effectiveness. This situation is aggravated by a tendency to segment the
arbitrage trading into specialist areas within the business. The rebate arbitrage, for
example, was generally managed out of the structured finance areas and is not
grouped with the general arbitrage processes. This implies that the profits from these
operations are separated from the mainstream arbitrage operations and there is no
structured manner to ensure that all opportunities are being capitalised upon by the
business.
The shortcomings encountered in the international processes are even more
pronounced in the South African environment, where the arbitrage operations are
often totally removed from one another and the methodology used to manage the
profitability, risks and trading opportunities are even more unstructured due to the
dispersion of the functions. Furthermore, the more risky types of arbitrage, such as
statistical and volatility arbitrage, may have received some attention internationally
but this information is considered proprietary in most cases and has therefore not
received the research attention that it may deserve.
Page 21
MANAGING PURE AND STATISTICAL EQUITY ARBITRAGE OPPORTUNITIES WITHIN THE SOUTH AFRICAN ENVIRONMENT- CRONJE, P (2004)
6
1.3 PURPOSE OF THE RESEARCH
The analysis undertaken, firstly aims to identify the extent to which equities, their
indexes and equity derivatives such as futures and options are priced in accordance
with their fair value. Secondly, presuming that the traded values of the instruments do
not in all instances equate to the fair value, the research aims to develop an effective
means to identify and manage profitable opportunities arising from the mispricing.
While the research is focused on the South African environment, this structured
approach to the management of arbitrage, as proposed by this research, will find
application in both the developed and developing markets of the world. This is due to
the fact that the extent of the management techniques will stretch beyond those that
have been covered in existing studies and systems developments that have been
initiated within the global market.
The broader focus of this research will therefore include the business structures that
would most effectively enable the management, control and improvement of the
arbitrage opportunities. General concepts relating to profitability, trade identification,
risk and a continuous improvement of the process will be addressed. This will include
recommendations on a management process, which provides a methodology for
managing the trading and resulting risks through a structured reporting process,
which will allow a clear view on the positions that make up the arbitrage book.
This holistic approach to managing arbitrage trading appears to be unique within the
existing literature, systems developments and trading structures that are visible
globally. Furthermore, the analysis into statistical and volatility arbitrage opportunities
is currently embryonic in the global market place, resulting either in a lack of
research, systems and methodologies or in such research, systems and
methodologies being proprietary and therefore not part of the existing literature.
The methodology described to manage and maximise the returns of the more
complex statistical arbitrage types will also provide the fundamental first steps
needed to bring the management of these opportunities to the research forefront for
equity and equity derivatives trading businesses in all markets.
The enhanced ability to manage the arbitrage business will allow the business to
apply better governance to its arbitrage trading practice due to the fact that the
Page 22
MANAGING PURE AND STATISTICAL EQUITY ARBITRAGE OPPORTUNITIES WITHIN THE SOUTH AFRICAN ENVIRONMENT- CRONJE, P (2004)
7
inherent risks associated with these trading strategies can be clearly understood and
managed according to the risk profile associated with each arbitrage type. This is in
contrast with the common methodology, which simply adds these risks to the general
equity risk positions. The improved risk processes in addition to cost savings,
generated through automation and the effective management of the profit generation
and human resources, assists in the greater aims of the businesses as it provides a
methodology for long term profit maximisation and therefore shareholder wealth
maximisation.
1.4 METHODOLOGY
The research will firstly consist of a literature review that provides the arbitrage
pricing and process principles that are followed in both the international and South
African financial markets. This section is crucial in providing the practical and
quantitative methodologies that will be applied in the time series research that will be
conducted. The literature will also provide details of studies relating to research and
trends in treasury management that have been published globally.
The literature will also focus on the arbitrage types that will be analysed. The core
arbitrage types that are analysed are index arbitrage, single stock futures arbitrage,
risk arbitrage, statistical arbitrage, volatility and dual listed arbitrage.
In addition to the literature study, the research will consist of empirical research that
will consider two aspects. Firstly, the methodologies that are followed by the South
African financial institutions that have an interest in this type of operation will be
researched. This information will be gathered through research questionnaires sent
to banks, investment institutions, pension funds and stockbrokers that were
surveyed. The commonality and extent of their arbitrage processes are discussed
against the backdrop of the published approaches to exploiting price disparities.
Secondly, a time series analysis is undertaken to establish the frequency and
magnitude of equity arbitrage opportunities that present themselves in the South
African environment. For the purpose of this research, only equities within the ALSI
Top 40 are analysed, thereby reducing the scope of the research. The underlying
reasoning relates mainly to liquidity constraints and the fact that these are mainly the
counters that have established derivative instruments associated with them.
Furthermore, securities lending will be more likely to cover short positions on these
Page 23
MANAGING PURE AND STATISTICAL EQUITY ARBITRAGE OPPORTUNITIES WITHIN THE SOUTH AFRICAN ENVIRONMENT- CRONJE, P (2004)
8
shares and the lending pool of many of the TOP 40 securities is extended to the dual
listed securities. The fact that the dual listed securities are primarily included in the
ALSI Top 40 Index, also aids the analysis of the dual listed securities in this research.
Finally, an end-to-end process for the management of equity arbitrage opportunities
will be proposed. This process will aim to consolidate the most effective way to
integrate and manage business inception, product and business feasibility,
profitability, risk, trade identification and trading structures.
1.5 STRUCTURE OF THE RESEARCH
Chapter 2 discusses the theory relating to known arbitrage situations in their pure
and statistical forms. This arbitrage theory is viewed in conjunction with the treasury
management structures that relate to equity derivatives and the quantitative theory as
reflected in published literature. The literature discussed is therefore a reflection of
the globally accepted quantitative and trading concepts and processes, that allow for
the successful analysis and utilisation of arbitrage opportunities. This chapter
therefore does not simply serve to highlight derivative theory, but its function is also
to outline the management processes, valuation principles, trading ideas and risk
management concepts that are applied to arbitrage opportunities.
Chapter 3 sets out the research methodology that will apply to the gathering and
interpretation of information in this research. The empirical data will cover the existing
profit control, risk and trading processes and the systems that institutions use in their
efforts to execute arbitrage-trading operations. Therefore the target population,
sampling method and research design applied to conducting the time-series analysis
for the identification of arbitrage opportunities is also explained in this chapter.
Chapter 4 firstly deals with the research findings that relate to the arbitrage
management structures and the actual arbitrage trading processes obtained through
the empirical research. The chapter also reviews the findings of the time series
analysis into the existence of equity arbitrage trading opportunities in the South
African context. This information is expressed as the extent to which the South
African equity and equity derivative instruments are mispriced relative to the
underlying instruments and relative to one another. The chapter goes on to
determine the extent to which these practical trading factors will impair the ability of
the traders to capitalise on the mis-priced instrument sets. The analysis then sets
Page 24
MANAGING PURE AND STATISTICAL EQUITY ARBITRAGE OPPORTUNITIES WITHIN THE SOUTH AFRICAN ENVIRONMENT- CRONJE, P (2004)
9
about using the information gathered in the research findings and compares this
information to the arbitrage management processes that are currently used in the
South African market place. This process allows the research to identify opportunities
which have been overlooked in the market, in addition to identifying the means to
improve the performance of the South African arbitrage paradigm as defined by the
South African institutions which are involved in arbitrage.
Chapter 5 has the objective of delivering an end-to-end approach to the management
of equity arbitrage opportunities in the South African market place. This approach is
based on the findings of both the empirical research and time series analysis. The
recommendations are aimed at improving the manner in which institutions manage
the arbitrage trading processes through the introduction of a management model.
This model can be used as a comprehensive tool to manage the arbitrage
opportunities and assist the institutions in managing risks and maximising the profit
potential of the identified opportunities.
Chapter 6 provides a summary of the overall research findings in terms of the actual
theory, and the practical application of the theory in the South African trading
environment. The chapter then provides an overview of the improvement proposal
set out in chapter 5. Further areas of research are proposed in the conclusion of this
chapter, with the emphasis being on the development of new and more effective
methods of identifying and managing arbitrage opportunities.
Page 25
MANAGING PURE AND STATISTICAL EQUITY ARBITRAGE OPPORTUNITIES WITHIN THE SOUTH AFRICAN ENVIRONMENT- CRONJE, P (2004)
10
CHAPTER 2
2. AN OVERVIEW OF EQUITY ARBITRAGEMANAGEMENT TECHNIQUES AND PROCESSES
2.1 INTRODUCTION
The current global market environment has recently been laced with corporate
failures and scandals such as WorldCom and Enron. These setbacks faced by the
markets were further aggravated by the poor company results and global economic
uncertainty, which have driven investors to accept lower returns from their
investments while also reducing the investor and corporate demand for initial public
offerings (IPO’s) in the early 2000s. The review that follows also highlights the fact
that markets do not always behave rationally and that in reality there are market
inefficiencies that are present for finite periods of time within the equity markets.
This chapter draws on extracts from various articles, journals and books to show that
in the early 2000s institutions trading equities and equity derivatives have been
improving their ability to take advantage of the market inefficiencies which exist in the
global marketplace and in particular in the equity derivative arena. This chapter
shows that the changes facing investment institutions, banks and corporate
treasuries are partially met through the structural and procedural re-engineering
initiatives that are undertaken by the leaders of these investment institutions. The
view held by this research is that such re-engineering initiatives have resulted in the
institutions seeking alternative sources of income to supplement their revenue
through an increase in the amount of proprietary trading undertaken by them. It
stands to reason that these institutions prefer to trade in a manner that provides the
maximum return for the lowest level of risk, and it is this very aspect of their
proprietary trading that is causing them to focus on the exploitation of inefficiencies
within the global equity markets.
The afore-mentioned market inefficiencies allow for a particular type of equity trading,
called equity arbitrage, which will be considered in this chapter. This analysis is split
into two sub-components, namely pure and statistical arbitrage. These broad
categories will be divided into the various arbitrage types that may occur within these
sub-categories. The various types of arbitrage that occur in the market are discussed
Page 26
MANAGING PURE AND STATISTICAL EQUITY ARBITRAGE OPPORTUNITIES WITHIN THE SOUTH AFRICAN ENVIRONMENT- CRONJE, P (2004)
11
in detail with the view to establishing the current level of development of this field
within the global market.
The basic concept surrounding all equity arbitrage literature relies on the
mathematical value of the derivative not equating to the current market valuation of
the instrument. For this reason a large portion of the literature that is covered in this
research is focused on the accepted means of calculating the theoretical value of the
derivative instruments and the approaches used to identify pricing mismatches. It is
only with this background that the foundation of the research into the mispricing of
financial instruments can be determined, as these pricing fundamentals are used in
the realisation of the equity derivative structures and strategies.
The focus then shifts to the application of equity arbitrage in practice. The
organisational structures that house the equity derivative and equity arbitrage
business activities, are a function of organisational strategy, and can be considered a
reflection of an organisations view on how best to manage the equity derivative
process. Very little has, however, been published on the strategies and the
management of arbitrage business activities. For this reason chapter 4 and 5 will
supplement the existing literature with empirical findings, which aim to cover specific
issues that are relevant to the effective management of arbitrage opportunities.
2.2 CATEGORIES OF ARBITRAGE
The general concept surrounding arbitrage relate to the fact that the trader will realise
a riskless profit within a specified period of time due to a derivative instrument being
mispriced in one or different markets. As time progressed and the financial products
became more diverse and advanced, this definition was applied to more and more
products, which resulted in the actual use of the arbitrage term deviating from the
original narrow focus and it is now also used to describe a statistical and probability-
based opportunity, which should result in an indeterminable profit in an
undeterminable period of time.
More formally, investor dictionaries such as www.Investorwords.com [2000?]
describe arbitrage as “attempting to profit by exploiting price differences of identical
or similar financial instruments, on different markets or in different forms. The ideal
version is riskless arbitrage.” In the case of riskless or pure arbitrage, the trader can
determine the amount of profit that will be made in advance, given the fact that the
Page 27
MANAGING PURE AND STATISTICAL EQUITY ARBITRAGE OPPORTUNITIES WITHIN THE SOUTH AFRICAN ENVIRONMENT- CRONJE, P (2004)
12
trader can determine the level at which the trade will be entered into and also the
level at which the trade will be closed at a specified future date.
In cases where the prices are not guaranteed to converge, the trader will be forced to
rely on a mathematical probability to determine the potential for the trade to expire in
the money. In these cases there is no clearly identifiable time or level of profitability,
as the trader is in principle taking a bet that the trade will end up in the money due to
the behaviour of the instruments over time. This fact becomes obvious later, when
the definitions and research into statistical arbitrage is reviewed.
2.2.1 PURE ARBITRAGE DEFINED
The concept pure arbitrage, which is underpinned by the law of one price, has been
covered in countless works on derivative instruments and their pricing. While the
same idea is restated on countless occasions, the following three definitions highlight
the general view shared by authors and investor dictionaries on the concept of pure
arbitrage.
Pure arbitrage is defined by www.Investorwords.com [2000?] as “a risk-free
transaction consisting of purchasing an asset at one price and simultaneously selling
that same asset at a higher price, generating a profit on the difference.” Hull
(2000:14) defines arbitrage as “locking in a profit by simultaneously entering into
transactions in two or more markets,” while Jarrow & Turnbull (1996:33) define
arbitrage as any trading strategy requiring no cash input that has some probability of
making profits without any risk of loss.” In these definitions it is assumed that the
proceeds from the sale of one instrument will completely offset the cost associated
with the purchase of the other asset. For this reason the definition implies that no
cash outlay will be required in the execution of the arbitrage.
2.2.2 TYPES OF PURE ARBITRAGE
Pure arbitrage can theoretically occur between any two types of related instruments,
and for this reason it is necessary to define each arbitrage type in relation to the
instruments, which will be used to measure the pricing relationships. From this
understanding, the situations that will result in pure arbitrage opportunities within the
market can be defined.
Page 28
MANAGING PURE AND STATISTICAL EQUITY ARBITRAGE OPPORTUNITIES WITHIN THE SOUTH AFRICAN ENVIRONMENT- CRONJE, P (2004)
13
2.2.2.1 SINGLE STOCK AND INDEX FUTURES ARBITRAGE
Where futures and forwards on shares and indices are traded, the pricing inputs are
applied to identify the situations where such prices are mispriced relative to the
underlying shares. Research on futures and forwards arbitrage on shares and indices
has been mainly focused on Index arbitrage and for this reason the following
discussion relates mainly to share indices. The application of these concepts can
easily be extended to single stock futures, due to the similarity in the pricing
procedures and the trading and settlement processes. The definition of a single stock
future, according to www.investorwords.com [2000?], is “a single transaction
equivalent to the simultaneous sale of a put and purchase of a call for a given stock.
Single stock futures essentially allow investors to sell a stock short without waiting for
a downtick as would otherwise be required.”
The process of Single Stock Arbitrage works in exactly the same way as Index
Arbitrage, which is defined by www.investorwords.com [2000?] as: “A strategy
designed to profit from temporary discrepancies between the prices of the shares
comprising an index and the price of a futures contract on that index. By buying
either the shares or the futures contract and selling the other, an investor can
sometimes exploit market inefficiencies for a profit.” Index arbitrage opportunities
should disappear rapidly once the opportunity becomes well known and many
investors act on these opportunities.
Reverre (2001:371) defines index arbitrage as the simultaneous sale and purchase
of an index future and of a portfolio which replicates the same index. At a given time,
an opportunity exists if the futures price is different from its theoretical value
computed from a cost of carry model used to price the futures. In practice this implies
an absolute difference in price which is captured now, and which can be secured until
maturity. These opportunities are profitable if the transaction costs and hedging costs
are lower than price discrepancies in the market.
Index futures arbitrage is extremely common and cases of this type of arbitrage have
been cited in most financial markets in the world. Articles relating to this practice date
back to the 1987 (see for instance Wall Street Journal (1987) and Economist (1990:
16)). The index arbitrage process has become so developed and structured that
programme trading systems have been developed to execute the orders when the
Page 29
MANAGING PURE AND STATISTICAL EQUITY ARBITRAGE OPPORTUNITIES WITHIN THE SOUTH AFRICAN ENVIRONMENT- CRONJE, P (2004)
14
system identifies opportunities. www.investorwords.com [2000?] offers the following
formal definition of programme trading: “computer-driven, automatically-executed
securities trades, usually in large volumes of a set (basket) of 15 or more stocks.”
Chung (1991:1792) shows that previous research into index arbitrage is not
comprehensive, as the general research usually focuses on the frequency and
violations of no arbitrage boundaries and does not look at the size and frequency of
arbitrage profits. An example which Chung (1991:1792) highlights is that in the case
of research into United States indices, the indices close about 15 minutes after the
share market closes, which results in the comparison of non-synchronous market
data. MacKinlay & Ramaswamy (1988:137-158) and Stoll & Whaley (1990:391-412)
used intraday prices in an effort to resolve the problem of non-simultaneous data by
using the intraday returns of shares and their indices. In their research it is shown
that the index is not a perfect measure of the true value of the index, as the
component parts do not trade continuously.
Chung (1991:1793) also shows that most studies do not include the up-tick rule for
short sales of the constituent shares of the index in their findings and therefore these
findings are not totally correct. This up-tick rule, which is enforced by the exchanges,
specifies that a short sale may only occur on the market after the share price has
ticked up or has had two successive trades at the same price. This rule will apply to
all market participants who wish to sell a share that they do not own.
Chung (1991:1800) then goes on to show that over the period 1984 to 1986 arbitrage
opportunities and profits have become smaller after taking into account trading costs.
Despite the decline in profitability his study also showed that programme trading is
still a profitable trading strategy despite the fact that profitable opportunities, when
using a transaction cost of 0.75% and 1%, had declined to less than 50% of the
opportunities that are identified. The cases of long arbitrage opportunities on an ex
post and ex ante basis were significantly greater than the short arbitrage
opportunities, i.e. for ex ante long arbitrage violations. This implies that there were
more cases where the arbitrageur would be required to purchase shares relative to
the cases where the arbitrageur would be required to sell shares. His findings
showed 26,086 occurrences of arbitrage on the American markets for the period
1984-1986. These were reduced to 1,985 occurrences when transaction cost of 0.5%
were applied. The research also goes on to point out that in Chung’s (1991:1799-
Page 30
MANAGING PURE AND STATISTICAL EQUITY ARBITRAGE OPPORTUNITIES WITHIN THE SOUTH AFRICAN ENVIRONMENT- CRONJE, P (2004)
15
1805) view the American market had matured and that excess profits such as those
reflected in previous studies would not be available in the future.
Research into the behaviour of the futures prices relative to the underlying share
prices was conducted by Harris et al. (1995:563-579), who showed that generally the
futures prices lead the spot price. This implies that the futures prices on the Standard
and Poors (S&P) Index are in fact price leaders to the spot prices. This research has
the implication that when the futures prices move in a specific direction, the share
prices will tend to follow the move shortly thereafter. As arbitrageurs use models
which are usually based on calculation of futures prices using the spot price as the
starting point of their calculations, the causation is in fact reversed according to this
research. Despite this difference the processes used to establish the spot-futures
price discrepancies would remain unaltered, as will the pure or statistical arbitrage
process that is applied to realising the profit that is inherent in the opportunity.
Transaction costs can become large when exploiting these opportunities because of
the need to simultaneously buy and sell many different shares and futures, so only
the larger institutions are usually able to profit from index arbitrage. In addition to this
fact, sophisticated computer programmes are needed to keep track of the large
number of shares and futures involved, which makes this a difficult trading strategy
for individuals.
The point should also be made that while the general index arbitrage concept
assumes that the arbitrageur will hold the position until convergence, this assumption
does not hold in all cases, as Kempf (1996:367-368) shows. In his work he shows
that the arbitrageurs often unwind the trades prior to maturity and that these early
unwind options have an effect on the futures-spot relationship, as the unwind option
may move the share and futures prices in the process of unwinding the arbitrage
positions. In a similar manner this work also shows that the mean reversion
(conversion) of the mispriced futures and spot prices is arbitrage induced, as the
arbitrage process affects the demand and supply relationships, thereby driving the
prices to reversion. The basis of this research really implies that once the
convergence has occurred, there is no further need for the position to be maintained
and the arbitrageur can close out the position and realise the profits that were
anticipated when the deal was entered into.
Page 31
MANAGING PURE AND STATISTICAL EQUITY ARBITRAGE OPPORTUNITIES WITHIN THE SOUTH AFRICAN ENVIRONMENT- CRONJE, P (2004)
16
2.2.2.2 COVERED ARBITRAGE ON DUAL LISTED SECURITIES
Covered arbitrage is defined by www.investorwords.com [2000?] as “arbitrage
involving investments denominated in different currencies, using forward cover to
reduce or eliminate currency risk.”
As institutions expand their global presence, it has become commonplace for them to
require funding in the countries in which they have a presence. To this end the
institutions issue shares on exchanges in different countries, in an effort to increase
the liquidity of the shares and also to reduce the cost of trading the share (Baker
1992:23-29).
Where securities that relate to the same underlying firm are traded on more than one
exchange, and in some cases in more than one country, this type of trading may
allow for price discrepancies to occur on the same instrument between the different
exchanges. Hanousek & Nemecek (2002:49-69) consider the co-existing parallel
markets and their efficiency in the Czech Republic. Due to different market
mechanisms that are used in the price determination and the settlement of the two
markets, the prices of these securities often differ. It is this fact that led Hanousek &
Nemecek (2002:46-69) to investigate the opportunities that are presented to
arbitrageurs over time and also allowed them to study the increase in the markets’
efficiency over time.
The approach that was adopted in this analysis was based on Wang & Yau
(1994:457-474) “market linkage test”, which used the Dickey & Fuller (1979:427-431)
test to estimate the level of arbitrage activity between two markets. Wang & Yau’s
approach was modified to take account of transaction costs within the market. This
resulted in a modified autoregressive AR(1) process with transaction costs as an
additional explanatory variable which is used to evaluate the behaviour of 95 of the
most liquid securities that are traded on the two exchanges.
It is likely that there will be greater price disparities between dual listed securities that
are not liquid according to Hanousek & Nemecek (2002:55). This is due to the fact
that the demand and supply curves of the shares are not affected by the arbitrageur
operations because the arbitrageur cannot execute the arbitrage due to the lack of
liquidity in the market. This results in securities that are not liquid, reflecting greater
price differences for greater periods of time than those that are liquid.
Page 32
MANAGING PURE AND STATISTICAL EQUITY ARBITRAGE OPPORTUNITIES WITHIN THE SOUTH AFRICAN ENVIRONMENT- CRONJE, P (2004)
17
Wang & Yau’s (1994:457-474) research went on to show that over time the market
participants became more effective in creating mechanisms that could be used to
capture the price discrepancies in the more transparent and liquid securities, which
resulted in stronger co-movements in the share prices between the two parallel
markets in the Czech Republic.
2.2.3 STATISTICAL ARBITRAGE DEFINED
The definition of statistical arbitrage, according to www.Investorwords.com [2000?], is
“an attempt to profit from pricing inefficiencies that are identified through the use of
mathematical models”. From the perspective of this research the fundamental
difference between pure and statistical arbitrage lies in the fact that in pure arbitrage
the likelihood of the profit being realised is considered to be 100%, while in the case
of statistical arbitrage the price convergence is not guaranteed and there is therefore
only a probability that a profit will be realised. Statistical arbitrage attempts to profit
from the likelihood that prices will tend toward their historical norms, and unlike pure
arbitrage, statistical arbitrage is not riskless.” www.investopedia.com [2000?] defines
this arbitrage in the following manner: “Statistical arbitrage is not without risk; it
depends heavily on the ability of market prices to return to a historical or predicted
normal.”
The types of instruments that are used within statistical arbitrage can span the entire
range of financial instruments including the underlying securities, futures, forwards,
options, warrants and synthetics. The behaviour of the derivative instruments to
opportunities that presented themselves in the underlying markets should mirror the
effects of those opportunities in the underlying markets. Therefore, if the underlying
security is predicted to go up, then so should the derivative instrument and vice
versa.
2.2.4 TYPES OF STATISTICAL ARBITRAGE
The different types of statistical arbitrage will be discussed in the sub-sections below.
Page 33
MANAGING PURE AND STATISTICAL EQUITY ARBITRAGE OPPORTUNITIES WITHIN THE SOUTH AFRICAN ENVIRONMENT- CRONJE, P (2004)
18
2.2.4.1 STATISTICAL ARBITRAGE IN THE UNDERLYING SHARES AND THEIR
DERIVATIVES
Reverre (2001:459) describes statistical arbitrage as the matching of shares with
similar behaviour as a result of their levels of correlation. The relationships usually
relate to shares in similar industries and this strategy relies on trading the changes in
the price divergences between the two shares. Amman and Herriger (2002:42)
describe the statistical arbitrage as “ … not based on theoretically precise
relationships but rather, on empirical, statistically established relationships.
Consequently statistical arbitrage involves risk”.
The opportunities for these types of arbitrages tend to avail themselves for longer
periods in the market, as they are not clearly visible to all market participants.
However, the risks in this strategy are great and one loss may remove all historical
profits in this type of trading. This is due to the fact that the fundamentals often
change, which will alter the statistical relationships between the underling securities,
and this will alter the buy and sell signals on the shares or indices.
This approach contradicts the Efficient Market Hypothesis (EMH) discussed by Reilly
& Brown (1997:208), as it implies that markets are predictable, and that none of the
three variants of this hypothesis always holds true. In general, liquidity may affect the
EMH, but for the most part, markets price correctly and many of the observable
arbitrages are due to non-simultaneous prices (where the observed price of the
underlying and its related security or instrument do not occur at the same time) or the
extent of the arbitrage opportunities is of such a scale that it cannot be profitably
exploited, given transaction costs (MacKinlay & Ramaswamy, 1988:137-158).
However, Chorafas (1995:222) is of the opinion that the EMH is wrong, as “even if
the market is quick to digest earnings data, it can be grossly inefficient in valuing
everything else”. Furthermore, Chorafas (1995:223) points out that on a “national
stock exchange, forward thinking investment bankers and traders start from the
premise that a market system is inherently inefficient and know that this inefficiency
can be exploited to their advantage.”
The definition of pairs trading, which is the most common form of statistical trading as
offered by www.investorwords.com [2000?], is: “The establishment of a long position
in one share and a short position in another share at the same time. A pairs trade
Page 34
MANAGING PURE AND STATISTICAL EQUITY ARBITRAGE OPPORTUNITIES WITHIN THE SOUTH AFRICAN ENVIRONMENT- CRONJE, P (2004)
19
minimizes the effect of larger market trends and emphasizes the performance of one
share relative to another … ” An analysis of pairs trading is covered in the work of
Froot & Perold (1997:1-19) which covered the pairs relationship that exists between
Royal Dutch and Shell. These related sister companies are considered in this study,
as they share the revenue and expense allocations from the holding company in a
fixed ratio. The relationship of income and expense allocation is publicly known to
follow a 60%:40% allocation. This implies that if the relationships of the share prices
diverge from one another, arbitrageurs would be able to sell the one share and
purchase the other due to the relationship that exists between these shares and their
earnings. The fact that the profit allocation will follow a rigid distribution mechanism
as described above, implies that there is a high probability of the convergence of the
share prices to their normalised price levels. This arbitrage type does not, however,
provide a time period in which the convergence will occur and therefore relies on the
market mechanism to correct the prices over time.
In statistical pairs trading, a very similar process to the one described above is used
by the traders to unlock profit from shares which have over time tended to react to
the market in a highly correlated manner. These situations are identified through the
creation of correlation matrixes, using the instrument price movements over time.
Statistical arbitrage then requires the trader to sell the one share or derivative and
purchase the other share or derivative in the event that the correlation relationship
between the two shares is above or falls below a given distribution threshold. In the
case of statistical arbitrage, there is no guarantee that there will be convergence
through a return to the previous degree of correlation of the share prices. The causes
of the non-convergence of the share prices are often due to changes in the
fundamentals relating to the security or sector and may break or alter the relationship
between the securities.
Reverre (2001:475-486) describes a process that can be used for the identification of
pairs and statistical arbitrage opportunities. The process is firstly reliant on the
identification of shares that have a high correlation in their share price movements.
To this end he suggests using a three-month correlation of the change in the share
prices to identify those that have a high correlation. While Reverre (2001:475-486)
does not specify a threshold at which level the share combinations should be
included, he seems to include shares that have positive or negative three month
correlations from 84% and above in his analysis.
Page 35
MANAGING PURE AND STATISTICAL EQUITY ARBITRAGE OPPORTUNITIES WITHIN THE SOUTH AFRICAN ENVIRONMENT- CRONJE, P (2004)
20
Using the above statistical approach over a time series spanning a specified period,
the trader can calculate the potential profitability of the trading strategy and calculate
the percentage of time that the strategy is successful. The trader can also alter the
value of the threshold in an attempt to determine the change in profitability that stems
from a change in the specific threshold.
Meissner et al. (2002: 1-11) researched the behaviour of the global financial markets
to determine if the correlation between markets is high enough to trade on a
statistical basis given these relationships. The trading strategy used was a simple
unidirectional trade based on the probability that the index that is being traded would
tend in the direction in which the leading exchange closed. In this research it is noted
that the correlation of price behaviour between indices in different time zones
increased during the ten-year period of the study.
This finding corresponds to that published by Joen & Von Furstenburg (1990:15-30)
who studied the relationships between the US Dow Jones Industrial Average, the
English FTSE 100, the French CAC 40, German DAX, the Japanese Nikkie 225, the
Hong Kong Hang Seng Index, and the Singapore Straits Times Index. The results of
this research showed that the correlations were significant and that a trading strategy
that relied on this inference of performance should generally make money. The
findings also showed that the greater the move in the leading index, the greater
would be the probability that the lagging index would follow that direction and the
greater the move in the lagging index.
In their work on maximising the predictability of share and bond markets, Lo &
MacKinlay (1995:1-60) utilise statistical inference gained through the use of
autocorrelation processes applied to principle components to set the bounds within
which the prices of shares and bonds should trade. Where these bounds are
exceeded, a statistical arbitrage has presented itself.
Lo and Mackinley (1995:4) point out that predictability in asset returns is increasingly
following a two step approach, which relies firstly on the creation of a linear factor
model which has cross-sectional explanatory power, for example factor analysis or
principle components decomposition. Once these factors have been identified, the
predictability of these factors is analysed. To this end a model which predicts the
returns of assets, is created and applied to various asset groups, including
components of the S&P 500, a ten-asset group consisting of deciles of size sorted
Page 36
MANAGING PURE AND STATISTICAL EQUITY ARBITRAGE OPPORTUNITIES WITHIN THE SOUTH AFRICAN ENVIRONMENT- CRONJE, P (2004)
21
portfolios, and an eleven-asset group sector sorted portfolio The research into the
performance of these indices, shares and sectors spans the period from 1947 to
1993.
The conditional factors that are used in the forecasting models are reliant on
literature documenting the time variation in expected share returns. Sources such as
Keim & Stambaugh (1986:357-390), and Fearson & Harvey (1993:289-317) are
relied upon to show that variables such as dividend yield and term spreads have
forecast power.
2.2.4.2 OPTION ARBITRAGE
In all cases where the traders wish to benefit from arbitrage on an option due to a
price difference between that option’s relative value to that of another option, on the
same or similar security, they are in fact taking a view on the volatility of the option,
given a particular price and maturity. Option arbitrage is quite diverse and extends
across both pure and statistical arbitrage.
The case of pure arbitrage refers to the put call parity relationships that should exist
between the call and put prices of the options. Another case that should be
considered is dual listed options struck at the same price and maturity, as these also
present pure arbitrage opportunities.
With normal statistical arbitrage the primary task is to identify shares that are highly
correlated to one another, and in so doing to create a pairs relationship between the
underlying shares and their related derivatives on these instruments. From correlated
shares and indices a relationship can be created which may be used to determine
which share options should be sold and which should be bought in terms of the
historical relationships that exist between the shares, the indices and their options.
Available research on the mispricing of index call and put options in the United States
spans nearly two decades, with Ervine & Rudd (1985:743-756) publishing their work
as early as 1985. Ackert & Tian (1999:1-19) describe how these opportunities arise
and how they can be exploited on the S&P 500, where index options were found to
be priced incorrectly in both the call and put options over a long period of time.
Page 37
MANAGING PURE AND STATISTICAL EQUITY ARBITRAGE OPPORTUNITIES WITHIN THE SOUTH AFRICAN ENVIRONMENT- CRONJE, P (2004)
22
Ackert & Tian (1999:1-19) analysed the frequency with which index options are
mispriced on the S&P 500 index in the US. The research showed that the option
market inefficiencies are reduced over time, but that the introduction of depository
receipts, restrictions on short sales and transaction costs which are incurred do affect
the profitability of index option arbitrage negatively. This research may be considered
complementary to the work of Ervine & Rudd (1985:743-756), Chance (1987:47-64)
and Kumara & Miller (1995:519-539), which all showed similar findings in their
research into the mispricing of index options.
On the statistical side the pricing reliance again reverts to the degrees of correlation
between the share or index prices. Where the share or index prices are highly
correlated, the relationship between their volatility levels can be calculated according
to (Ammann & Herriger, 2002:43). In light of that fact, Ammann & Herriger (2002:42-
55) show that the price relationship that is created through the correlation of the
underlying share prices can be extended to the volatilities and therefore to the
behaviour of the prices of the options on the underlying shares.
Ammann & Herriger (2002:42-54) researched the statistical arbitrage relationship that
exists between 11 share indices in the United States. The approach that was used
was to remove stationarity using standard stationarity tests. This removed one index
from the 11 tested. The next test was to identify indices that were correlated to a
degree greater than 0.95, this removed a further 5 indices. Of the five remaining
indices the three most liquid were used in their analysis. Using a period spanning
from January 1995 to February 2000, they used Ordinary Least Squared (OLS)
regression to determine the relationship of the daily returns of indexes with each of
the other.
The findings of the research showed their trading strategy to be effective, with
profitable trades being in the 90% levels for all indexes traded. The risks that this
study faced were that the volatility deviation would persist until maturity and that the
delta or gamma of the options would change. The option positions were constructed
to be delta and gamma neutral, as implied through the high correlation ratios. In
instances where the trades were not profitable, it was found that the underlying
deltas of the indices had changed and this resulted in the fact that the prices and/or
volatilities did not converge as expected.
Page 38
MANAGING PURE AND STATISTICAL EQUITY ARBITRAGE OPPORTUNITIES WITHIN THE SOUTH AFRICAN ENVIRONMENT- CRONJE, P (2004)
23
An observation that can be made about this research is that the simulation of the
trading environment may show that deals were closed out as per the model, but in
reality there was insufficient liquidity to allow the deals to be closed out in the market.
In addition the test data relied on the closing of business price levels, which also calls
into question some of the findings due to the fact that these closing levels are usually
determined through auction processes which may alter the closing price from the last
traded price and non-synchronous data where there are timing differences between
the price observations.
2.2.4.3 RISK ARBITRAGE
The definition of risk arbitrage according to www.investorwords.com [2000?] is, “the
simultaneous purchase of shares in a company being acquired and the sale of
shares of the acquirer. Modern risk arbitrage focuses on capturing the spreads
between the market value of an announced takeover target and the eventual price at
which the acquirer will buy the target's shares”. Reverre (2001:423) concludes that it
“ … refers almost unequivocally to the systematic arbitrage of corporate events, most
notably mergers and acquisitions.”
A definition put forward by www.macroanalytics.com/html/risk_arbitrage.html [1999?]
explains the concept as: “Risk Arbitrage” or “merger arbitrage”, which attempts to
profit from selling short the stock of an acquiring company and buying the stock of
the acquiree. This is coined arbitrage due to the fact that companies will often finance
takeovers through the issuance of more stock, thus diluting the value of the existing
float, and offer a premium over the current share price of the firm they are acquiring,
based upon expected future revenues and profits. In addition, shareholders of the
takeover candidate face little risk, as they typically receive a premium for the shares
they hold, while the acquiring company faces the operational and business risk of
having to integrate the business acquired. While this strategy appears attractive, it is
reliant upon an active mergers and acquisitions environment and thus is exposed to
economic cyclicality, with economic downturns and prolonged bear markets often-
impeding returns. The risk that should be considered is that should the merger fall
apart, whether due to regulatory or other obstacles, the takeover candidate’s share
prices often plummet while the acquiring company’s shares may rise, thus exposing
a merger arbitrage trade to high losses.
Page 39
MANAGING PURE AND STATISTICAL EQUITY ARBITRAGE OPPORTUNITIES WITHIN THE SOUTH AFRICAN ENVIRONMENT- CRONJE, P (2004)
24
This type of trading is reliant on merger and acquisition activity, as it is in these
situations where companies set out to purchase institutions at levels where investors
may decide that the current offer will be accepted as it currently stands or that the
current offer will be revised in a specific direction and therefore the theoretical value
of the share price is greater or less than the current market value. Risk Arbitrage is
an attractive investment strategy for many because it is viewed as a market neutral
trading strategy, as there is no correlation to the share market’s overall direction.
The overall profitability of the risk arbitrageur is a function of the number of mergers
and acquisitions that occur in the specified period. In times of high corporate activity
like in the mid 1990s the profits that these types of opportunities generate, may
exceed the market’s return (Fortune, 1993:38).
In 1995 there were 880 mergers and acquisitions on American exchanges, which
was a 16% increase over the 1994 figure (Money, 1995:181). Fund managers
interviewed in this article were using a risk arbitrage strategy to “profit from the
difference between the market price of the target’s shares and the higher price the
acquirer is offering”. The mechanism used to hedge is to purchase put options on the
company in being taken the takeover so that in the event that the buy out fails and
the share price falls to the levels at which they traded prior to the offer, the fund
would not have lost money.
There is more than one level to the risk arbitrage concept, as is discussed by
(Raynor, 1995:15). He indicates that the shares may trade at a discount to the value
of the proposed takeover due to the fact that there is a risk that the deal may fail and
cause the share price to fall. The case in point was the takeover of Lotus by IBM in
June 1995. Firstly, speculation that Lotus would be able to reduce costs and thereby
improve performance circulated the market and resulted in the share price rising with
$3. There was also talk of a takeover of Lotus by another firm. When IBM announced
its intention to make an offer for Lotus at $60 a share for all shares in issue, the
share price jumped from $32.25 to $61.5. At this point most investors who held the
share sold their holding with the view that they were being paid more than the offer
price. The investors who purchased the shares were risk arbitrageurs that were of
the opinion that the price offered for Lotus would be revised upwards. Later in June
of that year IBM did indeed revise the offer upwards to $64 a share, and the share
then traded to $63 a share by the end of that day.
Page 40
MANAGING PURE AND STATISTICAL EQUITY ARBITRAGE OPPORTUNITIES WITHIN THE SOUTH AFRICAN ENVIRONMENT- CRONJE, P (2004)
25
The $1 differential was left for another set of risk arbitrageurs who had their corporate
and regulation lawyers scrutinising the possibility that the government would block
the deal, which would cause the share price to fall back to its original level. When the
deal was finally concluded, the risk arbitrageurs made the $1 profit they had
anticipated when the deal was concluded.
While the literature differs with regard to the expected return that should be
anticipated when employing the risk arbitrage strategy, the common idea is that the
level of performance of this type of trading is a function of the merger and acquisition
activity that is visible in the market.
Horwitz & Rodrigues (1996:1-7) discuss the findings of The Zurich Hedge Fund
Indices, which reported merger arbitrage hedge funds realised attractive returns with
little variance. On a risk adjusted return basis, merger arbitrage funds outperformed
all other major categories of funds that Zurich analysed. The study also showed that
the majority of the merger arbitrage managers achieved their returns by drifting away
from the “pure” strategy and taking on significant equity risk. The pure form did
indeed provide risk return performances, which were attractive and provided low
volatilities. The most profitable types of transactions were found to be smaller deals
that were presumably less efficiently valued. The study spanned the period 1996 to
2001 and examined about 27000 merger transactions.
Studies into the types of excess returns that are generated by risk arbitrage are not in
short supply, as is evident from the number of research articles published on their
profitability, such as that by Karolyi & Shannon (1998:2-10), who showed that the
annualised returns were around 26%, and Baker & Savasoglo (2002:1-44), who
found the annual excess returns to be in the order of 12.5%.
According to (www.wealtheffect.com/stocksb8f.asp) [2001?] the opportunities are
partly caused by the “weak science of valuation” combined with attempts to read the
direction of the market in cases of risk arbitrage. The largest losses on these types of
trades were found to have occurred during the October 1989 crash when
arbitrageurs lost hundreds of millions of dollars. This risk arbitrage strategy returned
to an “extremely profitable” level following this event.
Jindra & Walking (1999:1-45) show that the percentage difference in price between
the offer price and the market price of the shares after the announcement depends
Page 41
MANAGING PURE AND STATISTICAL EQUITY ARBITRAGE OPPORTUNITIES WITHIN THE SOUTH AFRICAN ENVIRONMENT- CRONJE, P (2004)
26
on variables like the probability of the shareholders acceptance for the takeover.
Cornelli & Li (2000:17-98), who studied the impact of post-offer trading, point out that
the arbitrageurs will continue to buy shares in a firm for as long as the expected
profits remain positive. Once they have started trading, the knowledge of their
position becomes endogenous information and the more shares that arbitrageurs
manage to purchase, the greater the influence that they will have on the outcome of
the offer, due to the voting rights that are associated with the shares. This hypothesis
is also put forward by Larcker & Lys (1987:111-126), who found that the success
rates of risk arbitrageurs are greater than that reflected in the implied probability of
success based on the price of the securities.
Mitchell & Pulvino (2001:2135-2175) point out that potential reasons for the excess
returns are due to the risk that the deal will fail and thereby result in a loss for the
trader. Their study led them to the conclusion that the risk arbitrage opportunities had
payoffs that resembled that of an uncovered put option and that the payoff was
therefore non-linear in nature. Their analysis also points out that two common types
of risk arbitrage “cash mergers” and “stock mergers” occur. In the case of “cash
mergers” the owner of the shares will receive cash for the shares on the relevant pay
date.
The risk arbitrageurs will receive their profit payoff in the form of the difference
between the price at which they bought the shares and the price that the acquiring
company buys them from the arbitrageur. In addition to this profit, dividend income
will also add to the profitability of the risk arbitrage. In the case of “stock mergers” the
arbitrageur will sell the shares of the acquiring company and buy the shares of the
company that is being acquired. As the deal reaches the point where money will be
exchanged, the spread between the two shares would have narrowed, i.e. the
acquirer’s share price will be lower, while the company being purchased will show a
gain in the share price. It can be noted the dividend income will supplement the
profitability of the strategy. Figure 2.1 below reflects the findings of the research in
terms of arbitrage spreads. The figure shows that as the number of days to the deal
completion approaches, the spreads either narrows to remove arbitrage
opportunities, or if the deal is not going to be successful, the spreads increase
dramatically close to the merger termination date.
Page 42
MANAGING PURE AND STATISTICAL EQUITY ARBITRAGE OPPORTUNITIES WITHIN THE SOUTH AFRICAN ENVIRONMENT- CRONJE, P (2004)
27
Figure 2.1 Median arbitrage spread
Source: Characteristics of Risk and Return in Risk Arbitrage (Mitchell &
Pulvino, 2001: 2139)
The research then goes on to examine the validity of the findings, which are reported
in other works when their returns are viewed after considering trading cost and the
returns are not annualised, as is often the case in such research. The reason for not
annualising the returns is that the opportunities may not be repeatable in the future
and their general duration is usually about a month, which provides returns that
appear inflated due to the effects of annualisation. The research uses 4,750 cash
and stock mergers over the period 1963 to 1998. The approach for calculating
returns is to begin by calculating daily returns. All transactions within the sample
were traded on the basis that returns are calculated on the day after the merger
announcement and the returns are calculated up to and including the resolution day.
For successful deals the resolution day is the day on which the target’s stock is
delisted, and for failed deals this would be the day following the deal failure. In terms
of a summary of the duration of the opportunities, there does not appear to be a
pattern over time in terms of the average duration of transactions. For the sample,
the average time from bid announcement to transaction resolution is 59.3 trading
days, while deals that fail generally do so within 39.2 days.
Two different means were used to measure the return on the trades. The first is a
Value Weighted Average Return Series (VWRA), whereby the portfolios’ monthly
Page 43
MANAGING PURE AND STATISTICAL EQUITY ARBITRAGE OPPORTUNITIES WITHIN THE SOUTH AFRICAN ENVIRONMENT- CRONJE, P (2004)
28
returns are obtained by calculating a weighted average of the transaction returns for
each month. These returns are weighted through the total market equity value of the
target company that is used, thereby mitigating the bias introduced by calculating
monthly returns using equally weighted daily returns (Cannina et al., 1998).
The second measure is the Risk Arbitrage Index Manager Returns (RAIM). This
method aims to simulate a risk arbitrage portfolio, which generates a time series of
returns. An initial investment is allowed which must be apportioned along the lines of
“not more than 10% may be invested in any one risk arbitrage opportunity and the
liquidity of the securities must be adequate to allow for active trading”. The results of
the research show that using the RAIM methodology will on average only realise a
4% excess return over the period after taking into account the effect of transaction
costs.
In another study, Gomes (2001:1-48) researched the effects of arbitrageurs in
takeover situations and the manner in which the arbitrageurs accumulated shares in
the company being taken over with the view to affecting the price at which the
takeover would take place. In his research he found that the acquirer needs to reach
a level equal to f, which equals a freeze-out level that the acquirer requires, in order
to buy out the minority shareholders. In so doing the dynamics of the tender offer are
considered through the systematic concentration of ownership in the hands of the
risk arbitrageurs. This concentrated ownership allows target shareholders to leverage
their rights and thereby increase their bargaining power to get the bidder to increase
the takeover premium.
Despite the fact that the arbitrageurs have veto power, they have a vested interest in
ensuring the deal will go through. They may strategically delay the takeover and
thereby force a revised offer for the company. The research applies this game type
approach to the risk arbitrage concept, and shows how the risk arbitrageurs utilise
their consolidated holding to better the terms of the offer that is made by the
acquiring firm.
Page 44
MANAGING PURE AND STATISTICAL EQUITY ARBITRAGE OPPORTUNITIES WITHIN THE SOUTH AFRICAN ENVIRONMENT- CRONJE, P (2004)
29
2.3 OCCURRENCES OF EQUITY ARBITRAGE TYPES AND THEIR DURATION
The arbitrage concept relies heavily on the ability of traders to short sell either the
stock or the derivative instruments that are used in setting up the arbitrage according
to (Chew, 2003:8-11). While these actions were initially perceived to be negative by
governments, national treasuries and stock exchange bodies, Chew’s (2003)
research shows that these short sales assist the market in being more efficient.
While the reasoning behind the price disparities in markets are numerous, they are
usually attributed to differences in market structures, inefficient markets, or according
to Rashes (2001:1911-1914), stocks with similar ticker symbols which are used as
abbreviations for the actual share name are sometimes traded in error, which causes
large movements in either the underlying share price or in the derivative instruments
that are related to that share. In this research, which focuses on unrelated securities
that have similar ticker (alpha) codes, it is pointed out that the effectiveness of the
current processes used to identify arbitrage opportunities is questionable due to the
fact that the existing processes are not eliminating something as obvious as “ticker
symbol confusion”. The research shows that the degrees of the co-movement of
these share prices and the volumes traded are extremely high despite the fact that
the shares are in different sectors, have different market capitalisations, and trade at
different prices.
Ganley & Trebeshi. ([2000?].435:461), find that the quality of different market
structures also affects arbitrage in the stock futures basis markets. In this research it
is shown how the global equity markets react differently in times of stress, and how
effectively the markets in London, New York, Toronto, and Frankfurt managed the
arbitrage opportunities that were presented during the October 1997 stock market
crash. Within the basis trading process the trader would not buy the one side and sell
the other, as is common in the normal arbitrages, as in principle the trader would be
taking a view on the difference between the future and the spot price. Hence, if the
share price is too low relative to the futures price, one would expect the spot price to
increase or the futures price to decrease or both. In all of these cases the basis
difference between the two would decrease, and the arbitrage opportunity would be
realised in this manner.
Page 45
MANAGING PURE AND STATISTICAL EQUITY ARBITRAGE OPPORTUNITIES WITHIN THE SOUTH AFRICAN ENVIRONMENT- CRONJE, P (2004)
30
2.4 INSTRUMENTS USED IN THE EXPLOITATION OF EQUITY ARBITRAGE
OPPORTUNITIES
In the sub-sections below, the following instruments and their arbitrage processes will
be discussed: underlying securities, futures and forwards, equity futures, arbitrage on
futures, shares futures arbitrage, stock indices, futures prices of stock indices, index
arbitrage and options and warrants.
2.4.1 UNDERLYING SECURITIES
The underlying securities to which the study will refer are ordinary shares that Reilly
& Brown (1997:82) describe as a token which represents ownership of a firm through
its issued shares: “Owners of the common stock (ordinary shares) of a firm share in
the company’s success and problems.” While there are different classes of shares,
this study will focus on ordinary shares only. Preferred stock (preference shares) are
classified as fixed interest securities, according to Reilly & Brown (1997:81), due to
the fact that the dividend is stipulated in the terms of their issue, and they can
therefore not be classified as true equity.
There are numerous models which have been developed for the valuation of shares,
for example the Capital Asset Pricing Model (CAPM) and the Dividend Discount
Model. The CAPM analysis is expressed by Brigham & Gapenski (1997) as:
ks = kRF + (kM – kRF)bi
where
ks is the required return on the security,
kRF is the risk free rate of interest,
kM is the expected return of the market, and
bi is the estimated beta or the measure of the shares volatility relative to that of the
average share.
According to the dividend discounted model, the share price is calculated using the
following formula (Reilly & Brown, 1997:438):
Vj = Ónt-1 Dt
(1+k) t
Page 46
MANAGING PURE AND STATISTICAL EQUITY ARBITRAGE OPPORTUNITIES WITHIN THE SOUTH AFRICAN ENVIRONMENT- CRONJE, P (2004)
31
where
Vj = value of the ordinary share,
Dt = dividend during the period t, and
k = the required rate of return on share j.
As all derivative instruments rely on the traded value of the underlying securities, the
relationship that exists between the underlying share valuation models, as reflected
above, and the derivative price can be established. The expression above allows the
market to express its view on the fundamentals of the firm through the inputs to the
valuation process and these inputs affect both statistical arbitrage and pure arbitrage
opportunities. In the statistical arbitrage trading processes, these changes in the
inputs alter the fundamentals of the company and this impacts on the statistical
relationships upon which the trading strategy is based.
Price changes of the underlying will directly affect the prices of derivatives based on
the underlying shares. Notwithstanding the effect of altered fundamentals, the traders
could exploit pure arbitrage opportunities, due to mispricing of the underlying
instruments by trading in accordance with the dual listed securities example
explained below:
Where securities that relate to the same firm are traded on more than one exchange
and in some cases in more than one country, this type of trading may allow for price
discrepancies to occur on the same instrument between the different exchanges. As
discussed in section 2.2.2.2 of this chapter, Hanousek & Nemecek (2002:49-69)
considered the co-existing parallel markets and their efficiency in the Czech
Republic.
The approach that was adopted in Hanousek & Nemecek (2002:49-69), analysis was
based on the Wang & Yau’s (1994:457-474) “market linkage test”, which used the
Dickey & Fuller (1979:427-431) test to estimate the level of arbitrage activity between
the two markets. Wang & Yau’s (1994:457-474) approach was modified to take
account of transaction costs within the market. This resulted in a modified first order
autoregressive AR(1) process with transaction costs as an additional explanatory
variable which is used to evaluate the behaviour of 95 of the most liquid securities
that are traded on the two exchanges.
Page 47
MANAGING PURE AND STATISTICAL EQUITY ARBITRAGE OPPORTUNITIES WITHIN THE SOUTH AFRICAN ENVIRONMENT- CRONJE, P (2004)
32
The actual methodology that is applied is that the transaction costs in the two
markets are given by:
TC(PAt,P
Bt) = tcAPA
t + tcBPBt
where the transaction costs that are incurred TC(PAt,P
Bt) are given by the function of
the transaction costs associated with trading the same security:
tcA is the transaction cost incurred in market A,
tcB is the transaction cost incurred in market B,
PAt at price level in market A at time t, and
PBt at price level in market B at time t.
This will allow the creation of an upper limit at which arbitrageurs will enter the
market, as the price will exceed the theoretical price at which the security is being
traded on market B. The theoretical price of market A implied by the price on market
B, for price P*tA is:
P*tA = PB
t +tc (P*tA , PB
t)
where
P*tA is the theoretical price of the share in market A,
PBt is the price of the security in market B, and
tc(P*tA , PB
t) is the expression defining the expected transaction costs in market A
and actual transactions costs in market B.
After substitution the upper limits for transaction costs in market A can be rewritten
as:
P*tA = PB
t (1+tcB)
(1-tcA)
In a similar way the upper limit of the theoretical price on market B as implied by the
price on market A is given by:
P*tB = PA
t (1+tcA)
(1-tcB)
Page 48
MANAGING PURE AND STATISTICAL EQUITY ARBITRAGE OPPORTUNITIES WITHIN THE SOUTH AFRICAN ENVIRONMENT- CRONJE, P (2004)
33
Hanousek & Nemecek (2002:49) show that when the observed price PAt exceeds the
theoretical price P*tA then the price discrepancy can be exploited by simultaneously
buying one share on market B and selling one share on market A, thereby increasing
the demand and prices on market B while increasing the supply and depressing the
prices on market A.
The study then uses Garbade & Silber (1983:289-297) to model the dynamic price
relationship between cash and futures assuming arbitrage and zero cost. In this
study, it is asserted that the convergence is dependant on the supply elasticity of
arbitrage, as the greater the supply elasticity, the faster the price differences will be
arbitraged away. This provides the formulae:
PAt = Pt-1
A - β1(Pt-1A – P*t-1
A)+ + β2 (Pt-1B – P*t-1
B)++εtA
PBt = Pt-1
B - β1(Pt-1B – P*t-1
B)+ + β2 (Pt-1A – P*t-1
A)++εtB
where
x+ is the max (x,o) and x+ is given by (Pt-1A – P*t-1
A)+ and (Pt-1B – P*t-1
B)+,
β1 and β2 are elasticities of the arbitrage supply in market A and B, and
εtA and ε t
B are error terms.
When β1 = β2 = 0, there is no relationship between the securities.
As an alternative to estimating β1 and β2 individually, the top equation can be
subtracted from the bottom equation, to give:
PAt – PB
t = (Pt-1A - PB
t) - (β1 + β2) [( Pt-1A – P*t-1
A)+ - ( Pt-1B – P*t-1
B)+]+( ε tA - εt
B)
These relationships can be manipulated further to give:
(PAt=1 - P*t-1
A)+ -(PBt-1 - P*t-1
B)+
= Pt-1A - PB
t-1 + tcA +tcB PBt-1
+ + PBt-1 - Pt-1
A + tcA +tcB Pt-1A
+
1- tcA 1- tcA
Page 49
MANAGING PURE AND STATISTICAL EQUITY ARBITRAGE OPPORTUNITIES WITHIN THE SOUTH AFRICAN ENVIRONMENT- CRONJE, P (2004)
34
= Pt-1A - PB
t-1 + tcA +tcB PBt-1
+ + PAt-1 -Pt-1
B + tcA +tcB Pt-1A -
1- tcA 1- tcA
= (PAt=1 - P
Bt-1) + Ft
Where x- = min (x,o) and, where x- is given by (Pt-1A – P*t-1
A)- and (Pt-1B – P*t-1
B)-.
tcA +tcB PAt-1 if (P
At-1 -Pt-1
B) < - tcA +tcB PAt-1
1- tcA 1- tcA
Ft = - (PAt-1 -Pt-1
B) if tcA +tcB PAt-1 ≤ (PA
t-1 -Pt-1B) ≤ tcA +tcB PB
t-1
1- tcA 1- tcA
- tcA +tcB PBt-1 iftcA +tcB Pt-1
B < PAt-1 -Pt-1
B
1- tcA 1- tcA
The above gives:
PAt -Pt
B = (1- β1- β2)( PA
t-1 -Pt-1B ) – (β1+β2 ) Ft + (ε t
A - εtB)
or
PAt -Pt
B = (1- β)( PAt-1 -Pt-1
B ) - βFt + ε t
where:
β = β1+β2 and ε t = εt
A - εtB
Ft is a transaction cost term.
From the above, the effects of transaction costs are then depicted in Figure 2.2
below. In Figure 2.2 the X axis represents the price of the share in market A at time
t-1 while the Y axis represents the price of the share in market B. The dashed 45
degree line represents instances at time t-1 where no arbitrage opportunities exist
due to transaction costs. If the price difference is large enough to cover the costs of
the arbitrage trade, the price difference at time t is also determined by the supply of
arbitrage activities β and the price difference at time t-1 is greater than the
transaction costs.
Page 50
MANAGING PURE AND STATISTICAL EQUITY ARBITRAGE OPPORTUNITIES WITHIN THE SOUTH AFRICAN ENVIRONMENT- CRONJE, P (2004)
35
Figure 2.2 The effects of transaction costs on arbitrage opportunities
Source: (Hanousek & Nemecek, 2002:51)
As discussed in section 2.2.4.1, Reverre (2001:475-486) describes a process that
can be used for the identification of pairs and statistical arbitrage opportunities. The
process is firstly reliant on the identification of shares that have a high correlation in
their share price movements. To this end he suggests using a three-month
correlation of the change in the share prices to identify shares that have a high
correlation. While Reverre (2001) does not specify a threshold at which level the
share combinations should be included, he seems to include shares that have
positive or negative correlations from 84% and up in his analysis.
Once the shares that are highly correlated to one another have been identified,
Reverre (2001:475-476) proposes firstly that the ratios of the share prices in relation
to one another should be calculated, from these ratios, a 30-day moving average of
the ratio of the share prices should be calculated. The ratio’s moving average is used
to stabilise the value of the share price over time. Through the use of this 30 day
moving average of the ratio the model can predict the proposed price of the share
given this smoothing method. Basically the denominator used in the calculation of the
daily share price ratio is multiplied by the smoothed ratio to provide a projected price
of the share, which acts as the numerator in the ratio calculation.
Page 51
MANAGING PURE AND STATISTICAL EQUITY ARBITRAGE OPPORTUNITIES WITHIN THE SOUTH AFRICAN ENVIRONMENT- CRONJE, P (2004)
36
This theoretical value is then deducted from the actual market price of the share,
which enables a view of whether the share price is currently under or overvalued.
This should allow the trader to buy or sell the share if the share price is mispriced by
a certain amount, which should be enough to compensate for transaction costs. This
is, however, a rather crude manner of identifying price differences and Reverre
(2001:476) indicates that it can be improved by normalising the value of the
difference by subtracting the price difference from the 30 day moving average of the
price difference and then dividing this calculated number by the standard deviation of
the price difference. The above description can be expressed as:
∆norm = (∆ - MA30(∆)) / (θ30(∆))
where:
∆norm is the normalised change in the price of the share,
∆ is the actual change in the share price,
MA30(∆) is the 30 day moving average of the change, and
θ30(∆) is the 30 day standard deviation of the change.
The benefit of using the ∆norm is that it is normally distributed which means that there
is, for example, a 15 % chance that ∆norm will be above or below 1, while there is a
2.34 percent chance that it will be above or below 2 or -2. For that reason, when the
∆norm is greater or less than 2, that market event is rare from a statistical perspective.
Reverre (2001:477) suggests that as ∆norm oscillates around zero, the trader should
act in all cases where the threshold of 1.5 standard deviations has been breached. If
the ∆norm is greater than 1.5 then the recommendation is therefore to buy one of the
shares, that acts as the numerator while selling a quantity equal to the MA30 ratio of
the shares acting as the denominator. If the ∆norm is less than one, the opposite
positions to those suggested above should be traded.
Using the above statistical approach over a time series the trader can calculate the
potential profitability of the trading strategy and calculate the percentage of time that
the strategy is successful. The trader can also alter the value of the threshold in an
attempt to determine the change in profitability that stems from a change in the
specific threshold.
Page 52
MANAGING PURE AND STATISTICAL EQUITY ARBITRAGE OPPORTUNITIES WITHIN THE SOUTH AFRICAN ENVIRONMENT- CRONJE, P (2004)
37
As discussed in section 2.2.4.3, where risk arbitrage is considered, Mitchell & Pulvino
(2001: 2135-2175) point out that potential reasons for the excess returns are due to
the risk that the deal will fail and thereby result in a loss for the trader. All
transactions within the sample were traded on the basis that returns are calculated
on the day after the merger announcement and the returns are calculated up to and
including the resolution day. For successful deals the resolution day is the day on
which, the targets stock is delisted and for failed deals, this would be the day
following the deal failure. The method of return calculation in cash offers is:
Rit = PTit+DT
it-PTit-1
PTit-1
where:
Rit is the daily return of the share,
PTit is the targets stock price at the close of market on day t,
DTit is the dividend paid on the share, and
PTit-1 is the targets closing price.
In the case of share offers the return is calculated using:
Rit = PTit+DT
it-PTit-1 -∆( PA
it+DAit-P
Ait-1 -rfP
Ai1)
Position Value t-1
where:
Superscript T refers to the target company,A refers to the acquiring company,
∆ is the hedge ratio (equal to the number of the acquirer’s shares to be paid for each
of the outstanding target shares),
rf is the appropriate risk free rate, and
PAi1 is the acquirer’s stock price at the close of business on the day following the
merger announcement.
In terms of a summary of the duration of the opportunities, there does not appear to
be a pattern over time in the average duration of transactions. For the sample, the
average time from bid announcement to transaction resolution is 59.3 trading days,
while deals that fail generally do so within 39.2 days.
Page 53
MANAGING PURE AND STATISTICAL EQUITY ARBITRAGE OPPORTUNITIES WITHIN THE SOUTH AFRICAN ENVIRONMENT- CRONJE, P (2004)
38
2.4.2 FUTURES AND FORWARDS
Prebon Training Services SA (2001:8-9) defines a forward as “an agreement
between two parties to exchange a specific quantity, of a specified security at a
specified price on a specified date”, while they define a future as “a standardised
contract between two parties to exchange a standard quantity of a specified
underlying asset on a predetermined future date at a price agreed today, traded on
an organised exchange”. As an example the buyer of 1 Dimension Data (DDT)
futures contract will receive 100 DDT shares at the maturity date of the future;
therefore 1 futures contract = 100 times the underlying.
The risk profile of buying a future or a forward is the same as buying the share
outright. Figure 2.3 taken from Prebon Training Services SA (2001:10) depicts this
linear behaviour.
Figure 2.3 Behaviour of the price of a futures contract
Source: Prebon Training Services SA (2001:10)
Page 54
MANAGING PURE AND STATISTICAL EQUITY ARBITRAGE OPPORTUNITIES WITHIN THE SOUTH AFRICAN ENVIRONMENT- CRONJE, P (2004)
39
2.4.3 EQUITY FUTURES
Equity futures are futures on the individual shares where, settlement of these futures
will occur through the physical delivery of the underlying shares. Table 2.1, taken
from Prebon Training Services SA (2001:39), outlines the specifications of an equity
futures contract.
Table 2-1 Equity futures specification in the South African market
Source: Prebon Training Services SA (2001:39)
Presuming that the contract specifications are the same, the value of a forward and a
futures contract may differ as a result of the margin calls that may be required by the
futures clearing house. As margin calls are not applied to Over The Counter (OTC)
forward transactions the values will be different due to the carry cost on the futures
margin calls (Hull, 2000:85). However, as the actual price difference will be
negligible, this study will treat futures and forwards as though they were priced in the
same manner. For this reason, further conventions in this discussion will refer to the
futures, which imply both futures, and forwards on the underlying share or index.
2.4.4 ARBITRAGE ON FUTURES
Looking at the inputs that determine the price of a future, the basic variables are the
spot price, interest rates and the dividends, which may be received. Table 2.2 below
shows hypothetical inputs used to calculate a futures price. In this example the
market’s futures price is too high and the future can therefore be sold while the
underlying security can be purchased for delivery at the time of the futures maturity
Page 55
MANAGING PURE AND STATISTICAL EQUITY ARBITRAGE OPPORTUNITIES WITHIN THE SOUTH AFRICAN ENVIRONMENT- CRONJE, P (2004)
40
date. If this approach was followed, the trader would realize a risk free profit of R1.84
for every share forming part of the contract that was entered into.
Table 2-2 Futures contract where the futures price is too high
Spot Price (So) 30.00
Futures Price (Fo) 35.00
Risk Free Interest Rate 5%
Time (in years) 2
Theoretical Futures Price 33.16
Difference between the future and the theoretical value 1.84
Source: Adapted from (Hull, 2000:55)
If the futures price is too low relative to the spot price and interest rate, as is the case
in Table 2.3 below, two scenarios can play themselves out. If the trader already holds
the shares, the future can be bought while delivering the shares to the market. At
maturity the futures contract will be settled with shares which can be converted to
cash. If the trader does not hold the shares in his portfolio, the trader should buy the
future, while selling the shares in the spot market and borrowing the shares from
securities lending desks to facilitate delivery to the market. At maturity, the shares will
be received when the future matures, and these can then be delivered back to the
securities lending desk. In this case the arbitrageur will receive a riskless profit of
R2.16 per share traded in the arbitrage.
Table 2-3 Futures contract where the futures price is too low
Spot Price (So) 30.00
Futures Price (Fo) 31.00
Risk Free Interest Rate 5%
Time in years) 2
Theoretical futures price 33.16
Difference between the future and theoretical value - 2.16
Source Adapted from (Hull, 2000:55)
Page 56
MANAGING PURE AND STATISTICAL EQUITY ARBITRAGE OPPORTUNITIES WITHIN THE SOUTH AFRICAN ENVIRONMENT- CRONJE, P (2004)
41
2.4.5 SHARE FUTURES ARBITRAGE
The calculation of the theoretical or fair price of a share future is, as in the example
above, reliant on the current share price of the underlying security expressed as a
function of the time until maturity, the dividend, and the risk free interest rate. The
expression can be written in a manner that excludes dividends where there is no
dividend yield, or in a manner where the dividend yield is subtracted from the risk
free interest rate. In all cases it should be ensured that the compounding frequencies
of the dividend yield and the risk free interest rate are the same.
The futures price for an investment asset producing no income, is given by Hull
(2000: 55):
Fo = SoerT
The futures price for an investment asset producing an income, is given by Hull
(2000:56):
Fo = (So-I)er T
where:
F0= current forward price long forward contract,
r= interest rate,
T = time to maturity, and
I = present value of income.
The value of the future relative to the spot price at the time the transaction is entered
into is zero, as the futures price is simply a reflection of the spot price compounded at
a rate equal to the risk free rate less the dividend yield. The future’s valuation will
change as time progresses, as the spot and dividend rates change and as the
interest rate changes.
2.4.6 STOCK INDICES
Natenberg (1994:301) defines an index as “a number, which represents the
composite value of items. In the case of stock indices, the value of the index is
determined by the value of a group of specified shares, with the value of the shares
Page 57
MANAGING PURE AND STATISTICAL EQUITY ARBITRAGE OPPORTUNITIES WITHIN THE SOUTH AFRICAN ENVIRONMENT- CRONJE, P (2004)
42
usually being determined by their prices in the market place. … the value of an index
always reflects the total value of the shares which make up the index. Common
methods of weighting an index are price weighting where the share’s value is directly
proportional to its value in the index and capitalization weighted indices where the
weighting is determined by the total market capitalization of the share in the index.”
In the case of the South African Indices, http://ftse.jse.co.za [2000?] shows that the
FTSE/JSE Africa Index Series of the All Share Index (ALSI Top 40) is calculated by
means of the following formula:
Index = Sum of Free Float Market Capitalisation of All Constituent Companies /
Latest Index Divisor.
In the case of the free float market capitalisation index, the floating market
capitalisation of the constituents is calculated by multiplying the most recent share
price by the number of shares outstanding in the firm and using these as the inputs to
the Free Float capitalisation Index according to www.jse.co.za [1999?]. The divisor of
the index is an arbitrary number chosen at the starting point of the index, which is
adjusted when capitalisation amendments are made to the constituents of the index,
allowing the index value to remain comparable over time.
2.4.7 FUTURES PRICES OF STOCK INDICES
Index futures are based on the price of the underlying shares and they can therefore
not be physically delivered. Table 2.4 below describes the general characteristics
that relate to Index futures and shows that the standard delivery process is usually in
the form of cash.
The parity of the futures price to the share index will be given by the equation:
Fo = Soe (r-q)T
where the index is an asset that pays a dividend (dividend yield = q).
Page 58
MANAGING PURE AND STATISTICAL EQUITY ARBITRAGE OPPORTUNITIES WITHIN THE SOUTH AFRICAN ENVIRONMENT- CRONJE, P (2004)
43
Table 2-4 The characteristics of index futures on SAFEX
Source: Prebon Training Services (2001:40)
2.4.8 INDEX ARBITRAGE
Hull (2000:64) illustrates futures arbitrage on an index by way of the following
situation where the futures price is higher than the theoretically calculated fair price of
a future:
Fo > Soe(r-q)T
In the above situation the trader should buy the shares underlying the index, and sell
the futures contract, in order to realise the arbitrage profit. Corporations holding
short-term money market investments often follow this approach.
In cases where the futures fair price is less than the actual futures price, Hull
(2000:64) describes the situation through the equation:
Fo < Soe(r-q)T
In the above case the trader would buy the index future, and sell the shares involved.
These index arbitrages are often done by pension funds, as they will already own the
underlying shares.
Due to the transaction costs involved in trading all the shares in a large index, index
arbitrage can be accomplished through trading a relatively small representative
Page 59
MANAGING PURE AND STATISTICAL EQUITY ARBITRAGE OPPORTUNITIES WITHIN THE SOUTH AFRICAN ENVIRONMENT- CRONJE, P (2004)
44
sample of the shares whose movements are closely correlated to the index price
movement.
As discussed in section 2.2.2.1, Chung (1991:1792) shows that Index Arbitrage
follows the conventional identification process of:
F(t,T) = S(t)er(T-t) – D(t,T)
where
F(t,T) = futures price for maturity at time T,
S(t)er(T-t) = Spot price of the index at time t adjusted for time value, and
D(t,T) = the dividends that are paid on the individual share adjusted for the time
value.
Chung’s research follows the approaches adopted by MacKinlay & Ramaswamy
(1988:137-158) and Stoll & Whaley (1990:391-412) who used intraday prices in an
effort to resolve the problem of non simultaneous data by using the intraday returns
of shares and their indices. In their research it is shown that the quoted index value is
not a perfect measure of the true value of the index, due to the fact that the index and
its constituents do not trade continuously. Therefore all combinations of prices are
not always current in the index prices.
Chung (1991:1793) also shows that most studies do not include the up tick rule for
short sales of the constituent shares of the index in their findings and therefore these
findings are not totally correct. This rule specifies that a short sale may only occur
after the share price has ticked up or has had two successive trades at the same
price.
The efficiency tests that are used by Chung (1991:1795) are ex post and ex ante. In
the case of ex-post tests the hypothesis is:
εxp.= |F(t,T) – S(t)er(T-t) + D(t,T)| – b(t) ≤ 0
where:
εxp is the Ex Post profit,
F(t,T) is the futures price without taking into account an execution lag,
Page 60
MANAGING PURE AND STATISTICAL EQUITY ARBITRAGE OPPORTUNITIES WITHIN THE SOUTH AFRICAN ENVIRONMENT- CRONJE, P (2004)
45
S(t) = Σ I=1number of shares Pι(tι
-) / d(t),
tι- is the actual time t if the share is traded at time t, otherwise tι
- equals the closest
time prior to the trade,
Pι(tι-) equals the price at time tι
- of the ith share, and
d(t) equals the adjusted divisor used at t.
In cases where ν is negative, where assuming F(t,T) - S(t)er(T-t) + D(t,T) = ν, but the
absolute value of ν minus any transaction costs [ν-b(t)] is positive, the trader
should sell the underlying index and buy the futures contract. If ν is positive, and ν-
b(t) is also positive, the trader should buy the underlying index and sell the futures
contract. In both these cases the profit ε xp which is calculated using the above
formula will be realised over the time to convergence.
As traders are not guaranteed execution at the observed prices, an ex post price
violation ε xp is considered to be nothing more than a mispricing signal to traders. The
quantifiable effect of the mispricing should be calculated using:
εxa.= F(t+,T) – S(t+)er(T-t) + D(t,T) –b(t+) ≤ 0 when ν is positive and
εxa.= -[F(t+,T) – S(t+)er(T-t) + D(t,T)] –b(t+) ≤ 0 when ν is negative
where:
εxa is the Ex Ante profit,
F(t+,T) is the first futures price following an execution lag after t,
S(t+)= Σ I=1number of shares Pι(t
+)/ d(t+),
Pι(t+) is the first price of the ith share following an execution lag after t,
d(t+) is the adjusted divisor used at t+, and
b(t+) is the time t+ present value of the sum of the transaction costs incurred during
the arbitrage.
The study therefore shows that ε xa is the ex ante arbitrage profit at t+ triggered by a
mispricing signal being a positive ε xp at time t.
Chung (1991:1800) then goes on to show that over the period 1984 to 1986 arbitrage
opportunities and profits have become smaller after taking into account trading costs.
Despite the decline in profitability his study also showed that programme trading is
Page 61
MANAGING PURE AND STATISTICAL EQUITY ARBITRAGE OPPORTUNITIES WITHIN THE SOUTH AFRICAN ENVIRONMENT- CRONJE, P (2004)
46
still a profitable trading strategy despite the fact that profitable opportunities when
using a transaction cost of 0.75% and 1% had declined to less than 50% of the
opportunities originally identified.
Section 2.2.4.1 referred to Meissner et al. (2002?: 1-11), who did research into the
behaviour of the correlation of the global financial markets in an effort to determine
whether the correlation between markets is high enough to trade on a statistical basis
given these relationships. The trading strategy used was a simple unidirectional trade
based on the probability that the index which was being traded would tend in the
direction that the leading exchange closed at. These findings correspond to that
published by Joen & Von Furstenburg (1990:15-30) and the Economist (2001:90).
Meissner et al (2002). analysed the price directional relationships between the US
Dow Jones Industrial Average, the English FTSE 100, the French CAC 40, German
DAX, the Japanese Nikkie 225, the Hong Kong Hang Seng Index, and the Singapore
Straits Times Index by means of simple linear regression analysis. As an explanatory
example the CAC, as a function of the Dow Jones Industrial Index, can be expressed
as:
CACt = α+βDowt-1 +et,
where
α is the y intercept in the linear interpretation of the population of data,
β is the coefficient of determination for the Dow, and
et is the noise that relates to the expression.
This equation can be extended to show the relationship of any one particular indices’
behaviour to that of indices in other geographic areas. For example, in the case of
US indices dependencies on the indices in Europe and Asia, the expression will be
given by the multiple regression function:
USt = a +Σ i=0n βi Europet-i + Σ βj Asiat-j + et,i,j.
Lo & MacKinlay’s (1995:1-60) work on maximising the predictability of share and
bond markets provides an example of a linear factor model which, considers the case
of two assets being asset A and asset B. Both these assets satisfy a linear two factor
model, so that the return of the two assets is shown by Rt, which is denoted by the
Page 62
MANAGING PURE AND STATISTICAL EQUITY ARBITRAGE OPPORTUNITIES WITHIN THE SOUTH AFRICAN ENVIRONMENT- CRONJE, P (2004)
47
2x1 vector of the demeaned asset returns at time t [Rat, Rbt], where Rat, Rbt are the
returns on asset A and asset B and the return is such that:
Rt = δ1F1t+δ2F2t+εt
where δ1 � [δa1δb1]´, δ2 � [δa2δb2]´, εt � [εatεbt]´ is white noise with covariance matrix σε²I
and F1t and F2t are two factors that drive the expected return of A and B, this can be
further explained by the following equalities.
E[F1t] = E[F2t] = 0 , Var [F1t] = Var [F2t] = 1
Cov [F1s,F2t] = 0 ∀ s,t
Where F1t is unpredictable through time, and is considered to be white noise, while
F2t is predictable and is considered to be a first order auto regression AR(1), then;
F1t ∼ White Noise , F2t = β F2t-1 +ηt ,| β| ε (0,1)
Where ηt is a white noise process with a variance of 1-β2 and independent variable of
{ε t} then the return should be explained by the two contemporaneous factors, being
white noise and a predictable factor. Lo and Mackinley (1995:5) then show that under
this linear two factor model, the contemporaneous covariance matrix and the first-
order auto covariance matrix of the two assets’ returns Rt are given by:
Γ0 = Var [Rt] = δ1δ1’ + δ2δ2’ + σε2I
Γ1 = Cov [Rt, Rt-1] = δ2δ2’β
Lo & Mackinlay (1995:6) assume that the true data generating process is unknown to
investors and that these values need to be estimated by investors. This implies that
factor analysis or principle component decomposition is required. In a simple two-
asset process the first principle component is a portfolio ωPC that corresponds to the
normalised eigenvector of the largest eigenvalue of the contemporaneous covariance
matrix Γ0, with a portfolio return:
RPC1,t � ω´PC1Rt
Page 63
MANAGING PURE AND STATISTICAL EQUITY ARBITRAGE OPPORTUNITIES WITHIN THE SOUTH AFRICAN ENVIRONMENT- CRONJE, P (2004)
48
In the above equation, RPC1,t could be considered the most important factor from a
cross sectional perspective. The above therefore gives the sources of predictability of
returns. The relative importance of each of the factors is given by:
R2[RPC1,t] = (ω’PC1δ2β)2
ω’PC1 Γ0 ωPC1
A second measure of predictability is the squared first order autocorrelation
coefficient of RPC1,t given by:
ñ12[RPC1,t] = [(ω’PC1δ2)
2β]2
(ω’PC1 Γ0 ωPC1)2
where ñ12[RPC1,t] is the measure of predictability and the other inputs used follow the
conventions described above. The conditional factors that are used in the forecasting
models are reliant on literature documenting the time variation in expected share
returns. Sources such as Keim & Stambaugh (1986:357-390), Fearson & Harvey
(1993:289-317) are relied upon to show that variables such as dividend yield and
term spreads have forecast power. In Lo & Mackinlay’s (1995:16) study the following
variables are used as determinants:
• Dyt is the dividend yield, which is the average dividend yield for the value
weighted index for the 12-month period ending at the end of month t, divided by
the index value at the end of month t
• DEFt is the default spread of the average weekly yield for low grade bonds in
month t minus the average weekly yield for the long-term government bond in
month t, where low grade bonds are rated Baa:
• MATt The maturity spread is the average weekly yields on the long-term
government bond in month t minus the average weekly yield from the auctions of
3 month Treasury bills in month t.
• SPRt Is the S&P 500 Index’s return defined as the monthly return on a value
weighted portfolio of 500 shares.
• IRTt Is the interest rate trend, defined as the monthly change of the
average weekly yield on the long-term bond.
Page 64
MANAGING PURE AND STATISTICAL EQUITY ARBITRAGE OPPORTUNITIES WITHIN THE SOUTH AFRICAN ENVIRONMENT- CRONJE, P (2004)
49
Lo & Mackinlay (1995:17) point out that a frequent complexity in reliable forecasting
in financial markets due to covariance’s, cross-autocorrelations and betas. They
propose the following formula to overcome some of these complexities using the
independent variables described above:
Zt = α + β1.DYt-1+β2.DEFt-1+β3.MATt-1+β4.IRTt-1 + β5t-1 x SPRt-1+εt
Where β5t-1 = δ0 +δ1 x Dyt-1.
As the inclusion of SPRt-1 allows the asymmetric lead/lag relation of Lo & Mackinlay
(1990:41-66), whereby the returns of large institutions can forecast those of small
institutions, but not the other way round. β5t-1. SPRt-1 acts as a deterministic linear
function of the dividend yield Dyt, β5t-1 may vary through time and has the potential to
capture instabilities in a systematic way. Given this fact the equation can now be
restated as:
Zt = α + β1.DYt-1+β2.DEFt-1+β3.MATt-1+β4.IRTt-1 + (δ0 +δ1.Dyt-1). SPRt-1+εt
And further reduced to:
Zt = α + β1.DYt-1+β2.DEFt-1+β3.MATt-1+β4.IRTt-1 + δ0.SPRt-1 +δ1.Dyt-1.SPRt-1+εt
If SPDY ≡ DYt-1.SPRt-1, then this factor can be added to the list of regressors in the
model described.
The least squares estimate for the conditional factor model is used to estimate the
asset group’s 5x1 vector of indices, as well as 10x1 vector of size deciles and 11x1
vector for the sector portfolios. The multi-horizon return calculations with non-
overlapping returns are used to avoid bias from the results.
Their model clearly reflects the basis upon which a multi-factor regression process
can be used in order to infer significance of the principle components to the
dependent variable being the return of the portfolio.
2.4.8.1 DELIVERY OF FUTURES
In Hull’s (2000:74) view, the delivery of futures should be viewed from the
perspective where the futures price is an increasing function of the time to maturity,
Page 65
MANAGING PURE AND STATISTICAL EQUITY ARBITRAGE OPPORTUNITIES WITHIN THE SOUTH AFRICAN ENVIRONMENT- CRONJE, P (2004)
50
i.e. upward sloping. The trader with a short position should deliver as early as
possible, as the holder of a short position can choose the settlement date. This is
view due to the fact that the interest earned on the cash received will outweigh the
benefit of holding the asset for the full term. Where the futures prices are decreasing,
i.e. downward sloping, it is usually optimal for the short position to deliver as late as
possible and one should therefore assume that the later date is more applicable.
Futures prices should generally be less than the actual expected future spot price in
order to compensate speculators for the risk incurred through the passage of time.
This is known as normal backwardation. The opposite is known as contango.
Contango is defined by www.investopedia.com [2000?] as “when the futures price is
above the expected future spot price. Consequently, the price will decline to the spot
price before the delivery date.” Backwardation is defined by www.investopedia.com
[2000?] as “the theory that futures prices will tend to rise over the life of a contract.
Therefore the near term contracts trade at a higher price than the longer term
contracts.” Hull (2000:74), states that the causes of contango and backwardation are
a result of the market’s view relating, to the amount of systematic risk of the
instrument at a point in time and the markets changing perceptions about the future
spot price of the underlying instrument. The systematic risk is a function of the
correlation of the returns of the instrument relative to the market’s returns. Where the
market views the systematic risk of an instrument to be lower than the total market’s
systematic risk, a return lower than the risk free rate will be accepted, which may
create the phenomenon of backwardation. Conversely, where the systematic risk is
greater than the systematic risk perceived by the market, the phenomenon of
contango may occur.
2.4.9 OPTIONS AND WARRANTS
Options and warrants can be broadly broken down into call options which give one
the right to buy an asset at a future time or within a future period at a predefined
price, and put options which give the holder the right to sell the asset at a future time
or within a future period at a specified price (Brigham & Gapenski, 1997:988). The
call and put options can be further broken down into American, European or exotic
type options. Natenberg (1994:4-7) describes an American option as an option
whereby the holder can exercise the option at any time prior to expiration date and a
European option as where the holder can only exercise the option on the expiration
date.
Page 66
MANAGING PURE AND STATISTICAL EQUITY ARBITRAGE OPPORTUNITIES WITHIN THE SOUTH AFRICAN ENVIRONMENT- CRONJE, P (2004)
51
The Black Scholes Option Pricing Model is based on the following equations for Calls
(C) and Puts (P), (Hull, 2000:250 and Rubenstein,1999:272-275).
C= S0N(d1)-Xe-rTN(d2)
P=Xe-rTN(-d2)-S0N(-d1)
where d1 and d2 are defined as:
d1 = (ln (S0/X)+(r+σ2/2)T)/ σ√T
d2=d1-σ√T
Hull (2000:169) shows that the values of calls generally increase as the current share
price, time to expiration, volatility, and the risk free interest rate increases. Values of
calls decrease as the strike price and expected dividends increase while the value of
a put option increases as the strike price, time to expiration, volatility and expected
dividends increase. The theoretical value of a put option decreases as the current
share price and risk free interest rate increases.
The following notation taken from Hull (200:170) will be applicable in further analysis:
S0 : current share price,
ST : Share price at time T,
X : Strike Price,
T : Time of expiration,
r : risk free rate of interest for maturity T (continuously compounded),
C : value of an American Call option to buy one share,
P : value of an American Put option to sell one share,
c : value of an European Call option to buy one share, and
p : value of a European Put option to sell one share.
In the event that a discreet dividend payment is anticipated for the share, the
projected dividends should be discounted to the valuation date and subtracted from
the spot value prior to its substitution in the formula.
Page 67
MANAGING PURE AND STATISTICAL EQUITY ARBITRAGE OPPORTUNITIES WITHIN THE SOUTH AFRICAN ENVIRONMENT- CRONJE, P (2004)
52
While the Black Scholes formula has been widely accepted by market participants, it
is not without its flaws, which relate to the fact that the model assumes a log normal
distribution, constant volatility, continuity and infinite trading possibilities. Given this
fact there are various other models that have been put forward to address the
shortcomings in this model. Research by Britten-Jones & Neuberger (1996:347-363)
and Fortune (1996:38) are some of the examples of ideas that try to address these
problems in the Black Scholes model. It should be mentioned that despite these new
approaches, the Black Scholes (1973:637-659) model has shown remarkable
resilience and is still extremely common in the valuation of equity options. The
binomial tree approach to pricing options is also very common and the Black Scholes
and binomial models provide options prices that are very close to one another.
2.4.9.1 EFFECTS OF MARKET CHANGES ON THE VALUE OF OPTIONS
The effect of market conditions and dividends on the value of options is shown in
Table 2.5 below. The table shows that where the price of the underlying is affected,
the value of the put and call options will move in opposite directions. Where the
volatility is perturbed, the put and call options values will move in the same direction,
If time is altered the values of the put and call options will again move in the same
direction and finally when dividends are perturbed, the put and call prices will move in
opposite directions.
Table 2-5 The behaviour of call and put options with changes in the market
conditions when increasing one variable at a time
Source: Hull (2000:157)
2.4.9.2 BOUNDS OF OPTIONS PRICES
VariableEuropean
CallEuropean
PutAmerican
CallAmerican
Put
Share Price + - + -Strike Price - + - +Time to Expiration ? ? + +Volatility + + + +Risk Free Rate + - + -Dividends - + - +
Page 68
MANAGING PURE AND STATISTICAL EQUITY ARBITRAGE OPPORTUNITIES WITHIN THE SOUTH AFRICAN ENVIRONMENT- CRONJE, P (2004)
53
The upper bounds of call and put option prices are explained by Hull (2000:171) in
the following manner:
c ≤ S0 and C ≤ S0
The value of an American or European call can never be worth more than the share.
If it happens that the call is greater than S0 then the arbitrageur can make a profit by
buying the share and selling the call option.
p ≤ X and P ≤ X.
Similarly,as shown in the above equation, the value of an American or European put
option at time T, cannot be greater than X, and it follows that the present value is:
p ≤ Xe-rT.
The value of the call today can’t be worth more than the strike price discounted to
today’s values. If this is the case the arbitrageur could make a riskless profit by
selling the option and investing the proceeds of the sale at the risk free interest rate.
The formula for the lower boundary of a European call on a non dividend paying
share is provided by Hull (2000:171) as:
S0 – Xe-rT
By way of a numerical example, the lower boundary of a call option can be calculated
given S0 = R20, X = R18, r = 10% and T=1.
S0 – Xe-rT = R20 – R18e-0,1 = R3.71.
Therefore if the European call is trading at R3.00, which is less than the actual R3.71
fair value, an Arbitrageur can buy the call and sell the shares. This gives a cash
realisation of R20.00 – R3.00 = R17.00 which will be invested to time T=1 and which
will grow to R17e0,1 = R18.79 using the risk free rate of 10%. If the share price
increases to more than R18 the arbitrageur will exercise the option and close the
short position on the shares. The profit that will be realised will be R18.79 – R18 =
R0.79. If the share price is less than R18, the shares should be bought in the market
Page 69
MANAGING PURE AND STATISTICAL EQUITY ARBITRAGE OPPORTUNITIES WITHIN THE SOUTH AFRICAN ENVIRONMENT- CRONJE, P (2004)
54
and the short position closed. Presuming that the share price is at R17.00, this will
result in a realised profit of R 18.79 -R17.00 = R1.79.
For European Puts not paying a dividend, Hull (2000:171) gives the lower bound of
the put option price as:
Xe-rT - S0
Using a numerical example, this boundary becomes obvious when supposing that S0
is R37, X is R40, r is 5% and T is 0.5, then:
Xe-rT - S0 = 40e-0.05x0.5 – 37
R2.01.
If the traded European option price is R1.00, which is less than the theoretical
minimum of R2.01, an arbitrageur can buy the put option and the shares for the
period, which will cost 38e-0.05x0.5 = R38.96. If the share price is less than R40.00, the
arbitrageur exercises the option to sell the shares at R40.00 and realises a profit of
R1.04. If the share price is greater than R40.00, the arbitrageur sells the shares at
say R42.00, repays the loan of R38.96 and realises a profit of R3.04.
2.4.9.3 EFFECT OF DIVIDENDS
The effect of dividends is core to the valuation of all underlying instruments and their
derivatives. For this reason a clear understanding of the treatment of dividends in the
Black Scholes model is required. With the introduction of dividends, Hull (2000:179)
shows that the value of a call option can be restated as:
c ≥ S0 – D - Xe-rT
The value of a put option can be restated as:
p ≥ D + Xe-rT - S0
The put-call parity relationship that will exist when dividends are introduced is given
by Hull (2000:180):
Page 70
MANAGING PURE AND STATISTICAL EQUITY ARBITRAGE OPPORTUNITIES WITHIN THE SOUTH AFRICAN ENVIRONMENT- CRONJE, P (2004)
55
c + D + Xe-rT = p+ S0
The above provides a theoretical basis within which put and call option prices should
trade. Any deviations from these boundaries will create pure arbitrage opportunities
which can be exploited by arbitrageurs.
The boundaries of option prices can be modified to better-fit American style options,
which can be exercised at any time, as there is the possibility that it is more
appropriate to exercise the option depending the dividend payout dates. In these
cases the most appropriate time to exercise the option would be just before the
dividend pay dates. This is due to the fact that the share price will fall by an amount
which is approximately equivalent to the dividend as discussed by Bhardway &
Brooks (1999) and Lasfer (1995). As a practical example, presuming a share is
trading at R100 and the share will go ex-dividend by 2 percent (R2) tomorrow. Then
a call with a strike of R90 which expires in 2 weeks, having a theoretical value of R10
and a delta of 100, has the same characteristics as those of the share. If the trader
holds the option, R2 will be lost after ex-dividend when the share trades at 98. This
translates to a R2 loss from R10 to R8 in the options price.
If the trader were to exercise the option, the cost will be R90 for the share worth
R100 and discard the R10 value of the option. If the trader sells the option and buys
the shares, the trader will own the shares when they go ex-dividend. When the share
goes ex-dividend, the price will fall to R98, but the trader would receive the dividend
of R2, which leaves the trader with a profit of R10. This is a better alternative, as the
trader does not lose the R2 that are associated with the dividend.
2.5 EQUITY ARBITRAGE TRADING PRACTICES
The derivative landscape is filled with horror stories of companies that have lost
millions and in some cases billions of Dollars worth of capital due to their exposure to
derivative instruments. While the majority of losses resulted from interest rate
derivatives, the conceptual discussion remains the same and this discussion can
therefore be applied to the equity derivative markets. The exposures which resulted
in these losses were usually placed on the books with the view to reducing an
existing exposure by hedging, but because of the manner in which this was done and
because of poor risk management processes within the companies, these positions
managed to increase the leveraged exposures to the extent that they had ability to
Page 71
MANAGING PURE AND STATISTICAL EQUITY ARBITRAGE OPPORTUNITIES WITHIN THE SOUTH AFRICAN ENVIRONMENT- CRONJE, P (2004)
56
destroy the company. www.investorwords.com [2000?] defines risk as “the
quantifiable likelihood of loss or less-than-expected returns. Examples are currency
risk, inflation risk, principal risk, country risk, economic risk, mortgage risk, liquidity
risk, market risk, opportunity risk, income risk, interest rate risk, prepayment risk,
credit risk, unsystematic risk, call risk, business risk, counterparty risk, purchasing-
power risk, event risk.”
In the sub-sections below attention will be paid to processes used to manage equities
and equity derivative arbitrage, risk management process, risk limits, trading risks,
dealing and delta hedging processes, and arbitrage identification and profitability
measurement systems.
2.5.1 PROCESSES USED TO MANAGE EQUITY AND EQUITY DERIVATIVE ARBITRAGE
The business of equity and equity derivative arbitrage requires the appropriate
structures that can be used to monitor, manage and control the business and its core
components. As will be indicated in the discussion below, these components relate to
the systems, management structures and the performance management of the
traders. The performance of the trader is affected by the components of risk that
Wander & Bein (2002:2-7) classify as systematic risk, which reflects the exposure to
the broad market movements and active risk (or non-systematic risk) which results
from asset allocation decisions.
2.5.2 RISK MANAGEMENT PROCESS
While all risks, including operational, legal, credit and market risk, are of
consequence to the business, this section will focus only on those that rely on a
system to calculate the risk measure. The above risks should all be considered in the
context of the positions that the trader places on the book, but for the purposes of
this research a brief overview of credit and market risk is provided, following which
the focus of the research will concentrate mainly on market risk.
Market risk is defined by www.investorwords.com [2000?] as “risk which is common
to an entire class of assets or liabilities. The value of investments may decline over a
given time period simply because of economic changes or other events that impact
large portions of the market. Asset allocation and diversification can protect against
market risk because different portions of the market tend to under perform at different
Page 72
MANAGING PURE AND STATISTICAL EQUITY ARBITRAGE OPPORTUNITIES WITHIN THE SOUTH AFRICAN ENVIRONMENT- CRONJE, P (2004)
57
times. This type of risk is also called systematic risk.” Chorafas (1995:3) defines
market risk as “the chance that future changes in the market prices may make
financial instruments less valuable or more onerous”.
Counterparty or credit risk is defined by www.investorwords.com [2000?] as “the risk
that the other party in an agreement will default. In an option contract, the risk lies
with the option buyer as the writer may not buy or sell the underlying as agreed. In
general, counterparty risk can be reduced by having an organization with a good
credit rating act as an intermediary between the two parties.” It should be noted that
authors such as Klien & Liederman (1996:235) refer to counterparty risk as credit
risk. Chorafas (1995:3) defines credit risk as the “possibility that a loss may occur
from the failure of the counterparty to perform according to the terms of a contract.
These risks are often hidden from the investing community and cases like Glaxo
pharmaceuticals, which lost £115 million, and Orange County, which lost $2 billion
according to Chew (1996:65), are classic examples of derivative losses. Part of the
problem related to these losses is the manner in which companies were required to
disclose the off-balance sheet exposures which were created by their derivative
positions, and which only came to the fore when things had gone wrong with the
position. Chew (1996:66) points out that the US accounting authorities drafted
Statement 105 and 107 to account for profit and loss (P&L) transparency for off-
balance sheet instruments. As these statements in themselves did not cater for all
contingencies, they issued Statement 119 to address this shortcoming. In the UK the
Accounting Standards Board has attempted to improve the derivative disclosure in
the Operating and Financial Review section of the financial statements. In South
Africa similar steps have been taken to improve disclosure through the accounting
standard AC133.
Part of the solution that is embedded in these accounting statements was to adapt
the accounting standards to mark to market (MTM) mechanism, as opposed to the
accrual account concept that most companies used and that allowed the managers
to hide losses in the accrual accounting process. The MTM approach has the benefit
of quickly identifying the weakness in a particular strategy and its positions according
to (Chew, 1996:83).
Klien & Liederman (1996:15) plot the reasons for Derivatives Risk Management
Disasters of three well-publicised losses in Figure 2.4 below. In this figure it is shown
Page 73
MANAGING PURE AND STATISTICAL EQUITY ARBITRAGE OPPORTUNITIES WITHIN THE SOUTH AFRICAN ENVIRONMENT- CRONJE, P (2004)
58
that the losses suffered by Barings Bank, Gibson Greeting Cards and Proctor and
Gamble were the result of poor control processes within the businesses. These
weaknesses in their controls are broadly broken down into “inadequate independent
trade verification”, “failure to conduct independent portfolio and position valuation”,
“management failure to understand derivatives and/or risk”, “faulty reporting
mechanisms” and “management unaware of derivatives positions”. Each of the
institutions in question failed to manage one or more of these component parts of
their risks, which exposed them to losses that were incurred due to the fact that the
management of the institutions did not identify the pending losses until it was too late
to close out the positions.
Figure 2.4 Reasons for derivative risk management disasters
Source: Klien & Liederman (1996:15)
Klien & Liederman (1996:73) go on to define the first steps of effective risk
management as being able to clearly define the objectives of the financial risk
Page 74
MANAGING PURE AND STATISTICAL EQUITY ARBITRAGE OPPORTUNITIES WITHIN THE SOUTH AFRICAN ENVIRONMENT- CRONJE, P (2004)
59
management that they relate to, preventing negative earnings, maximising earnings
stability and minimising the cost of managing financial exposures.
Klien & Liederman (1996:245) provide a risk framework that is reflected in Figure 2.5
below. In this structure the risk management needs are detailed within the
organisational structure, as well as methodologies and policies that are implemented
in the organisation. The aim of this structure is the creation of a risk management
system which effectively deals with the pricing risk, limits risk, risk analysis, risk
education and portfolio management within the framework of the business strategy.
In turn will affect the businesses risk tolerance that is decided upon by the leaders of
the business and could pertain to people, data, technology, disclosure and
regulations.
This type of view allows the risk team the opportunity of looking at the overall position
in a holistic manner with the view to improving the overall business performance in
accordance with the business strategy. As the majority of the risk factors that are
measured above are not easily measured and are often subjective in nature, the
measures relating to market risk are measured by systems and can be calculated in
a consistent and objective manner. These measures will be discussed later in this
section under the headings of limits, the Greeks, and volatility.
The risk adjusted rate of return on capital (raroc) is also considered a mechanism to
measure the relative performance of the trades or portfolio. This measure of return is
key to understanding the amount of capital which will be made available for the
trading opportunities which present themselves.
Page 75
MANAGING PURE AND STATISTICAL EQUITY ARBITRAGE OPPORTUNITIES WITHIN THE SOUTH AFRICAN ENVIRONMENT- CRONJE, P (2004)
60
Figure 2.5 Integrated goal congruent risk management process
Source: Klien & Liederman (1996:245)
Although many of the processes relating to derivatives are numerical procedures, risk
processes require, a combination of quantitative and qualitative process, such as the
ones described by Klien & Liederman (1996:10). These can be summarised as
follows:
1. Do not treat the derivatives in isolation. Recognise that derivative dealing is a
dynamic process that requires a dynamic approach to management, and that
creates a process to understand the product lines and generally identify and
review the risks on a regular basis.
2. Encourage product education at all levels of the organisation.
3. Ensure that the information is of a high quality and is timely, with standardised
terminology.
Page 76
MANAGING PURE AND STATISTICAL EQUITY ARBITRAGE OPPORTUNITIES WITHIN THE SOUTH AFRICAN ENVIRONMENT- CRONJE, P (2004)
61
4. Value the position regularly against the market and compare the hedge
positions regardless of the accounting method.
5. The more complex the activity the greater the level of in house expertise that
will be required. Therefore place senior and experienced managers in key
positions.
6. Create a bubble up process so that people are comfortable to discuss issues.
7. Stay close to the business, and remember that you cannot prevent all losses.
In line with these requirements the board of directors needs to decide what degree of
certainty they require in terms of their financial exposure as this will determine the
confidence interval that they choose as the measure of their financial risk, for
example the risks should not fall outside that specific level like 95, 97.5 or 99%.. The
risk manager should be provided with tools to view the risks graphically and be
allowed to adjust the period and view of the particular trade, for instance compared to
other traders, daily or annual performance and also against a related product. (Klien
& Liederman, 1996:95). Lastly, (Klien & Liederman (1996:128) point out that risk
cannot be effectively managed unless the appropriate systems are in place to
facilitate the timely and accurate measurement of the risks.
Chorafas (1995:310) shows the process used to quantify the potential exposures that
businesses may face, in Figure 2.6 below. From the figure it is clear that the starting
point in this process is the decision that relates to the confidence interval that the
business would like to apply to the risk incurred in their trading practices. From that
point the business will need to form an opinion about the volatility that would be used
in their risk calculations. From these inputs, the business can calculate the market
risk, credit risk, legal risk and other risks that the business will need to manage.
These factors can then be used to calculate the worst-case scenario that the
business could face, given the chosen confidence interval. Lastly, decisions will be
required regarding the management of these exposures. As the research is primarily
focused on the trading and positions that are entered into within the context of equity
and equity arbitrage, the research will focus on the market risk element of the trading
risks from this point forward as this has the greatest relevance on the research.
Matters pertaining to credit risk will generally be governed by the institutions credit
policy.
Page 77
MANAGING PURE AND STATISTICAL EQUITY ARBITRAGE OPPORTUNITIES WITHIN THE SOUTH AFRICAN ENVIRONMENT- CRONJE, P (2004)
62
Figure 2.6 A step wise approach to the quantification of trading risks
Source : Chorafas (1995:310)
Chorafas (1995:365) identifies the confidence interval as being central to the
management of risk, and this risk measure is a function of the board’s view on the
company’s risk tolerance. If the board decides that a confidence interval of 95% is
appropriate, the risk measure can be expressed as:
-1.96 σ / √n < µ - x < 1.96 σ / √n
where:
x is the sample mean,
N is the sample size, and
µ is the population mean.
Page 78
MANAGING PURE AND STATISTICAL EQUITY ARBITRAGE OPPORTUNITIES WITHIN THE SOUTH AFRICAN ENVIRONMENT- CRONJE, P (2004)
63
If a confidence interval of 99% is to be used, the multiplier of 1.96 will be replaced
with 2.58 and if a 90% confidence interval is used, the multiplier becomes 1.64.
Companies will usually use an interval of 99%, 95% or 90%. Drawing on normal
statistical inference, this analysis can then be extended to include the z and t
statistics as measurements:
Z= x-µo / σ / √n
where
µo is the universe mean,
σ2 is the variance of the universe, and,
σ is the standard deviation of the universe.
If the standard deviation of the population is known, the confidence intervals will be:
x + (zá/2)σ / √n and x + (z1-á/2)σ / √n
where
x is the sample mean,
n is the sample size, and
zá/2 and z1-á/2 are the values from the z statistic tables.
Where the limit is computed from the sample, the change of the interval covering µµ is
1- á and á will typically take on a value of 0.01, 0.05 or 0.1. If σσ is not known, the best
estimate given by s can be used such that:
x + (tá/2)s / √n and x + (t1-á/2)s / √n
In a similar manner Chorafas (1995: 368) shows that using a Weiner process the risk
factor can be calculated as follows:
RF = ßh √t z
where
Rf is the risk factor,
ßh is the historical volatility,
Page 79
MANAGING PURE AND STATISTICAL EQUITY ARBITRAGE OPPORTUNITIES WITHIN THE SOUTH AFRICAN ENVIRONMENT- CRONJE, P (2004)
64
t is the time to maturity of the transaction, and
z is the z statistic for that confidence interval.
Figure 2.7 Market risk factors with historical volatility at about 17 percent at
three levels of confidence intervals
Source Chorafas(1995:369)
Figure 2.7 shows that the risk manager can measure potential future market
movements at a given level of confidence that can be incorporated into a z statistic.
From the figure it can be seen that the greater the level of confidence is, the greater
the market risk will be. This is increased in the longer dated transactions. Chorafas
(1995:370) shows that the above mathematical approach can be changed to cater for
the notional principle amount (NP) for each period such that:
RE = RF x NP
where
RE is the risk equivalent exposure, and
RF is the market risk factor.
As this is done on a transaction-by-transaction amount, the risk equivalent exposure
of the trading positions or portfolio can be measured by:
RE = Óni=1RFi x NPi
Page 80
MANAGING PURE AND STATISTICAL EQUITY ARBITRAGE OPPORTUNITIES WITHIN THE SOUTH AFRICAN ENVIRONMENT- CRONJE, P (2004)
65
where
RFi is the market risk factor, and
NPi is the notional principle amount of the position on the book.
2.5.3 RISK LIMITS
One of the corner stones of risk management is the implementation of risk limits
which are aimed at limiting the factors to which a trader, a trading desk, or a treasury
as a whole can be exposed at any one time.
Figure 2.8 A typical system of market risk limits
Source: Typical system of market risk limits. [2001?]. Available
www.riskglossary.com [2002?]
In Figure 2.8 above, which reflects a typical system of market risk limits. Each limit in
the figure is indicated with a cylinder, and the height of the cylinder corresponds to
the size of the limit. In Figure 2.8 above the trading unit has three trading desks and
each desk has its own limit. There are also limits for each of the individual traders,
but only those for trading desk A are shown in the figure. The extent to which each
cylinder is shaded corresponds to the utilisation of that limit.
Page 81
MANAGING PURE AND STATISTICAL EQUITY ARBITRAGE OPPORTUNITIES WITHIN THE SOUTH AFRICAN ENVIRONMENT- CRONJE, P (2004)
66
In order to monitor market risk, many organisations segment the portfolios, and this is
usually done by trader and trading desk. A hierarchy of market risk limits is typically
specified to parallel such segmentation, with each segment of the portfolio having its
own limits. Limits generally increase in size as one moves up the hierarchy – from
traders, to desks, to the overall portfolio or from individual delivery points to
geographic regions to the overall portfolio.
According to www.riskglossary.com/articles/risk_limits.htm#limits [2002?] risk
limits (or simply limits) are a device for authorizing specific forms of risk taking. For
example a pension fund hires an outside investment manager to invest some of its
assets in intermediate corporate bonds. The fund wants the manager to take risk on
its behalf, but it has a specific form of risk in mind. It doesn’t want the manager
investing in equities, precious metals, or pork belly futures. It communicates its
intentions with investment guidelines. These specify acceptable investments. They
also specify risk limits, such as requirements that:
• the portfolio’s duration always be less than 7 years;
• all bonds have a credit rating of triple-B or better risk limits.
The first risk limit is an example of a market risk limit; the second of a credit risk
limit (www.riskglossary.com/articles/risk_limits.htm#limits) [2002?].
“A stop-loss limit indicates an amount of money that a portfolio’s single-period
market loss should not exceed. Various periods may be used, and sometimes
multiple stop-loss limits are specified for different periods and different instruments. A
trader might be given 1 day, 1 week and 1 month stop-loss limits
(www.riskglossary.com/articles/risk_limits.htm#limits) [2002?]. A limit violation occurs
whenever a portfolio’s single-period market loss exceeds a stop-loss limit. In such an
event, a trader is usually required to unwind or otherwise hedge material exposures –
hence the name stop-loss limit.
Exposure limits are limits based upon exposure risk metrics used to limit market
risk, common metrics include duration, convexity, delta, gamma, and vega. Crude
exposure limits may also be based upon notional amounts and are called notional
limits. Many exposure metrics can take on positive or negative values, so utilisation
may be defined as the absolute value of exposure. Exposure limits address many of
the shortcomings of stop-loss limits. They are prospective, as the exposure limits
indicate risk prior to the financial consequences being realised. Exposure metrics
also provide a reasonably consistent indication of risk. In most instances traders can
Page 82
MANAGING PURE AND STATISTICAL EQUITY ARBITRAGE OPPORTUNITIES WITHIN THE SOUTH AFRICAN ENVIRONMENT- CRONJE, P (2004)
67
be held accountable for exposure limit violations because they are accountable for
their portfolio’s exposures.
Exposure limits have been found to be ineffective when spread trading, cross-
hedging, or similar strategies are applied to minimise risk by taking offsetting
positions in correlated assets.
The following aspects of risk limits will be discussed below: liquidity, sensitivity, and
value at risk.
2.5.3.1 LIQUIDITY
The concept of liquidity risk is defined by www.investorwords.com [2000?] as “the
risk that arises from the difficulty of selling an asset. An investment may sometimes
need to be sold quickly. Unfortunately, an insufficient secondary market may prevent
the liquidation or limit the funds that can be generated from the asset. Some assets
are highly liquid and have low liquidity risk (such as stock of a publicly traded
company), while other assets are highly illiquid and have high liquidity risk (such as a
house).” Ackert & Tian (1999:1-19) argue that “liquidity risk arises from the possibility
of an adverse price movement before a desirable trade can be executed”.
The management of trading positions will always be a function of the liquidity of the
underlying positions and the relative ease with which a position can be closed out. In
terms of the overall management of the liquidity risks the process should consider the
size of the position in the instrument or share in relation to the overall market liquidity
on that instrument or share. The overall market liquidity can then be used as the
proxy against, which the percentage of the position held can be closed out without
causing a severe market movement.
The bid ask spread is often used as a proxy for liquidity due to the fact that, as the
traders become less sure of the true price of the instrument, they are more inclined to
widen the bid ask spread in an effort to protect themselves. Therefore a higher bid
ask spread indicates that the share is illiquid according to Roll (1984:1127-1139). In
an effort to increase the liquidity of a security companies may be inclined to list their
shares on multiple exchanges or through American Depository Receipts (ADR’s),
and Global Depository Receipts (GDR’s) that allow the shares to be traded in other
markets but registered locally. Where dual listed securities are concerned, Domowitz
Page 83
MANAGING PURE AND STATISTICAL EQUITY ARBITRAGE OPPORTUNITIES WITHIN THE SOUTH AFRICAN ENVIRONMENT- CRONJE, P (2004)
68
et al. (1998:2001-2027) found that in cases where the companies list on more than
one exchange and the market information linkages are poor, then the liquidity may in
fact be reduced by the fact that the shares have multiple listings. Their research
therefore shows that transparency in the multi-market trading environment is a key
success factor for improvement in liquidity in each of the component markets.
The issues surrounding liquidity are core to the size and type of positions that the
trader should place on the book. Within the South African Market research has
shown that the bulk of trading is related to a range of blue chip shares (South African
Journal of Business Management, 2000:31).
2.5.3.2 SENSITIVITY
The concept of sensitivity can be applied to arbitrage in the same way that the
sensitivity concept is applied to the normal trading processes. Sensitivity risk is
defined as “the degree of exposure to some source of risk”, sensitivity risk [2000?]
available www.investorwords.com [2000?], or “a technique for determining what
might happen in a decision analysis if a key prediction turns out to be wrong”
(www.investopedia.com/terms/s/sensitivityanalysis.asp) [2002?] (accessed on 1 Jun
03). From a risk measurement perspective this measure is useful in terms of
providing sensitivity scenarios, which are calculated by perturbing the underlying
variables that determine the price of the instruments.
2.5.3.3 VALUE AT RISK (VAR)
The concept of VaR is an attempt to make the risk management function less
complex when being dealt with at a high level. To this end the VaR is designed to
generate a single number, which aims to provide a probabilistic view of what the
company’s exposures to derivative instruments are over a particular period. Chew
(1996: 202) defines VaR as the amount of money an institution could lose or make
due to prices that change in the underlying markets. Cuoco et al. (2001:2-3) note that
VaR “… has emerged in recent years as a standard tool to measure and control the
risk of trading portfolios”. This resulted in investment institutions limiting the discretion
of their traders by imposing VaR limits on their portfolios.
Figure 2.9 Historical VAR formulation process
Page 84
MANAGING PURE AND STATISTICAL EQUITY ARBITRAGE OPPORTUNITIES WITHIN THE SOUTH AFRICAN ENVIRONMENT- CRONJE, P (2004)
69
Source: Available www.riskglossary.com [2002?].
Figure 2.9 above shows that practical VaR measures can use portfolio data and
historical market data as inputs. Output from the above VaR formulation is in the form
of a value which is the VaR metric, and which acts as a VaR measurement. The VaR
measurement then forms the basis of the view which the company has on its
compliance to the VaR limits.
Value-at-risk (VaR) limits combine many of the advantages of exposure limits and
stop-loss limits. According to VaR Metrics,
www.riskglossary.com/articles/risk_limits.htm#limits [2002?], “VaR metrics indicate
risk before its economic consequences are realized. Also like exposure metrics, VaR
metrics provide a reasonably consistent indication of risk. Finally, as long as
utilization is calculated for traders in a timely and ongoing manner, it is reasonable to
hold them accountable for limit violations. As with exposure limits, there are rare
exceptions. Consider a trader with a negative gamma position. While the trader is
responsible for hedging the position on an ongoing basis, it is possible that a sudden
move in the underling share price will cause an unanticipated spike in VaR.”
Page 85
MANAGING PURE AND STATISTICAL EQUITY ARBITRAGE OPPORTUNITIES WITHIN THE SOUTH AFRICAN ENVIRONMENT- CRONJE, P (2004)
70
VaR aggregates across assets and depending upon the sophistication of a VaR
measure, it can reflect even the most complex hedging or diversification effects.
Accordingly, VaR limits are appropriate for limiting risk with spread trading, cross-
hedging, or similar trading strategies.
VaR limits have one significant drawback, as its utilisation may be computationally
expensive to calculate. For many portfolios, VaR is easy to calculate as it can often
be done in real time on a single processor. For more complex portfolios, it may take
minutes or hours to calculate the VaR, even with parallel processors.
The Basle Committee’s proposals of 1995 prescribed VaR computations for the
purpose of assessing bank capital requirements, which should be on a uniform
horizon of 10 trading days and a 99% confidence level, is supported by the
International Swap and Derivatives Association (ISDA). The Basle Committee on
Banking Supervision added impetus for the VaR concept as a risk measure. Despite
the widespread acceptance of the VaR concept, it is not a coherent risk measure, as
it does not satisfy the sub-additive property (Cuoco et al., 2001:3). This implies that
the combination of the VaR’s of two portfolios can be greater than the sum of two
individual VaR’s. This weakness in the VaR concept has led to additional research
into alternatives such as those proposed by Basak & Shapiro (2001:318), which
attempt to deal with VaR from the perspective of dynamic trading.
Basak & Shapiro (2001:378) conclude that “VaR risk management is viewed by many
as a tool to shield economic agents from large losses, which when they occur, could
cause credit and solvency problems. But our solution reveals that when a large loss
occurs, it is a yet larger loss under the VaR risk management and hence more likely
to create problems, defeating the very purpose of using the VaR risk management.”
The research goes on to point out that with lognormally-distributed returns, the
constraint causes traders to invest significantly more in risky assets and that a risk
limit specified in terms of tail-expectation-based measures would result in neither an
increased probability of extreme losses or an increased allocation to risky assets. On
this basis they prefer the tail-expectation-based measure for use in risk control.
2.5.4 TRADING RISKS
The use of formal trading systems to capture the trades and manage the risks that
are inherent in the positions is crucial to all parties to derivative contracts. While there
Page 86
MANAGING PURE AND STATISTICAL EQUITY ARBITRAGE OPPORTUNITIES WITHIN THE SOUTH AFRICAN ENVIRONMENT- CRONJE, P (2004)
71
are a multitude of systems available to the investment institutions, banks, asset
managers brokers etc, the choice of system will usually be determined by the
instrument types and the business strategy that is followed. When trading equities,
systems such as Murex, Front Arena, and Reuters are often used as the trading
platforms to trade and manage the risks inherent in trading.
While these trading systems generally meet the general trading requirements in
terms of recording positions that have been placed on the book, their function is not
generally considered to be the identification of the trades that should be placed on
the books. To this end the institutions usually develop secondary applications, which
are usually Visual Basic and spreadsheet based. These applications are linked to live
data sources and their function is to highlight potential opportunities that may present
themselves in the marketplace.
Off-the-shelf products like Horizon have been developed to assist with the creation of
basic descriptive statistical information, which may assist in the identification of
statistical arbitrage opportunities. Java and Matlab have also become popular in
terms of developing applications that relate to the identification of statistical arbitrage
opportunities.
Embedded in the trading systems are usually measures that allow the traders and
risk managers to measure the risks associated with the positions that are on their
books. These measures will be discussed in the ensuing sections.
2.5.4.1 VOLATILITY (σσ )
When dealing with any share or instrument, the amount by which the value of the
instrument tends to change over time is known as its volatility. This measure is
therefore not only key to pricing options, it is also significant in ascertaining the
amount of risk that is associated with an option position. Section 2.4.9 showed that
the volatility of a share is an input to the Black Scholes option pricing formula, and a
clear understanding of the application of this measure to option pricing is therefore
imperative.
The term volatility has many variants in terms of its usage within a trading
environment, as will be discussed below, but as a general definition the one offered
by volatility available on www.investorwords.com [2000?] (accessed on 30 June
Page 87
MANAGING PURE AND STATISTICAL EQUITY ARBITRAGE OPPORTUNITIES WITHIN THE SOUTH AFRICAN ENVIRONMENT- CRONJE, P (2004)
72
2003) is: “The relative rate at which the price of a security moves up and down.
Volatility is found by calculating the annualized standard deviation of daily change in
price. If the price of a stock moves up and down rapidly over short time periods, it
has high volatility. If the price almost never changes, it has low volatility.”
Volatility is the standard deviation of the return provided by the shares in one year
when the return is expressed using continuous compounding. According to Hull
(2000:241), it is also the standard deviation of the natural logarithm of the share’s
price at the end of one year. This can be expressed as the standard deviation times
the square root of the change in time or σ √ ∆t. As an example, when ∆t is small, the
σ √ ∆t is approximately equal to the proportional change in the shares price in ∆t.
If σ = 0.3 or 30% and the current share price is R50, the standard deviation of the
proportional change in one week is approximately 0.3√ 1/52 = 0.0416. One standard
deviation move in the shares price in one week is therefore R50 x 0.0416 = R2.08.
2.5.4.2 HISTORICAL VOLATILITY
To calculate the historical volatility, the changes in the historical prices are measured
at set time intervals, for example daily, weekly etc. These measurement cycles will
be repeated over a set parameter or period of time with measurement of the prices
following a settlement-to-settlement structure.
Hull (2000:242) provides the following formula to estimate volatility from historical
data:
µi = 1/n (Si/Si-1)
Page 88
MANAGING PURE AND STATISTICAL EQUITY ARBITRAGE OPPORTUNITIES WITHIN THE SOUTH AFRICAN ENVIRONMENT- CRONJE, P (2004)
73
The usual estimation of the standard error of the standard deviation of the µi is given
by:
s = √ 1/n-1 ∑ni=1 (u1 – û)2
s = √ 1/n-1 ∑ni=1 µi
2 1/n( n-1) (∑ni=1 ui )
2
where
n +1 = number of observations,
Si = shares price at the end of the ith interval (i=0,1,…n),
µ1 and ui = the drift rate of a shares price or the µ shows the shares price grows at a
continuously compounded rate per unit of time,
û = the mean of the ui’s, and
the standard deviation can be estimated as:
σ* = s/√ô
where
T = the length of time interval in years.
From this equation the standard error of the estimate can be calculated using the
following formula:
σ* = σ/√2n
Hull (2000:242-243) points out that when doing volatility calculations one should
consider that it is proportional to the square root of time. Of the 365 days in a year
there are about 252 trading days and when calculating volatility, the calculation
should only use the days that the exchange trades i.e. don’t use weekends and
public holidays.
Natenburg (1994:65) assumes that there are 256 trading days annually and explains
that to approximate an annual volatility of a share the √256 would be used to get a
value of 16. The trader can approximate the daily volatility by dividing the implied or
historical volatility by 16. As an example, if the trader has a futures contract at R100
and a volatility of 20%, a one standard deviation price change over a day is
20%/16=1.25%. We therefore expect to see a price change of R1.25 or less two days
Page 89
MANAGING PURE AND STATISTICAL EQUITY ARBITRAGE OPPORTUNITIES WITHIN THE SOUTH AFRICAN ENVIRONMENT- CRONJE, P (2004)
74
out of every three or 66% of the time, or a change of R2.50 or less approximately 19
days out of every 20 or about 95% of the time.
To calculate weekly volatility one will use 52 weeks and therefore √ 52 will provide a
volatility equal to 7.2. The average weekly volatility is 20% / 7.2 =2.75%, which
means that the trader would expect to see a price change of R2.75 or less two weeks
out of every three, and a price change of R5.50 or less 19 weeks out of every 20. In
only one week in twenty would we expect to see a change greater than R5.50, which
can be viewed as those cases which deviated by more than two standard deviations
from the norm.
2.5.4.3 IMPLIED VOLATILITY
The implied volatility is the market's consensus of what the volatility should be as a
result of the price at which the option is trading. Implied volatility available on
www.investorwords.com [2000?] defines implied volatility as: “A theoretical value
designed to represent the volatility of the security underlying an option as determined
by the price of the option. The factors that affect implied volatility are the exercise
price, the riskless rate of return, maturity date and the price of the option. Implied
volatility appears in several option pricing models, including the Black Scholes Option
Pricing Model.”
Many option traders use strategies that focus exclusively on the implied volatility of
an option. Opportunities for profit may occur whenever the implied volatilities differ for
options with the same underlying security and similar maturities. However, if a futures
contract is trading at R98.50 and the interest rate is at 8%, when looking at a R105
call with three months to expiration, the volatility appears to be 16% when working
out the forecasted volatility. Using this data the theoretical value of the R105 call is
calculated in the Black Scholes Model at R0.96. The theoretical value is then
compared to the price in the market place, which is R1.34. Presuming all inputs are
loaded correctly, the market is therefore using a different volatility to the theoretical or
forecast volatility rate that was calculated. To determine the volatility rate that is
being applied by the market, one can then substitute the markets price into the Black
Scholes model to determine the implied volatility used in the market place. In this
case the volatility used by the market is 18.5%.
Page 90
MANAGING PURE AND STATISTICAL EQUITY ARBITRAGE OPPORTUNITIES WITHIN THE SOUTH AFRICAN ENVIRONMENT- CRONJE, P (2004)
75
Using this logic we are assuming that the theoretical price of the option is known and
the volatility is unknown. The implied volatility that is used in the market is constantly
changing due to the fact that the underlying price, the option price and the market
conditions are constantly changing. If the traders had an accurate measure of
volatility then they could look at the difference between the option’s theoretical value
and its price in the market and then sell options, which are overpriced relative to the
theoretical value and buy options that are underpriced to the theoretical value.
2.5.4.4 EXECUTION RISK
Central to all arbitrage operations is the ability of the trader to execute the trades at
the prices identified and required in the arbitrage process. The issues relating to
execution risk are in principle an extension of the discussion on liquidity in section
2.5.3.1, due to the fact that where liquidity levels are low the trader will in most cases
not be in a position to execute the trades in the desired manner due to inadequate
demand or supply of the security, or due to the fact that the price at which the trade
will be dealt will be at levels where the bid offer spread is wider than in normal
circumstances and therefore the arbitrage profitability is affected.
2.5.4.5 GREEKS
The Greeks are risk measures applied in measuring and managing the risks
associated with derivatives. Each of the components of these measures aims to
reflect on the risk inherent in an option or portfolio of options such that the trader and
the risk manager can use these measures to manage the portfolio and effect hedges
which are aimed at reducing the risk that is associated with the portfolio’s position.
Each of the measures which are discussed below forms a critical measure that is
used by trader’s in their efforts to understand and reduce the risks and exposures
that may be associated with a position at a specified time.
More formally, Greeks, www.riskglossary.com [2002?], defines these measures as
follows: “The Greeks are a set of factor sensitivities used extensively by traders to
quantify the exposures of portfolios that contain options. Each measures how the
portfolio's market value should respond to a change in some variable – an underling,
implied volatility, interest rate or time. There are five Greeks:
• delta measures first order (linear) sensitivity to an underling;
• gamma measures second order (quadratic) sensitivity to an underling;
Page 91
MANAGING PURE AND STATISTICAL EQUITY ARBITRAGE OPPORTUNITIES WITHIN THE SOUTH AFRICAN ENVIRONMENT- CRONJE, P (2004)
76
• vega measures first order (linear) sensitivity to the implied volatility of the
underling instrument.
• theta measures first order (linear) sensitivity to the passage of time;
• rho measures first order (linear) sensitivity to an applicable interest rate.
They are called the Greeks because four out of the five are named after letters of the
Greek alphabet. Vega is the exception. For reasons unknown, it is named after the
brightest star in the constellation Lyra. At times, vega has been called kappa, but the
name vega is now well established.”
2.5.4.6 DELTA (∆∆ )
Delta www.riskglossary.com [2002?], describes the delta as “ … the slope of the
tangent line fit to the portfolio's value function at the current underling value.” The
same web page offers the example in Figure 2.10 below, where the current underling
value is USD 101, and the slope of the tangent line 0.8 million (MM). Therefore for
each unit increase in the underlying instrument, the portfolio's price will appreciate by
0.8MM.
Figure 2.10 Delta is the slope of the tangent line
Source: Available www.riskglossary.com [2002?].
Another web page, Delta, www.investorwords.com [2000?], defines delta as “the
change in price of a call option for every one-point move in the price of the underlying
security”, and points out that it is also called the hedge ratio.
Page 92
MANAGING PURE AND STATISTICAL EQUITY ARBITRAGE OPPORTUNITIES WITHIN THE SOUTH AFRICAN ENVIRONMENT- CRONJE, P (2004)
77
Hull (2000:312) provides the following formula with which the delta for a call option
paying a dividend can be calculated:
∆ = e -qTN(d1)
For a put option paying a dividend the formula will be modified to:
∆ = e -qTN(d1) – 1
where
d1 = (ln(S0/X)+(r-q+σ2/2)T)/ (σ√T).
The delta’s behaviour of an option is reviewed by Natenberg (1994:99-100) who
indicates that when the option is deep in the money, it will have a high delta because
almost all of the gain/loss in the security will be reflected in the option price.
Conversely, a deep out-of-the-money option will have a low delta, because very little
of the gain/loss in the security is reflected in the option price. As an in-the-money
option nears expiration, the delta will approach 100% because the amount of time
remaining for the option to move out-of-the-money is small. Puts always have
negative deltas; because when the value of the underlying increases, the value of the
put therefore falls, and when the value of the underlying falls, the put gains value.
The delta may also be used to determine the correct number of shares to buy or sell
in order to form a “riskless hedge.” Forming a riskless hedge gives one the potential
of earning arbitrage profits, by profiting from the mispriced option's return to its fair
market value (i.e. the price at which the option is neither overpriced nor under
priced). Theoretically, the market will eventually value under priced options at their
fair market value. However, it should be noted that high transaction costs may
undermine this theory to the extent of the magnitude of the transaction costs.
Chew (1996:98) points out that delta hedging presumes that the delta hedge ratio is
correct, as the delta is calculated using an equation that relies on the volatility (which
is derived). Given the fact that the volatility is uncertain, the delta hedge
recommendation may not always be correctly reflected.
Page 93
MANAGING PURE AND STATISTICAL EQUITY ARBITRAGE OPPORTUNITIES WITHIN THE SOUTH AFRICAN ENVIRONMENT- CRONJE, P (2004)
78
The trader should view the theoretical aspect of the delta from three perspectives.
The delta could be viewed from the equivalent underlying position perspective, or the
hedge ratio perspective or the rate of change interpretation. Natenberg (1994:101)
provides an example of the application of the delta concept through the hedge ratio.
A call with a delta of 40 requires the sale of two underlying contracts for every five
options purchased as 100/40 equals 5/2, while a put with a delta of -75 has
100/75=4/3 and requires the purchase of three underlying contracts for every four
puts purchased.
The usefulness of this measure lies in the fact that despite the fact that complex
structures with different exercise prices, expiration dates and deltas may be traded,
as long as the net delta position is approximately zero, the position is delta neutral.
Five call options each with deltas of 80 and ten put options each with deltas of 40, for
example, would result in an overall exposure of:
(5 x 80) + (10 x - 40) = 0.
This position would result in the book being delta neutral at that point in time.
Natenberg (1994:101) confirms this in that an underlying futures contract has a delta
of 100, and each 100 deltas in option positions represents a theoretical position
equivalent to one underlying futures contract, therefore the options deltas can be
offset against those of the futures and underlying shares. Section 2.5.5 “Dealing and
Delta Hedging Processes” elaborates on the use of delta hedging in the trading
environment as the delta hedging concept is central to the management of all
derivative positions and arbitrage positions are no exception to this statement.
2.5.4.7 GAMMA( ΓΓ )
One of the primary risk measures that relates to the risks associated with an option is
a measure called gamma. The gamma of an option shows the anticipated change in
the delta for a change in the price of the underlying security (Natenburg, 1994:103).
As the gamma will change for each price level, this measure should not be
considered to be static. A high gamma figure would indicate a large change in the
delta of the option as a result of relatively small change in the price of the underlying
security.
Page 94
MANAGING PURE AND STATISTICAL EQUITY ARBITRAGE OPPORTUNITIES WITHIN THE SOUTH AFRICAN ENVIRONMENT- CRONJE, P (2004)
79
In the event that a call and put option have the same strike price and maturity date,
the gamma values of the call and the put will be the same in cases where the interest
rates are zero. If interest rates are not zero, the gamma values may differ slightly due
to the fact that the early exercise optionality may affect the gamma value. The
Gamma for any long position in either a call or a put will be positive, and for any short
position in options the gamma will be negative according (Natenberg, 1994:103-105).
Hull (2000:324) provides the following formula to calculate an index option’s gamma
value where no dividend is paid:
Γ = N’(d1) / S0σ √T
where
d1 =(ln(S0/X)+(r+σ2/2)T)/ (σ√T)
on an index paying a dividend
Γ = N’(d1) e -qT/ S0σ √T
where
d1 = (ln(S0/X)+(r-q+σ2/2)T)/ (σ√T).
Gamma indicates the amount of risk involved with an option position, as a large
gamma indicates higher risk, because the value of that option will change more
quickly than the value of an option with a low gamma. This measure therefore
reflects the rate at which the option behaves more or less like the underlying and is
therefore an important measure of the directional risks that the trader has on the
book.
If an option has a gamma of 5, for each point rise (fall) in the price of the underlying,
the option’s delta will gain (lose) 5 delta points. Therefore if the option has a delta of
25 and the underlying moves up (down) one point the new delta will be 30 (20). The
larger the gamma position, the larger the degree of risk currently on the trader’s
book. Natenberg (1994:105-107) shows that the behaviour of the gamma can be
summarised by way of the following general statements:
Page 95
MANAGING PURE AND STATISTICAL EQUITY ARBITRAGE OPPORTUNITIES WITHIN THE SOUTH AFRICAN ENVIRONMENT- CRONJE, P (2004)
80
• Gamma is larger for calls or puts that are at the money and this measure
becomes progressively smaller as the option moves further into or out of the
money.
• The gamma increases the closer the time to expiration and should be monitored
to ensure it stays within acceptable risk limits.
The delta-neutral positions can become unbalanced simply through the progression
of time, changes in price of the underlying, and/or changes in volatility (Natenberg,
1994:105-108).
The general view of this research is that the gamma is mainly managed through
limits, as there is no real way to hedge out the gamma exposure directly. This view is
taken, as the only way that would allow the trader to directly affect the gamma would
be to buy or sell an option that offsets the direction of the existing positions. There
are also strategies that may look at correlations to allow the trader to reduce the
gamma exposure on a particular structure by buying or selling an option in a highly
correlated instrument.
2.5.4.8 THETA (ΘΘ )
The theta or “time decay” shows the change in the option's price (in points) due to the
effect of time alone. Theta is defined by Theta, www.investorwords.com [2000?], as:
“the ratio of the change in an option's price due to the decrease in its time to
expiration also called time decay”. The longer the time until expiration, the lower the
effect that time has on the price of the option. As an option nears expiration, the
effect of time will be greater, particularly on out-of-the-money options. Conversely,
the more time until expiration, the better chance the option has of being in the money
at expiration and the lower the theta. The only exception to this positive relationship
is deep in the money put options with an expiration date far into the future. In
summary, options with low thetas are preferable (for purchase) to those with high
thetas. Any long option position has a negative theta and will lose money more
rapidly as time progresses (Natenberg, 1994:111). He also points out that the theta is
therefore opposite to the gamma, where the long option has a positive gamma and
the short option has a negative gamma.
Page 96
MANAGING PURE AND STATISTICAL EQUITY ARBITRAGE OPPORTUNITIES WITHIN THE SOUTH AFRICAN ENVIRONMENT- CRONJE, P (2004)
81
This time decay factor is the rate at which an option loses value as time progresses
and is best explained by way of an example. If the option’s theta is 0.05, the option
will lose 0.05 in value each day that passes with no change in the market conditions.
Therefore if the option is worth R2.75 today, tomorrow it will be worth R2.70.
Hull (2000:320) provides the following calculation for the theta of an equity option:
Θ = (-(S0N’(d1)σ)/(2√T))-(rXe-rTN(d2))
where
d1 = (ln(S0/X)+(r+σ2/2)T)/ (σ√T).
d2 = d1- σ√T.
The calculation for the theta on a European Index option paying a dividend is:
Θ = (-(S0N’(d1)σe-qT)/(2√T))+(qS0N(-d1)e-qT )-(rXe-rTN(d2))
where
d1 = (ln(S0/X)+(r-q+σ2/2)T)/ (σ√T).
d2 = d1- σ√T.
2.5.4.9 VEGA OR KAPPA (κκ )
Vega shows the change in the option price due to an assumed 1% change in the
volatility of the underlying security. Vega shows the dollar amount of gain that should
be expected if the volatility changes by one percent (all else being equal). If the
option has a vega of 0.15 for each percentage change in volatility, the option will gain
or lose 0.15 in theoretical value. If an option has a vega of 0.15 a volatility of 21%
and a price of R3.40, then a reduction in the volatility to 19% will decrease the price
of the option to R3.10 [R3.40 – (0.15 x 2%)], according to Natenberg (1994:114).
Another definition of vega which may be considered here is that of
www.investorwords.com [2000?], which defines vega as “the change in the price of
an option that results from a 1% change in volatility”.
Volatility and the option price is always positively correlated as the greater the
volatility of the underlying security, the better chance the option has of being in the
Page 97
MANAGING PURE AND STATISTICAL EQUITY ARBITRAGE OPPORTUNITIES WITHIN THE SOUTH AFRICAN ENVIRONMENT- CRONJE, P (2004)
82
money at expiration. Therefore, options with higher volatilities will cost more than
those with lower volatilities. Since vega measures the sensitivity of an option to a
change in volatility, options with higher vegas are preferable (for purchase) to those
with low vegas. In terms of the quantitative approach that should be followed in the
calculation of the vega, Hull (2000:327) shows the formula to be:
κ = S0√T N’(d1)e-qT
where:
d1 = (ln(S0/X)+(r-q+σ2/2)T)/ (σ√T), and
q = dividend yield.
Hull (2000:328) points out that although the Black Scholes Model presumes that
volatility is static over the life of the option, the results that are calculated are very
similar to models where the volatility is presumed to be stochastic.
2.5.4.10 RHO
Rho is defined by www.investorwords.com [2000?] as: “the dollar change in a given
option's price that results from a 1% change in interest rates”. Natenberg (1194:116-
118) points out that options with the highest rho’s are those that are deep in the
money, as they require the highest cash outlay. The greater the time till expiration,
the greater the rho. Furthermore, the means of settlement also has an impact, as
cash type settlement requires an outlay, while futures type settlement results in zero
rho, as there is no cash outlay. The calculation of rho for an European call is
provided by Hull (2000:329) as:
rho = XTe-rTN(d2).
For a European put:
rho = - XTe-rTN(-d2)
where:
d1 = (ln(S0/X)+(r+σ2/2)T)/ (σ√T), and
Page 98
MANAGING PURE AND STATISTICAL EQUITY ARBITRAGE OPPORTUNITIES WITHIN THE SOUTH AFRICAN ENVIRONMENT- CRONJE, P (2004)
83
d2 = d1- σ√T.
2.5.4.11 PARTIAL DIFFERENTIAL HEDGE
The measure of a Partial Differential Hedge (PDH) is in essence an extension of the
sensitivity of the instrument to changes in the price and yield curves, that are used to
price the derivative instrument. While this particular measure is not widely published,
it is a useful addition to the risk management process. The PDH differs from the
sensitivity report in that the sensitivity report will shift the entire curve in a parallel
manner by an absolute or relative amount that is specified by the risk manager. The
PDH on the other hand, will calculate the effect of an absolute or relative move of a
particular point on the curve, and will therefore return the sensitivity of that point to
the elected change. This measure can also be considered the delta of each of the
individual instruments that are reflected on the input curve.
As this method of risk management is simply an extension of the existing sensitivity
of delta and vega measures, the usual sightings of this measure in practice would be
within the systems used by the institutions to trade their derivative instruments.
This research views the PDH as one approach to mathematically determine the
number of options and futures that a trader should trade to neutralise the vega and
delta levels. This is achieved by bucketing the risks in a portfolio into the instruments
that constitute the pricing curve. The recommendation that the PDH provides is
therefore a means to determine the exposure to a certain point in the pricing curve
and also the number of positions that need to be traded in order to reduce the
exposure to that point.
2.5.5 DEALING AND DELTA HEDGING PROCESSES
The traders are responsible for managing the trades that are associated with their
positions and as such they need to maintain their positions within the limits, which
are prescribed by the risk team. As was discussed under the risk management
processes in section 2.5.2 of this chapter, a standardised set of risk measures should
be run by risk monitors on a daily basis to ensure that limits and stress levels are
adhered to. The overall position should be viewed in context of all the risks
(Natenberg, 1994:81-82).
Page 99
MANAGING PURE AND STATISTICAL EQUITY ARBITRAGE OPPORTUNITIES WITHIN THE SOUTH AFRICAN ENVIRONMENT- CRONJE, P (2004)
84
To reduce the risks that are inherent in the portfolio, the trader should hedge the
overall position of the portfolio as this will reduce the risk. When done correctly the
change in price of the underlying will be matched by the increase (decrease) in the
value of the opposing position.
The hedge ratio or delta is the number of positions that will be required to establish a
delta neutral position. The delta of a portfolio is expressed as a figure between 0 and
1 and changes as the market conditions change. If the delta is for example 0.57, this
means that for each option the trader must sell 57% of an underlying contract to
create a neutral hedge. The delta hedging process that is adopted by traders to
become and remain delta neutral is discussed within the framework given by
Natenberg (1994: 82- 86), and which is discussed in the ensuing section.
The example below shows how a delta neutral position can be achieved:
Contract Contract Delta Delta position
Long 100 June 100 calls 57 5700
Short 57 June Futures 100 -5700
Having established a delta-neutral hedge, the position should be reviewed at regular
intervals and the appropriate changes in the holdings of the futures and the June 100
calls should be made, so that each new interval represents a new-hedged position.
To show the effect of this adjustment we can assume that after one week the June
futures price has moved up to 102.26, the risk free interest rate is at 8%, the time to
expiration is nine weeks, and the volatility is 18.3%.
The Black Scholes Model assumes that interest and volatility are constant for the life
of the option. The fact that the volatility does not change in the Model will generate a
new delta that will reflect the reduction in time to expiration and the change in the
underlying security’s price. The new position that will summarise the current risks is
outlined in the position summary below (Natenberg, 1994:83).
Contract Contract Delta Delta Position
Long 100 June 100 calls 62 6200
Short 57 June Futures 100 -5700
500
Page 100
MANAGING PURE AND STATISTICAL EQUITY ARBITRAGE OPPORTUNITIES WITHIN THE SOUTH AFRICAN ENVIRONMENT- CRONJE, P (2004)
85
Clearly, the position is currently long 500 deltas and the trader would need to
transact to return to a delta neutral position, as is outlined below (Natenberg,
1994:84):
Contract Contract Delta Delta Position
Long 100 June 100 Calls 62 6200
Short 62 June Futures 100 -6200
The trader therefore needs to short 5 June futures as adjustments to the original
position. The adjustment is made primarily to ensure that the original position
remains delta neutral, as at the end of ten weeks the trader will act in the following
manner (Natenberg, 1994:85):
1. Out of the money options will expire.
2. The trader will sell any in the money options at parity or the equivalent,
exercising them and offsetting them against the underlying futures contract.
3. Following from the above actions the trader will need to liquidate any
outstanding futures contracts at the market price.
When considering the original hedge at the June expiration and presuming that the
future is trading at R102.54, one can liquidate the June 100 calls by selling them at
R2.54 or by selling futures at R102.54 and exercising the calls. Both will result in a
R2.54 credit to the traders account. As the calls cost R3.25, there is a loss of R3.25 –
R2.54 = R0.71 per option and the total loss is R100 x R0.71 = R71.00.
The original position also resulted in a sale of 57 June futures at R101.35. At
expiration these futures must be bought back at R102.54, which translates into a loss
of R102.54 – R101.35 = R1.19 per contract or 57 x R1.19 = R67.83 on the total delta
hedge. The total loss on the original hedge position is therefore R71 + R67.83
=R138.83.
In the above example the trader would have made weekly adjustments to the original
position throughout the life of the June future. In their endeavours to remain delta
neutral, the trader was forced to buy and sell futures contracts. For example:
At week 1 the transaction was 500 deltas long, so 5 futures were sold at R102.26.
Page 101
MANAGING PURE AND STATISTICAL EQUITY ARBITRAGE OPPORTUNITIES WITHIN THE SOUTH AFRICAN ENVIRONMENT- CRONJE, P (2004)
86
At week 2 the transaction was 1600 futures short, so 16 futures were bought at
R99.07. All the adjustments that were made throughout the life of the June future
resulted in a profit of R205.27.
2.5.5.1 THE CARRYING COSTS
Natenberg (1994:86) shows that to calculate the true profit that was derived from the
previous example, one should look at the cash flows from each of the transactions as
well as the adjustments that were made on a weekly basis. These cash flows should
be discounted at the interest rate, which is 8% in the above example. This interest
factor will then form part of the profit calculation. In the original position the trader
bought calls and sold futures. The options required a cash outlay equal to:
= R100 x R3.25, and
= R325 for 10 weeks at 8% (interest) x 70/365 x R325 = R4.99.
This cost should be included in the calculations.
2.5.5.2 VARIATION COSTS
As the futures move up or down in price, cash will be either credited to or debited
from the trader’s account. The trader’s account must earn interest on cash credits,
and should also pay interest on cash debits. For example, 57 futures contracts may
initially be sold at R101.35. If the futures prices rose to R102.26 one week later, our
account was debited with 57 x (R101.35 – R102.26) =R51.87. Financing the debit
was R51.87 x 8% x 63/365 = R0.72. To remain delta neutral, five additional futures
contracts were sold. At week 2, the futures price fell to R99.07, and the account was
subsequently credited 62 x (R102.26 – R99.07) =R197.78. Interest earned was
R197.78 x 8% x 56/365 = R2.43. The total position can be tabulated as reflected in
Table 2.6 below:
Table 2-6 Summary of the delta hedging process over time
Week
Futures
Price
Delta of
100 call
Total Delta
Position
Adjustment
in Futures
Total
Futures
Adjustment Variation
Interest on
Variation
0 101.35 57 0 0 0 0 0
1 102.26 62 500 sell 5 -5 -51.87 -0.72
2 99.07 46 -1600 buy 16 11 197.78 2.43
Page 102
MANAGING PURE AND STATISTICAL EQUITY ARBITRAGE OPPORTUNITIES WITHIN THE SOUTH AFRICAN ENVIRONMENT- CRONJE, P (2004)
87
3 100.39 53 700 sell 7 4 -60.72 -0.65
4 100.76 56 300 sell 3 1 -19.61 -0.18
5 103.59 74 1800 sell 18 -17 -158.48 -1.22
6 99.26 45 -2900 buy 29 12 320.42 -1.97
7 98.28 35 -1000 buy 10 22 44.10 0.2
8 99.98 50 1500 sell 15 7 -59.50 -1.8
9 103.78 93 4300 sell 43 -36 -190.00 -0.29
10 102.54 buy 36
Source: Natenberg (1994:86)
A total profit of R62.80 was realised in the example and this is close to the expected
profit of R63.00 ((R3.88 – R3.25) = R0.63 X100 = R63.00), which was projected at
the deal’s inception.
This example relies on a frictionless market, which implies the following (Natenberg,
1994:87):
1. Traders can freely buy or sell the underlying contract without restriction.
2. All traders can borrow and lend at the same rate.
3. Transaction costs are zero.
4. There are no tax considerations.
The market is, however, not frictionless and all the assumptions are incorrect to a
greater or lesser degree. Price movements in the futures market are for example
locked once a specified price movement on the market is breached for any trading
day. Also, traders cannot all borrow or lend money at the same rate as the large
financial institutions – fortunately the interest rate component is the smallest factor in
the options pricing. Transaction costs can, however, be very high and brokerage fees
could absorb all profits. Therefore the original trading transaction costs plus the
adjustment costs that are required to remain delta neutral should be closely
monitored. The more adjustments that are made through the life of the strategy, the
greater the transaction costs that will be incurred and the less profitable the strategy
will be.
Professional traders who are exchange members will have lower transaction costs
and subsequently lower adjustment costs. This situation translates to greater
profitability and therefore a competitive advantage in this type of trading.
Page 103
MANAGING PURE AND STATISTICAL EQUITY ARBITRAGE OPPORTUNITIES WITHIN THE SOUTH AFRICAN ENVIRONMENT- CRONJE, P (2004)
88
Retail clients will need to adjust less frequently as the adjustments will reduce their
profit by a greater margin than that of the institutional traders. The retail trader may
therefore experience larger losses and profits than the professional trader due to the
fact that less frequent delta hedges are affected. The effect of taxes should also be
included in calculating the option strategies profitability. For basic calculation
purposes one could exclude this factor from the process described above.
2.5.6 ARBITRAGE IDENTIFICATION AND PROFITABILITY MEASUREMENT SYSTEMS
Internal rate of return (IRR) and capital allocation, will be discussed in more detail
below:
2.5.6.1 INTERNAL RATE OF RETURN (IRR)
The Internal Rate of Return is defined by Brigham & Gapenski (1997:401) as “that
discount rate which equates the present value of a project’s expected cash inflows to
the expected value of the project’s expected costs or, equivalently, forces the NPV to
equal zero”; whereas www.investorwords.com [2000?] defines the IRR as “the rate of
return that would make the present value of future cash flows plus the final market
value of an investment or business opportunity equal to the current market price of
the investment or opportunity”.
The function of the IRR within the equity treasury-trading environment is that it is
used as a profitability benchmark, which each of the trading desks need to achieve.
This is due to the fact that managers and directors of the institutions and companies
need to apply the capital of the firm or institution in a manner, which is aimed at
delivering a return that will meet the desired IRR.
Each product will require a different amount of capital. The profitability that can be
attained is often enhanced by the institution’s ability to offset the arbitrage positions
with one another and therefore they have the ability to reduce the actual capital that
is used in their arbitrage operations. The fact that the arbitrage operation’s capital
requirements are reduced by this offsetting option assists in the trading strategies’
ability to be profitable despite the fact that they often require large notional amounts
to be invested in the trading operations.
Page 104
MANAGING PURE AND STATISTICAL EQUITY ARBITRAGE OPPORTUNITIES WITHIN THE SOUTH AFRICAN ENVIRONMENT- CRONJE, P (2004)
89
2.5.6.2 CAPITAL ALLOCATION
The capital allocation decisions of the firm are the drivers that determine whether a
particular venture will receive the required funding from the business. In the same
manner the arbitrage trading processes will need to compete for the resources and
will be required to provide a return on capital which exceeds or at least equals the
institutions required return on capital, while complying with the required risk limits in
order to qualify for a capital allocation. Capital allocation is described by
www.riskglossary.com [2002?] as “the process whereby business managers decide
in what ventures to invest limited resources. Desirable ventures might offer high
returns on invested resources or minimal risk to those resources. Since the goals of
maximizing returns and minimizing risk are often incompatible, capital allocation is
largely a process of balancing risk against reward. It is a process that has been
pursued – at least informally – since the beginning of capitalism.
It is also pointed out by www.riskglossary.com [2002?] that “capital allocation is
widely employed by trading and lending organizations. It can be used for strategically
deciding which businesses to pursue, but it is also widely employed for assessing
possible trades or deals with counterparties. Individual transactions are assigned
capital based upon the risk they entail, and specific transactions are accepted or
rejected based upon the capital they use and the profit they are expected to
generate. This form of standardised capital allocation largely originated with banks. In
a banking context, capital allocation can be performed in one of two ways:
• regulatory capital allocation, or
• internal capital allocation.
The first approach is a response to capital requirements imposed by statute. The
most recent of such requirements is the 1988 Basle Accord and its amendments,
which include the Basle II guidelines. Today, these requirements apply, in some
form, to banks in most industrialised countries.
The capital that the regulator (South African Reserve Bank) requires the banks to
hold has a cost and it makes sense for banks to minimise – or, rather, optimise –
their use of such capital. For example, the original Basle Accord required banks to
hold capital equal to:
Page 105
MANAGING PURE AND STATISTICAL EQUITY ARBITRAGE OPPORTUNITIES WITHIN THE SOUTH AFRICAN ENVIRONMENT- CRONJE, P (2004)
90
• 0% of holdings in G-10 government debt,
• 1.6% of holdings in G-10 bank debt, and
• 8% of holdings in other debt.
Obviously, such requirements promote the holding of G-10 government and bank
debt over other debt. In this way, regulatory capital requirements – and resulting
regulatory capital allocation by banks – can lead to distortions in the availability of
loans to certain borrowers. Such distortions should force legislators and regulators to
improve or fine-tune capital requirements over time as is evident with Basle II, which
improves on the original Basle Accord.”
Internal capital allocation is usually performed with sophisticated models for risk and
expected return. These models that have been implemented rank transactions
according to their expected return adjusted in some manner for their risk.
Transactions that offer a risk-adjusted return on capital above some threshold are
accepted, while those that do not are rejected.
A natural question is whether regulatory or internal capital allocation is better. The
answer is that this is the wrong question. For non-banks that do not have regulatory
capital requirements, obviously, internal capital allocation is what they will be using.
For banks, internal and regulatory capital allocation serves distinct purposes.
Regulatory capital allocation serves the purpose of minimising – or optimising the use
of expensive regulatory capital. Internal capital allocation has more of a risk
management purpose ensuring that trades or deals are entered into based upon an
analysis of both their expected return and contribution to risk as an organisation has
a limited ability to take on risk.
2.6 SUMMARY
The review of the available literature, which pertains to the management of equity
derivative arbitrage, its component parts, and its pricing, provides the insight that is
required during the later chapters of the research.
This chapter focused on the broad concept of arbitrage and provided definitions of
pure and statistical arbitrage. The sub-components of pure arbitrage, namely index,
single stock futures and dual listed arbitrage were discussed, and then the review
turned to the mathematical methods that have been applied to the identification of
Page 106
MANAGING PURE AND STATISTICAL EQUITY ARBITRAGE OPPORTUNITIES WITHIN THE SOUTH AFRICAN ENVIRONMENT- CRONJE, P (2004)
91
statistical arbitrage opportunities which may present themselves. These were
discussed under the headings of statistical arbitrage, option arbitrage and risk
arbitrage.
The definitions and means of identification are the starting point of the literature
review. With the basic concepts defined and the ability to identify the arbitrage
opportunities that are present in the market, comes the need to manage the risks that
are inherent to the positions taken and which will affect the profitability of the
arbitrage positions. To this end the chapter turned to the management of risk, which
is mainly embedded in the market risk function. The methods of measuring risk and
the means to curtail excessive risk are then discussed in addition to the concepts of
risk limits, the Greeks, liquidity, sensitivity, VaR and volatility. Finally, the methods
used to measure profitability are considered, with a view to providing a structured
method of measuring the traders’ performance relative to one another and relative to
the IRR of the institution.
Page 107
MANAGING PURE AND STATISTICAL EQUITY ARBITRAGE OPPORTUNITIES WITHIN THE SOUTH AFRICAN ENVIRONMENT- CRONJE, P (2004)
92
CHAPTER 3
3. RESEARCH METHODOLOGY
3.1 INTRODUCTION
The first part of this study dealt with the literature research and provided definitions,
methods, models and business practices that pertain to the equity and equity
derivative environment. This chapter details the methodology applied in gathering
and analysing the empirical and time series information pertaining to equity and
equity derivative arbitrage in South Africa.
All the empirical research and time series methodologies which are undertaken by
this research are discussed, described and considered in this chapter, such that the
findings described in later chapters can be reported in a scientific manner.
3.2 DEFINITION OF THE RESEARCH AREAS
The research areas that will receive focus in this study are split into two components.
The first reports on an empirical questionnaire that was distributed to institutions
which deal in equities and equity derivatives. The purpose of the questionnaire was
to establish the most current practice and infrastructure that is applied to the
management of equity and equity derivative arbitrage. The questions explored the
following facets of the respondents’ arbitrage trading activities:
• how long the respective arbitrage types have been traded,
• the volumes of arbitrage types that are traded over the specified periods,
• the methods used to identify the opportunities,
• the methods used to execute the trades,
• the methods used to manage traded positions,
• the methods used to hedge traded positions, and
• the methods used to risk manage the positions.
The first part of the questionnaire is focused on the identification, risk, cost and
trading issues that pertain to trading specific arbitrage types. The latter section of the
questionnaire is more generic in nature and aims to establish the structure of the
Page 108
MANAGING PURE AND STATISTICAL EQUITY ARBITRAGE OPPORTUNITIES WITHIN THE SOUTH AFRICAN ENVIRONMENT- CRONJE, P (2004)
93
business environment, with the view to determine how these structures are managed
from a systems, pricing, human resource, profitability and risk perspective.
The second component of the research analyses market data through a time series
analysis. The methods applied in this section are based on the models identified in
Chapter 2 and seek to determine the extent to which these models are successful in
generating profits within the South African market environment. The time series
information is then also applied in the development of a statistical arbitrage model,
which will incorporate certain market specific data to provide a multiple regression
model used to identify trading opportunities. The consolidated view of both the
empirical and time series analysis are then used to create a method which provides
the most effective manner in which to manage these businesses.
3.3 ARBITRAGE MANAGEMENT PROCESSES AND SYSTEMS
In the following sections the research methodology pertaining to arbitrage
management processes and systems will be discussed with reference to the sample
and target population, the research design and data collection methodology, pre-
testing the questionnaire and the validity of the questionnaire, results of the content
validity testing, and the analysis of the findings.
3.3.1 SAMPLE AND TARGET POPULATION
Zikmund (1997:417) describes a target population as the complete group of specific
population elements relevant to the research project. The target population for this
research consists of all asset managers, stockbrokers, banks, and insurance
companies (both long and short term) as these companies are the primary volume
drivers of trades executed on the JSE and SAFEX. At the time the research was
conducted there were 19 member banks of the Banking Council of South Africa
(www.banking.org.za [1999?]), 68 Investment managers registered under section
13B of the FSB regulations, 64 stock broking institutions and 172 short- and long-
term insurance companies. It can be noted that there is a large overlap of the short
and long term insurance companies in that many of the long-term life companies
have separate short term insurance companies which operate under the same brand
name but which are registered separately to cater for the Financial Services Board
regulations which govern the industry.
Page 109
MANAGING PURE AND STATISTICAL EQUITY ARBITRAGE OPPORTUNITIES WITHIN THE SOUTH AFRICAN ENVIRONMENT- CRONJE, P (2004)
94
Similarly, the investment managers were found to have multiple companies focusing
on different aspects of the investment spectrum. Investment managers are
considered to be the primary participants in the equity markets and therefore have
the greatest interest in the development of models, which may be used to exploit
price mismatches within the equity and derivative markets. Furthermore, these are
also the companies which have the resources to build applications that can be used
to monitor market movements and identify trading opportunities.
The sampling method that has been applied to create the population sample in this
study can be considered to be a hybrid structure, which consists of strata of sub
populations which reflect the representation of the banks, stock brokers, asset
managers, and insurance companies.
As with all stratified sampling it has the limitation that generalisations across strata
may not always be possible due to the fact that the findings in one strata cannot be
applied directly to another with any degree of certainty. This research assumes that
the four strata all play an equally significant role in the equity business and hence
they are included in random proportional or quota-driven samples; subsequently
there are 20 representative institutions from each strata.
The research excludes the treasuries of large retail institutions, as they generally
focus more on the management of the company’s cash and interest rate exposure,
and are therefore not in the business of trading for profits in the equities and equities
derivative markets. Table 3.1 below depicts the sample for this research
questionnaire.
Page 110
MANAGING PURE AND STATISTICAL EQUITY ARBITRAGE OPPORTUNITIES WITHIN THE SOUTH AFRICAN ENVIRONMENT- CRONJE, P (2004)
95
Table 3-1 Sample used in the equity derivative arbitrage research
The sample covers 11 of the 19 Registered local banks, or about 58% of the
registered banking sector. Although 3 of these 19 banks have been taken over or
have been liquidated, the site still reflects these banks. Nine international investment
banks operating in South Africa are included in the study and take the bank sample
to the required 20 participants. About 29%, or 20 of the 68 investment management
companies listed on the FSB’s website (www.fsb.co.za [1998?]), were included in the
sample – these investment mangers are registered under section 13B. At the time of
this research there were 64 stockbrokers listed on the JSE website and of these, nine
were terminating their membership and two were restricted in a manner that did not
allow them to trade equities and warrants. Twenty of the possible 53 remaining
stockbrokers were randomly selected and included in the sample. This translates to
about 38% of the total population of stockbrokers, according to www.jse.co.za
[1999?]. Within the insurance sector, 20 companies were included in the survey. The
exact percentage of the total population is deceptive as many of the companies are
registered for both short- and long-term purposes, while some also have multiple
Banks Stock Brokers Investment ManagersShort and Long Term Insurance Companies
ABSA Bank Ltd Barnard Jacobs Mellet STANLIB ASSET MANAGEMENT LIMITED METROPOLITAN LIFE LIMITED
Barclays Andisa Securities INVESTEC ASSET MANAGEMENT (PTY) LTD MEDSCHEME LIFE ASSURANCE COMPANY LIMITED
Citibank N.A. BOE Stockbrokers M CUBED ASSET MANAGEMENT (PTY) LTD LIBERTY GROUP LIMITED
Deutsche Bank AG
ABSA Securities MOMENTUM ADVISORY SERVICE (PTY)LTD OLD MUTUAL LIFE ASSURANCE COMPANY (SOUTH AFRICA) LIMITED
Investec Bank Ltd
Investec RMB ASSET MANAGEMENT (PTY) LTD MUNICH REINSURANCE COMPANY OF AFRICA LIMITED
Nedcor LtdMerrill Lynch South Africa (Pty) Ltd PRESCIENT INVESTMENT MANAGEMENT (PTY)
LTDMOMENTUM GROUP LIMITED
Rand Merchant Bank LtdKagiso Securities Gryphon Asset Management (PTY) Ltd HOLLARD INSURANCE
COMPANY LIMITED,THE
The Standard Bank of S A Ltd
Gensec Trading (Pty) Ltd Decill ion Fund Management ALEXANDER FORBES INSURANCE COMPANY LIMITED
HSBC Deutsche Securities Metropolitan Asset Managers ALLIANZ INSURANCE LIMITED
ABN Amro PSG Online Securities Limited PRUDENTIAL PORTFOLIO MANAGERS (SA) (PTY) LTD
PROSPERITY INSURANCE COMPANY LIMITED
JP Morgan JP Morgan Equities OASIS ASSET MANAGEMENT (PTY) LTD UNIVERSAL ASSURANCE COMPANY LIMITED
Morgan Stanley Thebe Securities ROBERT COWEN INVESTMENTS (PTY) LTD SANTAM BEPERK
Merrill Lynch South Africa Vector Equities OLD MUTUAL ASSET MANAGERS (SOUTH AFRICA) (PTY) LTD
SANLAM LIFE INSURANCE LIMITED
Commerzbank AGCadiz Stock Broking Capital Alliance Securities (PTY) LTD CAPITAL ALLIANCE LIFE
LIMITED
ING BaringsBP Bernstien ALLAN GRAY LTD CHARTER LIFE INSURANCE
COMPANY LIMITED
Crédit Agricole Indosuez Citigroup Global Capital Markets ALLIANCE CAPITAL MANAGEMENT (PTY) LTD DISCOVERY LIFE LIMITED
Credit Suisse First BostonDWM Securities FINANCE FUTURES & OPTIONS NOMINEES (PTY)
LTDINVESTMENT SOLUTIONS LIMITED
Mettle Treasury Cazenove SA (Pty) LtdCORONATION ASSET MANAGEMENT (PTY) LTD
REGENT LIFE ASSURANCE COMPANY LIMITED
UBS Decillion Securities (Pty) Ltd
CONSILIUM CAPITAL SA (PROPRIETARY) LIMITED
SA EAGLE LIFE LIMITED
First National Bank of SA Ltd Peregrine Equities (Pty) Ltd GIB Financial Services (PTY) Ltd SAGE LIFE LIMITED
Page 111
MANAGING PURE AND STATISTICAL EQUITY ARBITRAGE OPPORTUNITIES WITHIN THE SOUTH AFRICAN ENVIRONMENT- CRONJE, P (2004)
96
companies within the short- and long-term structures. Given the above information,
about 12% of the total insurance sector is included in the sample.
This selection provides a cross section of the industry participants who deal with
shares and derivates on a large scale and therefore the research results should
provide a clear idea of the current thinking within the equity trading and equity
derivative trading industry. Within this sample group of 80 institutions the equity
derivative traders and their directors were requested to complete the questionnaire
(Appendix 2) that was distributed to all institutions in the sample via e-mail.
3.3.2 RESEARCH DESIGN AND DATA COLLECTION METHODOLOGY
Figure 3.1 below provides a process flow of the methodology that has been applied
in gathering and analysing the empirical research of this study.
Figure 3.1 The research methodology adopted in gathering equity arbitrage
information from the South African market environment
The methodology that has been adopted by this research has been aligned to the
current literature describing research methodologies. The idea behind a research
design, according to Zikmund (1997:48), is to create a master plan which identifies
methods and procedures for the collection and analysis of the information forming
part of the study.
S t a t i s t i c a l A n a l y s i s
V a l i d i t y P r e t e s t
S t r u c t u r e d Q u e s t i o n n a i r e
E m p i r i c a l R e s e a r c h S u r v e y M e t h o d
C o n t e n t V a l i d i t y t o e s t a b l i s h t h a t t h e r e s p o n s e s a r e m e a s u r i n g t h e i n t e n d e d t o p i c s
C o n c l u s i o n s
Page 112
MANAGING PURE AND STATISTICAL EQUITY ARBITRAGE OPPORTUNITIES WITHIN THE SOUTH AFRICAN ENVIRONMENT- CRONJE, P (2004)
97
According to Leedy (1993:122) there are four discreet research methodologies which
are dictated by the type of data required, namely:
• The descriptive survey method. This method is appropriate for data derived
from simple observational situations, such as physical observations or
observations between means of questionnaires or poll techniques.
• The historical method. This method is appropriate for the primary data that is
primarily documentary or literature in form.
• The analytical survey method. This method is appropriate for data that is
quantitative in nature and that require statistical techniques to extract its
meaning.
• The experimental method. This method is appropriate for data derived from
an experimental control situation or a pre-test / post-test design.
Given the methodologies described above, this research uses the descriptive survey
method due to the fact that arbitrage information is gathered from a large number of
institutions that share their observations and experience in this research. It was
decided that the most effective and appropriate manner in which to gather this
information would be to use a research questionnaire, as it would be impractical to
perform structured interviews with over eighty individuals at different companies
across the country.
Because of the large size of the sample the questionnaire was distributed through e-
mail and the respondents were then contacted telephonically to confirm that they
have received the questionnaire, to discuss the process required to complete the
questionnaire and the time frames which are applicable for the completion of the
questionnaire. Where respondents did not complete the questionnaire within the time
period provided and where the matter could not be resolved telephonically, the
respondents were visited in order to get them to complete the required form and
ensure that the institution’s input was obtained.
The following aspects raised by Zikmund (1997:385) were considered in designing
the questionnaire:
• complexity should be avoided,
• questions should not be leading or loaded,
Page 113
MANAGING PURE AND STATISTICAL EQUITY ARBITRAGE OPPORTUNITIES WITHIN THE SOUTH AFRICAN ENVIRONMENT- CRONJE, P (2004)
98
• questions should not be ambiguous,
• assumptions should not be made,
• questions should not be double barrelled, and
• the questions should be designed in a manner which allows the respondent to
complete the questionnaire in a short period of time.
Most of the questions were close-ended, but in some instances the respondents
were required to express an opinion or provide alternatives, which were not provided
in the questionnaire. Close-ended questions are preferred and were used in the
questionnaire to allow for:
• the rapid answering of questions,
• keeping questions simple enough to allow the respondents to answer them
without the presence of an interviewer, and
• focusing the respondent’s attention to specific issues that need to be addressed,
by means of structured questions.
The open-ended questions were only used in instances where standard alternatives
were not available and respondents were expected to provide diverse responses.
The questionnaire was split into two areas, the first being questions relating to the
different arbitrage types, and the second being questions relating to the strategic,
business and operational processes that the organisation has adopted. In the first
section the questions were standardised as much as possible between the arbitrage
categories, with the focus being mainly on frequency, identification, profitability and
risk management. Such standardisation was aimed at providing the respondents with
a situation whereby they would only need to think through the meaning of the
question once and would thereafter be in a position to apply that meaning to all types
of arbitrage
3.3.3 PRE-TESTING THE QUESTIONNAIRE AND THE VALIDITY OF THE QUESTIONNAIRE
Zikmund (1997:402- 404) states that the pre-test process should be applied to a
selected group who has a similar makeup to that of the respondents who will finally
complete the questionnaire. The purpose of the pre-testing was to ensure that the
respondents could follow the questionnaire format, that the questionnaire flows
naturally, that the respondents could answer the questions easily, that questions
Page 114
MANAGING PURE AND STATISTICAL EQUITY ARBITRAGE OPPORTUNITIES WITHIN THE SOUTH AFRICAN ENVIRONMENT- CRONJE, P (2004)
99
were not ambiguous, that questions were relevant and that they covered all aspects
included by the research.
The pre-testing was completed by a sub-sample constituting 10 (12.5%) respondents
in the total sample. The makeup of this group can be broken down into different
institutions, namely banks, asset mangers, stockbrokers, insurance companies.
The respondents involved in the pre-testing were required to complete the
questionnaire (see Appendix 2). In addition to the actual questionnaire, a diagnostic
questionnaire was completed (see Appendix 3) by each of the respondents involved
in the pre-testing, such that the content validity could be measured. The findings of
the diagnostic questionnaire are presented by way of frequency distributions for each
of the questions posed, such that a clear picture of the respondent’s views could be
determined.
3.3.4 RESULTS OF THE CONTENT VALIDITY TESTING
There were 10 companies that were asked to complete the section pertaining to
content validity prior to the general distribution to the remaining respondents. The
results can be summarised as follows:
1. All the respondents felt that the questionnaire flowed in a natural and
appropriate manner.
2. All the respondents felt that the purpose of the questionnaire was clearly
understood, and that they understood what the questionnaire hoped to
determine.
3. Nine of the respondents were of the opinion that all the questions were
clear. The view of the one respondent was that less focus should be given
to volatility arbitrage. However, besides this comment the respondent was
comfortable that the questions were clear. The questions were therefore
not altered as a result of this comment as the information was considered
useful in determining whether the companies had the ability to cater for
options in their arbitrage trading strategy.
4. Eight of the respondents were of the opinion that there were no
ambiguous questions in the questionnaire. Two were, however, not
comfortable and as a result of this, two questions were rephrased in a
more concise manner.
Page 115
MANAGING PURE AND STATISTICAL EQUITY ARBITRAGE OPPORTUNITIES WITHIN THE SOUTH AFRICAN ENVIRONMENT- CRONJE, P (2004)
100
5. All of the respondents felt that the questions were relevant with further
commentary being that while they may be relevant, they may not be
relevant to all parties given the fact that not all parties trade all arbitrage
types.
6. Six of the respondents felt that the questions were not too sensitive, but
four of the respondents were of the view that some of the information
requested was sensitive and they could therefore not answer all
questions. On further analysis it was determined that the concerns related
mainly to salaries paid by the institutions and the market risk and stop loss
levels that are applied by the organisations. The questions were left
unaltered for those companies who were prepared to share the
information.
7. The average time taken to complete the questionnaire was about 31
minutes.
3.3.5 ANALYSIS OF THE FINDINGS
The approach that is followed in this section of the research is focused on
determining the general practices applied in equity derivative arbitrage. For this
reason the majority of the statistical information gathered in this section of the
research is reflected through frequency distributions of the responses received.
These distributions allow for the correlation of responses across questions which in
turn allows second order conclusions to be generated from the responses received.
3.4 QUESTIONNAIRE CONTENT
3.4.1 EQUITY DERIVATIVE AND ARBITRAGE PROCESSES
3.4.1.1 TRADING PROCESSES
The research firstly establishes whether the respondents trade a specific arbitrage
type and this information is consolidated across the sample to determine the sample
mean of respondents who trade the specific arbitrage type. Where the respondents
do not trade an arbitrage type, a series of options is provided which are used to
determine why this is the case.
Page 116
MANAGING PURE AND STATISTICAL EQUITY ARBITRAGE OPPORTUNITIES WITHIN THE SOUTH AFRICAN ENVIRONMENT- CRONJE, P (2004)
101
Where the respondents indicated that the business which they represent trades one
or more of the arbitrage types under review, the questionnaire aims to determine
whether their view was that the process could be improved, and if so how this would
be achieved. These results are presented through frequency distributions and tables
reflecting the cumulative results.
3.4.1.2 IDENTIFICATION PROCESSES
The trade identification process adopted by the market is critical to the success of
any arbitrage trading that takes place. In this section the focus areas are the manner
in which the market participants identify the trading opportunities and the duration of
the opportunities, i.e. the duration of the visibility in the market. The results are
presented as the number of the sample, applying different methods of identifying
trading opportunities. A frequency distribution of the market’s view of the duration of
arbitrage opportunities is also provided.
3.4.1.3 PROFITABILITY SIMULATIONS
This area of the study analyses the current level to which the industry has developed
systems aimed at maximising the performance of the returns of arbitrage
opportunities through the use of simulations. These simulations can be viewed as
being both backward and forward looking. The backward-looking simulations entail
that the historic profitability can be calculated and can be used as a benchmark for
the future trades. The forward-looking simulations rely on the profit maximisation
results of the backward looking simulations to create the most likely situation which
can then be used to generate the trade combinations which will generate the greatest
future profitability.
The focus of the research in this area is primarily to establish whether the industry
has adopted either of these simulation approaches in their attempts to increase
profitability. The questions posed to the respondents do not delve into the very
workings of the models used to analyse the historical and projected profitability of the
trades as this information is considered to be proprietary and will either be partially
disclosed or will not be disclosed at all. The results of these questions are presented
in simple statistical format showing the number of respondents in the sample who
use these simulation methods.
Page 117
MANAGING PURE AND STATISTICAL EQUITY ARBITRAGE OPPORTUNITIES WITHIN THE SOUTH AFRICAN ENVIRONMENT- CRONJE, P (2004)
102
3.4.1.4 TRADER’S DISCRETION
With the exception of programme trading the final decision about whether an
arbitrage trade should be entered into is at the discretion of the trader. For this
reason the research attempts to determine whether the managers of the arbitrage
traders feel that all opportunities that present themselves in the market are
capitalised upon by traders, hence how effective the traders really are.
The findings of the research questionnaire are presented as the number of
businesses within the sample, that feel that their trader’s are effectively controlled
and whether they may miss trades on occasions. These findings are reflected as the
number of institutions who rely on the trader to determine all trade opportunities.
3.4.1.5 EXECUTING TRADES TO ENSURE ARBITRAGE
In this section of the research, the instruments used to execute the arbitrage types
are analysed. The research focuses on the fact that for the pure arbitrage to be
successful the price differential must be locked in and this is done through the
purchase or sale of either the underlying or one of the associated derivative
instruments. In the case of statistical arbitrage, the research also determines which
instruments are used to effect the arbitrage trades.
The types of arbitrage trading and the implied frequency of the trades is analysed per
arbitrage type and presented in terms of the number of institutions that trade the
respective arbitrage types and what instruments they use to execute the arbitrage.
Further information in terms of the instruments used to cover the exposures is also
presented, per arbitrage type.
The respondents were requested to give an indication of whether they use a Partial
Differential Hedge (PDH) to manage their risk and where they do not use this
measure the questionnaire aims to establish the reasons for not using this risk
measure. The view taken by the research is also that where pure arbitrage is being
traded the execution of the arbitrage in itself leaves the investor in a position that is
delta neutral and does not require elaborate mechanisms to lock in the arbitrage
profits.
Page 118
MANAGING PURE AND STATISTICAL EQUITY ARBITRAGE OPPORTUNITIES WITHIN THE SOUTH AFRICAN ENVIRONMENT- CRONJE, P (2004)
103
3.4.1.6 STOP LOSSES
The application of stop losses to trades that have been entered into is common to
most trading strategies and also applies to all statistical arbitrage types. For this
reason the research aims to reflect the general market approaches that are adopted
for stop losses. The areas analysed are firstly whether a stop loss is indeed applied
and adhered to. Secondly, the aim is to determine at what level the respondents
implement their stop loss levels and lastly to determine whether the stop losses are
applied in a rigid manner to all statistical arbitrage types. In other words, whether the
same stop loss level applies to every statistical arbitrage type or whether some
statistical arbitrage types are considered more risky and that a more stringent stop
loss is therefore applied.
In order to establish the risk appetite for the individual arbitrage opportunities, the
respondents are requested to provide a stop loss level for each statistical arbitrage
type. This information can then be analysed across the sample to establish the extent
to which stop losses differ and the average levels at which each of the stop losses
are applied to the statistical arbitrage types. This allows for inferences regarding the
arbitrage types that respondents consider to carry the greatest level of risk.
This information is presented as the number of institutions that apply a stop loss to
each of the statistical arbitrage types. The average stop loss levels that are applied
by the industry to each of the arbitrage type is also reflected. This information is
presented in the form of frequency distributions reflecting the findings relating to the
respondents responses.
3.4.1.7 DURATION OF TRADES
The research aims to establish the average duration of the visibility of each of the
arbitrage types. The options provided to the respondents range from one day to three
months. The view of the research is that the longer the duration of the opportunity,
the less obvious it is to the market and the less effective the market is in removing
these opportunities. The findings are reflected through a frequency distribution
showing the average time the respondents consider the opportunities to be visible in
the market.
Page 119
MANAGING PURE AND STATISTICAL EQUITY ARBITRAGE OPPORTUNITIES WITHIN THE SOUTH AFRICAN ENVIRONMENT- CRONJE, P (2004)
104
3.4.2 GENERAL RISK MANAGEMENT PROCESSES
The general risk management processes which are discussed here involve
processes adopted in measuring risk, limits, delta, gamma, volatility, vega and rho.
3.4.2.1 PROCESSES ADOPTED IN MEASURING RISK
It was pointed out in Chapter 2 that there are two types of arbitrage that are analysed
in this research. The first is pure arbitrage, which in theory results in a virtually risk
free profit situation, while the second is statistical arbitrage, which has a high
mathematical probability of making money, but the profit is not risk free.
For pure arbitrage the view is held that there should be no risk inherent in the
positions that form part of the equity arbitrage book. If all risk cannot be removed
through the transactions that establish the arbitrage, it is implied that there is a
deviation from the concept of a risk free return on arbitrage and hence the arbitrage
is not considered to be a pure arbitrage.
The arbitrage process flows from the fact that an identified price discrepancy requires
the trader to take certain steps to lock in the profit on the price discrepancy. This
entails buying one instrument, which is considered to be inexpensive, while selling a
related instrument, which is overpriced relative to the instrument being bought. This
situation will cover simple static situations used for pure arbitrage strategies.
However, when volatility and statistical arbitrage trades are placed on the book, a
dynamic hedging process must be adopted as the quality of the hedges may decay
over time and these hedges must therefore be adjusted.
This implies that the risk management function needs to have a thorough
understanding of the positions that the book or portfolio is running and how each of
these positions translate into the risks reflected through the risk measures. This
information is gathered through the summation of the risks associated with the deals
that form part of the trading portfolio. These deals contribute to the limit and risk
utilisation as calculated by the market risk managers.
Page 120
MANAGING PURE AND STATISTICAL EQUITY ARBITRAGE OPPORTUNITIES WITHIN THE SOUTH AFRICAN ENVIRONMENT- CRONJE, P (2004)
105
3.4.2.2 LIMITS
The market’s view relating to the risk limits is determined by establishing what sorts
of limits the respondent’s of the questionnaire use. The questionnaire provides the
respondents with a range of options relating to the limits that are commonly used by
the risk functions, such as currency limits, exposure limits, VaR limits, limits on the
Greeks etc. The respondents are also provided with the opportunity to provide
information on other limits that are applied within their business environment. The
findings relating to the applied limit types are presented as frequency distributions.
In addition to the trading limits described above the research also aims to determine
at what levels the sensitivity limits have been set for each of the underlying limits.
This is primarily a market risk function, but the interest in this measure from a
research perspective relates to the fact that the lower the limits that are applied, the
less trading that is allowed for each arbitrage type. This question is posed in an
open-ended manner, and the findings are presented as a frequency distribution.
3.4.2.3 DELTA
The delta concept was discussed in Chapter 2, section 2.5.4.6 and basically
measures the sensitivity of the derivative instrument to changes in the price of the
underlying instrument. In the case of futures, the future is deemed to have a delta of
100 to the underlying instrument. The analysis is therefore considered mainly for
options positions traded in the arbitrage process.
The questionnaire aims to establish whether the institution has the ability to readily
measure the delta positions that are embedded in their trades and the results are
presented as the percentage of the sample, that have the ability to measure their
delta positions.
Where the respondents do measure the delta, an open-ended question is posed
which aims to determine how the delta risk is managed in the institution. The results
gathered in this manner are then presented through a frequency distribution.
Page 121
MANAGING PURE AND STATISTICAL EQUITY ARBITRAGE OPPORTUNITIES WITHIN THE SOUTH AFRICAN ENVIRONMENT- CRONJE, P (2004)
106
3.4.2.4 GAMMA
The concept of the gamma that a position may have created was discussed in
Chapter 2, section 2.5.4.7, and was described as the extent to which the delta will
change as a result of a change in the price of the underlying share. Here again this
relates to option trading and therefore a large segment of the sample may not use or
require this measure.
The questionnaire aims to determine whether the respondents measure the gamma
positions that are on the book as a result of the positions that have been traded.
Whether they do have the ability to readily calculate the gamma positions and, how
they hedge the gamma exposure without closing out the positions that have been
traded is also determined.
The results are presented firstly as the percentage of the sample that measure the
gamma associated with their positions and secondly how the market participants
manage the gamma risk that they may have accumulated is shown through a
frequency distribution.
3.4.2.5 VOLATILITY
The questionnaire sets forth a series of questions, which aim to determine the
market’s perception towards the use of historical and implied volatility in pricing
options.
The primary area that is considered is at what point the market prefers to trade using
the theoretical price, which then drives the market price back towards the theoretical
price and therefore results in the price convergence which is of interest from an
arbitrage perspective. The results are presented as a frequency distribution reflecting
the sample’s view on when the market should trade the theoretical or market prices.
3.4.2.6 VEGA
The vega was defined in Chapter 2, section 2.5.4.9, as the measure that is used to
determine the effect on the price of an option which results from a change in the
volatility of the instrument. The areas considered meaningful with regard to the vega
Page 122
MANAGING PURE AND STATISTICAL EQUITY ARBITRAGE OPPORTUNITIES WITHIN THE SOUTH AFRICAN ENVIRONMENT- CRONJE, P (2004)
107
are whether the respondents measure the vega exposures that are inherent in the
positions that they may be holding as a result of their arbitrage trades. The results
are shown as the percentage of respondents who can measure their vega exposure.
Where respondents trade options and they actively measure the vega associated
with their positions, the questionnaire then aims to determine whether the
respondents use the vega recommendation to manage exposures that the option
positions may have created. The findings are presented as the number of institutions
that use the vega to measure and reduce exposure that results from option positions.
3.4.2.7 RHO
The respondents are required to answer certain questions that relate to the arbitrage
position’s sensitivities to changes in the interest rate. This measure was discussed in
Chapter 2, section 2.5.4.10, and relates primarily to options and futures through their
reliance on the projected and realised interest rate in their pricing.
The respondents were asked whether the rho is a risk measure that is actively
monitored from a trading and risk management perspective within the equity
derivative arbitrage environment. Where the respondents answer in the affirmative,
this fact is noted and added to the total number of respondents who actively utilise
this measure. Where the respondents answer in the negative, the questionnaire aims
to determine the underlying reason why the measure is not employed within the
environment. The results of the research are presented as the number of institutions
in the sample using the rho as a risk measure and where the respondents do not use
this measure a frequency distribution, is used to show the reasons why they do not
use this measure.
3.4.3 COST PROFIT MEASUREMENT PROCESSES
The relevant aspects in the cost profit measurement process are the measuring of
equity trading costs and the measuring of profitability. These aspects will be
discussed in the sub-sections below.
Page 123
MANAGING PURE AND STATISTICAL EQUITY ARBITRAGE OPPORTUNITIES WITHIN THE SOUTH AFRICAN ENVIRONMENT- CRONJE, P (2004)
108
3.4.3.1 MEASURING EQUITY TRADING COSTS
The major cost drivers in equity and equity derivative trading relate to the transaction
costs and securities lending costs. The respondents are required to rate which
expenses contribute most to their overhead costs for each of the respective arbitrage
types. All responses are then consolidated and presented in a frequency distribution
for each arbitrage type.
Further costing details are gathered by establishing what the average human
resource cost component of the arbitrage operations are. This is determined by
questions about the number of arbitrage traders employed, the average cost of each
trader and whether the cost allocation per trader is split into various business units. In
other words, whether all arbitrage traders are centralised in one area or dispersed
into various sections of the business. This information is again presented through a
frequency distribution.
Further information that is pertinent to the costing is whether the traders only trade
arbitrage positions or whether they also trade other equity related positions. If they
trade a range of equity related positions, a portion of their cost should be allocated to
that trading strategy. This information is presented as the number of respondents
trading arbitrage positions that do not only focus on arbitrage trading.
The questions also focus on determining the cost per trade on each of the relevant
exchanges, the cost of securities lending, and the average cost per trader. These
findings are represented through frequency distributions per cost type.
3.4.3.2 MEASURING PROFITABILITY
The respondents’ ability to measure the profitability of each arbitrage type is
presented per arbitrage type. This profitability is a function of the gross return that the
arbitrage positions provide, less all the associated costs that are incurred in the
trading processes. The details of these costs were discussed in section 3.4.3.1
above.
For the purposes of the research, costs will be split into direct cost, which are the
visible costs of trading and indirect cost, which are allocated to the business unit, but
Page 124
MANAGING PURE AND STATISTICAL EQUITY ARBITRAGE OPPORTUNITIES WITHIN THE SOUTH AFRICAN ENVIRONMENT- CRONJE, P (2004)
109
which cannot be controlled directly by the traders. The allocated indirect costs will not
form a part of the analysis, simply because these costs will vary between institutions
and because the trading desks cannot control these in their day-to-day business. At
best the trading desks can aim to achieve the highest return possible prior to taking
into account the allocated costs.
Questions relating to whether the arbitrage operation should be expanded provides
insight into whether arbitrage trading is profitable or not, as where the respondents
feel that they need to expand the business, this also implies that the strategy is
profitable and adding to their capacity will allow greater profitability. The result is
reflected as the number of the respondents wanting to expand this area of their
business.
The respondents were asked whether they would discontinue their arbitrage
operations in the event that the operations do not meet the profitability requirements
of the institution for certain set periods of time. These responses are measured in
terms of how many years it would take before the arbitrage operation is closed down,
where it does not meet the profitability requirements. These findings are presented
as a frequency distribution of the average time it would take the institutions to decide
to close down the arbitrage business where the business type is not deemed to be
profitable.
Another measure in the questionnaire is whether the respondents consider the
arbitrage operations to provide any strategic advantage. This could be the case as
the operations may assist in the neutralisation of positions that the equity derivative
operation have on the books at certain periods in time. Where this is the case, this
fact may influence their decision to keep the arbitrage desk running despite the fact
the business does not directly meet the profitability requirements. This result is
reflected as the number of respondents in the sample who do consider their arbitrage
operations to provide a strategic advantage.
3.5 IDENTIFICATION OF ARBITRAGE OPPORTUNITIES
The research design and data collection methodology is of particular importance for
the identification of arbitrage opportunities.
Page 125
MANAGING PURE AND STATISTICAL EQUITY ARBITRAGE OPPORTUNITIES WITHIN THE SOUTH AFRICAN ENVIRONMENT- CRONJE, P (2004)
110
3.5.1 RESEARCH DESIGN AND DATA COLLECTION METHODOLOGY
This section of the study relies on the use of market trade data received from the
Johannesburg Stock Exchange (JSE) and the South African Futures Exchange
(SAFEX). The closing prices, rates, and dividend yields, which are used in future and
option calculations, are taken from Bloomberg and Reuters. The closing prices are
also used to calculate the historical volatility and are the primary inputs to the
statistical trading.
The valuation models that are applied in this research analysis are drawn from
Chapter 2, and are applied in the manner prescribed in the relevant source
documentation. While there is not always one correct mathematical technique to
derive a particular answer, this research follows those practices prescribed by the
authors referenced in the literary review. Figure 3.2 below reflects the methodology
employed in the time series analysis undertaken by this research.
Figure 3.2 Representation Of The Research Methodology Adopted In Analysing
Equity Arbitrage Opportunities Using A Time Series Approach
D e s c r i p t i v e S t a t i s t i c a l
A n a l y s i s
S t a t i s t i c a l A n a l y s i s
T r a d e d a t a a n d
c l o s i n g s h a r e p r i c e s
T i m e S e r i e s
R e s e a r c h M e t h o d
C o n c l u s i o n s
I n f e r e n t i a l S t a t i s t i c a l
A n a l y s i s
M e a n a n d h i s t o g r a m s t o d e s c r i b e c e n t r a l t e n d e n c y
a n d d i s t r i b u t i o n s
M e a s u r e s t h e p r o f i t a b i l i t y o f a r b i t r a g e
o p p o r t u n i t i e s
Page 126
MANAGING PURE AND STATISTICAL EQUITY ARBITRAGE OPPORTUNITIES WITHIN THE SOUTH AFRICAN ENVIRONMENT- CRONJE, P (2004)
111
For the purpose of this research, arbitrage opportunities were investigated with
reference to the Johannesburg Stock Exchange (JSE), the South African Futures
Exchange (SAFEX), dividend yields and dividends, risk free rates, stop loss strategy,
the number of trades and volumes traded, transaction costs, profitability, index and
single stock futures, risk or merger arbitrage, dual listed arbitrage, statistical
arbitrage, and volatility arbitrage.
3.5.1.1 JSE SECURITIES EXCHANGE (SA)
The starting point of derivative valuation is the underlying instrument and therefore
emphasis was placed on receiving the correct trade price and trade data pertaining to
the trades on the ALSI Top 40 shares. To facilitate this requirement the JSE
Securities Exchange (JSE) was approached to provide all the trade data that relates
to the ALSI Top 40 constituents for the specified period being researched.
The share price and other trade data were used in conjunction with the futures trade
data that was provided by SAFEX and was applied to SSF trade calculations. The
period over which the analysis using this trade by trade data took place is 02 January
2001 to the 30 December 2002 and this involved about two million trades on the
ALSI Top 40 shares. The purpose of including all trades that took place on the
exchange was to avoid situations where the prices in question were non
simultaneous in nature.
The data was requested and provided in the following format:
• Trade date
• Trade time
• Share or warrant name
• Number of shares/warrants traded
• Price at which the trades occurred.
This information serves as the basis for the conversion into the theoretical price of
the related derivative instruments given the dividend and risk free rates that are
required to calculate the theoretical price. These calculated theoretical prices
become the basis of comparison to the actual price of the traded derivative
instrument.
Page 127
MANAGING PURE AND STATISTICAL EQUITY ARBITRAGE OPPORTUNITIES WITHIN THE SOUTH AFRICAN ENVIRONMENT- CRONJE, P (2004)
112
3.5.1.2 SOUTH AFRICAN FUTURES EXCHANGE (SAFEX)
In order to establish the extent of the price discrepancies within the futures market,
all contracts traded on SAFEX which relate to the SSF contracts on the ALSI Top 40
index constituents for the period 03 January 2001 up until 30 December 2002, are
included in this research. Similarly, all the contracts that relate to the ALSI Top 40
index for the period 3 January 01 to 31 December 03 were included in the futures
trade data. SAFEX provided all the trade information on all the Single Stock Futures
and index futures that form part of the ALSI Top 40 index. This translates into more
than one million future trades, which are included in the study.
The trade data was requested and provided by SAFEX in the following format:
• Trade date
• Trade time
• Contract name
• Number of contracts traded
• Price at which the trades occurred.
The SAFEX futures prices therefore act as the actual traded prices against which the
theoretical prices of the contracts as calculated from the underlying share prices is
compared. The valuation models discussed in Section 2.4.7 and 2.4.8 are employed
to determine these theoretical futures prices. In instances where there are price
differentials, which are of such a magnitude that they justify the initiation of arbitrage
trades, these trades were used to quantify the number of available arbitrage
opportunities that were present, given the assumptions of the research.
3.5.1.3 DIVIDEND YIELDS AND DIVIDENDS
The dividend yields that are used in this research are taken from Bloomberg and are
expressed as annualised yields. The Bloomberg forecast of dividends is a respected
source; therefore the research assumes that this data source will provide dividend
yields that reflect the market’s expectation with a relatively high degree of accuracy.
The dividend yields that were extracted from Bloomberg matched the periods of data
received from the JSE and SAFEX. The data fields required for the research
information included dividend yield information for each trade date, the share’s name
Page 128
MANAGING PURE AND STATISTICAL EQUITY ARBITRAGE OPPORTUNITIES WITHIN THE SOUTH AFRICAN ENVIRONMENT- CRONJE, P (2004)
113
and alpha code (short code) and the annualised dividend yield (in a continuously
compounded format). Where the actual dividends were used these were taken from
the Bloomberg screen.
3.5.1.4 RISK FREE RATES
The risk free rates that are used in the analysis were taken from the daily closes of
the Standard Bank page on Reuters. These rates are used to discount future values
back to the valuation date, which will be the trade date on which the arbitrage trades
occur. The rates used as basis for calculations are the one month Jibar rate, the
three month Jibar rate, Forward Rate Agreement (FRA) rates out to two years and
Swap rates out to 20 years, which are bootstrapped to provide the zero rates. These
zero rates are then adapted to reflect the relevant compounding frequency that is
applied in the relevant formula.
Once the yield curve has been stripped (bootstrapped) it is a simple case of
determining the actual number of days that the instrument has to maturity and then
through linear interpolation, a zero value for that term structure can be determined
from the zero curve. This interpolated value can then be applied to the formula for the
relevant instrument after taking into account the relevant compounding frequency as
discussed above, or the value can be converted into a discount factor for present
value purposes.
3.5.1.5 STOP LOSS STRATEGY
When the profitability of each of the statistical trading types is analysed, the core
reason that would result in the trader closing out each of the arbitrage opportunities is
either due to the convergence of the trades in accordance with the arbitrage
intention, or as a result of a stop loss being triggered and thereby forcing the trader to
close out a position which is losing money.
The stop loss level that is applied in this model is determined through the empirical
research findings, which requested the respondents to provide the stop loss levels
which, are applied to each arbitrage type. The average stop loss is calculated from
these responses and is applied to the time series analysis. Within the time series
testing the average stop loss is applied to any trade which breaches that stop loss
level. These trades are then closed out.
Page 129
MANAGING PURE AND STATISTICAL EQUITY ARBITRAGE OPPORTUNITIES WITHIN THE SOUTH AFRICAN ENVIRONMENT- CRONJE, P (2004)
114
3.5.1.6 NUMBER OF TRADES AND VOLUME TRADED
The number of arbitrage trades that are traded by the market is a reflection of the
degree to which mispricing of instruments is present within the market. This particular
measure of opportunities is also a function of the duration of the opportunities within
the market, as the longer the mispricing remains, the greater the opportunity for the
traders to exploit the mispricing before the price differential between the theoretical
price and the observed price in the market narrows. This price convergence would
result from demand and supply factors which will drive the prices to the point where
profitable arbitrage will no longer be possible.
This information is compared to the responses received from the respondents, as
described in section 3.4.1.7, whereby they were requested to indicate how long their
arbitrage opportunities are visible in the market per arbitrage type. This measure was
performed to establish whether the market is effectively utilising the opportunities that
are presented.
While the above factors all affect the actual number of trades and volumes which
may be profitably transacted, the research makes certain assumptions and applies
certain constraints in terms of the number or shares or contracts that may be traded
for each arbitrage opportunity. These constraints and assumptions are applied to
provide consistency to the testing process and are implemented by allowing a set
number of shares to be traded per arbitrage opportunity. This volume is set at a low
level such that the effects of the trades should not move the market prices
dramatically.
The approach adopted to SSF was to take the minimum trading volume on the JSE
and SAFEX and apply the pricing to this volume of shares. Where the ALSI index is
traded either for index arbitrage or statistical arbitrage, the research assumed that
only 10 contracts would be traded for each opportunity that presents itself.
Page 130
MANAGING PURE AND STATISTICAL EQUITY ARBITRAGE OPPORTUNITIES WITHIN THE SOUTH AFRICAN ENVIRONMENT- CRONJE, P (2004)
115
3.5.1.7 TRANSACTION COSTS
The transaction costs that are incurred are applied to the time series testing are
based on the feedback of respondents from the empirical research. The average cost
as reflected by the feedback for each of the following cost drivers is applied to the
relevant equations: SAFEX costs, Uncertificated Securities Tax (UST) rate, JSE
trading costs, margining costs and lending costs. All these components are then
added to the cost of the arbitrage such that a realistic idea of the profit or loss that is
attributable to the arbitrage trades is calculated from the point of entering the trade
until the trade is closed out on the exchanges.
When trading on the JSE a number of direct costs are incurred which can be
decomposed into STRATE costs, Central Securities Depository Participant (CSDP)
costs and Uncertificated Securities Tax (UST). Where multiple purchases or sales
are concluded to fill one order, there will be a charge for each transaction entered
into in the effort to fill the order i.e. if three trades are concluded to fill an order of 100
shares then the trader will incur brokerage once but will incur the STRATE costs
three times. This cost of purchasing shares on the JSE excludes the UST, which is
applied as a fixed percentage of 25 basis points of the consideration traded.
Therefore, in each case the profit calculation should take into account the additional
effects of UST on profitability. While this cost was applied across all groups in the
sample, it should be noted that stock brokers acting as agents are exempt from UST
tax.
The cost of trading on SAFEX is relatively low compared to trading on the JSE and
where member institutions trade on SAFEX, they will generally be charged a different
rate per instrument type i.e. future vs option, and also a different rate for different
underlying instruments i.e. equity vs index. This research will use the average costs
as reflected by the respondents in the empirical research portion of this study.
In all cases where the underlying shares are sold short, the trader who sells the
shares short will need to deliver the shares that were sold to the market by the
settlement day in accordance with the JSE regulations. These shares must be
available in the sellers account by the second day after the short sale was concluded.
In the event that the shares are not available for delivery then the short sale will fail
and the JSE will fine the trader who entered into the short sale. The securities
Page 131
MANAGING PURE AND STATISTICAL EQUITY ARBITRAGE OPPORTUNITIES WITHIN THE SOUTH AFRICAN ENVIRONMENT- CRONJE, P (2004)
116
lending costs that are applied are the average lending costs as reflected in the
empirical research.
3.5.1.8 PROFITABILITY
The research calculates the theoretical profitability of the various arbitrage types after
taking into account the transaction costs and a low level of available liquidity. The
details of these two methods were discussed above in sections 3.5.1.6 and 3.5.1.7.
The research applied these methods for testing purposes and to show that the
strategies are indeed profitable. These assumptions may be lifted in practice and the
participants may be able to trade in larger volumes and more frequently than that
which was allowed in the research. As the volumes of transactions increase the
profitability of the various strategies will increase in Rand terms, as fixed cost drivers
like staff costs and systems costs will be reduced per unit trade as a result of the
increase in volume. The transaction costs will also reduce on a per share level as
greater volumes are traded per order placed.
The transaction, securities lending, staff and capital costs that are used in this
research are determined through the questionnaire discussed earlier. These costs
are directly observable as a result of the trading activities, but it should be highlighted
that the research is not taking into account the capital effects that pertain to reserving
and capital requirements that flow from regulations, which govern the accounting
treatment of these instruments.
3.5.1.9 INDEX AND SINGLE STOCK FUTURES
The method that is applied to the identification of index and SSF arbitrage situations,
given the time series data sets described previously, is to run a trade identification
programme which matches and extracts all trades that occur on the JSE and SAFEX
within a certain time period of one another. The time elapsed between trades causes
the data to be non-simultaneous, and for this reason the smaller the time differences
between trades that occur on the JSE and SAFEX the less likely it will be that this
type of error distorts the findings of this research and the associated number of
trades and the profits of these trades.
The application developed registers each SAFEX trade for SSFs as per the data
provided by SAFEX and returns all JSE trades that relate to that futures instrument
Page 132
MANAGING PURE AND STATISTICAL EQUITY ARBITRAGE OPPORTUNITIES WITHIN THE SOUTH AFRICAN ENVIRONMENT- CRONJE, P (2004)
117
within the time range of 30 minutes. The application also returns the actual number of
days that the contract has until maturity, which is determined by establishing the
maturity day, month and year from a contract maturity table. The current date is then
subtracted from the maturity date to provide the number of days to maturity.
The appropriate annual dividend yield that applies to the particular share or index is
taken from a dividend table, for the ALSI Top 40 shares. This data is sourced from
Bloomberg data services and is provided in a continuously compounded yield format.
It should be noted that the continuously compounded rate does provide a close
approximation of the value of the SSF, but that the results would be improved by
using the discreet dividend method for SSF, whereby the next dividend is projected
and applied to the formula in a discounted dividend manner which discounts the
dividend by the discount factor which can be calculated using the bootstrapped zero
rate, compounding frequency, and the number of days to the pay date.
The discreet method provides more accurate results when the shares go ex-dividend,
due to the ex-dividend effect, which reduces the share price right after the dividend is
paid to the shareholders by about the amount of the dividend declared. The effect of
continuous compounding of dividends is less obvious in the case of indexes due to
the fact that the dividends are not all paid at the same point in time and hence the
smoothing has a less significant effect on the pricing as this approach looks at
dividends on an annualised basis such that the total dividend yield is smoothed out
over the year.
The final component required to calculate the theoretical price of a future, given the
price of the underlying share is the relevant risk free rate (RFR) that should be
applied to the formula. The method of determining the correct RFR is to interpolate
for the RFR from the bootstrapped Jibar, FRA and Swap curves given the number of
days to the contract’s maturity date. This implies using the number of days from the
trade date to the maturity date to interpolate the risk free rate from the zero curve.
The details describing the method used to create the zero curve is discussed in
section 3.5.1.4.
The above components are then applied to the formula defined in Chapter 2 section
2.4.2 to 2.4.5 and all these factors then provide the theoretical price of the futures
contract. This theoretical price is then subtracted from the traded futures price to
establish whether there is a mispricing of the future in the market at that point in time.
Page 133
MANAGING PURE AND STATISTICAL EQUITY ARBITRAGE OPPORTUNITIES WITHIN THE SOUTH AFRICAN ENVIRONMENT- CRONJE, P (2004)
118
If the future price is too high relative to the theoretical price then the model will sell
the traded number of futures and buy the underlying shares in the market at the
traded prices reflected by actual JSE trades and vice versa.
Where an Index future or SSF arbitrage opportunity has presented itself in the market
the trader will execute the arbitrage by buying or selling the future and selling or
buying the underlying. The long futures position and the short underlying positions
will be maintained until the prices converge through the normal market movements
over time. The trade size that the model will apply is a function of the smaller of the
JSE volume or the SAFEX volume for the SSF i.e. the system will assume that the
trader only entered trades in sizes that could be executed on both exchanges in a
manner that creates the pure arbitrage position.
The findings are presented in two ways, the first will present the opportunities which
are present without taking into account transaction costs, and the second will take
into account transaction costs, which will include JSE trading costs, SAFEX trading
costs, brokerage, STRATE, UST, and securities lending costs. Where profitability of
the trade prior to transaction costs is less than the transaction costs which will be
incurred, the trade will be excluded from the analysis, as these trades will never
realise a return greater than the costs that will be incurred in transacting the positions
required for the arbitrage. These costs and the expected profit from the prices
converging will be known at the deal inception and the profitability can therefore be
catered for in an absolute manner.
3.5.1.10 RISK OR MERGER ARBITRAGE
The analysis of risk arbitrage using time series data is based on all corporate events,
i.e. all SENS data which refers to mergers, acquisitions, cash and share offers and
also the historical trade information pertaining to the price of the share under review,
for the period May 2001 to February 2004. The trade data that was relied upon was
provided by the JSE and reflects every trade effected in the securities during the time
of the corporate action.
The assumption applied in this research is that all corporate action information, which
involves mergers, acquisitions, and cash offers is available to the investment
community at large at the time that the Stock Exchange News (SENS) notification is
sent from the JSE to the investment community. This assumption is aligned to the
Page 134
MANAGING PURE AND STATISTICAL EQUITY ARBITRAGE OPPORTUNITIES WITHIN THE SOUTH AFRICAN ENVIRONMENT- CRONJE, P (2004)
119
market’s methodology of ensuring that information is distributed to all market
participants simultaneously, and the assumption therefore does not rely on any
information that is not factual or that is based on rumour or insider trading.
The details of the corporate events are provided through Stock Exchange News
(SENS) and the offer price that is provided in the SENS announcement is the price
which is applied in the calculation of the arbitrage opportunities that present
themselves. These offer prices are updated at each instance that a new offer is
communicated via SENS.
The methodology that is applied, is to buy or sell ten thousand shares of the
company being acquired on the day that the SENS announcement is made. Where
the offer is at a discount the shares of the company being acquired should be sold
and where the offer is at a premium, the shares should be purchased. This holding
will then be held until the corporate action date at which time the profit or loss on the
trading strategy will be realised. The research does not assume that huge volumes of
shares are purchased in one trade as this increase in demand may move the market
to unprofitable levels. For this reason, the assumption is made that at least ten
thousand shares will be purchased on the day of the announcement at the closing
price published on Bloomberg. The assumption is also made that the transactions
can only occur on the announcement date, which implies that no position in the time
series testing will exceed ten thousand shares. The positions will only be closed out
on the pay date or takeover date or termination date as specified in the SENS
announcement.
Where capitalisation shares are being offered the methodology is to purchase the
share at the SENS announcement date and the position will be maintained until the
ex-dividend date at which time the benefits of the capitalisation award will be
materialised through the close out of the risk arbitrage position that was entered into
at deal inception.
The scope of the analysis will be to look at instances where South African companies
which form part of the ALSI Top 40 have been acquired or have acquired/divested
from a holding in other listed companies. The research will specifically exclude
instances where foreign companies are purchased/sold as this will assume that all
companies in the South African environment are able to trade the offshore arbitrage.
Institutions which have the ability to trade dual listed arbitrage may well be in a
Page 135
MANAGING PURE AND STATISTICAL EQUITY ARBITRAGE OPPORTUNITIES WITHIN THE SOUTH AFRICAN ENVIRONMENT- CRONJE, P (2004)
120
position to trade these opportunities, but this research will not analyse these findings
as the analysis of risk arbitrage in the European markets has been well documented
in other research which is available.
All private companies which are bought or sold will be excluded from the research as
there is no price data available for the private companies. This implies that it is not
obvious as to the extent of the share price moves following the offer which is made
for the company.
The results of the profitability analysis of risk arbitrage is presented through
frequency distributions of the profitability of the trading strategy, in addition to a
distribution of the duration of the risk arbitrage trades. The transaction costs that will
be incurred in the trading process are factored into the calculations.
3.5.1.11 DUAL LISTED ARBITRAGE
In measuring the dual listed arbitrage opportunities, all ALSI Top 40 underlying
instruments that have a primary listing in London and a secondary listing in
Johannesburg or vice versa were identified for the period January 2000 up to and
including 31 December 2003. All last trade prices that occurred on the London Stock
Exchange (LSE) were compared to the last trades on the JSE for the same period.
The currency rate that is used in the analysis is the daily closing price of the South
African Rand (ZAR) to the British Pound (GBP). Shortcomings of this method relate
to non-simultaneous data being used as exchange rate volatility combined with the
effect of moves on the exchanges may affect the valuations.
Appendix 1 taken from www.jse.co.za [1999?] lists the dual listed shares that are
listed on the JSE and other exchanges. This list forms the basis from which the dual
listed securities were identified. For the purposes of this research the focus will be on
the shares that form part of the ALSI Top 40 and that are listed on the London Stock
Exchange. Table 3.2 below reflects those shares that are included in the test sample
due to their inclusion in the ALSI Top 40 and also the listing on the LSE.
Page 136
MANAGING PURE AND STATISTICAL EQUITY ARBITRAGE OPPORTUNITIES WITHIN THE SOUTH AFRICAN ENVIRONMENT- CRONJE, P (2004)
121
Table 3-2 Dual listed shares codes of the shares included in the time series
testing
Source: Bloomberg December 2003
The first three characters in the Bloomberg code describes the share code and the
two characters after the space and before the word equity highlight which exchange
the code relates to. The word equity simply indicates that the general Bloomberg
identification shows this to be an equity product.
The research views the arbitrage opportunities at day end only and takes into
account the fact that the bid ask spreads must be crossed in both the purchase and
sale of the shares and currency that is required to effect the transactions. To provide
a monetary equivalent of the effects of the mispricing, the research assumes that
only ten thousand shares can be traded for each opportunity that is presented
without affecting demand and supply and therefore price.
The analysis measures the profitability of the arbitrage types before and after the
relevant transaction costs have been applied, such that the research can identify
perceived opportunities versus those that are real opportunities. Once the profitability
prior to transaction costs is determined, the appropriate trading costs are subtracted
from the results, to provide the profitability of the strategy after transaction costs.
Bloomberg Code Share nameAAL LN Equity Anglo GoldAGL SJ EquityBIL SJ Equity Biliton PlcBLT LN EquityDDT LN Equity Dimension DataDDT SJ EquityINP SJ Equity Investec PlcINVP LN EquityLAF LN Equity Lafarge PlcLAF SJ EquityLBT SJ Equity Liberty International PlcLII LN EquityLMI LN Equity Lonmin plcLON SJ EquityOML LN Equity Old Mutual PlcOML SJ EquitySAB LN Equity South African Breweries PlcSAB SJ Equity
Page 137
MANAGING PURE AND STATISTICAL EQUITY ARBITRAGE OPPORTUNITIES WITHIN THE SOUTH AFRICAN ENVIRONMENT- CRONJE, P (2004)
122
The results of the dual listed securities arbitrage opportunities are shown as the
number of possible transactions that presented themselves on an annual basis for
each of the dual listed shares for the period under review in addition to an indicative
level of how profitable the trading strategy is over the period under review.
3.5.1.12 STATISTICAL ARBITRAGE
Reverre (2001:474-477) defines a methodology to identify and exploit statistical
arbitrage opportunities. This approach is applied to the ALSI Top 40 shares, to
determine which shares are highly correlated over time. The correlation level that is
set as the threshold for inclusion in this research is 60 % or greater for the 4 year
period and the relationships are calculated using the last traded prices of shares as
reflected by Bloomberg for each day in the sample period from January 2000 to
December 2003.
While Reverre (2001) used share combinations that had correlations greater than
80%, it is not specified how the correlations are calculated. The method used in this
study is to take the natural logarithm (ln) of the closing price of the share at a
specified date (d) divided by the closing price of the share from the previous day (d-
1), or when expressed in notation ln (d/d-1). These correlations would be higher if the
correlations were calculated using the lognormal of the two share prices on the same
day or if the lognormal of the change in the individual share prices was used to
establish the correlation.
A further consideration which Reverre (2001) specifies, is that the three-month
correlation should be used to establish the relationships. This study relies on the
average of the three-month correlation over a four-year period, which also explains
the lower overall correlation used.
Following the identification of the shares, which exhibit these relationships, the share
pairs are matched and compared to one another in the manner described in Chapter
2, section 2.4.1. Using the methodology described in section 2.4.1 to identify shares
that are over or underpriced relative to their correlated shares, the following approach
is applied: If the normalised change is greater than 1.5 then the shares forming the
denominator in the price ratio calculation is purchased while a number equal to the
ratio of the shares of the share forming the numerator in the price ratio is sold.
Page 138
MANAGING PURE AND STATISTICAL EQUITY ARBITRAGE OPPORTUNITIES WITHIN THE SOUTH AFRICAN ENVIRONMENT- CRONJE, P (2004)
123
Similarly, if the normalised change is less than –1.5, the shares acting as the
denominator in the ratio calculation is sold while purchasing one times the ratio of the
shares that act as the numerator at that time.
The findings will be presented in tabulated form reflecting the number of trades
entered into, the average profitability of the trades, the average duration of the trades
and the number of trades that were closed out as a result of the stop loss being
triggered. The effects of trading costs will be applied to the calculation such that the
results before and after transaction costs are visible. The costs that will be applied
depend on the nature of the arbitrage opportunity and will depend on the instruments
that are traded, for instance shares, options or futures.
Analysis into the predictability of global indexes, with the view to generating global
index arbitrage opportunities was undertaken by Meissner et al. (2002:1-11), as
discussed in Chapter 2, section 2.2.4.1. In the application of this method to the South
African environment, the following indexes are used in the manner described in the
research: Dow Jones Industrial Average represented the American stock exchanges.
The FTSE 100, the DAX and the CAX indexes were averaged to provide an average
for European stock exchanges and the Hang Seng, Nikkei, and the AS51 indexes
were averaged to provide the average for the Eastern and Australian exchanges.
From a South African perspective the Top 40 index was used as the representative
index for the purpose of this research.
The research using this method spanned the period June 2000 up to June 2004 and
weekends or holidays were excluded from the sample data. The process followed is
to perform a regression analysis on the data to establish statistical relationships by
applying multiple regression. The regression analysis results are presented in the
findings with the view to proving the statistical inference that will be drawn upon for
the remainder of the analysis.
As described by Meissner et al. (2002:1-11) the ability of the leading index to predict
the lagging indexes is considered in this method. The method adopted is to identify
cases where moves fall in the bands of 0.5% to1%, 1% to 1.5%, 1.5% to 2%, 2% to
2.5%, 2.5% to 3% and greater than 3% or –0.5% to -1%, -1% to-1.5%, -1.5% to -2%,
-2% to –2.5%, -2.5% to -3% and where moves smaller than -3% occurred in the
leading index relative to the lagging index.
Page 139
MANAGING PURE AND STATISTICAL EQUITY ARBITRAGE OPPORTUNITIES WITHIN THE SOUTH AFRICAN ENVIRONMENT- CRONJE, P (2004)
124
Where these events occurred, the duration and the magnitude of the move in the
lagging index is observed such that the statistics of the number of moves in the same
direction and the average move for each of the respective bands can be determined.
The data is presented in a matrix format which shows the percentage of times when
the lagging indexes move in the same direction as the leading index for each of the
thresholds described above. The matrix also shows the extent of the move in the
lagging index expressed as a percentage return.
3.6 SUMMARY OF RESEARCH METHODOLOGY
This chapter describes the methods applied in gathering the information required for
this research. Because the research requires input from nationally dispersed
institutions dealing in equity derivatives, it was decided that a self administered
research questionnaire would be the mechanism that would best meet the
requirements of the research pertaining to arbitrage trading processes.
The questions posed relate to the methods, processes and actions that are taken by
the respondents in running their equity arbitrage operations. The questionnaire also
deals with the risk management practices and structuring of the institutions arbitrage
business.
The research pertaining to the identification of arbitrage opportunities focuses on
testing index futures arbitrage, single stock futures arbitrage, dual listed arbitrage,
risk arbitrage and statistical opportunities in time series testing methodology.
The inputs that are required for the identification of arbitrage opportunities are
sourced from the JSE, SAFEX, Bloomberg and Reuters. As all information was not
available for all periods, the research focuses on different time periods for different
arbitrage types. The research generally covers four years of historical data, but it
should be noted that the SSF analysis was only done for a two year period The
SENS data required for the Risk Arbitrage data is only available from May 2001 and
therefore the research was extended up to and including February 2004.
The performance of each of the arbitrage types is measured once the required inputs
have been added to the relevant formula. These findings are presented in a manner,
which reflects the average profitability, the number of trades that are entered into
Page 140
MANAGING PURE AND STATISTICAL EQUITY ARBITRAGE OPPORTUNITIES WITHIN THE SOUTH AFRICAN ENVIRONMENT- CRONJE, P (2004)
125
relative to the number of trades that are profitable, the effects of transaction costs on
the overall profitability of the trading strategy, and the average volume traded per
arbitrage type.
Page 141
MANAGING PURE AND STATISTICAL EQUITY ARBITRAGE OPPORTUNITIES WITHIN THE SOUTH AFRICAN ENVIRONMENT- CRONJE, P (2004)
126
CHAPTER 4
4. RESEARCH FINDINGS
4.1 INTRODUCTION
Chapter 3 of the research outlines the manner in which the empirical and time series
analysis are executed, analysed and reported in Chapter 4. Therefore the focus of
the first section of Chapter 4 is to provide the details of the results that were gathered
through the completed empirical questionnaires, received from the respondents in
the sample. These results start with a review of the statistics pertaining to the number
of respondents who returned the questionnaire.
The chapter then reflects each of the research elements that were considered in
Chapter 3, and presents these in terms of the questions that were posed to the 80
institutions that were included in the sample. The second section of this research
details the results obtained from the time series analysis into the various arbitrage
types.
4.2 RESPONSES BY THE SAMPLE
As indicated in Chapter 3, a stratified quota sampling method was used. Feedback
was provided by 76 (95%) of the respondents, while the remaining 4 (5%) refused to
answer the questionnaire. Of these 76, six institutions (7.8%) noted that they
participated in equity arbitrage but that the information was considered to be
proprietary and that company policy was not to disclose any operational information
and they therefore did not complete the questionnaire. Those institutions that felt this
information was of a proprietary nature are three foreign investment banks and three
foreign stock broking institutions.
The responses received from the banks included in the sample showed that eleven
of the respondents did trade equity derivative arbitrage. However given their internal
policies, three of the international banks would not provide details of their operations.
Three of the international banks did provide meaningful input about their arbitrage
trading, as did five of the South African banks.
Page 142
MANAGING PURE AND STATISTICAL EQUITY ARBITRAGE OPPORTUNITIES WITHIN THE SOUTH AFRICAN ENVIRONMENT- CRONJE, P (2004)
127
All insurance companies and stock broking institutions that were included in the
sample responded to the questionnaire. Where the institutions did not trade any
equities or equity derivatives directly as they outsourced the function, the responses
were marked as not part of the core business. This response was confirmed verbally
with the relevant person responsible for the investments of the company, be it the
financial director or the investment manager of the company in question.
The responses received from the stockbrokers showed that eleven (55%) of the
institutions in the sample did not trade equity arbitrage; of these, a further two were in
the process of creating desks to perform this function. The primary reasons for not
trading arbitrage is that their business models are focused on facilitating client-driven
transactions. There are nine stock broking institutions which trade equity and equity
derivative arbitrage; of these nine, three were international stock broking institutions
that felt the information was of a proprietary nature and they were therefore not
prepared to complete the questionnaire.
Feedback from the asset managers showed that five of the respondents traded some
equity derivative arbitrage strategies. In the sample two of the asset managers were
multi-managers and therefore allocated their funds into other funds and therefore
they did not directly partake in equity investments. One company no longer exists
and therefore no information could be gathered on its processes. Where the asset
managers participated in equity arbitrage the main thrust of these trading activities
was housed in the hedge funds that these asset managers had set up to cater for
arbitrage trading.
Given the feedback, there were 27 companies in the sample that traded arbitrage
strategies; two of these would not complete the questionnaire, despite numerous
requests to do so and after declining meetings that were set up to get the
questionnaire completed. Six of these respondents felt that the information was too
sensitive to share, while 19 completed the questionnaire. It should also be noted that
not all companies trade all arbitrage types and that the figures discussed thus far are
viewed at a consolidated level for all arbitrage types.
4.3 ARBITRAGE BUSINESS STRUCTURES
In an effort to ensure meaningful interpretation of the results of the empirical findings,
only the institutions that do trade equity arbitrage and which did provide feedback on
Page 143
MANAGING PURE AND STATISTICAL EQUITY ARBITRAGE OPPORTUNITIES WITHIN THE SOUTH AFRICAN ENVIRONMENT- CRONJE, P (2004)
128
the questionnaire were analysed from this point forward. Therefore the analysis will
focus on the 19 companies that do trade equity arbitrage.
4.3.1 BUSINESS STRUCTURES AND STRATEGIES
The responses show that some institutions are not geared towards the arbitrage
market in any way, while others have progressed to more advanced stages in terms
of the business structures that they have put in place to deal with the arbitrage types
that they are trading. It could also be added that the business type played an
important part in determining whether the institution was involved in arbitrage trading.
Banks (55%) are for instance most likely to conduct arbitrage trading, while insurance
companies (0%) are least likely to have arbitrage trading structures in place.
The consolidated findings of the sample shows that insurance companies in the
sample do not partake in any form in equity trading or arbitrage trading directly, due
to the fact that they outsource the investment function to asset managers who
perform the investment function on their behalf. The investment process followed by
the insurance companies would as a general rule reflect the investment parameters
prescribed by the Financial Services Board which governs the Insurance industry and
the investment management industry.
Of the banks, only two indicated that they outsourced the equity investment function
and hence the equity arbitrage function to their sister companies such that the sister
companies performed a centralised investment and treasury role. All other banks
who indicated that they traded arbitrage housed the equity derivative and arbitrage
trading within their treasuries and followed a centralised structure, in that the
arbitrage trading was consolidated in one area, which fell under equity derivatives.
Of the institutions that traded arbitrage, 17 (89%) adopted a centralised business
structure, while the remaining two used decentralised structures. The reason for the
centralised choice was mainly due to the fact that the institutions also used these
traders to trade other types of equity trading.
Twelve (63%) of the respondents who trade equity arbitrage were of the opinion that
the trading provided the institution with a strategic advantage. This statistic helps in
explaining why the institution felt that they would keep the arbitrage books active for
years after they were no longer profitable. Six (35%) institution would keep the book
Page 144
MANAGING PURE AND STATISTICAL EQUITY ARBITRAGE OPPORTUNITIES WITHIN THE SOUTH AFRICAN ENVIRONMENT- CRONJE, P (2004)
129
even if it did not make money for a period longer than two years. Four (23%)
responded that they would only shut the book, if it did not make money for a period of
three years or longer, while four (23%) said they would keep the book even if it did
not make money for a period of four years or longer.
4.3.2 EQUITY ARBITRAGE STRUCTURES AND TRADING
The research showed that 13 of the institutions that participate in equity arbitrage
trading, positioned the trading within the equity derivative structure within the
business. The remaining six either positioned the desk in an area focused on
arbitrage, or positioned the arbitrage trading in a hedge fund structure.
4.4 TRADING PROCESSES
Below, trading processes are discussed with reference to index and SSF arbitrage,
risk and merger arbitrage, dual listed arbitrage, statistical arbitrage, volatility arbitrage
and arbitrage risk processes.
4.4.1 INDEX AND SSF ARBITRAGE
Of the institutions that do partake in equity derivative arbitrage, 14 (74%) trade index
and SSF arbitrage. The five institutions that do not trade index or SSF’s felt that this
was not part of their core business and have no interest in this type of trading.
Figure 4.1 Views on improving futures arbitrage trading
0123456789
No it can't be improved Identification processescan be improved
Execution processes canbe improved
Market risk processes canbe improved
Ability to measure the MTMof the performance of
each trade can beimproved
Area of improvement
Res
pond
ents
Page 145
MANAGING PURE AND STATISTICAL EQUITY ARBITRAGE OPPORTUNITIES WITHIN THE SOUTH AFRICAN ENVIRONMENT- CRONJE, P (2004)
130
From Figure 4.1 above it can be seen that six of the respondents felt that their
processes can not be improved in any way, five of the respondents felt that the
identification of these opportunities can be improved, nine of the respondents felt that
they would like an improved execution process, three felt that the market risk process
around these trades could be improved, and lastly one of the respondents felt that
the deal by deal profitability process could be improved. It should be noted that the
respondents could choose more than one area of improvement in the selection
provided.
4.4.1.1 IDENTIFICATION PROCESSES
The study shows that institutions that do trade equity arbitrage are in favour of
improved identification processes. All respondents indicated that their identification
processes relied on spreadsheets, which were linked to live data sources, and these
then calculated the fair value of the future given the spot prices, the risk free rate and
the dividends. Of the respondents eleven institutions had done some development
around their identification processes and this development went further than the
basic spreadsheet application.
The respondents all use a discreet dividend process in the calculation of the value of
the index, with only one institution indicating that it also looks at the continuous
dividend yield. The general sources of dividend information were shown to be
Bloombergs (37%), Inet (27%), Reuters (18%), and analyst forecasts were applied in
about 55% of all cases. The dividends were split according to analysts forecasts in
ten (71%) cases, in four cases they were split on a historical basis. In five of the
cases the respondents also used proprietary methods to assist in splitting the
dividends for both index and SSF.
4.4.1.2 TRADER’S DISCRETION
As mentioned above, none of the respondents have developed automated trading
processes to effect the transactions on their behalf. Traders are needed to physically
place the order with the exchange. Therefore, the view held by this research is that
institutions may miss trading opportunities as a result of the trader being away from
the desk for one reason or another. No clear indication of the magnitude of these
missed opportunities is obtainable and there are no existing measures applied by the
respondents to manage this area of the business.
Page 146
MANAGING PURE AND STATISTICAL EQUITY ARBITRAGE OPPORTUNITIES WITHIN THE SOUTH AFRICAN ENVIRONMENT- CRONJE, P (2004)
131
As the empirical findings also reflect that the price discrepancies are visible for
periods of at least a day, it could be argued that a mitigating factor is the fact that the
opportunities are visible for long periods of time, as discussed under section 4.4.14.
4.4.1.3 HEDGING AND STOP LOSSES
In its true form the index and single stock futures arbitrage would never require the
trades to be hedged. Of the institutions in the sample which traded SSF and index
arbitrage, only two did not trade this arbitrage in its pure form, and they used a
representative basket of the index or traded the arbitrage using other derivative
instruments, such as options and futures. The fact that they did not trade the
arbitrage in its pure form implies that they need to adopt a stop loss strategy, as the
convergence may not occur as expected. The respondents set these stop loss levels
at 5% in one case and a level between 5% and 10% in the other case. Where the
impure form of index and SSF arbitrage was applied, the respondents who applied
this methodology used the delta to calculate the hedge requirements.
The remaining twelve respondents all applied futures arbitrage trading in the
conventional form whereby they traded the future and the underlying shares. As a
result, none of these institutions felt the need to hedge or place any stop loss on the
futures arbitrage trades.
The reasons cited by the companies for not trading a representative hedge of the
index was due to the fact that eight were of the opinion that the representative basket
introduced additional risk into the trade, and four were of the opinion that this
mechanism was an ineffective mechanism for effecting this trading strategy.
Of the institutions that trade this strategy eleven (78.5%) were of the opinion that the
securities lending pool was adequate and did not adversely affect their trading as
they could source the shares required to settle the short sale transactions.
4.4.1.4 NUMBER OF TRADES AND THEIR DURATION
The 14 institutions that confirmed that they traded futures arbitrage had in general
been trading the strategy for a number of years, with only one institution having
traded for less than a year, three institutions had traded SSF and Index arbitrage for
Page 147
MANAGING PURE AND STATISTICAL EQUITY ARBITRAGE OPPORTUNITIES WITHIN THE SOUTH AFRICAN ENVIRONMENT- CRONJE, P (2004)
132
between one and three years, six institutions had traded this strategy for between
three and five years, and four had traded the strategy for a period greater than five
years. This data is presented graphically in figure 4.2 below.
Figure 4.2 Futures arbitrage trading duration
Figure 4.3 below shows that four (36%) of the respondents entered into less than five
trades per week, five (45%) entered into between five and ten trades a week, two of
the respondents traded between 20 and 50 such transactions while three indicated
that they traded more than 50 such transactions every week.
Figure 4.3 Number of trades entered into on a weekly basis
Figure 4.4 below shows that the respondents viewed the general duration of these
opportunities in the market to last up to a month. Three felt that the opportunities
0123456
< 5
tran
sact
ions
> 5
< 1
0
tran
sact
ions
>10
< 2
0
tran
sact
ions
> 2
0 <
50
tran
sact
ions
> 5
0
tran
sact
ions
n u m b e r o f t r a d e s e n t e r e d i n t o w e e k l y
Res
pond
ents
0
1
2
3
4
5
6
7
< 1 Y e a r > 1 y e a r < 3y e a r s
> 3 y e a r s < 5y e a r s
> 5 y e a r s
P r e i o d o v e r w h i c h t r a d e d
Res
pond
ents
Page 148
MANAGING PURE AND STATISTICAL EQUITY ARBITRAGE OPPORTUNITIES WITHIN THE SOUTH AFRICAN ENVIRONMENT- CRONJE, P (2004)
133
were visible for only one day, while seven of the respondents felt that the
mismatches were visible between one day and a week; two felt that the mispricing is
generally visible between one and two weeks; one felt that the mispricing was visible
in the market for a period of two weeks to a month; and one was of the opinion that
the mispricing was visible for a period of a month.
Figure 4.4 Futures arbitrage duration
The general consensus was also that the trades tend to converge prior to the actual
maturity date of the futures contracts and therefore the trades were closed out before
the contract maturity date. Figure 4.5 below shows that four respondents indicated
that they closed out their positions early in less than 10% of all arbitrage trades and
one indicated that between 10% to 30% of the futures arbitrage trades were closed
out prior to the maturity date. One respondent indicated that about 30% to 50% of
their futures arbitrage trades were closed out prior to the futures maturity, and eight
of the respondents indicated that the prices converged before maturity and they
therefore closed the trades before maturity in more than 50% of the arbitrage trades
they entered into.
The research also assumed that where index or SSF arbitrage trades converged, the
trades would be terminated. This implies that the research does not assume that
trades will be held to maturity and the view of this research is that there is no point in
holding on to the trades until the futures expiry if the arbitrage converges prior to the
futures close-out date. It may be argued, however, that in some instances the
position suites the book and therefore the traders would prefer to maintain the
012345678
= 1 d a y > 1 d a y < 1w e e k
> 1 w e e k <2 w e e k s
> 2 w e e k s< 1 m o n t h
> 1 m o n t h
P e r i o d o v e r w h i c h t h e m i s p r i c i n g i s v i s i b l e
Res
pond
ents
Page 149
MANAGING PURE AND STATISTICAL EQUITY ARBITRAGE OPPORTUNITIES WITHIN THE SOUTH AFRICAN ENVIRONMENT- CRONJE, P (2004)
134
position until the expiry date. While this may be true, this discussion does not form
part of the research and should be considered at the relevant book level.
Figure 4.5 Percentage of trades closed out early
4.4.1.5 PROFITABILITY AND RISKS
Only one of the respondents was of the opinion that the trading strategy was not
meeting the profitability requirements. The rest of the respondents felt that these
trades met their profitability requirements and hence they would continue trading
these arbitrage strategies.
Table 4.1 below reflects a matrix of responses that the respondents consider to be
the primary cost drivers and which affect their business directly in futures arbitrage
trading. The rating scale that was used, set four as the most significant cost and one
as the least significant cost. It is apparent that transaction-hedging costs are
considered the most significant costs, while securities lending costs rate a close
second. Staff and systems costs were generally rated as secondary costs in terms of
this type of strategy.
0123456789
< 1 0 % > 1 0 % b u t <3 0 %
> 3 0 % b u t <5 0 %
> 5 0 %
% o f t r a d e s c l o s e d o u t b e f o r e m a t u r i t y d a t e
Res
pond
ents
Page 150
MANAGING PURE AND STATISTICAL EQUITY ARBITRAGE OPPORTUNITIES WITHIN THE SOUTH AFRICAN ENVIRONMENT- CRONJE, P (2004)
135
Table 4-1 Cost drivers in futures arbitrage
The risks that are considered the most significant in this type of trading are execution
risk and all the respondents indicated that this risk had a negative impact on their
business. Dividend risk was rated second highest with twelve of the respondents
rating this as a concern. Nine were concerned with market risk components of the
trading; six were concerned with the scrip lending availability; and three rated the
interest rate risk as a concern. Figure 4.6 below shows the above information in the
form of a frequency distribution.
Figure 4.6 Rating of significant risk types
4.4.2 RISK AND MERGER ARBITRAGE
02468
10121416
Execution Risk Credit Risk –counterparty
risk
Market Risk –sensitivity to
the underlyinginstrument
Dividend Risk Stock LendingAvailability
Interest Risk
Risk type
Res
po
nd
ents
Cost Driver 4 3 2 1
Transaction / Hedging costs. 5 5 1 3Securities lending cost. 4 7 3 0Staff 1 2 5 6Systems 2 2 3 7
Rating scale and responses per cost driver
Page 151
MANAGING PURE AND STATISTICAL EQUITY ARBITRAGE OPPORTUNITIES WITHIN THE SOUTH AFRICAN ENVIRONMENT- CRONJE, P (2004)
136
Of the 19 companies who trade equity arbitrage, eight (42%) did not participate in
risk arbitrage as they felt that this type of trading was not part of their core business.
Eleven companies in the total sample actively trade risk arbitrage.
4.4.2.1 IDENTIFICATION PROCESSES
The study shows that respondents who trade risk arbitrage are in favour of improved
identification processes. Only one respondent was of the opinion that the process
could not be improved in any manner. Eight of the respondents were of the opinion
that the identification could be improved; six would like to see the execution of the
trades improved, while three were of the opinion that the market risk process around
these trades could be improved. Not one of the respondents felt that they were
lacking in any way in terms of the ability to measure the mark to market (MTM)
performance of the risk arbitrage trades. This information is summarised in the
frequency distribution in Figure 4.7.
Figure 4.7 Views on improving risk arbitrage processes
Only three of the respondents had done some development in terms of systems
capabilities to identify and manage these trades. The systems of all the respondents
are linked to live data feeds. All the respondents also used spreadsheets in their
management and identification of the risk arbitrage trades.
4.4.2.2 TRADER’S DISCRETION
0123456789
No it can't be improved Identification improved Execution Improved Market risk improved Improved ability tomeasure the MTM ofthe performance oftrades or structures
Risk arbitrage improvements
Res
pond
ents
Page 152
MANAGING PURE AND STATISTICAL EQUITY ARBITRAGE OPPORTUNITIES WITHIN THE SOUTH AFRICAN ENVIRONMENT- CRONJE, P (2004)
137
There is no automated trading process to identify and effect the transactions on
behalf of the traders, therefore the trade opportunities may be missed as a result. No
clear indication of the magnitude of these missed opportunities was obtainable as the
respondents do not have a mechanism to monitor and track these missed trade
opportunities.
A common comment from the respondents was that this type of trading cannot be
easily automated due to the fact that the deals differ in each case and the manner in
which the data is transmitted through SENS does not lend itself to a high degree of
automation due to a lack of consistence in the message format.
4.4.2.3 HEDGING AND STOP LOSSES
Of the respondents that traded risk arbitrage, one respondent from and investment
institution did not apply a stop loss level. Three of the respondents set the stop loss
levels at 5% or below. Six respondents set the stop levels between the range of >5%
and <10%. One respondent indicated that their stop loss was set at between 10%
and 15%. This information is presented in Figure 4.8 below.
Figure 4.8 Stop loss levels applied in risk arbitrage
All the respondents who trade risk arbitrage used the underlying instruments to
hedge exposures, while one respondent also used futures and one used options in
addition to the underlying instruments. Nine of the respondents used the delta to
determine the hedge ratio’s while one used a PDH on the delta. Another one also
0
1
2
3
4
5
6
7
< 5 % > 5 % < 1 0 % > 1 0 % > 1 5 % > 1 5 % > < 2 0 %
S t o p l o s s l e v e l s f o r r i s k a r b i t r a g e
Re
sp
on
de
nts
Page 153
MANAGING PURE AND STATISTICAL EQUITY ARBITRAGE OPPORTUNITIES WITHIN THE SOUTH AFRICAN ENVIRONMENT- CRONJE, P (2004)
138
used the PDH on the vega, and another used a stock split process to determine the
hedge requirements.
4.4.2.4 NUMBER OF TRADES AND THEIR DURATION
The institutions that provided feedback on this type of arbitrage had been trading
these strategies for varying time periods and the results are shown in Figure 4.9
below. One institution has been trading risk arbitrage for less than a year, seven
institutions have been trading risk arbitrage for a period of three to five years and
three institutions have been trading for a period between five and ten years.
Figure 4.9 Time the respondents have traded risk arbitrage
The number of risk arbitrage trades that were entered into by the market could not be
set at a monthly average as the trading opportunities are driven by the corporate
activity in the market – this comment ties back to the findings of the literature covered
in the literature review section on risk arbitrage as discussed in Chapter 2. Therefore
the results of trading activities will be centred on the corporate activity calendar, and
no trading will occur where there is no corporate activity.
Figure 4.10 below shows that the general duration of these opportunities in the
market may last for more than a month in the opinion of three of the respondents.
One respondent feels that the mispricing is generally visible for about one week to
two weeks, five feel that the mispricing is visible for one day to one week and two of
the respondents were of the opinion that the mispricing was visible for only one day.
012345678
< 1 Year > 1 year < 3years
> 3 years < 5years
> 5 years < 10years
> 10 years
Duration of trading activity
Res
po
nd
ents
Page 154
MANAGING PURE AND STATISTICAL EQUITY ARBITRAGE OPPORTUNITIES WITHIN THE SOUTH AFRICAN ENVIRONMENT- CRONJE, P (2004)
139
Figure 4.10 Duration of risk arbitrage opportunities in the market
4.4.2.5 PROFITABILITY AND RISKS
All of the respondents were of the opinion that these trades met their profitability
requirements and hence they would continue trading these types of arbitrage. Four of
the respondents were of the opinion that the execution of the risk arbitrage trades
was a process that added to the risks in the risk arbitrage process. Two of the
respondents felt that credit risk was a factor which should be considered in this type
of arbitrage. Ten of the respondents felt that the market risk component was the
largest contributor to the risks associated with risk arbitrage, six were concerned
about the legal risk associated with the trades mainly due to competition commission
approvals, and six were concerned with deal failure for reasons other than legal
reasons. Figure 4.11 below reflects the responses in the form of a frequency
distribution.
Figure 4.11 Risks that are considered meaningful in risk arbitrage
0
1
2
3
4
5
6
= 1 d a y > 1 d a y < 1w e e k
> 1 w e e k <2 w e e k s
> 2 w e e k s <1 m o n t h
> 1 m o n t h
D u r a t i o n o f r i s k a r b i t r a g e o p p o r t u n i e s
Re
sp
on
de
nts
0
2
4
6
8
1 0
1 2
E x e c u t i o n R i s k C r e d i t R i s k –c o u n t e r p a r t y
r i s k
M a r k e t R i s k –s e n s i t i v i t y t o
t h e u n d e r l y i n g
L e g a l R i s k D e a l F a i l u r e
R i s k T y p e
Re
sp
on
de
nt
s
Page 155
MANAGING PURE AND STATISTICAL EQUITY ARBITRAGE OPPORTUNITIES WITHIN THE SOUTH AFRICAN ENVIRONMENT- CRONJE, P (2004)
140
The general consensus amongst the respondents is also that the trades tend to
converge as per the traders expectations. Almost all of the respondents (90%) were
of the opinion that the trades converge in the manner that they expected. Where the
trades did not converge in the expected manner, the respondents ascribe the cause
of the non-convergence to regulatory reasons e.g. competition commission stopped
the deal from proceeding; deals being revised in a manner that inhibits the prices
from moving to the levels that were expected from a profitability perspective; fact that
the time it takes to conclude the deal is so long that it reduces the profitability from a
return on capital perspective to levels which do not meet the profitability
requirements.
The respondents’ views on deals being concluded successfully is clear from the
frequency distribution shown in Figure 4.12 below. The respondents are all of the
opinion that the deals do, as a general rule, result in the prices converging as
expected. However, where this is not the case, either the time it takes to conclude
the deal, deal failure or deal revision are the reasons cited for the deals not being
profitable.
Figure 4.12 Deal success, failure and profitability in risk arbitrage
The consolidated view of the respondents who traded risk arbitrage was that six
considered transaction cost to be the primary cost drivers in the risk arbitrage trading
process, six felt that securities lending costs were the next largest contributor to costs
in this strategy. Five felt that staff were the third largest contributor to costs, while six
felt that systems used for risk arbitrage were the least significant of the costs
0
2
4
6
8
10
12
Transaction do converge according to
expectations
Regulatory reasons Deal is revised in a direction, which
inhibits price convergence to expected
level.
The time it takes to conclude the deal –
the cost of holding the position removes
the potential margin that was expected.
Risk Arbitrage Deal Behavior
Re
sp
on
en
ts
Page 156
MANAGING PURE AND STATISTICAL EQUITY ARBITRAGE OPPORTUNITIES WITHIN THE SOUTH AFRICAN ENVIRONMENT- CRONJE, P (2004)
141
incurred. Table 4.2 below reflects the respondents’ ratings per cost driver, with 1
being the highest and 4 being the lowest.
Table 4-2 Cost drivers in risk arbitrage
4.4.3 DUAL LISTED ARBITRAGE
Only two respondents indicated that they traded the dual listed strategy. The rest of
the respondents indicated that they did not trade dual listed arbitrage for the following
reasons. One of the respondents said they had no system, which could be used to
house these trades, four said they had no interest in trading this arbitrage type, eight
said this business strategy was not part of their core business, seven indicated that
they do not have the legal/entity ability to trade dual listed securities on the
international exchange and one respondent was of the opinion that this type of
arbitrage does not exist. The details of the responses received are reflected in Figure
4.13 and it should be noted that the companies could have provided more than one
reason why they do not trade dual listed arbitrage.
Figure 4.13 Respondents’ reasons why dual listed arbitrage is not traded
Cost driver 4 3 2 1Transaction / Hedging costs.
6 2 1 2Securities lending cost. 1 6 3 1
Staff 2 1 5 3Systems 2 2 1 6
Rating
0123456789
No system No interest Not part of your
core business
Don't have the
legal ability to
trade dual listed
arbitrage.
It does not exist
Reasons dual listed arbitrage is not traded
Res
pond
ents
Page 157
MANAGING PURE AND STATISTICAL EQUITY ARBITRAGE OPPORTUNITIES WITHIN THE SOUTH AFRICAN ENVIRONMENT- CRONJE, P (2004)
142
4.4.3.1 IDENTIFICATION PROCESSES
The study shows that the two respondents who do trade dual listed arbitrage both
feel that their processes can be enhanced through improved identification processes.
Both respondents indicated that their identification process relied on spreadsheets
that are linked to live data sources, and these then determine whether there is any
mismatch in price given the exchange rates fed from the data vendor.
Both respondents indicated that they trade positions, that relate to the currency
mismatches between the same shares on different exchanges, and one respondent
indicated that that institution traded the dividend effects as, and when they presented
themselves. The research did not delve into the regulatory arbitrage processes that
could be employed to generate profits as a result of differences between SA, UK and
EU taxation legislation.
4.4.3.2 TRADER’S DISCRETION
As none of the respondents have developed an automated trading process to effect
the transactions on their behalf, this implies that the traders must manually act upon
all trade opportunities. Therefore the companies may miss trading opportunities as a
result of this operational constraint that they face at this time.
In the dual listed arbitrage trading environment where many of the trading gaps
appear as a result of volatile currencies, it is crucially important to have prompt
system-based trading that monitors the price disparity continuously and that effects
the trades on the shares and the currencies in an efficient manner, in order to
maximise profitability.
4.4.3.3 HEDGING AND STOP LOSSES
The two respondents who participated in this type of arbitrage trading indicated that
they adopted stop losses when participating in this trading strategy and this stop loss
was set at a level of 5% or below. The hedges that are used include the sale or
purchase of the underlying instrument on the London Stock Exchange, while the
currency exposure was also hedged out as part of the hedging process. None of the
respondents used derivative instruments to hedge out their exposure.
Page 158
MANAGING PURE AND STATISTICAL EQUITY ARBITRAGE OPPORTUNITIES WITHIN THE SOUTH AFRICAN ENVIRONMENT- CRONJE, P (2004)
143
The hedges that are put in place to reduce the risks faced on the shares are always
done in the underlying shares and this is always considered to be a delta hedge.
Liquidity is said to be a constraint in this type of trading, primarily due to the fact that
very large positions may be needed to generate the profits required in this trading.
Further feedback showed that the liquidity was greater on the London Stock
Exchange. Finally the respondents rated execution risk and market risk as their
biggest risks in this trading strategy.
4.4.3.4 NUMBER OF TRADES AND THE TRADING PERIOD
Of the two institutions that indicated that they were trading dual listed arbitrage one
had been trading this arbitrage for between one and three years while the other had
been trading for between three and five years.
The number of transactions entered into on a monthly basis ranged between 20 and
50 transactions per month for both respondents.
4.4.3.5 PROFITABILITY AND RISKS
Both respondents felt that these trades met their profitability requirements and hence
they would continue trading these arbitrage strategies. Furthermore, both
respondents felt that the execution and market risks involved with these trades are
significant, as the execution process involved the purchase or sale of forward
currency components which is not present in most other forms of arbitrage trading.
The respondents indicated that transaction costs are the primary drivers in these
trades with securities lending cost being rated as the second largest cost contributor,
followed by systems costs and then staff costs.
4.4.4 STATISTICAL ARBITRAGE
Of the total sample of 80 institutions there were eight respondents who are involved
in statistical arbitrage in some form. The details of the trading types were indicated to
be rather elementary, as described below in section 4.4.4.1, with the majority of the
respondents being involved in pairs type trading.
Page 159
MANAGING PURE AND STATISTICAL EQUITY ARBITRAGE OPPORTUNITIES WITHIN THE SOUTH AFRICAN ENVIRONMENT- CRONJE, P (2004)
144
Figure 4.14 below indicates that all the respondents who trade statistical arbitrage
were of the opinion that the process could be improved. All eight of the respondents
felt that the trading process could be improved through enhanced identification
processes, while five were of the opinion that the execution process could be
improved. Three were of the opinion that the market risk around these trades needed
some work, and only one was of the opinion that the performance management of
the statistical arbitrage trades should be improved.
Figure 4.14 Respondents views on improving the statistical arbitrage process
4.4.4.1 IDENTIFICATION PROCESSES
All respondents indicated that their identification processes rely on spreadsheets that
are linked to live data sources, and this data is then applied to mathematical and
statistical formulae to calculate the statistical arbitrage trades. Six of the respondents
that trade statistical arbitrage had done some development to assist in the statistical
arbitrage identification process. The remaining institutions rely entirely on the data
from spreadsheets that are then analysed by the traders in the hope of identifying the
statistical arbitrage trades.
All of the institutions that trade statistical arbitrage, are involved in pairs trading
between related shares or highly correlated shares. Only two of the respondents
used other statistical techniques like linear algebra techniques on the underlying
shares. An investigation of the use of derivatives in statistical arbitrage reveals that
only four respondents used statistical arbitrage processes in the derivative context.
0123456789
No it can't beimproved
Improvedidentification
Improved execution Improved marketrisk
Improved ability tomeasure the MTM
of the performanceof trades and
structures
Improvements to statistical arbitrage processes
Res
po
nd
ents
Page 160
MANAGING PURE AND STATISTICAL EQUITY ARBITRAGE OPPORTUNITIES WITHIN THE SOUTH AFRICAN ENVIRONMENT- CRONJE, P (2004)
145
Only one respondent uses the statistical information for the purposes of volatility
arbitrage.
4.4.4.2 TRADER’S DISCRETION
As none of the respondents have developed automated trading process to effect the
statistical arbitrage transactions on their behalf, the opinion of this research is that
there must be statistical trade opportunities that are not traded due to the human
component involved in trading this strategy. The fact that the analysis is left to the
traders implies that the results are dependent on the traders’ mathematical and
statistical ability for the identification of the trade opportunities. Given this information,
the institutions may miss trading opportunities as a result of the process. No clear
indication of the magnitude of these missed opportunities was obtainable.
4.4.4.3 HEDGING AND STOP LOSSES
As the statistical arbitrage process has by its very nature a large degree of risk, all
the institutions involved in this type of trading use a stop loss process to reduce the
downside where the trades do not converge in the manner that they had expected.
Three of the institutions apply a stop loss level of 5% or below, four institutions apply
a stop loss level between five and ten percent and one institutions applied a stop loss
of between 15% and 20%. These findings are reflected in Figure 4.15 below.
Figure 4.15Stop loss levels applied in statistical arbitrage
All the respondents are of the opinion that the securities lending pool is adequate to
cater for the lending requirements that were incurred in statistical arbitrage trading.
0
1
2
3
4
5
< 5 % > 5 % < 1 0 % > 1 0 % > 1 5 % > 1 5 % > < 2 0 %
S t o p l o s s e s a p p l i e d b y r e s p o n d e n t s
Re
sp
on
de
nts
Page 161
MANAGING PURE AND STATISTICAL EQUITY ARBITRAGE OPPORTUNITIES WITHIN THE SOUTH AFRICAN ENVIRONMENT- CRONJE, P (2004)
146
All of the respondents said they hedge using the underlying instruments, while four
use options, four also use futures and one use forwards to hedge out the exposure
created by the statistical arbitrage trades. This is reflected in figure 4.16 below.
Figure 4.16 Hedge instruments used in statistical arbitrage
All the respondents in the sample who trade statistical arbitrage use the delta in one
way or another to determine their hedge requirements, three of the companies use
the PDH on the underlying contracts to determine the hedge requirements, and six of
the respondents perform a similar process using the actual delta to determine the
hedge requirements. One company uses a PDH on the underlying volatility curve to
establish the hedge requirements for the options that are on the book.
It should also be noted that this is one area of the research where all respondents felt
that the actual sensitivity and loss limits could not be shared as this would
compromise their trading strategy.
4.4.4.4 NUMBER OF TRADES AND THEIR DURATION
The respondents that provided feedback on this type of arbitrage type indicated that
two of them had been trading statistical arbitrage for a period of one to three years.
Another three had been trading statistical arbitrage for about three to five years and a
further three indicated that they had been trading this strategy for a period between
five and ten years. This information is reflected in Figure 4.17 below.
0123456789
UnderlyingInstruments
Options Forwards Futures
Hedge Instrument
Re
sp
on
de
nts
Page 162
MANAGING PURE AND STATISTICAL EQUITY ARBITRAGE OPPORTUNITIES WITHIN THE SOUTH AFRICAN ENVIRONMENT- CRONJE, P (2004)
147
Figure 4.17 Period that the respondents have traded statistical arbitrage
The average number of statistical arbitrage trades that the respondents entered into
on a monthly basis varied and the results are shown in Figure 4.18 below, with four
respondents entering into less than five trades in a month, two companies indicated
that they traded between five and ten trades a month, one respondent said they
traded between ten and twenty trades a month, while one respondent said they
traded between twenty and fifty statistical arbitrage trades in a month.
Figure 4.18 Number of statistical trades entered into on a monthly basis
0
1
2
3
4
5
< 5t r a n s a c t i o n s
> 5 < 1 0t r a n s a c t i o n s
> 1 0 < 2 0t r a n s a c t i o n s
> 2 0 < 5 0t r a n s a c t i o n s
N u m b e r o f t r a n s a c t i o n s
Re
sp
on
de
nt
s
0
1
2
3
4
< 1 Yea r > 1 year < 3years
> 3 years < 5years
> 5 years < 10years
Durat ion of t rad ing th is s t ra tegy
Re
sp
on
de
nts
Page 163
MANAGING PURE AND STATISTICAL EQUITY ARBITRAGE OPPORTUNITIES WITHIN THE SOUTH AFRICAN ENVIRONMENT- CRONJE, P (2004)
148
All the companies that trade this arbitrage strategy focus only on the liquid shares
and indicated that they avoided the non-liquid shares when executing this trading
strategy.
4.4.4.5 PROFITABILITY AND RISKS
All the respondents that are involved in this arbitrage strategy were of the opinion
that this was a profitable trading strategy. The responses that were received in terms
of the actual returns required ranged from any number greater than zero after
transaction costs to 20% annually.
The respondents were of the opinion that the transaction costs were the most
significant cost that they incur in their statistical arbitrage trading; this was followed
by securities lending costs, then systems costs, followed by staff costs. Table 4.3
below reflects the responses received from the institutions that trade statistical
arbitrage.
Table 4-3 Costs break down in statistical arbitrage trading
Seven of the eight respondents were most concerned with the market risk associated
with the statistical arbitrage trades, and considered this to be critical in managing
their risk, while four indicated that they considered the Greeks to be significant
indicators of risks in this trading. Two were concerned with execution risk one with
legal risk and one with credit risk. Figure 4.19 below shows the perceived risks as
viewed by the respondents to the questionnaire.
Cost Driver 4 3 2 1Transaction / Hedging costs.
5 2 1 0Securities lending cost. 2 6 0 0
Staff 0 0 3 5Systems 1 0 4 3
Cost Rating
Page 164
MANAGING PURE AND STATISTICAL EQUITY ARBITRAGE OPPORTUNITIES WITHIN THE SOUTH AFRICAN ENVIRONMENT- CRONJE, P (2004)
149
Figure 4.19 Risks in statistical arbitrage
What is of interest is that none of the respondents considers the currency risk to be
significant in their statistical trading process, which implies that they are not doing
statistical arbitrage between the local and international exchanges. This is particularly
interesting when viewed in light of the volatility arbitrage strategy discussed below
and the dual listed arbitrage strategy discussed above.
4.4.5 VOLATILITY ARBITRAGE
In the entire sample only three respondents traded volatility arbitrage, which implies
that this field of arbitrage does not receive a large degree of attention. The
respondents that do not trade volatility arbitrage provided the following feedback,
which is best described by Figure 4.20 below. One respondent indicated that they do
not have a system to track or identify these trades, one indicated that they have no
interest in this type of trading, eleven indicated that this type of trading was not part
of their core business, and one respondent is of the opinion that this trading does not
exist.
012345678
ExecutionRisk
Credit Risk –counterparty
risk
Market Risk– sensitivity
to theunderlying
Legal Risk CurrencyRisk
Greeks
Risks in statisitical arbitrage
Res
po
nd
ents
Page 165
MANAGING PURE AND STATISTICAL EQUITY ARBITRAGE OPPORTUNITIES WITHIN THE SOUTH AFRICAN ENVIRONMENT- CRONJE, P (2004)
150
Figure 4.20 Responses from companies as to why they do not trade volatility
arbitrage
4.4.5.1 IDENTIFICATION PROCESSES
Of the institutions that trade volatility arbitrage all were of the opinion that their
trading process would be improved through the development of more appropriate
mechanisms that could identify the volatility arbitrage opportunities that exist in the
market. One of the respondents indicated that the execution process could also be
improved.
Not one of the respondents have any formal system, that can be used to identify
volatility arbitrage opportunities, and the mechanism used to identify arbitrage types
is to analyse and identify volatility arbitrage opportunities in a spreadsheet.
All of the respondents indicated that they trade volatility arbitrage on a speculative
basis, with two of the respondents trading the reversion to historical means as a
strategy and one respondent trading the spread between the volatilities of different
maturities. One of the respondents also takes a view on volatilities between
companies that are highly correlated.
4.4.5.2 TRADER’S DISCRETION
Given the fact that all respondents involved in volatility arbitrage are using
spreadsheets to determine whether or not to trade these strategies, all decisions are
left to the trader in this regard. There is therefore no real benchmark that can be used
0
2
46
8
1012
No system No interest Not part of yourcore business
Don't have thelegal ability to
trade dual listedarbitrage.
It does not exist
Reasons why companies don't trade volatility arbitrage
Res
po
nd
ents
Page 166
MANAGING PURE AND STATISTICAL EQUITY ARBITRAGE OPPORTUNITIES WITHIN THE SOUTH AFRICAN ENVIRONMENT- CRONJE, P (2004)
151
to indicate how many opportunities were missed and how effective the trader is at
trading this strategy.
Obviously, the traditional mechanisms of performance against budget can be used to
determine how effective the trader is over the given period, but this does not prove
that the trader was effective in all trades, or that the results were not generated by
only one trade which went in the favour of the trader.
Only one institutions trades volatility arbitrage that is considered to be pure arbitrage.
This trading is done on the basis of taking offsetting positions at equivalent strikes in
different countries where there are different volatilities applied to the same shares on
different exchanges.
4.4.5.3 HEDGING AND STOP LOSSES
All three respondents that traded volatility arbitrage apply stop losses to the trades.
Two of them set the level at between 5% and 10%, while one set the level at
between 15% and 20%. A frequency distribution of the stop loses employed by the
respondents is provided in Figure 4.21
Figure 4.21 Stop losses applied in volatility arbitrage
All the above respondents use the underlying instrument and their associated options
to effect their hedging requirements. Two said they also use futures and forwards to
0
0 .5
1
1 .5
2
2 .5
< 5 % > 5 % < 1 0 % >10% > 15% > 1 5 % > < 2 0 %
Stop losses appl ied in volat i l i ty arbi t rage
Re
sp
on
de
nts
Page 167
MANAGING PURE AND STATISTICAL EQUITY ARBITRAGE OPPORTUNITIES WITHIN THE SOUTH AFRICAN ENVIRONMENT- CRONJE, P (2004)
152
hedge their positions. All respondents involved in this type of trading use PDHs to
determine the hedge requirements through delta and vega hedging.
4.4.5.4 NUMBER OF TRADES AND THEIR DURATION
The respondents that provided feedback on volatility arbitrage indicated that one of
them had been trading between one and three years another had been trading
between three and five years and another had been trading for a period of between
five and ten years. This information is reflected in the Figure 4.22 below.
Figure 4.22 Duration of the volatility arbitrage strategy
Two of the respondents entered into between five to ten trades per month, while one
of the respondents made between 20 and 50 such trades in any given month. This
information is shown in figure 4.23 below.
Figure 4.23 Number of volatility trades made every month
0
1
2
< 1 Y e a r > 1 y e a r < 3y e a r s
> 3 y e a r s < 5y e a r s
> 5 y e a r s < 1 0y e a r s
D u r a t i o n o f v o l a t i l i t y a r b i t r a g e t r a d i n g
Res
pond
ents
0
1
2
3
< 5t r a n s a c t i o n s
> 5 < 1 0t r a n s a c t i o n s
> 1 0 < 2 0t r a n s a c t i o n s
> 2 0 < 5 0t r a n s a c t i o n s
N u m b e r o f s t a t i s i t c a l t r a d e s d o n e m o n t h l y
Re
sp
on
de
nts
Page 168
MANAGING PURE AND STATISTICAL EQUITY ARBITRAGE OPPORTUNITIES WITHIN THE SOUTH AFRICAN ENVIRONMENT- CRONJE, P (2004)
153
4.4.5.5 PROFITABILITY AND RISKS
All of the respondents that are involved in volatility arbitrage felt that the trading was
a profitable strategy that needs to provide returns of at least 20% annually.
The respondents felt that the transaction costs are the most significant cost that they
incur in their volatility arbitrage trading; this is followed by securities lending costs,
staff costs and then systems costs.
Figure 4.24 below shows that all of the respondents felt that market risk is the largest
risk that was encountered, while two felt that the risks indicated by the Greeks and
execution risks are also significant risks that are encountered in this type of trading.
One respondent raised concerns around the risk with counterparties and legal risks
that may be involved in this type of trading – these concerns must relate mainly to
OTC trades as the exchange trades are generally considered to be safe from a credit
perspective.
All respondents felt that the securities lending pool is adequate to cater for their
volatility arbitrage trading processes, and the strategy is only applied to liquid shares,
which implies that they should be in a position to trade in and out of their positions as
and when they need to do so.
Figure 4.24 Risks in volatility arbitrage
0
1
2
3
4
Execution Risk Credit Risk –counterparty
risk
Market Risk –sensitivity to the
underlying
Legal Risk Currency Risk Greeks
Risks in volatilty arbitrage
Res
po
nd
ents
Page 169
MANAGING PURE AND STATISTICAL EQUITY ARBITRAGE OPPORTUNITIES WITHIN THE SOUTH AFRICAN ENVIRONMENT- CRONJE, P (2004)
154
What is of interest is that only one of the respondents considered the currency risk to
be significant in their statistical trading process, which implies that the majority (66%)
of the institutions are not trading volatility arbitrage between the local and
international exchanges.
4.4.6 ARBITRAGE RISK PROCESSES
All respondents indicated that the arbitrage operations risk limits roll up into the
normal equity and equity derivative risk limits. This is as a result of the fact that the
positions are traded onto the standard equity and equity derivative trading systems
and hence the market risk process looks at the overall risk of the equity positions.
Eleven (58%) of the 19 respondents felt that the arbitrage risks should be viewed
independently from the other risk limits applied to the equity desk due to the fact that
the traders would often place extremely large yet riskless positions on the books
which then impacts the notional limits of other trades that the desk as a whole may
enter into.
4.4.6.1 TRADING COSTS
Eleven of the respondents indicated that each trade cost them about R60, the
remaining eight respondents traded at levels below this cost with the one respondent
only being charged about R15 per trade. UST is a taxation cost and therefore all
respondents who are not brokers would pay a quarter of a percent of the value of the
trade for each instance where they purchased shares. Where the respondent is a
stockbroker, they are exempt from this cost given recent changes to the UST
legislation.
The respondents all indicated that the securities lending costs were not fixed at any
one level, and the lending rate was dependent on the share and its availability
Twelve of the respondents indicated that an average lending rate of about 1% per
annum was appropriate for the ALSI Top 40 shares. The remaining respondents
indicated that their lending costs varied between 0.6% and 1%.
The futures trading costs on SAFEX ranged between one basis point and five basis
points. Three respondents indicated that the SAFEX costs were about five basis
points per trade; one was of the opinion that it was about four basis points per trade;
Page 170
MANAGING PURE AND STATISTICAL EQUITY ARBITRAGE OPPORTUNITIES WITHIN THE SOUTH AFRICAN ENVIRONMENT- CRONJE, P (2004)
155
seven indicated that they pay about two basis points; and three indicated that they
pay one basis point per trade. Practically this translates to about three rand a trade
on SAFEX.
The fact that the respondents have differing values for the cost drivers indicates that
certain participants have a cost leadership advantage in arbitrage trading. The
research therefore holds the opinion that these institutions with lower cost structures,
should trade a greater number of trades and also generate greater profitability than
the institutions who do not have these cost advantage.
4.4.6.2 PROCESSES ADOPTED IN MEASURING RISK
Twelve of the respondents that trade equity arbitrage and which completed the
questionnaire indicated that their equity market risk limits are managed by the
general market risk function in the organisation. The type of business also plays a
part in this answer, as those respondents that are more involved in investment
management indicated that their position risk is not picked up by the general market
risk functions. This seems to be because the investment managers generally follow a
buy and hold strategy.
4.4.6.3 LIMITS AND SENSITIVITY
The respondents were not forthcoming with regards to the limits and sensitivities that
are implemented in their companies. This is logical as this information may be put to
tactical use in terms of squeezing participants where they are known to hold a certain
position.
With this in mind the research does not intend to delve into the mechanisms used to
create limits for trading books as this function will be performed in different manner in
different institutions given their risk appetites and capital available within the
institution.
Eleven of the respondents were of the opinion that the market risk function should
view the arbitrage risks separately, which would imply that they would prefer to view
arbitrage trading through a separate limit process.
Page 171
MANAGING PURE AND STATISTICAL EQUITY ARBITRAGE OPPORTUNITIES WITHIN THE SOUTH AFRICAN ENVIRONMENT- CRONJE, P (2004)
156
4.4.6.4 PARTIAL DIFFERENTIAL HEDGE (PDH)
The use of PDHs was limited to the banks and stockbrokers who responded to the
questionnaire and which traded derivative instruments in their arbitrage strategies.
These institutions used this measure to determine what the relevant risks are in each
of the risk buckets that are defined by time periods. The use of the PDH measure
was extended to delta and vega.
4.4.6.5 GREEKS
Of the sample that completed the questionnaire and which traded equity arbitrage, 16
respondents have the ability to calculate the delta of the position. 15 of these 16
indicated that they use the delta to manage their arbitrage books.
Fourteen of the respondents indicated that they have the ability to measure the vega,
theta, gamma and rho associated with their positions, but only eleven said they have
experienced the need to manage their books using Vega and Rho. Twelve
respondents said they use gamma in managing their books. The fact that 14
respondents have the ability to calculate and use the vega measure in their business
processes does imply that they can extend their hedging processes to include
options on the underlying and indexes when trading arbitrage. The fact that eleven
respondents are currently using this measure implies that they already have the
processes working in their environment and that the extension of options to their
arbitrage processes should be relatively simple and it is a business decision to enter
this market.
As shown in the analysis of the various arbitrage types discussed above, the different
arbitrage types, require different techniques to measure and manage the risks
associated with the positions. The respondents mainly rely on the Greeks to measure
the risks associated with statistical arbitrage using options and futures. However, it
should be noted that there is some interest rate risk associated with the pure
arbitrage positions, as if the interest rate is incorrect then the theoretical or fair value
and the Rho is incorrect.
Page 172
MANAGING PURE AND STATISTICAL EQUITY ARBITRAGE OPPORTUNITIES WITHIN THE SOUTH AFRICAN ENVIRONMENT- CRONJE, P (2004)
157
4.4.6.6 PROFIT CONTROL PROCESSES
From the individual analysis of the various arbitrage types described above, it is
obvious that there is no clearly defined method through which the traders are
measured against all trade opportunities that may have presented themselves in the
market. Twelve of the respondents measured the traders’ performance against a
budget which is agreed to at the start of each financial period.
Where the respondents were asset managers the method employed was to measure
the performance of the trades against the benchmark that they use to measure the
performance of their portfolio’s. Two companies used alternative methods, which
were also the equivalent of monetary performance measures and two companies did
not complete this question.
4.4.6.7 SETTING BENCHMARKS AND MANAGING TRADERS
The respondents employ between one and three traders to take ownership of the
equity arbitrage business type, with 14 of the respondents employing two traders.
Figure 4.25 below reflects the breakdown of the number of equity arbitrage traders
per respondent that indicated they were trading equity arbitrage. The average trader
would earn in excess of R600,000 annually, according to nine of the respondents that
did not feel this information was too sensitive. Two of the respondents indicated that
the traders would earn between R400,000 and R550,000 excluding bonuses.
Figure 4.25 Number of equity arbitrage traders employed per firm
0
2
4
6
8
1 0
1 2
1 4
1 6
1 2 3 4 > 4
N u m b e r o f e q u i t y a r b i t r a g e t r a d e r s
Re
sp
on
de
nts
Page 173
MANAGING PURE AND STATISTICAL EQUITY ARBITRAGE OPPORTUNITIES WITHIN THE SOUTH AFRICAN ENVIRONMENT- CRONJE, P (2004)
158
Thirteen (68%) respondents who were of the opinion that the traders should also
focus on other trading activities in addition to equity arbitrage trading. This is due to
the fact that the arbitrage trades do not present themselves continually, or to phrase
this in a different manner, there is not enough volume to justify only letting the traders
focus on equity arbitrage trading. There is no clear sector split between the six
respondents that are of the opinion that the traders should only focus on arbitrage
and those that felt that the traders should focus on other related trading matters.
Where respondents prefer the traders to focus only on arbitrage trades, this is due to
the specialised and time consuming nature of the arbitrage operations.
In general equity arbitrage is housed in the equity derivative area in 13 of the 19
cases where the respondents trade equity and equity derivative arbitrage. In the six
cases where the trading was not housed in the equity derivative area, these
structures are housed in an area that focused only on arbitrage, be it a hedge fund or
a separate trading desk.
4.4.6.8 SIMULATIONS AND MONTE CARLO PROFIT MAXIMISING
Only twelve (63%) of the 19 respondents that trade equity arbitrage have the ability
to simulate the profitability through historical scenarios and only six use Monte Carlo
analysis to forecast and attempt to achieve maximum profitability of the arbitrage
trading opportunities in the future.
The view held by the research is that for effective statistical arbitrage trading to take
place, an approach should be available to maximise the profitability in the future. This
requirement only becomes necessary where the respondents trade statistical and
volatility arbitrage, as there is no need for these predictors where pure arbitrage is
concerned.
4.4.6.9 MEASURING PROFITABILITY
The feedback that was received from the respondents indicates that the
measurement of profitability is performed in an appropriate manner from the
perspective of the traders who completed the research questionnaire. There is only
one instance where the trader was of the opinion that the index and SSF arbitrage is
not performing as well as it was expected to perform.
Page 174
MANAGING PURE AND STATISTICAL EQUITY ARBITRAGE OPPORTUNITIES WITHIN THE SOUTH AFRICAN ENVIRONMENT- CRONJE, P (2004)
159
Of further interest is that a formal approach is not used to determine the expected
profitability given the historical performance of the trades prior to setting up an
arbitrage trading desk.
In terms of the measurement of profitability different approaches are applied. The
generalisations that can be gleamed from the responses are that where asset
managers are involved the measurement techniques are based on benchmark
performance, while in the treasury and stock broking environments trading
performance is set against budgets for each arbitrage type.
4.5 RESULTS OF TIME SERIES ANALYSIS
This section reviews each of the arbitrage types and strategies that have been
discussed throughout the previous chapters in the context of a time series analysis.
The method employed is to discuss each of the arbitrage strategies individually with
the emphasis being on the number of trades traded, the transaction costs incurred
and the profitability of the strategy over time.
A statistical analysis and profitability of arbitrage types is presented, as well as an
analysis of findings relating to index and single stock futures.
4.5.1 STATISTICAL ANALYSIS AND PROFITABILITY OF ARBITRAGE TYPES
The empirical research concluded amongst equity arbitrage trading entities was used
to determine what the realistic cost drivers and stop loss levels are that should be
applied in the time series analysis. Therefore the findings with regard to actual costs
and stop loss levels were used as inputs to determine the profitability of the different
arbitrage types in the time series analysis.
4.5.2 ANALYSIS OF FINDINGS RELATING TO INDEX AND SINGLE STOCK FUTURES
4.5.2.1 GENERAL
The analysis of the arbitrage opportunities within the time series context showed that
both SSF and Index futures arbitrage opportunities were present in the market for the
respective periods under review. The research was based on actual traded levels as
Page 175
MANAGING PURE AND STATISTICAL EQUITY ARBITRAGE OPPORTUNITIES WITHIN THE SOUTH AFRICAN ENVIRONMENT- CRONJE, P (2004)
160
provided by the JSE and SAFEX. In the case of SSF, the liquidity was visible in both
futures and the underlying, whereas in the case of index futures the liquidity in the
future was visible while the liquidity in the underlying shares was assumed due to the
varying nature of the index constituents and the large number of trades that need to
be traded in each index trade that is simulated.
Where the calculated profitability of any given trade after transaction costs was
calculated to be less than R100, the trade was excluded from the results as the effort
and risks involved in putting these trades on the books and managing the trades until
the point where the prices converge or the contracts mature, would in reality not
justify the amount of effort involved in terms of the returns generated.
For index arbitrage it was assumed that only ten contracts would be purchased in
any one trade on any given day where a price mismatch was identified. This fact is
not considered to be a limitation as the intention is to define the process and not to
scale the transaction to the extent where even the smallest differences in pricing can
be traded to reflect a profit. This comment is considered to be prudent as the actual
liquidity in the futures, the underlying shares and the lending pool is finite, so the
scale on which the trades can be performed is constrained by these factors.
The research does not, however, suggest that it is not possible to trade more than
ten contracts at a time, but in practice where liquidity permits and the future value
allows for arbitrage, greater volumes are encouraged.
4.5.2.2 NUMBER OF TRADES
There were over 49,000 SSF trades included in this research as a result of the fact
that trades occurred in both the SSF on the SAFEX and the underlying shares on the
JSE within half an hour of one another. Where this event occurred the number of
days to maturity, the bootstrapped risk free interest rate and the dividend yield was
applied to the spot price, in accordance with the futures pricing formula, to determine
the implied futures price. The implied futures price was deducted from the actual
futures prices to determine whether arbitrage opportunities were present.
The research indicates that during the period under review and given the
assumptions and methodology applied, there were 1,155 profitable SSF trade
opportunities before transaction costs factored into the calculations. After taking into
Page 176
MANAGING PURE AND STATISTICAL EQUITY ARBITRAGE OPPORTUNITIES WITHIN THE SOUTH AFRICAN ENVIRONMENT- CRONJE, P (2004)
161
account all transaction costs but excluding securities lending costs, there were 737
profitable trades.
The total number of profitable transactions after all transaction costs, securities
lending cost and cost of capital were taken into account, were 699. This implies that
about 60% of all mispriced SSFs can be capitalised upon, after taking into account
the transaction costs, securities lending costs and the cost of capital employed.
Where the mispricing is observed the cost of completing the transaction can be
calculated prior to entering into the trade and therefore if the mispricing is not large
enough to be profitable, then the strategy will not be executed. Of the 699 profitable
trades, 609 incurred securities lending costs, which had a negative effect on the
profitability of the strategy. The findings described above are reflected in Table 4.4
and Figure 4.26 below.
Table 4-4 Number of profitable trades identified in the SSF market for the
period January 2001 to December 2002
Month and year
Profitable
trades before
costs
Profitable trades after
costs
Transactions
which incur securities
lending costs
Number of
profitable trades after
all costs
January-01 4 4 4 4February-01 9 3 2 3
March-01 18 12 10 11April-01 16 9 8 9May-01 4 3 3 3
June-01 5 5 2 3July-01 14 13 10 10
August-01 19 11 10 11September-01 36 25 6 26
October-01 18 15 15 15November-01 24 14 12 11December-01 9 4 0 4
January-02 36 21 19 20February-02 56 12 10 9
March-02 95 35 26 31April-02 112 98 93 96May-02 82 69 61 66
June-02 93 19 18 18July-02 229 222 213 213
August-02 58 24 14 24 September-02 60 28 14 23
October-02 55 21 7 20 November-02 33 33 33 33 December-02 70 37 19 36
1,155 737 609 699
Page 177
MANAGING PURE AND STATISTICAL EQUITY ARBITRAGE OPPORTUNITIES WITHIN THE SOUTH AFRICAN ENVIRONMENT- CRONJE, P (2004)
162
The results are portrayed on a monthly basis and as can be seen there is no clear
indication that the market is getting more efficient as time progresses, and there is no
definitive number of SSF arbitrage opportunities that present themselves in any
period.
Figure 4.26 Profitable trades and the effects of trading costs, capital costs and
securities lending costs on the SSF trades
The average numbers of profitable SSFs traded during the period under review are
30 profitable trades per month. When looking at the change in volume traded
between 2001 and 2002 the average volumes increased but the exact magnitude
differs depending on the base month that is used for the calculation. However, the
results show that the there were 110 mispriced SSFs, in 2001 and there were 589
such events in 2002.
The analysis of the ALSI Top 40 index arbitrage spanned the period from 4 January
2000 up to and including 31 December 2003. These pricing details were obtained
from Bloomberg’s last trade data and this data was used as the basis for determining
index arbitrage opportunities. The first contract which allowed a full years worth of
analysis was the March 01 contract. The results reflect only trades on the futures that
are 1 year or less from maturity, due to the fact that the research wishes to avoid
cases where the dividend forecasts become questionable and also because the
liquidity and method used to reflect the closing price when no trades have occurred
0
50
100
150
200
250
Date
Num
ber o
f pro
fitab
le tr
ades Profitable trades
before costs
Profitable after costs
Transactions whichincur securitieslending costs
Number of profitabletrade after all costs
Page 178
MANAGING PURE AND STATISTICAL EQUITY ARBITRAGE OPPORTUNITIES WITHIN THE SOUTH AFRICAN ENVIRONMENT- CRONJE, P (2004)
163
may result in the SAFEX pricing reflecting opportunities that do not exist. This is one
of the reasons why the number of trades tapers off as the research approaches the
March, June, September and December 04 contracts, as the rolling effect of the time
analysis ends on the December 2004 contract.
The research shows that there were 1,737 trades, which met the profitability
requirements during this time and the contracts involved in the trading included those
reflected in Table 4.5 below.
Table 4-5 ALSI Top 40 index arbitrage trades reflected at a contract level for the
period under review
The data in Table 4.5 above shows that the number of trade opportunities is relatively
consistent per future analysed with and average number of trade opportunities per
future being about 126. This average was calculated after excluding the 2004
contracts due to the fact that the data was only analysed up to the end of 2003 and
therefore inclusion of these contracts would create an inaccurate reflection of the
average Index arbitrage opportunities which presented themselves for each contract.
The range of trade opportunities that were observed was 72 to 165 trades for the
June 01 and September 03 contracts respectively. Figure 4.27 below reflects this
trade information in the form of a frequency distribution.
Futures Close Date Future Settlement Date Number of tradesH1 15-Mar-01 150.00 M1 21-Jun-01 72.00 U1 20-Sep-01 96.00 Z1 20-Dec-01 98.00 H2 21-Mar-02 161.00 M2 20-Jun-02 110.00 U2 19-Sep-02 83.00 Z2 19-Dec-02 139.00 H3 20-Mar-03 163.00 M3 19-Jun-03 145.00 U3 18-Sep-03 165.00 Z3 18-Dec-03 125.00 H4 18-Mar-04 123.00 M4 17-Jun-04 73.00 U4 16-Sep-04 28.00 Z4 18-Dec-04 6.00
1,737.00
Page 179
MANAGING PURE AND STATISTICAL EQUITY ARBITRAGE OPPORTUNITIES WITHIN THE SOUTH AFRICAN ENVIRONMENT- CRONJE, P (2004)
164
The profitable index arbitrage trades on the 2001 contracts showed 416 profitable
trading opportunities, 2002 contracts showed 493 profitable trading opportunities
while the 2003 contracts showed 598 profitable trading opportunities. These
increases show that there is an average increase of profitable index arbitrage of
about 20% during the period under review.
Figure 4.27 Frequency distribution of the number of trades entered into given
the research assumptions
4.5.2.3 VOLUME TRADED
The average volume traded using the methodology applied to SSFs whereby only
traded volumes at each mismatch level could be traded, is 31 contracts per trade.
The assumptions were different for arbitrage trading on the ALSI Top 40 Index and
these volumes were set to only ten contracts per futures price mismatch per day.
This assumption is considered to be restrictive, as the liquidity should in actual
trading circumstances allow for more contracts to be traded.
4.5.2.4 TRANSACTION COSTS
The transaction costs incurred in the ALSI Top 40 Index arbitrage trades over the
entire period is R 15,876,124. This value includes trading costs relating to the
-
20
40
60
80
100
120
140
160
180
Mar
-01
May
-01
Jul-0
1
Sep
-01
Nov
-01
Jan-
02
Mar
-02
May
-02
Jul-0
2
Sep
-02
Nov
-02
Jan-
03
Mar
-03
May
-03
Jul-0
3
Sep
-03
Nov
-03
Jan-
04
Mar
-04
May
-04
Jul-0
4
Sep
-04
Nov
-04
ALSI Top 40 Futures Contract
Nu
mb
er o
f T
rad
es
Page 180
MANAGING PURE AND STATISTICAL EQUITY ARBITRAGE OPPORTUNITIES WITHIN THE SOUTH AFRICAN ENVIRONMENT- CRONJE, P (2004)
165
brokerage, JSE, STRATE, SAFEX and UST. It does not include securities lending
costs.
Where index arbitrage is traded, the assumption is made that the whole order will be
filled with one trade in each of the underlying shares that make up the ALSI Top 40
and also that one trade will buy the volume required in the future. There will be cases
where more than one trade is concluded to fill the order, so this may not always be a
realistic assumption. However, as the exact number of trades (or hits) that will be
required to fill each of the required orders is not directly visible for the purposes of
this analysis this assumption will need to be made.
The average cost that was applied to the calculations was taken as the average of
the transaction costs from the research findings in section 4.4.6.1. and was set at
R60 per trade. It should be obvious that the less the transaction costs, the more
profitable the trading strategy will be and the more arbitrage trades that the company
can trade.
The empirical research showed that the transaction costs incurred differed
substantially between the various respondents that traded arbitrage, and where large
volumes of trades are required such as in the case of index arbitrage these
economies become vital in the profitability matrix, as mentioned in section 4.4.6.1.
While company structures differ, the brokers should receive a marginal benefit, which
will equate to the 0.25% being the UST costs, as the legislation now allows for the
brokers not to be charged this cost. This benefit will aid the brokers in being more
competitive in the index arbitrage process environment.
The securities lending costs that were incurred in the index arbitrage trades identified
amounted to roughly R907,000. This is another case where the costs that the
institutions incur for this lending service varies between institutions, as reflected in
the empirical research, and therefore a institutions ability to compete is affected by
this cost driver. Section 4.4.6.1 of this chapter provided the respondents’ views that
the average securities lending cost is set at about 1% per annum on the
consideration being borrowed. Therefore, the time series testing uses 1% for its
securities lending calculation purposes.
Page 181
MANAGING PURE AND STATISTICAL EQUITY ARBITRAGE OPPORTUNITIES WITHIN THE SOUTH AFRICAN ENVIRONMENT- CRONJE, P (2004)
166
4.5.2.5 PROFITABILITY
SSFs showed profits of R1,833,191 before costs and after deducting the SAFEX,
JSE, UST costs, the profitability is reduced by R461,923 to R1,371,510. After the
cost of capital was considered, the profitability was reduced by a further R1,205.
Securities lending costs reduces the profitability by yet a further R150,094. The
profitability after all costs over the period was R1,220,211, or an average profitability
of R1,746 per trade. The findings proved that where the prices on the instruments
converge prior to the contract’s maturity it is beneficial to close out the positions as
this resulted in a saving due to a reduction in the capital costs. This information is
reflected in Table 4-6 below.
Table 4-6 Average and actual profitability of SSFs over the period January 2000
to December 2002
M o n t h a n d y e a r
N u m b e r o f
prof itable
trade after
a l l costs
Net Profit after
a l l t ransact ion
c o s t s a n d c o s t
o f c a p i t a l
A v e r a g e
profitability
January-01 4 1 , 001 . 06 2 5 0 . 2 7
February-01 3 9 7 7 . 0 4 3 2 5 . 6 8
March-01 11 1 , 758 . 59 1 5 9 . 8 7
Apri l-01 9 11 , 407 . 55 1 , 2 67 . 51
May-01 3 2 , 972 . 13 9 9 0 . 7 1
June-01 3 4 , 334 . 04 1 , 4 44 . 68
July-01 10 4 , 717 . 89 4 7 1 . 7 9 August-01 11 3 , 970 . 15 3 6 0 . 9 2
September-01 26 34 , 127 . 10 1 , 3 12 . 58
October-01 15 19 , 260 . 18 1 , 2 84 . 01
N o v e m b e r - 0 1 11 5 , 245 . 13 4 7 6 . 8 3
December-01 4 5 , 154 . 00 1 , 2 88 . 50
January-02 20 15 , 091 . 32 7 5 4 . 5 7
February-02 9 9 1 0 . 7 4 1 0 1 . 1 9
March-02 31 32 , 548 . 79 1 , 0 49 . 96
Apri l-02 96 1 1 2 , 2 0 2 . 4 3 1 , 1 68 . 78
May-02 66 70 , 308 . 49 1 , 0 65 . 28
June-02 18 40 , 060 . 50 2 , 2 25 . 58
July-02 2 1 3 2 4 2 , 1 0 5 . 0 7 1 , 1 36 . 64
August-02 24 8 6 , 027 . 62 3 , 5 84 . 48
September-02 23 2 6 , 917 . 81 1 , 1 70 . 34 October-02 20 1 2 , 624 . 96 6 3 1 . 2 5
N o v e m b e r - 0 2 33 3 6 4 , 8 8 5 . 3 4 1 1 , 057 . 13
December-02 36 1 2 1 , 6 0 3 . 5 7 3 , 3 77 . 88
699 1,220,211.49 1,745.65
Page 182
MANAGING PURE AND STATISTICAL EQUITY ARBITRAGE OPPORTUNITIES WITHIN THE SOUTH AFRICAN ENVIRONMENT- CRONJE, P (2004)
167
Figure 4.28 Actual profitability distribution of SSFs over the period January
2000 to December 2002
Figure 4.28 above shows the actual profitability of the single stock futures. The
distribution shows that the July 02, November 02, and December 02 months were
particularly profitable for this trading strategy.
Figure 4.29 Average profitability of SSFs on a monthly basis
-40,00080,000
120,000160,000200,000240,000280,000320,000360,000400,000
Jan-
01
Feb
-01
Mar
-01
Apr
-01
May
-01
Jun-
01
Jul-0
1
Aug
-01
Sep
-01
Oct
-01
Nov
-01
Dec
-01
Jan-
02
Feb
-02
Mar
-02
Apr
-02
May
-02
Jun-
02
Jul-0
2
Aug
-02
Sep
-02
Oct
-02
Nov
-02
Dec
-02
Date
Pro
fita
bili
ty
-
2,000
4,000
6,000
8,000
10,000
12,000
Date
Ave
rage
Pro
fitab
ility
Page 183
MANAGING PURE AND STATISTICAL EQUITY ARBITRAGE OPPORTUNITIES WITHIN THE SOUTH AFRICAN ENVIRONMENT- CRONJE, P (2004)
168
Figure 4.29 above shows the average profitability of the SSFs during the two year
period on a monthly basis. The figure indicates that the average profitability per trade
has increased over time. The figure also shows that the average profitability per trade
changes on a monthly basis and this average profitability ranged from about R100
per trade to R11,000 rand per trade. With the obvious exception of the November
2002 month the average profitability per trade is R1,700. This average profitability
varies considerably from month to month as is evidenced by the figures above.
The Index arbitrage analysis reflects that the trading strategy is lucrative, but that the
costs involved in generating these profits can be substantial. Table 4.7 and Figure
4.30 below depicts the profitability of index arbitrage trades that were generated on
each of the futures contracts that were traded during the period under review. The
net profitability of the strategy over the period is shown to be R 11,282 million rand,
with the average profitability being about R 6,500 per trade.
Table 4-7 Profitability and average profitability of Index arbitrage for each of the
futures contracts over the period January 2000 to Decmber 2003
Future Set t lement Date Profi tabi l i ty of trades Average prof i tabi l i ty
15 -Mar -01 476 ,444 .91 3 ,176.30 21 -Jun-01 337 ,105 .60 4 ,682.02 20 -Sep -01 336 ,085 .02 3 ,500.89 20 -Dec -01 285 ,060 .13 2 ,908.78 21 -Mar -02 838 ,316 .29 5 ,206.93 20 -Jun-02 942 ,981 .14 8 ,572.56 19 -Sep -02 1 ,056 ,393 .33 12 ,727.63 19 -Dec -02 2 ,189 ,003 .34 15 ,748.23 20 -Mar -03 1 ,257 ,681 .24 7 ,715.84 19 -Jun-03 607 ,318 .18 4 ,188.40 18 -Sep -03 1 ,124 ,435 .15 6 ,814.76 18 -Dec -03 533 ,504 .09 4 ,268.03 18 -Mar -04 878 ,374 .82 7 ,141.26 17 -Jun-04 230 ,380 .67 3 ,155.90 16 -Sep -04 117 ,772 .04 4 ,206.14 18 -Dec -04 71 ,768 .73 11 ,961.46
11 ,282 ,624 .66 6 ,495.47
Page 184
MANAGING PURE AND STATISTICAL EQUITY ARBITRAGE OPPORTUNITIES WITHIN THE SOUTH AFRICAN ENVIRONMENT- CRONJE, P (2004)
169
Figure 4.30 Frequency distribution of the profitability of the index arbitrage
trades for the period January 2000 to December 2003
4.5.2.6 CONCLUSIONS REGARDING SSF’S ARBITRAGE AND INDEX ARBITRAGE
The results that are depicted in this research show that Index and SSFs arbitrage are
lucrative trading strategies even when considering the costs of trading these
strategies. The results show that, even using the stringent assumptions applied to
reduce the negative effects of non-simultaneous data whereby the trades need to be
effected in the underlying and the future in a minimum period of time as discussed in
section 2.2.2.1, these arbitrage strategies generate positive returns over time.
The research does not indicate that there is a reduction in profitability of the trading
strategy over time, but the view held by the research is that as more participants
enter the market the actual revenue generated by each participant may come under
pressure due to limited liquidity and the finite nature securities lending pool.
Where Index arbitrage is analysed, the research takes measures to avoid problems
around non-simultaneous data, as discussed in section 2.2.2.1, and accounts for the
effects of transaction costs, securities lending costs and taxes as discussed in
section 4.4.6.1.
The view held by the research is that the simple nature of these trades allows for the
automation of the process such that no human intervention is required. It is the
expectation that the next level of development in this field of arbitrage in the South
-
500,000.00
1,000,000.00
1,500,000.00
2,000,000.00
2,500,000.00
Mar
-01
Jun-0
1
Sep-0
1
Dec-0
1
Mar
-02
Jun-0
2
Sep-0
2
Dec-0
2
Mar
-03
Jun-0
3
Sep-0
3
Dec-0
3
Mar
-04
Jun-0
4
Sep-0
4
Dec-0
4
Page 185
MANAGING PURE AND STATISTICAL EQUITY ARBITRAGE OPPORTUNITIES WITHIN THE SOUTH AFRICAN ENVIRONMENT- CRONJE, P (2004)
170
African environment will involve the development of more sophisticated systems
which will be able to transact these trades without human intervention. As mentioned
this type of pure arbitrage does not require human input and it could be argued that
the human component may be a liability in this regard as the applications act in the
exact manner described by their code and will not miss trade opportunities.
4.5.3 ANALYSIS OF FINDINGS RELATING TO RISK OR MERGER ARBITRAGE
4.5.3.1 GENERAL COMMENTS
The analysis into the risk arbitrage processes that was adopted in this research was
covered in Chapter 2 and 3. The period under review started in May 2001 and ended
in February 2004, with corporate events which relate to cash or stock offers on local
companies included in the ALSI Top 40 forming part of this research.
Where odd lot offers are announced these are excluded from the research as the
potential profitability to the individual investor is limited to the single odd lot which
they may own. Mergers and acquisitions which occurred outside of the South African
borders were excluded from the research, as most institutions do not have the ability
to trade the offshore leg, as discussed under the dual listed empirical research leg.
Private companies were also excluded from the analysis as when these were the
target for the acquisition the net economic effect could not be determined within the
market as there was no published or traded share price against which to gauge the
effects of the takeover.
4.5.3.2 NUMBER OF TRADES
The number of trades that could be included in this research was governed by the
actual number of corporate events that took place over the ALSI Top 40 for the
period under review. The trades, which were included in this research, were those
corporate events, which resulted in the majority of shares in one company being
transferred to the acquiring company. These transactions were usually performed by
providing cash for the shares being acquired or through the issue of shares to the
shareholders of the company being acquired.
Page 186
MANAGING PURE AND STATISTICAL EQUITY ARBITRAGE OPPORTUNITIES WITHIN THE SOUTH AFRICAN ENVIRONMENT- CRONJE, P (2004)
171
There were 167 mergers, acquisitions and cash stock offers during the research
period. Figure 4.31 below reflects the types of corporate events that formed part of
the SENS announcements provided by the JSE. One was a preference share issue,
while 64 were classified as private sales of companies, or open market purchases of
shares by the acquiring company – these were therefore excluded. Three
transactions which could have been analysed were still pending at the end of
February 2004 and these results could therefore not be reported upon. There are 65
transactions done offshore and therefore these fall outside the scope of the research.
There were therefore 34 mergers and acquisitions left for analysis within the sample
period and ALSI Top 40 sample group. Of these 34 transactions, five transactions
resulted in negative returns while 29 (85.3%) resulted in positive returns.
Figure 4.31 Corporate events in the risk arbitrage sample of the ALSI Top 40
4.5.3.3 VOLUME TRADED
In order to quantify the effects of the arbitrage strategy, this research assumed that
when the takeover is announced, then 10,000 shares of the company being acquired
will be purchased. It is also assumed that this volume will be purchased at a price
equal to the closing price on the day that the announcement is made. This
assumption is restrictive in a sense, as the prices would tend to move in the direction
of the premium or discount being offered during the days trading. Therefore the
closing price may not be the most optimum level at which the trades could have been
concluded during the trading day. However the research does consider this to be a
conservative method and this approach is therefore adopted.
0
10
20
30
40
50
60
70
Pref Shares Offshore companies Private companies Pending Positive returns Negative returns
Event type
Num
ber
of e
vent
type
s
Page 187
MANAGING PURE AND STATISTICAL EQUITY ARBITRAGE OPPORTUNITIES WITHIN THE SOUTH AFRICAN ENVIRONMENT- CRONJE, P (2004)
172
While the mispricing of the shares often continued for days and sometimes weeks
after the announcement was made the research did not assume that additional
positions would be taken during any period other than the day of the announcement.
The research also did not allow for the positions to be closed out at any time prior to
the deal closure or termination date.
The combination of the above two factors have a negative effect on the total
profitability that could be generated by this trading strategy, but this process does
lend itself well to the creation of a control environment where the variables and
trading methodologies are kept to a minimum. In practice a more flexible method
should be applied such that profits may be enhanced further.
4.5.3.4 TRANSACTION COSTS
The transaction costs that are applied to the transactions entered into were
discussed in section 3.5.1.7 and section 4.4.6.1 and all costs ranging from JSE
trading costs to UST and lending costs were included in the study. The actual costs
applied were again the averages from the empirical studies discussed in section
4.4.6.1 and amounted to R60 per trade, 0.25% for UST and 1% for securities lending.
Table 4.8. below, shows that transaction costs amounted to about R4,080, while the
largest cost driver was the UST component in these trades as this amounted to about
R68,785. Securities lending costs were only incurred in cases where the takeover or
issue was being transacted at a discount and therefore the share would need to be
sold short at the announcement date and then purchased after the last day to
register. This cost amounted to R1,129. The total transaction costs that were incurred
in this trading strategy amounted to R73,994.
Page 188
MANAGING PURE AND STATISTICAL EQUITY ARBITRAGE OPPORTUNITIES WITHIN THE SOUTH AFRICAN ENVIRONMENT- CRONJE, P (2004)
173
Table 4-8 Analysis of costs incurred in risk arbitrage
4.5.3.5 PROFITABILITY
Given the assumptions made in terms of the volumes traded for each of the risk
arbitrage trades that presented themselves, the profitable trades generated
R2,951,665 over the three year period. The loss making trades were limited to five
trades as mentioned and a stop loss of 6% was applied in the calculations. This
translates into total losses amounting to R4,200 for the period under review.
Figure 4.32 Percentage distribution of returns generated through Risk arbitrage
for the period 2001 to 2004
Figure 4.32 above reflects the risk arbitrage profitability findings expressed as
percentages before and after costs. The values are also converted into annualised
returns for general information, but this is not the key measurement technique
applied. The general profitability of the transactions entered into showed a return of
19,735% after costs and this figure when expressed on an annualised basis
translates to 72,565%. In chapter 2 it was explained that it is best not to report on
these results in the annualised form as the arbitrage trades cannot be repeated once
the deals have been concluded.
Cost Type Cost incurredTransaction Costs 4,080.00 UST 68,785.32 Securities Lending Costs 1,129.32 Total Cost Incurred 73,994.63
0
2
4
6
8
10
12
< -10% <0% >0% <5% >5% <10% >10%<20%
>20%<50%
>50%<100%
>100%
Percentage returns generated
Num
ber o
f tra
des Annulised Return After
CostReturn After Cost
Annualised Return BeforeCostsReturn Before Costs
Page 189
MANAGING PURE AND STATISTICAL EQUITY ARBITRAGE OPPORTUNITIES WITHIN THE SOUTH AFRICAN ENVIRONMENT- CRONJE, P (2004)
174
The research therefore indicates that the general profitability of this trading strategy
is at a level which justifies trading these opportunities and that risk arbitrage in South
Africa does exist and is generally as profitable as the opportunities which present
themselves in the international environment where this arbitrage type is traded
actively as discussed in Chapter 2.
4.5.3.6 CONCLUSION REGARDING RISK ARBITRAGE
The risk arbitrage strategy is definitely lucrative and returns are of similar magnitudes
as the returns found in similar research into risk arbitrage in the international
markets. The fundamental driver of the profitability of this strategy is corporate
activity and given the fact that more than 50% of the corporate activity that occurs in
the ALSI Top 40 shares is performed offshore, it can be implied that profit
maximisation will occur where institutions have the ability to trade in the local and
international markets such that they can capitalise on the greater number of mergers,
acquisitions and share issues that take place in the international markets.
Given the fact that only companies in the ALSI Top 40 were included in the research,
the profitability of this strategy should be increased by adding the companies which
undergo corporate activity but which are not included in the ALSI Top 40 index. This
is due to the fact that the volumes of corporate activities, drive the profitability of this
strategy as mentioned earlier.
In summary, this is an extremely simple and lucrative arbitrage type that lends itself
to arbitrage and which can be traded with limited downside given a rigid adherence to
a stop loss of 6% or below. The complexity in this strategy lies in the fact that it
cannot be automated in a simple manner due to the non-standardised method used
in SENS messages. This again implies that opportunities may be easily missed, and
may partly explain why these opportunities remain visible in the market for the
lengthy periods described in the empirical research leg of this chapter.
Page 190
MANAGING PURE AND STATISTICAL EQUITY ARBITRAGE OPPORTUNITIES WITHIN THE SOUTH AFRICAN ENVIRONMENT- CRONJE, P (2004)
175
4.5.4 ANALYSIS OF FINDINGS RELATING TO DUAL LISTED ARBITRAGE
4.5.4.1 GENERAL COMMENTS
The dual listed arbitrage analysis follows the assumption that shares in the same
company on different exchanges should trade at the same or similar price given the
exchange rate conversion factor and the costs associated with trading any price
differences. The trade opportunities are presented in cases where the SA bid is less
than the UK offer or where the UK bid is greater than the South African offer price.
The process also involves crossing the currency spread as Pounds are bought to
purchase the shares and sold again when the shares are sold – this additional cost
can be avoided where the pounds are kept offshore and need not be converted back
to Rand. This decision will be a function of the institution view on the currency and for
the purposes of the research it is assumed that the currency spreads will be crossed
and that the money will be converted back to its original base currency.
The findings that are generated in this research pertain to the South African and
London stock exchanges, but the logic can be extended to American Depository
receipts and any other exchange be it in the US, Europe or Australia where
companies have multiple listings.
One of the limitations of the research is clearly that the analysis only looks at the last
share price traded on the exchange and applies currency conversion at the close of
business of the respective day to these share prices.
4.5.4.2 NUMBER OF TRADES
The total number of trades is clearly a function of the number of dual listed shares
and if the South African shares listed in the US, Australia and European Union
exchanges were included in the research there would be a greater number of trades.
However, for the nine dual listed shares which were included in this study the results
discussed below presented themselves.
Table 4.9 below shows that over the period from 1 January 2000 until the 31
December 2003 there were 2,396 instances where dual listed arbitrage opportunities
presented themselves.
Page 191
MANAGING PURE AND STATISTICAL EQUITY ARBITRAGE OPPORTUNITIES WITHIN THE SOUTH AFRICAN ENVIRONMENT- CRONJE, P (2004)
176
The number of trades recorded for each of the respective years shows that on
average about 600 trades could be entered into annually. The range of trading
opportunities remained fairly constant and the monthly variance was less than 100
trades for the period under review.
Table 4-9 Number of dual listed arbitrage trades identified in the research
Figure 4.33 below shows the same information in the form of a frequency distribution.
This figure shows that over the period under review Dimension Data, Anglo
American, Liberty and Old Mutual were the shares which were most likely to
generate arbitrage trades.
Figure 4.33 Distribution of the dual listed arbitrage trades over the sample
period
AGL BIL INP LBT LON LAF OML SAB DDT TotalTotal number of trades in sample 488 222 66 375 198 104 314 68 563 2,398 Trades in 2000 114 64 50 58 48 46 110 22 100 612 Trades in 2001 129 65 16 58 33 7 84 12 188 592 Trades in 2002 143 54 - 121 61 8 64 27 156 634 Trades in 2003 102 39 - 138 56 43 56 7 119 560
0
100
200
300
400
500
600
AGL BIL INP LBT LON LAF OML SAB DDT
Share Code
Nu
mb
er o
f T
rad
es
Total number of trades insample
Trades in 2000
Trades in 2001
Trades in 2002
Trades in 2003
Page 192
MANAGING PURE AND STATISTICAL EQUITY ARBITRAGE OPPORTUNITIES WITHIN THE SOUTH AFRICAN ENVIRONMENT- CRONJE, P (2004)
177
4.5.4.3 VOLUME TRADED
The assumption made in this section of the research is again that only 10,000 shares
will be traded where a price discrepancy is identified. This is due to the fact that the
actual bid/offer volumes are not available and therefore the research sets the
available level at a volume, which this research assumes can be executed with
relative ease.
The results should be a lot more impressive if every opportunity, which presented
itself during any trading day of the research period, was visible in the research data
in addition to the actual volume available. However, despite this limitation the
research does show that these opportunities exist and can be traded in a profitable
manner, which correlates with the empirical research findings earlier in this chapter.
These showed that where market participants have the legal ability to trade dual
listed arbitrage they did find the strategy to be profitable.
4.5.4.4 TRANSACTION COSTS
All LSE and JSE transaction costs, broker fees, taxes and lending costs were
included in the research, and were in line with the market norms as identified in the
empirical research leg of this study discussed in Section 3.5.1.7 and Section 4.4.6.1.
Securities lending cost were set at 1% per annum, while UST was set at 0.25%, and
the trading costs were set to R60 per trade.
The assumption was made that the orders would be filled in one trade, which implies
that the total transaction cost that is incurred by the trades in the time series data is
R287,760.
4.5.4.5 PROFITABILITY
The findings of the time series analysis into dual listed arbitrage are summarised in
Table 4.10 and Figure 4.34 below. Each of the shares that were included in the
sample are shown to have generated profits after taking into account transaction
costs, taxes and securities lending costs. The average profitability per trade is about
R5,700 after taking into account the costs mentioned above. The capital costs were
calculated using the overnight rate as the positions are assumed to be closed out the
following day as the prices converge. This cost should disappear when South Africa
Page 193
MANAGING PURE AND STATISTICAL EQUITY ARBITRAGE OPPORTUNITIES WITHIN THE SOUTH AFRICAN ENVIRONMENT- CRONJE, P (2004)
178
moves to a T+3 settlement, which is aligned with the London settlement timeline.
Currently South Africa uses a T+5 settlement process and therefore there is a slight
capital cost as a result.
The total profitability of this strategy for all shares included in the study amounted to
R13,680,808. The annual returns ranged between R2,5 million and R5,1 million, with
the average being R3,42 million per annum. Table 4.10 also shows the results of the
individual shares performance on an annual basis and Anglogold (AGL) is shown to
have performed the best in this type of arbitrage trading. This fact is more obvious
when looking at Figure 4.34, which depicts the profitability by share.
Table 4-10 Annual profitability per share and the annual cumulative profitability
of the trading strategy
Figure 4.34 Profitability distribution of the dual listed arbitrage trades over the
sample period
AGL BIL INP LBT LON LAF OML SAB DDT TotalProfitability over sample period 4,492,199 637,694 620,303 1,915,551 3,102,851 197,740 453,418 360,829 1,900,224 13,680,808 Value in 2000 741,749 206,162 514,028 139,211 343,911 40,493 186,702 112,389 783,022 3,067,668 Value in 2001 1,253,897 156,553 106,274 183,837 477,953 2,973 105,681 47,294 860,014 3,194,474 Value in 2002 1,697,862 170,406 - 780,673 1,738,259 40,522 93,606 173,361 197,633 4,892,320 Value in 2003 798,692 104,574 - 811,831 542,728 113,752 67,429 27,785 59,555 2,526,346
-
5 0 0 , 0 0 0
1 , 0 0 0 , 0 0 0
1 , 5 0 0 , 0 0 0
2 , 0 0 0 , 0 0 0
2 , 5 0 0 , 0 0 0
3 , 0 0 0 , 0 0 0
3 , 5 0 0 , 0 0 0
4 , 0 0 0 , 0 0 0
4 , 5 0 0 , 0 0 0
5 , 0 0 0 , 0 0 0
AG
L
BI L
I NP
LB
T
LO
N
LA
F
OM
L
SA
B
DD
T
S h a r e C o d e
Pro
fita
bil
ity
Pro f i t ab i l i t y ove r samp lep e r i o d
V a l u e i n 2 0 0 0
V a l u e i n 2 0 0 1
V a l u e i n 2 0 0 2
V a l u e i n 2 0 0 3
Page 194
MANAGING PURE AND STATISTICAL EQUITY ARBITRAGE OPPORTUNITIES WITHIN THE SOUTH AFRICAN ENVIRONMENT- CRONJE, P (2004)
179
4.5.4.6 CONCLUSION REGARDING DUAL LISTED ARBITRAGE
The dual listed arbitrage strategy is traded by a limited number of institutions in the
South African environment as discussed in Section 4.4.3.1, mainly due to the fact
that exchange control restricts the residents of South Africa from trading these
strategies. However, for the institutions that do have the legal ability to trade these
strategies, it is shown that this type of mispricing happens frequently enough to justify
this trading strategy, and more importantly the revenues that are generated through
these trades can also justify this type of trading.
In confirmation of the empirical findings the time series analysis shows these trades
to be very profitable, and the strategy is simple to automate. A further consideration
is that these trades have limited downside as they are basically a form of pure
arbitrage and the trade prices are shown to converge the following day in all the
cases identified in the research. This implies that the capital employed in this strategy
may be large, but the inward flow of cash will happen within days of the initial trade.
Therefore the capital costs incurred will reflect the rate differential in the overnight
rates of the relevant countries.
4.5.5 ANALYSIS OF FINDINGS RELATING TO STATISTICAL ARBITRAGE
4.5.5.1 GENERAL COMMENTS
This area of the research applies two fairly simple statistical models which have been
published in recent years. The first is the model proposed by Reverre (2001), which
is in essence a pairs trading strategy, while the second is an index arbitrage trading
strategy proposed by Meissner (2002). The details of these strategies were covered
in Chapter 2, section 2.4.1 and section 2.4.6 respectively.
The Reverre (2001) Method
The findings showed that only eight cases of average correlations above 60% were
encountered for the four-year period from January 2000 to December 2003 for the
ALSI Top 40 shares. The research used the correlation for the full period to identify
the shares that met the correlation requirements. This was done to allow the sample
to remain constant over the sample period. In the event that shorter periods were
Page 195
MANAGING PURE AND STATISTICAL EQUITY ARBITRAGE OPPORTUNITIES WITHIN THE SOUTH AFRICAN ENVIRONMENT- CRONJE, P (2004)
180
used, the pairs reflected in the sample would in some cases reflect results, which
would skew the overall results due to the fact that their correlations refer to certain
periods only. The shares that exhibited these correlation relationships are shown in
Table 4.11 below. The research can also show that where the time period is
shortened, the number of correlated shares and the degrees of correlation will
increase dramatically.
Table 4-11 ALSI Top 40 shares with correlations greater that 60% for the period
January 2000 to December 2003
The interesting fact that becomes obvious from viewing these relationships is that in
all cases where industrial shares are highly correlated, there is a relationship
between the companies. The companies may for instance be sister companies or
have substantial interests in one another, such as Coronation Capital vs Coronation
Holding, First Rand Bank vs RMB, Invested Ltd vs Investec Plc, or Jonnic Holdings
vs MTN. The second group that is identified are those which relate to the same
industries and in this case almost all (except two) related to the mining industry and
deal either in gold or platinum production, for example Anglo Gold vs Billiton, Amplats
vs Implats, Durban Roodeport Deep vs Harmony and Goldfields vs Harmony.
The basis upon which the trading methodology proposed by Reverre (2001) was
analysed, was to assume that 10,000 shares would be traded for each opportunity
that presented itself over the period under review This number was set at this
relatively low level, so that liquidity constraints would not create a problem on any of
the underlying instruments being analysed. The period that this analysis covered is 1
January 2000 up to December 2003. The analysis only looked at the relationship
Share
Pairs Share Names Correlation
AGL BIL Anglo Gold vs Biliton 0.648035062
AMS IMP Amplats vs Implats 0.629812672
CRH CRN Coronation vs Coronation 0.763416789
DUR HAR Durban Roodeport Deep vs Harmony 0.610932075
FSR RMH First Rand Bank vs Rand Merchant Bank 0.754777916
GFI HAR Goldfields vs Harmony 0.725735476
INL INP Investec vs Investec 0.871172412
JNC MTN Jonnic Holdings vs MTN 0.751930317
Page 196
MANAGING PURE AND STATISTICAL EQUITY ARBITRAGE OPPORTUNITIES WITHIN THE SOUTH AFRICAN ENVIRONMENT- CRONJE, P (2004)
181
between the underlying shares and applied Reverre (2001) method in the manner
proposed in his work.
Meissner, Shegal and Toa’s Method (2002)
This method was discussed in Chapter 2, section 2.2.4.1 of this research and aims to
establish whether global index arbitrage exists by using changes in the leading index
to predict changes in the value of the lagging indices.
As the research focused on the ALSI Top 40, the statistical results of a multiple
regression analysis where the US, Europe and Asia are the independent variables
relative to the ASLI Top 40 as the dependent variable, are reflected in Table 4.12
below.
Table 4-12 Multiple regression of global indices to predict movement in the
ALSI Top 40
The p values were significant at a 95% level, and are reflected in Table 4.13 below.
Table 4-13 P-values reflecting statistical significance in the analysis of the
behaviour of the ALSI Top 40 relative to the independent variables (being
global index ranges)
4.5.5.2 NUMBER OF TRADES
The trade outcomes using the method proposed by Reverre (2001) are described in
Table 4.14 below for each of the correlated pairs that were identified. The summary
statistics that can be provided are that there were 3,044 trades executed using this
Regression StatisticsMultiple R 0.550278776R Squared 0.302806731Adjusted R Squared 0.300366148Standard Error 0.011609847Observations 861
Index Range P-value
European Average (FTSE 100, DAX, CAC) 3.17E-32US - Dow Jones 1.49E-06Asia Average (Nikkie, Hang Seng, AS 51) 1.34E-10
Page 197
MANAGING PURE AND STATISTICAL EQUITY ARBITRAGE OPPORTUNITIES WITHIN THE SOUTH AFRICAN ENVIRONMENT- CRONJE, P (2004)
182
strategy over the four-year period. Of these trades 1,339 were profitable and 1,705
were unprofitable after taking into account the costs involved in trading, which means
that about 44% of the trades entered into were profitable. Analysing the overvalued
positions resulted in 711 being profitable, while 829 were unprofitable giving a
profitability ratio of about 46%. The undervalued positions provided the following
results: 628 trades were profitable, while 876 were unprofitable, giving a profitability
ratio of about 42% after transaction costs.
Table 4-14 Trade details and profits using the Reverre (2001) method
C o r r e l a t e d s h a r e sL o n g p o s i t i o n s o v e r v a l u e d
S h o r t p o s i t i o n s o v e r v a l u e d
L o n g p o s i t i o n s u n d e r v a l u e d
S h o r t p o s i t i o n s u n d e r v a l u e d
A G L B I LP r o f i t m a k i n g 5 0 4 7 5 2 5 1L o s s m a k i n g 6 8 7 1 6 5 6 6% p r o f i t a b l e t r a d e s 4 2 % 4 0 % 4 4 % 4 4 %M o s t p r o f i t a b l e t r a d e 9 2 , 3 6 4 . 2 9 1 1 , 1 5 6 . 4 9 8 7 , 1 9 0 . 0 0 7 , 7 1 3 . 8 2 Leas t p ro f i ab l e t r ade - 7 8 , 9 9 9 . 5 9 - 1 0 , 9 0 8 . 5 9 - 1 1 4 , 5 6 0 . 0 0 - 8 , 4 5 5 . 4 9 A M S I M PP r o f i t m a k i n g 5 5 6 2 6 2 4 0L o s s m a k i n g 6 3 5 6 5 2 7 4% p r o f i t a b l e t r a d e s 4 7 % 5 3 % 5 4 % 3 5 %M o s t p r o f i t a b l e t r a d e 3 3 0 , 2 5 7 . 9 6 1 6 9 , 3 5 8 . 1 0 3 1 4 , 8 0 5 . 0 0 1 6 6 , 0 0 1 . 2 2 Leas t p ro f i ab l e t r ade - 3 1 2 , 2 4 3 . 2 9 - 1 8 0 , 5 5 0 . 2 0 - 2 8 3 , 8 6 7 . 5 0 - 2 6 6 , 8 2 9 . 5 4 C R H C R NP r o f i t m a k i n g 3 3 2 8 1 3 4 0L o s s m a k i n g 2 8 3 3 4 8 2 1% p r o f i t a b l e t r a d e s 5 4 % 4 6 % 2 1 % 6 6 %M o s t p r o f i t a b l e t r a d e 4 , 7 4 0 . 8 6 1 2 , 6 5 2 . 6 8 8 , 5 6 4 . 5 0 7 , 2 6 8 . 2 1 Leas t p ro f i ab l e t r ade - 5 , 8 7 6 . 3 8 - 5 , 8 2 1 . 1 7 - 5 , 6 0 6 . 2 5 - 8 , 0 1 0 . 5 7 D U R H A RP r o f i t m a k i n g 5 5 4 7 4 9 4 8L o s s m a k i n g 6 0 6 8 7 3 7 4% p r o f i t a b l e t r a d e s 4 8 % 4 1 % 4 0 % 3 9 %M o s t p r o f i t a b l e t r a d e 1 3 2 , 7 6 5 . 9 2 1 5 , 7 2 4 . 4 6 1 2 6 , 6 5 5 . 0 0 2 4 , 2 8 8 . 7 9 Leas t p ro f i ab l e t r ade - 1 0 0 , 6 4 6 . 4 7 - 8 , 5 8 4 . 7 7 - 2 0 5 , 9 9 0 . 0 0 - 1 3 , 9 6 1 . 1 2 F S R R M HP r o f i t m a k i n g 5 6 3 7 5 5 3 3L o s s m a k i n g 4 1 6 0 4 6 6 8% p r o f i t a b l e t r a d e s 5 8 % 3 8 % 5 4 % 3 3 %M o s t p r o f i t a b l e t r a d e 5 , 7 7 9 . 5 8 3 , 1 4 2 . 8 6 7 , 5 9 8 . 7 5 5 8 , 7 4 1 . 2 6 Leas t p ro f i ab l e t r ade - 6 , 0 7 4 . 6 1 - 2 , 3 0 4 . 5 0 - 1 2 6 , 3 3 4 . 7 5 - 2 , 7 7 7 . 1 9 G F I H A RP r o f i t m a k i n g 4 5 5 6 4 7 5 3L o s s m a k i n g 6 7 5 6 7 7 7 1% p r o f i t a b l e t r a d e s 4 0 % 5 0 % 3 8 % 4 3 %M o s t p r o f i t a b l e t r a d e 2 0 1 , 8 0 5 . 2 5 7 8 , 7 1 6 . 5 2 1 3 8 , 2 3 0 . 0 0 7 6 , 5 9 6 . 2 2 Leas t p ro f i ab l e t r ade - 1 5 3 , 6 5 9 . 3 0 - 1 2 9 , 3 0 3 . 6 8 - 9 3 , 3 2 0 . 0 0 - 1 0 9 , 9 8 8 . 0 5 I N L I N PP r o f i t m a k i n g 1 0 1 5 1 2 5L o s s m a k i n g 1 2 7 6 1 3% p r o f i t a b l e t r a d e s 4 5 % 6 8 % 6 7 % 2 8 %M o s t p r o f i t a b l e t r a d e 7 0 , 8 8 0 . 4 8 5 0 , 5 3 5 . 8 1 7 6 , 5 2 7 . 5 0 4 2 , 7 8 7 . 5 9 Leas t p ro f i ab l e t r ade - 4 3 , 2 2 8 . 4 5 - 8 3 , 1 7 0 . 0 0 - 3 3 , 2 7 2 . 5 0 - 3 2 , 1 6 5 . 4 7 J N C M T NP r o f i t m a k i n g 6 1 5 4 4 4 4 6L o s s m a k i n g 6 6 7 3 5 1 4 9% p r o f i t a b l e t r a d e s 4 8 % 4 3 % 4 6 % 4 8 %M o s t p r o f i t a b l e t r a d e 2 3 , 3 7 3 . 8 6 4 , 4 2 6 . 2 2 1 6 , 3 2 2 . 5 0 5 , 1 9 5 . 0 8 Leas t p ro f i ab l e t r ade - 1 8 , 0 7 8 . 6 8 - 5 , 5 9 0 . 8 3 - 1 4 , 9 9 5 . 0 0 - 4 , 1 1 9 . 5 2
Page 198
MANAGING PURE AND STATISTICAL EQUITY ARBITRAGE OPPORTUNITIES WITHIN THE SOUTH AFRICAN ENVIRONMENT- CRONJE, P (2004)
183
The summary statistics of trades using the method outlined by Meissner et al (2002)
are outlined in Table 4.15 and Table 4.16 below. Table 4.15 shows all cases where
the leading index has a positive return greater than 0.5, 1, 1.5, 2, 2.5 and 3 while
Table 4.16 shows all cases where the leading index reflected a negative return less
than –0.5, -1, -1.5, -2, -2.5 and -3.
As the intention is to provide the best return in the South African market, the purpose
was to identify which index or index basket acts as the best leading indicator. From
Table 4.15 and Table 4.19 below, the Asian index group provides the best statistical
result. The total number of profitable trades amounted to 170 and the trades resulting
in losses amounted to 94 trades. Therefore the success rate using this strategy is
about 64%.
Table 4-15 Matrix of trades where positive returns are expected in the lagging
index given the positive movement in the leading index
Table 4.16 below shows those trades where the leading indicator showed a negative
return for the day, and the expectation is that the lagging indicator should do the
same. Here, again, the Asian basket of indexes provided the greatest success rate in
South Africa Limit
Number of profitable
trades
Number of loss trades
Number of profitable
trades
Number of loss trades
Number of profitable
trades
Number of loss trades
Number of
profitable trades
Number of loss trades
South Africa 68 50 61 57 55 49 > 0.534 33 31 36 38 29 > 1.029 18 27 20 37 10 > 1.521 12 24 9 26 7 > 2.08 4 5 7 8 4 > 2.59 11 10 10 15 5 > 3.0
US 55 59 53 61 63 51 > 0.534 42 31 46 40 37 > 1.021 15 21 15 18 18 > 1.512 9 9 12 11 10 > 2.04 8 4 8 4 8 > 2.58 9 9 8 8 9 > 3.0
Europe 55 41 57 39 57 39 > 0.545 33 39 39 46 32 > 1.022 26 28 21 38 11 > 1.59 8 10 7 13 4 > 2.09 5 7 7 9 5 > 2.5
22 10 14 18 28 4 > 3.0Asia 75 58 74 59 75 58 > 0.5
52 23 39 36 45 30 > 1.024 8 19 13 26 6 > 1.512 4 10 6 11 5 > 2.03 1 2 2 3 1 > 2.54 - 1 3 2 2 > 3.0
Lea
din
g m
arke
t
Lagging marketUS Europe Asia
Page 199
MANAGING PURE AND STATISTICAL EQUITY ARBITRAGE OPPORTUNITIES WITHIN THE SOUTH AFRICAN ENVIRONMENT- CRONJE, P (2004)
184
predicting the ALSI Top 40. The total number of profitable trades is 187 and the loss
making trades amount to 93 trades, giving an average success rate of about 66.7%
Table 4-16 Matrix of trades where negative return on the lagging index is
expected given the negative return on the leading index
4.5.5.3 VOLUMES TRADED
The volumes traded using the Reverre (2001) method is assumed to be 10,000
shares in each trade that is entered into. This assumption was made to avoid issues
pertaining to liquidity constraints as the research assumes that at least 10,000 shares
can be purchased during the course of the day of the price mismatch.
In applying the method proposed by Meissner et al (2002) it was assumed that only
ten ALSI Top 40 contracts are to be traded for any given trade signal that is
presented in the application of this method. This limit also provided certainty in terms
of the liquidity of the futures that will be traded.
South Africa Limit
Number of profitable
trades
Number of loss trades
Number of profitable
trades
Number of loss trades
Number of profitable
trades
Number of loss trades
Number of profitable
trades
Number of loss trades
South Africa 51 60 61 50 74 37 < -0.557 40 56 40 57 39 < -1.026 18 26 18 32 12 < -1.510 9 11 8 15 4 < -2.08 3 3 8 8 3 < -2.57 4 6 5 6 5 < -3.0
US 56 47 53 50 57 46 < -0.545 39 42 42 47 37 < -1.017 25 19 23 21 21 < -1.512 11 10 13 13 10 < -2.03 6 1 8 6 3 < -2.57 8 7 8 8 7 < -3.0
Europe 69 42 43 68 72 39 < -0.545 35 49 31 58 22 < -1.025 22 29 18 35 12 < -1.523 16 22 17 31 8 < -2.012 4 12 4 15 1 < -2.517 10 15 12 24 3 < -3.0
Asia 78 51 71 58 80 49 < -0.561 29 52 38 55 35 < -1.029 11 25 15 29 11 < -1.513 2 8 7 10 5 < -2.05 - 3 2 5 - < -2.51 - 1 - 1 - < -3.0
Lea
din
g m
arke
t
Lagging marketEurope AsiaUS
Page 200
MANAGING PURE AND STATISTICAL EQUITY ARBITRAGE OPPORTUNITIES WITHIN THE SOUTH AFRICAN ENVIRONMENT- CRONJE, P (2004)
185
4.5.5.4 TRANSACTION COSTS
The effects of transaction cost on the profitability of the Reverre (2001) method are
quite severe, due to the large number of trades that are entered into to generate
these profits. As the trades in this example are all transacted on the JSE at a cost of
about R60 a trade (presuming only one trade is required to fill an order for 10,000
shares). The costs of executing the 3,044 trades on the JSE is therefore about
R365,280 (3,044 x R60 x 2). UST costs amount to about R6,675,288 and was
calculated by multiplying each of the trades entered into by the UST rate 0.25%.
Securities lending costs are estimated to be R36,625.
When applying the Meissner et al (2002) method, the only transaction costs that are
factored into the profitability is the cost of the futures transactions. These transaction
costs are aligned with the costs reflected in section 4.4.6.1 of this chapter and were
set to R3 per trade. Given the fact that there were 264 trade opportunities identified
in the research, this implies that the transaction costs amount to R792. No securities
lending, UST, or other brokerage costs are incurred in this trading.
4.5.5.5 PROFITABILITY
The analysis of the Reverre (2001) method of arbitrage is reflected in Table 4.17
below and shows that the method does provide a net return of R5,927,799.80
(R2,712,239.40+R3,215,560.40) before taking into account transaction costs. The
profits from these trades were accumulated over the period 1 January 2000 to 4
December 2003, and exclude the effects of cost of capital, UST, and securities
lending.
Table 4-17 Results of the Reverre (2001) statistical arbitrage approach before
transaction costs
Correlated shares
Net profit from an over
valued perspective
Profit on short position
Profit on long position
Net profit from
undervalued perspective
Profit on long position
Profit on short position
AGL BIL 292,132.67 283,900.00 8,232.67 355,981.68 314,000.00 41,981.68 AMS IMP 1,847,532.65 879,600.00 967,932.65 2,410,759.43 3,094,900.00 -684,140.57 CRH CRN 58,781.30 16,200.00 42,581.30 73,212.87 -5,800.00 79,012.87 DUR HAR -64,621.73 -120,400.00 55,778.27 -77,473.75 -101,300.00 23,826.25 FSR RMH 58,551.53 44,700.00 13,851.53 17,127.55 -36,400.00 53,527.55 GFI HAR 168,797.26 -95,100.00 263,897.26 161,023.86 -155,500.00 316,523.86 INL INP 283,719.93 69,200.00 214,519.93 221,116.71 234,700.00 -13,583.29 JNC MTN 67,345.78 54,700.00 12,645.78 53,812.04 23,900.00 29,912.04
Total 2,712,239.40 1,132,800.00 1,579,439.40 3,215,560.39 3,368,500.00 -152,939.61
Page 201
MANAGING PURE AND STATISTICAL EQUITY ARBITRAGE OPPORTUNITIES WITHIN THE SOUTH AFRICAN ENVIRONMENT- CRONJE, P (2004)
186
The effects of transaction costs, UST, and securities lending costs on profitability are
shown in Table 4.18 below. After factoring in these aspects of trading, the net loss
after transaction costs is - R1,149,394.26 (-R847,374.56 - R302,019.70). This
strategy shows some degree of profitability over time even though the number of
trades and the amount of effort and risk involved in generating these profits should
be questioned. Transaction costs amounted to R365,280. while the bulk of the
reduction in profitability came from the fact that for each outright purchase of shares,
an amount of 0.25% of the consideration (or R6,675,288) was paid to UST. Therefore
institutions such as brokers who are exempt from UST costs will be more profitable in
this type of strategy.
The cost of capital calculations are excluded from the calculations due to the fact that
under this methodology, the shares are generally held for a day or less which
negates the effects of the cost of holding the position almost entirely. The effects of
securities lending costs is estimated to be about R8,000 and is low, due to the fact
that the loans are only in existence for a day at most.
As can be seen in Table 4.18 below, the Net Profit after costs is negative
R1,149,394. This implies that the transaction costs reduce the profitability of this
trading strategy from a positive R5,562,519 before costs to a negative R1,149,394.
Section 4.5.5.4 showed that the bulk of this cost lay in the UST charge that is
incurred with each purchase of shares and this amount reduces profitability by
R6,675,288. The average loss per trade is therefore about R378 after taking into
account the transaction costs.
Table 4-18 Results of the statistical arbitrage approach proposed by Reverre
(2001) after transaction and securities lending costs
Correlated shares
Net profit from an over valued
perspective Profit on short position
Profit on long position
Net profit from
undervalued perspective
Profit on long position
Profit on short position
AGL BIL -154,302.58 -110,614.78 -43,687.80 -98,724.35 -86,111.75 -12,612.60 AMS IMP -214,646.36 -463,374.33 248,727.97 357,114.48 1,764,123.50 -1,407,009.02 CRH CRN 22,248.08 -613.10 22,861.18 35,783.67 -22,585.00 58,368.67 DUR HAR -341,391.18 -372,104.65 30,713.46 -376,939.30 -371,275.75 -5,663.55 FSR RMH -4,322.60 6,076.79 -10,399.39 -47,672.72 -75,754.00 28,081.28 GFI HAR -267,306.45 -352,767.12 85,460.68 -267,929.62 -398,065.25 130,135.63 INL INP 157,859.21 5,485.82 152,373.39 124,625.68 187,342.00 -62,716.32 JNC MTN -45,512.68 -23,774.20 -21,738.48 -28,277.54 -32,385.75 4,108.21
Total -847,374.56 -1,311,685.56 464,311.00 -302,019.70 965,288.00 -1,267,307.70
Page 202
MANAGING PURE AND STATISTICAL EQUITY ARBITRAGE OPPORTUNITIES WITHIN THE SOUTH AFRICAN ENVIRONMENT- CRONJE, P (2004)
187
When analysing the Meissner et al (2002) method in terms of profitability, the focus
turns to the Asian market as the leading indicator as mentioned earlier. Table 4.19
below shows that where the Asian basket of indexes increased by an amount that
exceeds 0.5% then the ALSI Top 40 would generally also increase. The magnitude of
the increase also seems to correlate to that viewed on the Asian basket of indexes.
In percentage terms the maximum increase was experienced where the Asian
indexes increased by an amount greater that 2.5% but less than 3%. In this instance
the ALSI Top 40’s average increase was about 1.969%, and this was the situation in
about 75% of the cases.
Table 4-19 Index relationships where the leading index move is positive using
Meissner et al (2002) method
When applying a basic technique to reflect the monetary effects of the above strategy
to the results as reflected in Table 4.20, it can be shown that if the ALSI Top 40 index
were purchased, the net profitability of this strategy after transaction costs is in the
region of R1.177 million. As the shares that constitute the ALSI Top 40 index can’t be
purchased outright the positions would in reality have been traded through the
futures, but this method acts as a fair proxy. It should also be noted that no capital
costs were calculated for these trades as they would only be held for a period of one
day and because they are exchange trades. Therefore the maximum cost could be
Limit
% of profitable
tradesChange in
lagged index
% of profitable
trades
Change in lagged index
% of profitable
trades
Change in lagged index
% of profitable
trades
Change in lagged index
South Africa 57.627% 0.866% 51.695% 1.094% 58.475% 0.897% > 0.550.746% 0.780% 46.269% 1.152% 56.716% 0.811% > 1.061.702% 1.101% 57.447% 1.168% 78.723% 0.946% > 1.563.636% 0.911% 72.727% 0.918% 78.788% 0.815% > 2.066.667% 0.800% 41.667% 1.884% 66.667% 1.221% > 2.545.000% 2.123% 50.000% 1.884% 75.000% 1.233% > 3.0
US 48.246% 1.119% 46.491% 1.027% 55.263% 0.773% > 0.544.737% 1.162% 40.260% 1.141% 51.948% 1.006% > 1.058.333% 0.914% 58.333% 1.227% 50.000% 0.673% > 1.557.143% 0.992% 42.857% 0.960% 52.381% 0.636% > 2.033.333% 1.400% 33.333% 1.826% 33.333% 0.694% > 2.547.059% 1.674% 52.941% 2.292% 47.059% 0.920% > 3.0
Europe 57.292% 1.055% 59.375% 0.726% 59.375% 0.862% > 0.557.692% 1.211% 50.000% 1.227% 58.974% 0.892% > 1.045.833% 0.993% 57.143% 1.030% 77.551% 0.925% > 1.552.941% 1.338% 58.824% 0.899% 76.471% 1.377% > 2.064.286% 0.910% 50.000% 1.429% 64.286% 0.692% > 2.568.750% 1.558% 43.750% 1.958% 87.500% 1.175% > 3.0
Asia 56.391% 1.062% 55.639% 1.118% 56.391% 1.083% > 0.569.333% 1.412% 52.000% 0.751% 60.000% 1.398% > 1.075.000% 1.262% 59.375% 0.976% 81.250% 1.328% > 1.575.000% 1.405% 62.500% 1.266% 68.750% 1.429% > 2.075.000% 1.969% 50.000% 0.809% 75.000% 2.820% > 2.5
100.000% 1.947% 25.000% 0.312% 50.000% 1.179% > 3.0
AsiaEurope
Lea
din
g m
arke
t
Lagging Market
South Africa US
Page 203
MANAGING PURE AND STATISTICAL EQUITY ARBITRAGE OPPORTUNITIES WITHIN THE SOUTH AFRICAN ENVIRONMENT- CRONJE, P (2004)
188
the overnight cost of funding the initial margin that would be required by the
exchange.
Table 4-20 Profitability when the leading index increases
The effects of the short sale trades that were entered into as a result of the leading
Asian index basket showing a loss greater that 0.5%, are shown in Table 4.21. This
table also shows that where extreme moves of 2.5% or more occurred on the Asian
indexes, the ALSI Top 40 generally generated profitable short trades. While these
extreme moves did not occur very frequently, the results of their occurrence would in
general result in profitable short trade positions.
Table 4-21 The index relationships where the leading index move is negative
using the Meissner et al (2002) method
S o u t h A f r i c a L i m i t
V a l u e o f p r o f i t a b l e
t r a d e s
V a l u e o f l o s s
m a k i n g t r a d e s
A s i a 6 8 3 , 5 1 3 - 3 8 8 , 0 1 5 > 0 . 56 3 6 , 7 1 5 - 1 5 6 , 3 6 5 > 1 . 02 4 3 , 5 6 5 - 8 5 , 5 2 2 > 1 . 51 4 2 , 1 8 5 - 2 0 , 9 1 6 > 2 . 0
5 0 , 2 0 1 - 4 , 1 1 9 > 2 . 57 5 , 9 3 7 - > 3 . 0
T o t a l 1 , 8 3 2 , 1 1 6 - 6 5 4 , 9 3 7
N e t p r o f i t 1 , 1 7 7 , 1 7 9
Lead
ing
mar
ket
L a g g i n g m a r k e t
Limit
% of profitable
trades
Change in lagged index
% of profitable
trades
Change in lagged index
% of profitable
trades
Change in lagged index
% of profitable
trades
Change in lagged index
South Africa 45.95% 1.002% 54.955% 1.167% 66.667% 0.832% < -0.558.76% 1.02% 58.333% 1.446% 59.375% 1.025% < -1.059.09% 1.15% 59.091% 1.208% 72.727% 0.904% < -1.552.63% 1.26% 57.895% 1.524% 78.947% 0.889% < -2.072.73% 1.30% 27.273% 1.622% 72.727% 1.025% < -2.563.64% 2.22% 54.545% 1.956% 54.545% 1.929% < -3.0
US 54.369% 0.939% 51.456% 1.181% 55.340% 0.851% < -0.553.571% 1.054% 50.000% 1.409% 55.952% 0.952% < -1.040.476% 1.673% 45.238% 1.939% 50.000% 1.047% < -1.552.174% 1.134% 43.478% 1.460% 56.522% 0.879% < -2.033.333% 0.698% 11.111% 0.641% 66.667% 0.854% < -2.546.667% 1.597% 46.667% 2.635% 53.333% 0.701% < -3.0
Europe 62.162% 1.042% 38.739% 0.857% 64.865% 0.962% < -0.556.250% 1.020% 61.250% 1.030% 72.500% 0.871% < -1.053.191% 0.963% 61.702% 0.961% 74.468% 1.015% < -1.558.974% 0.920% 56.410% 1.224% 79.487% 0.812% < -2.075.000% 1.835% 75.000% 2.291% 93.750% 0.928% < -2.562.963% 1.434% 55.556% 1.514% 88.889% 1.147% < -3.0
Asia 60.465% 0.855% 55.039% 0.848% 62.016% 1.184% < -0.567.778% 1.073% 57.778% 0.992% 61.111% 1.472% < -1.072.500% 1.463% 62.500% 1.189% 72.500% 1.377% < -1.586.667% 1.386% 53.333% 0.805% 66.667% 1.835% < -2.0
100.000% 1.140% 60.000% 0.561% 100.000% 2.027% < -2.5100.000% 8.593% 100.000% 1.918% 100.000% 6.663% < -3.0
AsiaEurope
Lead
ing
mar
ket
Lagging marketSouth Africa US
Page 204
MANAGING PURE AND STATISTICAL EQUITY ARBITRAGE OPPORTUNITIES WITHIN THE SOUTH AFRICAN ENVIRONMENT- CRONJE, P (2004)
189
Table 4.22 below reflects the profitability of the trading strategy where short positions
are required due to the decline in the leading indicator. The method is again to use
the ALSI Top 40 values as the proxy measure of the futures that would be traded.
The research shows that these trades would generate about R1.032 million over the
period under review.
Table 4-22 Profitability when the leading indicator decreases
4.5.5.6 CONCLUSIONS REGARDING STATISTICAL ARBITRAGE
The approach proposed by Reverre (2001) can result in a trading strategy that can
generate large profits if it is implemented correctly. This view results from the fact
that the shares with high correlations do tend to converge as expected in the majority
of cases as is evidenced by the profits before costs reflected in section 4.5.5.5,
where the strategy generated in the region of six million rand. The real concern with
this strategy lies in the fact that it cannot be implemented in a cost effective manner
using the underlying shares due to the high UST charges that are incurred when
trading the strategy.
Where the company has an exemption from UST this strategy can be implemented in
its basic form. However, the research shows that the economics of the trade can be
easily replicated in the derivative markets, as this will generate numerous cost
benefits. This relates to the fact that no UST will be incurred, transaction costs will be
South Africa Limit
Value of profitable
trades
Value of loss making
tradesAsia 582,353 -415,751 < - 0.5
578,338 -195,590 < - 1.0377,128 -157,672 < - 1.5156,049 -7,585 < - 2.0
45,589 - < - 2.569,632 - < - 3.0
Total 1,809,089 -776,598
Net profit 1,032,491
Le
ad
ing
ma
rke
t
Lagging market
Page 205
MANAGING PURE AND STATISTICAL EQUITY ARBITRAGE OPPORTUNITIES WITHIN THE SOUTH AFRICAN ENVIRONMENT- CRONJE, P (2004)
190
negligible at about R3 per trade, and securities lending costs will not be incurred. All
these factors in addition to the gearing associated with derivatives may be used to
lever the profitability of this strategy.
In addition to the use of derivatives, which aim to reduce the net transaction costs,
the strategy will benefit from the adherence to a stop loss which should be set at a
level of 0.5% for each day’s move. If, for example, the share prices of either of the
shares moves by more that 0.5% in the wrong direction, the position should be
closed out. The stop loss will therefore reduce the downside associated with the use
of derivative instruments.
The Meissner et al (2002) method is considered to be a superior technique given the
improved returns, greater degree of certainty that the trades will perform in the
expected manner, and therefore the implied reduction in risk that is associated with
the method. The method provided relatively few trade opportunities but has the
potential to generate profits from trading relatively few contracts in each trade, as
was evidenced in section 4.5.5.5.
Page 206
MANAGING PURE AND STATISTICAL EQUITY ARBITRAGE OPPORTUNITIES WITHIN THE SOUTH AFRICAN ENVIRONMENT- CRONJE, P (2004)
191
CHAPTER 5
5. A MODEL FOR THE EFFECTIVE MANAGEMENT OFARBITRAGE TRADING
5.1 INTRODUCTION
The purpose of this chapter is to consolidate all the information gathered through the
research into a recommendation, which can be applied by businesses that are
trading equity arbitrage or that wish to enter the equity arbitrage trading environment.
In defining this process due consideration was given to the feedback received from
the entities that were part of the sample in the empirical research. These findings are
also viewed in the light of the actual time series analysis, that was performed in the
second part of the research.
Various recommendations are made with the view to creating a structured approach
that allows for ease of identification of equity arbitrage opportunities, a reflection of
the traded positions and their associated risks, the costs involved, the opportunity
costs of not taking up positions etc. These factors are reviewed with the view to
providing a business model that enhances the trade management, risk management
profitability management and overall business effectiveness.
The research views this consolidated approach as a method that can be employed to
generate a strategic advantage for the institution as a whole and can therefore assist
ion the ultimate goal of shareholder wealth maximisation.
The chapter also aims to propose statistical methods using linear algebra and
multiple regressions on various indexes to generate statistical trading opportunities
on the ALSI Top 40 index.
5.2 EQUITY ARBITRAGE BUSINESS STRUCTURES
The findings show that the majority of the institutions have structured their equity
arbitrage within the equity-trading environment, which are housed within their
treasuries. In the case of hedge funds and asset managers the trading is set up
within the fund that does the arbitrage trades, while brokers who already have an
Page 207
MANAGING PURE AND STATISTICAL EQUITY ARBITRAGE OPPORTUNITIES WITHIN THE SOUTH AFRICAN ENVIRONMENT- CRONJE, P (2004)
192
equity trading infrastructure have also housed the function within the existing trading
environments.
The research findings do not aim to prescribe any one business structure as the most
appropriate and prefers the view that these structures should be created after due
consideration of the business needs, business structure, resources and infrastructure
which are present in each of the respective businesses.
However, the opinion held by this research is that a centralised structure is the most
appropriate method of dealing with these trading strategies as it allows a degree of
specialisation to be developed in this trading, while also allowing the arbitrage desk
to benefit from market information that flows across the equity derivative or equity
trading desks. This opinion is formed as a result of the fact that the market
information is critical where statistical directional views are placed on the books, as
the sooner the traders receive the market information, the better their decisions
would be.
An additional reason why this structure is proposed is due to the fact that the IT,
capital and human resources that are applied in creating the arbitrage application
and its database can then be spread across multiple trading desks and the cost per
desk is thereby reduced. This investment is required to facilitate the degrees of
automation that are proposed in the remainder of this chapter. A large amount of
computer power is also required to effectively run the proposed solution to the
arbitrage profit maximisation, management and control processes.
5.2.1 CREATION OF A SYSTEM AND STATIC DATA
The only manner in which the arbitrage process can move along the evolutionary
scale is for the process to become more automated with less reliance on human
intervention. To this end it is proposed that the arbitrage process be automated
through the creation of a system that removes the complexity of this trading process
by breaking the processes down into their component parts.
The basic system requirements are:
1. All the instruments required for the arbitrage trading should be available in the
system – be they underlying contracts, futures, forwards or options.
Page 208
MANAGING PURE AND STATISTICAL EQUITY ARBITRAGE OPPORTUNITIES WITHIN THE SOUTH AFRICAN ENVIRONMENT- CRONJE, P (2004)
193
2. All the pricing functions used to price these instruments must be available to
calculate fair values of the instruments involved.
3. All the static data pertaining to the instruments should be housed in the
system as these will be required to calculate the fair values, examples of this
data are contract settlement dates and projected dividends.
4. All information relating to cost drivers should be stored in the database, as
these will be used to calculate the transaction costs, UST charges, and
securities lending costs.
5. All information relating to the market risk limits that are applicable to the
relevant instruments, or position types should be available. These include
notional limits, VAR limits, and limits in terms of the Greeks.
6. An interface to live data in the form of bid offer spreads and available volumes
should feed from the data vendors into the system.
7. There should be an interface into the JSE or SAFEX trading systems such
that the system can generate the trades in an automated manner without
relying on human intervention to load the trades.
8. A manual trade capture facility that allows for trades other than those
suggested by the system and over the counter (OTC) trades should be
implemented.
9. A statistical package that is flexible enough to allow the traders to simulate
historical profitability of arbitrage processes or instruments should be
installed. This function should allow for a pre and post trading cost analysis in
addition to the cost driver analysis.
10. A database (DB) that stores all daily open, high, low, and closing prices that
are fed from the data vendors is essential. The application should also write
any proposed trades, that the system suggests to the DB in addition to
whether the trades and available volumes were executed; where they were
not executed, the reasons provided for not executing the trades should also
be stored.
11. A securities lending data table should be created that allows for the volumes
of shares available and their respective lending costs to be tracked by the
system.
12. Interface into the existing trading system is required to facilitate the transfer of
the arbitrage positions into the general trading system.
Page 209
MANAGING PURE AND STATISTICAL EQUITY ARBITRAGE OPPORTUNITIES WITHIN THE SOUTH AFRICAN ENVIRONMENT- CRONJE, P (2004)
194
5.2.2 ARBITRAGE FEASIBILITY PROCESS
The common approach to trading new strategies is to implement the strategy after
the results of simulations and time series analysis has been reviewed – assuming it
is considered to be a success. The process described below aims to provide a
methodology that can be used in the setup of an arbitrage-trading desk.
This process is illustrated in Figure 5.1 below and has factored in the relevant costs
after taking into account the relevant trading limits and volumes as provided by the
database.
There are two basic scenarios that should be considered when reviewing the
arbitrage feasibility process. The first is where the institutions do not trade arbitrage
and do not have the required infrastructure, but want to setup an arbitrage desk (two
such institutions were identified in the empirical research) The second is where the
company already has an infrastructure that trades arbitrage, but wants to enhance
the process or breakdown the profitability into the individual trading strategies such
these can be measured on their own merits.
In the first scenario where the institutions do not yet trade arbitrage and do not have
the infrastructure to identify and trade arbitrage, but wish to set up an arbitrage-
trading desk, it is suggested that some investment into the basic framework be made
such that the total feasibility of the trading desk (given the trading strategies and the
businesses cost structure) can be factored into the calculations. To achieve this, the
models need to be created, the cost structures need to be defined and the historical
information required to perform the analysis will need to be loaded. This will allow an
analysis of the arbitrage profitability, such that the non-profitable trade types can be
removed from the process. This will leave only the profitable trading strategies that
can then be reviewed in terms of their ability to meet the companies’ internal rate of
return or other benchmark performance figures. Where certain trading strategies do
not meet the profitability requirements these can be removed from the trading
strategies of the desks.
Page 210
MANAGING PURE AND STATISTICAL EQUITY ARBITRAGE OPPORTUNITIES WITHIN THE SOUTH AFRICAN ENVIRONMENT- CRONJE, P (2004)
195
Figure 5.1 Proposed Arbitrage feasibility process
Page 211
MANAGING PURE AND STATISTICAL EQUITY ARBITRAGE OPPORTUNITIES WITHIN THE SOUTH AFRICAN ENVIRONMENT- CRONJE, P (2004)
196
The next step in the process is to ascertain what the expected number of trades over
a given period should be, such that management can determine what the optimum
number of traders would be to perform these trading activities. These costs should
also be factored into the profitability process to ensure that the IRR (or other
profitability) requirements are met by this structure. If the desk will not make money
at this stage, management needs to determine whether given these projections they
wish to setup the desk for strategic reasons. If the opinion is reached that the
business will proceed with the arbitrage business setup, an analysis into the risks
that are associated with the trades should be undertaken, with the view to creating
the relevant risk limits for each arbitrage type.
Where certain trade types are of a risk type that the institution does not want to
include in their operations, these can be excluded from the list of strategies that they
are prepared to trade. Once again the profitability should be reviewed to ensure that
the business is still feasible after decisions about risk factors have been reached.
Where there is an existing arbitrage process and the institution wants to adopt the
methodology described by this model, a similar process to that described above for
institution that do not yet trade arbitrage will be followed. The benefits that may be
included here are that the institution already has an idea of how profitable some of
the trading strategies have been in the past; they may also have an idea of the
capabilities of the traders that they have employed and what level of performance
they can expect from these traders in the future.
The number of traders that the business needs to employ is a function of the number
of arbitrage strategies traded and the participation in these strategies. A further
consideration is the degree of automation of the systems as all these factors
determine how many traders should be employed in the arbitrage trading business.
5.2.3 SIMULATIONS AND MONTE CARLO ANALYSIS TOOLS
When developing a new trading strategy there is a need to create and test it against
historical and live data. To this end the system should have embedded statistical
functions that can cater for the statistical analysis that is required in a flexible
manner. In addition the system must be able to run simulations to determine the
potential outcomes of certain trading strategies in the event that certain pricing
Page 212
MANAGING PURE AND STATISTICAL EQUITY ARBITRAGE OPPORTUNITIES WITHIN THE SOUTH AFRICAN ENVIRONMENT- CRONJE, P (2004)
197
events were to occur. This functionality is key to the trades and the system being
successful in the long term.
The proposal is also that the system should be in a position to determine key factors
such as the most effective stop loss level for each strategy, and the most profitable
time frames for returns, given historic data on the trades that are currently being
simulated. This functionality will be helpful in terms of determining when the most
appropriate time is to close out medium and long term directional relative value
trades.
The Monte Carlo analysis aims to provide the expected returns for the trading
strategy within predefined confidence intervals for trade types that are being
reviewed after considering the stop loss levels, trade durations etc. This process will
allow for profit and loss forecasting prior to entering into the trade and after the trades
have been entered into.
5.2.4 TRADE IDENTIFICATION PROCESSES
Institutions should invest in upgrading their arbitrage infrastructure in a manner that
will allow the mispriced instruments to be identified on a real time basis; i.e. the
system will need a feed from the data vendors on a real time basis. The proposed
process flow for the trade identification is shown in Figure 5.2 below.
This data should be applied to the appropriate mathematical techniques to determine
whether the instruments are trading at a level that is mispriced relative to the
underlying instrument or relative to a statistical technique that is being applied to
predict its value. Once the trade opportunity has been identified, the system
processes will be determined by the nature of the arbitrage opportunity.
Where the trade opportunity is of a pure arbitrage form, the system will determine
what the associated cost of processing the trade will be. This information is
embedded in the systems table and therefore when this information is applied to the
arbitrage type and the actual prices and volumes, the system will be in a position to
determine whether the current volumes available on the bid or offer side of the trade
can be traded in a profitable manner. The system can then execute the trade if the
trade does not require securities lending transactions.
Page 213
MANAGING PURE AND STATISTICAL EQUITY ARBITRAGE OPPORTUNITIES WITHIN THE SOUTH AFRICAN ENVIRONMENT- CRONJE, P (2004)
198
Figure 5.2 Proposed arbitrage trade process
Where the trades do require securities lending transactions, the system will firstly
reference the static data table to determine whether the shares are available and at
what rate. If the shares are available, the trade will be executed by the system with
no human intervention.
Page 214
MANAGING PURE AND STATISTICAL EQUITY ARBITRAGE OPPORTUNITIES WITHIN THE SOUTH AFRICAN ENVIRONMENT- CRONJE, P (2004)
199
If the shares are not available, the traders will be notified of this requirement via a
message box, and the traders will need to source the underlying shares prior to the
trade being concluded by the system. Alternatively they will need to rely on a
combination of derivatives to create a synthetic position that is the equivalent to the
required underlying position. Assuming that the shares are available, the trade
execution will occur when the securities lending rate and the available number of
shares that may be borrowed is entered into the system by way of the message box
that will present itself. At this time the system will use this data to again calculate the
profitability, given the available volumes and costs before entering into the trade.
Once the trade has been executed the trader will be notified that the trades have
been concluded. Where there are not enough shares, the trader will decline the trade
with the relevant reason for declining the trade being provided by the trader.
Whatever the outcome, the system should store the fact that a trade was done or that
the opportunity presented itself but could not be executed as a result of the reason
provided by the trader through a drop down list of reasons for declining a trade.
If the trade is a statistical arbitrage trade, the system will calculate the degree to
which the current pricing deviates from the normalised price and generate a message
to the trader requesting the trader to authorise the trade for execution. The model
used to generate the perceived opportunity along with the anticipated profitability
after transaction costs (given historical norms) should be displayed as further
information for the trader. The trader can then approve the trade and the system will
execute the trade at the required price and in the required volume. The increased
degree of automation adopted in this process is aimed at reducing deal capture
problems that may result in the incorrect instrument being purchased, or the incorrect
volumes being entered or the trade may be loaded as a buy instead of a sell, to
name a few of the more frequent error types that may be encountered.
The system should also create messages informing the trader when stop loss levels
are reached. As discussed below in section 5.2.5 relating to stop losses, the system
will automatically create these stop loss trades but will request the trader to authorise
the trades prior to executing the transaction. In a similar manner, where the pure
arbitrage trades have converged prior to maturity the system should request the
trader to close out the trades, as this will result in a saving on the capital cost and
hence this improves the overall profitability of the strategy.
Page 215
MANAGING PURE AND STATISTICAL EQUITY ARBITRAGE OPPORTUNITIES WITHIN THE SOUTH AFRICAN ENVIRONMENT- CRONJE, P (2004)
200
In all the above cases where the system has identified or executed a trade or where
a trade has been declined, this information should be written to the DB, such that it
may be used as management information at a later point in time. The method
adopted is to provide the traders with a list of options in a drop down list, such that
they can choose the appropriate reason from the list.
In the event that business has gained enough confidence in the application’s ability to
consistently perform a particular arbitrage type in the appropriate manner, the system
should cater for the option to let the application do all the trading for that arbitrage
type without human intervention of any kind. This implies that the scrip lending
availability will need to be loaded and maintained on the system so that the system
knows up to what levels the shares can be sold short and be covered by the
available scrip lending.
It is also recommended that the traders on the desk be specialists who understand
the underlying products well but who focus only on the arbitrage trading process as
their core function and speciality. This methodology will allow the traders to focus on
developing and enhancing existing processes to cater for new instrument types and
new methods to enhance profitability.
5.2.5 STOP LOSS PROCESS
Chapter 4 of this research showed that when trading the statistical arbitrage
strategies, a large number of trades could be executed. These volumes will result in
a situation whereby the traders will not be in a position to manage the stop loss on
each trade and therefore the system must be able to provide this functionality.
The system will need to monitor each of the trades on an ongoing basis to determine
whether there have been any breaches of the stop loss levels. Where these events
occur the system should notify the trader via a message box, that will request the
trader to authorise the close-out of the position that has breached the stop loss level.
Once the trader authorises the close-out, the system will automatically generate the
entries required on the relevant trading system against the appropriate side of the bid
or offer. The system must write the trade details to the database for the position and
record purposes. Where the trader does not wish to close out the trade, a reason
Page 216
MANAGING PURE AND STATISTICAL EQUITY ARBITRAGE OPPORTUNITIES WITHIN THE SOUTH AFRICAN ENVIRONMENT- CRONJE, P (2004)
201
should be provided and this will be stored in the database along with the fact that the
system recommended a close-out of the position.
The actual stop loss levels and the stop loss mechanism applied will be set up in the
static data table. The levels must be specified for each arbitrage type, and should be
defined as either the trade price stop loss or a percentage change stop loss level.
5.2.6 MARKET RISK MEASUREMENT AND LIMITS
The systems process should be able to monitor and control the adherence to the
market risk limits that are put in place via the static data tables described above. This
implies that the required reports should be created that allows for the analysis of the
market risk positions at a user and desk level.
These reports are for the use of the traders and market risk managers, as they
should facilitate the management of the risks that are pending on the books on a
daily basis. Figure 5.3 below provides a flow chart representation of the “Risk
Process” proposed by this research.
The reports should allow the market risk function to identify and monitor the
exposures of the arbitrage desk separately to those of the general trading desk and
this will assist in meeting the traders’ requirement expressed in the empirical
research leg. In section 4.4.6.3 the traders expressed a view that the arbitrage desk
should have separate limits due to the fact that the arbitrage trades have different
risk profiles to those of non-arbitrage trades. The report outputs should present all
the Greeks and the current limit exposure relative to the authorised exposure to
these limits. They should also express the positions in terms of a value at risk and
the general limit utilisation that is present at the time of the report.
Where the limit utilisation is 10% from capacity, the system should notify the traders
of the fact that the limits are nearing depletion and the traders would in turn request
the market risk function to review the limits. If it is decided that the limits will not be
adjusted and the limit is breached, all further trades identified should be declined by
the system, and the fact that the opportunity did present itself should be recorded by
the system, with the reason for not trading being that the limits had been utilised.
Page 217
MANAGING PURE AND STATISTICAL EQUITY ARBITRAGE OPPORTUNITIES WITHIN THE SOUTH AFRICAN ENVIRONMENT- CRONJE, P (2004)
202
Figure 5.3 Proposed risk process
Page 218
MANAGING PURE AND STATISTICAL EQUITY ARBITRAGE OPPORTUNITIES WITHIN THE SOUTH AFRICAN ENVIRONMENT- CRONJE, P (2004)
203
The system should allow for the calculation of risk buckets such as those generated
through a partial differential hedge so that the relevant risk areas can be identified
and managed accordingly. As the proposed products may include derivatives it is
recommended that all components of the Greeks be implemented i.e. gamma, vega,
delta, rho and theta as this will facilitate the appropriate risk management to take
place at a trading level.
5.2.7 TRANSACTION COSTS
The process aims to allow for more effective management of the costs that affect the
trading profitability. This is achieved by setting the benchmark costs that are
associated with the various trade types on the various exchanges in the static data
component of the system. These costs are loaded into the static data as part of the
initial setup, and any changes to these costs must be updated in the system to
ensure that the system utilises the most appropriate data in its calculation of the
potential profitability of the trades that are recommended.
The costs that will be required in most of the cases include the transaction cost for
the JSE, SAFEX, and any other offshore exchanges that may be used, the UST rate
and the securities lending cost (which will be estimated cost for that company where
no actual data is available). The JSE costs would include the STRATE component
that will form part of the cost of trading on the JSE.
When the trades are at a point where they are going to be transacted and committed
to the database, the actual securities lending costs will be required prior to the trade
being executed. This information will be provided by the trader as the traders will be
required to input the costs into the message box provided by the system, prior to deal
execution by the system.
A breakdown of trading costs, as recorded by the system should be generated, so
that other business functions can compare the actual costs versus the projected cost
that would be incurred. In this manner a control method can be created to ensure that
the costs entered in the system are set up correctly.
This information in consolidated form will also assist is negotiating better rates in
some cases as the high transaction volumes may assist in the negotiating process.
Page 219
MANAGING PURE AND STATISTICAL EQUITY ARBITRAGE OPPORTUNITIES WITHIN THE SOUTH AFRICAN ENVIRONMENT- CRONJE, P (2004)
204
Further benefits of this information are that the actual benefits of using derivatives
and synthetics can be encouraged with the view to reducing transaction costs.
5.2.8 PROFITABILITY
Figure 5.4 shows the profit control process proposed by this research. It proposes
that prior to trade commencing, the products that will be traded should be discussed
with the appropriate back office (BO) and legal personnel in an effort to ensure that
they are able deal with the product and have the infrastructure required to cater for
the product from and accounting, regulatory, settlements and reconciliations
perspective. In a similar manner the legal overview will provide certainty that all the
appropriate legal documentation is in order and it facilitates adherence to regulations
that are in place. If either of these functions identifies additional cost implications
these should be identified at this stage of the product trading process and these can
then be allocated to the arbitrage area.
The process suggests monthly reviews of the performance of the traders and the
arbitrage books relative to the potential performance of the system. In this manner
the process setup in the system can be reviewed and where traders are not
performing relative to their potential performance. This issue can be addressed either
through additional training or other performance enhancement measures used by the
institution.
The process should also highlight matters pertaining to risk limits because when
these limits are breached it could result in a reduction in trading relative to that
suggested by the system. Therefore there should be a constant focus on the limits
utilisation, the adherence to these limits and the company’s risk appetite for arbitrage
trades.
A further suggestion is that there should be frequent reviews of the costs incurred
relative to those generated by the system. The benefit of this is based on the fact that
this process will assist in identifying transaction costs that have been incorrectly
loaded in the static data. This process also helps to identify costs that are not being
accounted for and that should be built into the system for more accurate outputs.
Page 220
MANAGING PURE AND STATISTICAL EQUITY ARBITRAGE OPPORTUNITIES WITHIN THE SOUTH AFRICAN ENVIRONMENT- CRONJE, P (2004)
205
Figure 5.4 Proposed profit control process
Page 221
MANAGING PURE AND STATISTICAL EQUITY ARBITRAGE OPPORTUNITIES WITHIN THE SOUTH AFRICAN ENVIRONMENT- CRONJE, P (2004)
206
The final stage of the profitability and performance review process is the comparison
of the actual trading results against potential trading results as recorded by the
system. Where the IRR is not met, the information provided by the system can be
used to isolate the underlying reasons at each trading strategy level. These can then
be used to determine whether the specific trading strategies are providing the
required level of return, and where this is not the case, a decision can be made as to
whether the institution wishes to continue trading that specific strategy.
5.2.9 PERFORMANCE AGAINST REAL BENCHMARKS
The above process described a method that would allow management to review the
actual performance of a trader and/or on a desk over a period of time relative to the
potential performance of the trader and for the desk. This can be achieved by
obtaining from the database all the proposed trades and their proposed close-out
levels as they were presented to the trader.
In this manner the performance can be managed not only against the budget, but the
performance can also be measured against all proposed trades that were defined in
the system based on implemented strategies.
This implies that where traders have performed better than the system that the
underlying reasons for this performance can be analysed such that the system can
be modified to improve the results. Where the trader has not performed as well as
the system suggests he should have, the reason for this can be analysed and used
to improve the trader’s performance where possible. This implies that the system will
facilitate learning both in the logic applied in the application and for the traders that
use the system. Where the system has been developed to a level where it continually
performs better than the traders, the business should consider allowing the system to
automatically control that type of arbitrage trading.
5.2.10 CONCLUSION REGARDING THE TRADE, RISK AND PROFIT PROCESSES
The process described in this chapter covers some of the key requirements that were
identified in the empirical research. These include improved trade identification
processes, improved market risk processes, separate market risk treatment for
arbitrage trading, and the ability to determine profitability at a trade and trade group
level when required. The method described also has the ability to be transferable to
Page 222
MANAGING PURE AND STATISTICAL EQUITY ARBITRAGE OPPORTUNITIES WITHIN THE SOUTH AFRICAN ENVIRONMENT- CRONJE, P (2004)
207
different business types that trade equity arbitrage, be they banks, stockbrokers or
investment managers.
In performing these functions the processes used should remain flexible yet robust,
in order to cater for new products and trading strategies that will be added to the
system. The process should also be viewed as modular in nature as each of the
respective functions will rely on the data in the data base, but will apply a separate
set of reporting logic in analysing the information at hand.
In summary, the method discussed will allow greater automation. The approach also
acts as a catalyst for the improved management of the entire arbitrage trading
process, which would include profitability, risk management and human resources
management. It also addresses the requirements expressed by the traders in the
empirical research in that it caters for improved identification, risk management, profit
enhancement and trade monitoring. It also simplifies the process in that the trade
information is stored dynamically and the traders are not required to perform
continual analysis processes to identify trade opportunities. The traders will therefore
be able to work on developing and implementing new arbitrage strategies.
The automated process described is easily extendable to other business areas, such
as agricultural, resource, interest rates and currencies. While the focus of this
research has been on equity arbitrage, the statistical techniques do not differ in terms
of identification of relative value trades. The complexity in extending the concepts to
other instrument types lies more in the setup of the instruments and underlying
products than the statistical processes. Where these extensions are implemented,
the primary factors to consider will be the pricing and the dependent and independent
variables. When these are defined, the arbitrage concept can run in a similar manner
to that discussed for equities.
5.3 A PROPOSED STATISTICAL ARBITRAGE IDENTIFICATION METHOD
Pure arbitrage processes are clearly defined and well established, but statistical
arbitrage processes, although well understood, consists of more complex
methodologies. Therefore the ensuing section will focus on a multiple regression
methodology, which has proved profitable in the South African context and which can
be used as a basis for statistical arbitrage identification and trading.
Page 223
MANAGING PURE AND STATISTICAL EQUITY ARBITRAGE OPPORTUNITIES WITHIN THE SOUTH AFRICAN ENVIRONMENT- CRONJE, P (2004)
208
In defining a multiple regression trading method the first criteria that is required is that
the independent variables should contribute to the dependent variable in a significant
manner. Therefore a high correlation, or R2, is required between the dependant and
independent variables. Furthermore, the results of the regression should be
statistically significant, which means that p values should be below 0.05 at a 95%
level.
To this end the following were used as independent variables to predict the
movements of the dependent variable, being the ALSI Top 40 share index:
• X1 represents the South African Rand.
• X2 represents the FTMIGMI Index, which is the London FTSI mining Index priced
in US Dollars.
• X3 represents the JPLAT index which is the South African Platinum index.
The daily last trade price of each of these indexes was used in the multiple
regression analysis after adjusting the price data for public holidays and other non-
trading days. The period under review to demonstrate the success of this
methodology is January 2000 up to and including December 2003 and includes 983
observations of the respective indexes.
The method applied was to calculate the multiple regression coefficients using the
method described by Shao (1976: 728-733) on a rolling 30-day basis and then to
apply the regression to the next business day, which falls out of the sample. This
process allowed the creation of a theoretical price for the ALSI Top 40, given the
regression coefficients. The actual ALSI Top 40 price is then subtracted from the
theoretical price to give the difference between the two values. This difference is then
divided by the rolling standard deviation of the ALSI Top 40 share price over the
same 30-day period, such that a standardised ratio of the differences is created.
These “ratios” were used to identify instances where the price differentials were
significant. The assumption was made that any results above 1 or below -1 would be
significant. The final results were classified into the following groups: between 1 and
1.5, between 1.5 and 2, between 2 and 2.5 and above 2.5. In a similar manner all
values on the negative side were reported. Where any of these ratio levels were
breached, a trade resulted and the position was held for the day of the trade and the
Page 224
MANAGING PURE AND STATISTICAL EQUITY ARBITRAGE OPPORTUNITIES WITHIN THE SOUTH AFRICAN ENVIRONMENT- CRONJE, P (2004)
209
day thereafter, following which the trade was closed out as the index should have
normalised by that time.
Where the result, referred to above, was is positive, it implied that the current ALSI
Top 40 price was too high and the ALSI Top 40 index should be sold and vice versa.
Where a buy or sell trigger was reached, the research assumed for simplicity that the
ALSI Top 40 index could be bought directly as an instrument. The assumption
allowed for the instrument to act as a proxy for one of the futures contracts on the
ALSI Top 40, which could be purchased. While the price values may increase, this
method is based on the fact that the future is delta 100 and therefore any change in
the ALSI Top 40 share prices should translate into the same change in the future
given the risk free rate, dividend and time to maturity. Cleary where there is a price
mismatch between the index and the future, the index arbitrage process will be
initiated as discussed earlier. The profitability of the trading strategy before the
implementation of a stop loss is reflected in Table 5.1 below.
Table 5-1Profitability of the linear trading strategy to predict trading
opportunities in the ALSI Top 40 index when not applying a stop loss
The results show that the trading strategy showed positive returns of R468,977.00
(R4,689.77 x 10 x 10) over the period Jan 2000 to 2003, assuming that only 10
contracts are purchased/sold where a trading opportunity was identified. In total there
were 319 potential arbitrage trades that could have been entered into during this
period of which 183 or 57.37% were profitable.
>1 < 1,5 > 1,5 < 2 > 2 < 2,5 > 2,5 < -1 > -1,5 < -1,5 > -2 < -2 > -2,5 < -2,5 TotalsProfitability 4642.15 2269.69 883.55 37.44 5806.88 3240.55 915.88 1145.37 18941.51
Profitable Trades 59 26 11 5 45 20 11 6 183Non Profitable Trades 37 21 9 11 27 15 16 1 137
Profitable Trades % 61.458% 55.319% 55.000% 31.250% 62.500% 57.143% 40.741% 85.714% 57.188%
Page 225
MANAGING PURE AND STATISTICAL EQUITY ARBITRAGE OPPORTUNITIES WITHIN THE SOUTH AFRICAN ENVIRONMENT- CRONJE, P (2004)
210
Table 5-2 Profitability of the linear trading strategy where trading the ALSI Top
40 index and applying a stop loss of 0,5%
The strategy become more profitable when a stop loss strategy was applied, such
that the position was closed out if the index moved by 0.75% in the opposite direction
of the trade. The profitability with a stop loss then became R1,894,151 (R18,941.51 x
10 X10) over the period January 2000 to December 2003. The assumption remained
that only 10 contracts are bought each time that a trade opportunity presents itself.
The findings showed that costs did not have an affect on the number of transactions
that could be regarded as profitable as a futures trade cost roughly R3 and the total
transaction costs amounted to only about R 2,000. Figure 5.7 graphically illustrates
the number of profitable and non-profitable trades at each threshold.
Figure 5.5 The number of profitable and non profitable trades at each
threshold.
It has been shown throughout this research that there are numerous ways to identify
potential arbitrage situations using statistical methods. The methodology described in
this section could be applied as a first step and be improved through further research
0
1 0
2 0
3 0
4 0
5 0
6 0
7 0
<-2
.5
<-2
>
-2.5
<-1
.5
>-2
<-1
>
-1.5
>1
<1
.5
>1
.5 <
2
>2
<2
.5
>2
.5
D e v i a t i o n L e v e l
Nu
mb
er
of
Tra
de
s
Prof i tab le Trades
Non Pro f i tab leTrades
>1 < 1,5 >1,5 < 2 >2 < 2,5 > 2,5 < -1 > -1,5 < -1,5 > -2 < -2 > -2,5 < -2,5 TotalsProfitability 2016.72 916.4 181.99 -887.24 3005.42 -446.68 -1141.72 1044.88 4689.77
Profitable Trades 59 26 11 5 45 20 11 6 183Non Profitable Trades 37 21 9 10 27 15 16 1 137
Profitable Trades % 61.458% 55.319% 55.000% 33.333% 62.500% 57.143% 40.741% 85.714% 57.188%
Page 226
MANAGING PURE AND STATISTICAL EQUITY ARBITRAGE OPPORTUNITIES WITHIN THE SOUTH AFRICAN ENVIRONMENT- CRONJE, P (2004)
211
of appropriate methods of identifying relative value transactions in the equity
markets.
5.4 ARBITRAGE STRATEGY AND STRUCTURE- THE FUTURE OF THE BUSINESS
The proposals discussed thus far have been constructed after reviewing existing
literature as well as the business processes and applications used to manage the
equity arbitrage processes within the institutions that formed part of the sample.
These conclusions are aimed at providing a holistic framework for management that
has or wishes to enter the arbitrage-trading environment. The general business
processes defined in the research conclusions aim to provide an enhanced method
of managing the arbitrage processes in South Africa or anywhere where businesses
aim to setup these operations.
The proposals presuppose a business strategy of maximizing the overall shareholder
value of the institution in question, through the development of an arbitrage strategy
that provides a competitive advantage. In this regard Ward, 1998:3-4 refers to an
increase in shareholder value as “the overriding reason for the existence of most
commercial organizations.
This return must be assessed in the context of the particular risk associated with any
institution, as it is a fundamental economic principle that increased risk must be
compensated for with higher levels of financial returns.” Arbitrage trading as
described in the research is admittedly only a fragment of the overall business
strategy, but the institutions that indulge in this activity need to develop the capability
to consistently improve on their own arbitrage trading processes and thereby improve
profitability of the institution. Hence the emphasis of the research on providing a
process that is aimed at efficacy and which rejects the idea of the business process
stagnating at any level of the arbitrage business. Furthermore the proposed
processes are aimed at improving profitability, cost leadership structures, flexibility,
and the levels of decision accuracy.
Page 227
MANAGING PURE AND STATISTICAL EQUITY ARBITRAGE OPPORTUNITIES WITHIN THE SOUTH AFRICAN ENVIRONMENT- CRONJE, P (2004)
212
5.5 SUMMARY
In this chapter a process that may be employed to improve and automate the equity
arbitrage trading process was discussed. While the view is not to remove the human
component in its entirety through the automation described, there is a focus on
ensuring that the number of trade types is increased and that their profitability is
enhanced while also allowing the institutions to trade in the high volume trading
strategies.
While the empirical and time series research was used as the inputs to the creation
of the model and process described in this chapter, the view that the arbitrage
processes can be improved through the implementation of a number of systems
components may also be propagated as the this would imply that the business is
starting to move through the evolutionary scale which the research shows to be the
precursor to high volume arbitrage trading.
Of further importance in light of the findings, is that there are too many arbitrage
types for the average of two traders to deal with. This implies that opportunities may
be missed either because they are not identified or because the time it takes the
trader to identify and execute the trade is greater than the trader’s perceived benefit.
Due to the low relative profitability of some of the statistical arbitrage trades,
automation is the only practical manner to facilitate the trading. All facets of the
research therefore suggest that this process of trade identification and execution
must be automated for the maximisation of profitability in the equity arbitrage
environment.
The other component of the proposed method is that the market risk function for the
arbitrage process should still roll up into the greater market risk figures and VaR
limits, but the arbitrage limits for pure and statistical trades should be stripped away
into two separate trading limits that are separately identifiable from the normal trading
limits as the arbitrage trades have different risk profiles to the proprietary and market
making trading books.
Page 228
MANAGING PURE AND STATISTICAL EQUITY ARBITRAGE OPPORTUNITIES WITHIN THE SOUTH AFRICAN ENVIRONMENT- CRONJE, P (2004)
213
CHAPTER 6
6. SUMMARY, CONCLUSIONS ANDRECOMMENDATIONS
6.1 INTRODUCTION
The research undertaken in this study focused on establishing the manner and extent
to which banks, asset managers, insurance companies and stockbrokers capitalise
on mispricing within the equities and equity derivative markets. The research
investigated 80 institutions from these groups by applying a stratified quota sample.
Those institutions forming part of the sample were asked to complete a research
questionnaire which posed questions around their current trading strategies, their
operational processes and their risk processes.
The second leg of the research was aimed at gathering the historic share prices and
the prices of derivative instruments that relate to the underlying instruments, be they
futures or options. From this information the arbitrage opportunities that could be
identified using different methods were explored. The general research areas
included pure and statistical arbitrage.
The findings of the empirical research gathered through the questionnaire was
discussed in Chapter 4 and the relative profitability was also explored within the
context of each arbitrage type and its associated trading costs. Practical
considerations such as stop loss methods and market risk were also covered in this
chapter.
Chapter 5 combined the information obtained from a comprehensive literature review
as well as the empirical research to provide proposals to establish and run effective
arbitrage operations. Chapter 5 also provided a statistical arbitrage identification
process, which had been adapted for the South African market and which was aimed
at predicting moves in the ALSI Top 40 index. While the intention and design of the
model was to predict the moves in the ALSI Top 40, the logic is simple enough and
can be easily extended to the prediction of other shares and indexes.
Page 229
MANAGING PURE AND STATISTICAL EQUITY ARBITRAGE OPPORTUNITIES WITHIN THE SOUTH AFRICAN ENVIRONMENT- CRONJE, P (2004)
214
6.2 SUMMARY OF FINDINGS
The most important findings of this study are summarised below.
6.2.1 FINDINGS PERTAINING TO THE RESEARCH QUESTIONNAIRE
The results of the empirical research conducted amongst banks, stock brokers,
investment managers and insurance companies showed that the equity arbitrage
trading process was not widely applied in the market. In total 27 institutions of the 80
included in the sample confirmed that they do trade equity and equity derivative
arbitrage within the South African market. The primary reasons cited by respondents
for not trading equity arbitrage are:
• These strategies do not form part of their core business.
• A high degree of outsourcing of the investment functions - mainly the insurance
companies.
• The asset managers generally operate the funds within specific client mandates,
which exclude the arbitrage process either through the fact that they are not
allowed to trade derivatives or because the investment managers that formed part
of the random sample are multi-managers who in turn also outsourced the
investment function to other investment managers.
As a result of the above, the institutions that do participate in the equity arbitrage
process can be narrowed down to the following broad categories:
• Banks: Both local and international banks were found to house equity arbitrage
trading within their treasury environments. Of the nine international banks
included in the sample, three were of the opinion that the information was
proprietary, while five did not trade equities. In total 11 of the 20 banks in the
sample traded equity arbitrage.
• Stock brokers: The responses received indicated that nine of the stockbrokers
included in the sample trade equity arbitrage. Only six of these completed the
questionnaire, while the remaining three felt that the information was of a
proprietary nature and therefore did not complete the questionnaire.
Page 230
MANAGING PURE AND STATISTICAL EQUITY ARBITRAGE OPPORTUNITIES WITHIN THE SOUTH AFRICAN ENVIRONMENT- CRONJE, P (2004)
215
• Investment managers: Only six of the investment managers included in the
sample trade equity arbitrage.
• Insurance companies: None of the insurance companies included in the sample
trade equity arbitrage, due to the fact that they all outsource their investment
function.
All the institutions that were included in the sample and that do trade equity arbitrage
did however not provide feedback on their operations as eight regarded the
information as proprietary in nature. Therefore only 19 provided details regarding
their arbitrage trading activities.
Chapter 4, section 4.4.1, showed that 14 of the respondents that participate in equity
and equity derivative arbitrage are involved in single stock futures and index
arbitrage, while the balance felt that this was not part of their core business and
therefore they are not involved in this activity. Only two of the 19 respondents who
trade equity arbitrage are involved in dual listed arbitrage, and those who do not
partake in this arbitrage type either do not have the legal ability or any interest in this
type of trading activity. Of the 19 respondents, eleven are involved in risk arbitrage.
Only eight of the 19 institutions trading arbitrage looked at statistical arbitrage
opportunities, with the primary reasons for not being involved in this arbitrage type
being that they do not have the systems or that this is not one of their core business
areas. Three of the 19 respondents show interest in volatility arbitrage as a trading
strategy. The primary reason for not getting involved in this type of trading is that it is
not part of their core business and the institutions have no systems for identification.
The methods used to identify arbitrage processes can according to 16 of the
respondents be improved. The general nature of the applications used to identify the
price mismatch is to build the pricing logic into a spreadsheet, which is linked to live
market data. The spreadsheet is then used to identify the trading opportunities, but
the traders are still required to manually deal and capture all the trades that they wish
to enter into. The research points out that this process is a weakness in terms of
profit maximisation, as there is no certainty that all profitable trades are effected.
The research also found that the general business structure that is applied by the
respondents is one that is centralised as the arbitrage desk is considered to be part
Page 231
MANAGING PURE AND STATISTICAL EQUITY ARBITRAGE OPPORTUNITIES WITHIN THE SOUTH AFRICAN ENVIRONMENT- CRONJE, P (2004)
216
of the equity and equity derivative desks within the treasury department. This they
felt, allowed the overall positions to be managed more effectively.
All respondents felt that the arbitrage strategies was profitable and this fact was
strengthened by the fact that in general they had been trading the strategies for an
average period of about three years. Of further interest is the fact that two of the
stock brokers who are not currently trading equity arbitrage are in the process of
setting up desks that would focus on capitalising on the pricing mismatches that are
present in the market.
The research also found that the respondents generally rate the cost drivers that
affect the profitability of their trades in a similar manner. While there are cost
variations between the arbitrage types, the respondents generally felt that the
transaction costs are the largest cost component in their trading, followed by
securities lending costs, then staff and then systems.
These costs become a strategic problem in practice as the different institutions reflect
varying cost structures in terms of their transaction costs, securities lending costs
and in a less direct way, their cost of capital. Clearly the ability to compete is affected
by this factor and the institutions need to drive these costs down where possible.
6.2.2 TIME SERIES FINDINGS
The time series analysis of arbitrage types in the South African market shows that all
of the arbitrage types discussed in this research are profitable after taking into
account transaction costs, taxes and securities lending costs. While the periods of
investigation differed between arbitrage types, the general time horizon of the study
spanned 3 to 4 years, with the exception of single stock futures where only two years’
data was available. In particular, the study made certain findings with regard to
futures arbitrage, index arbitrage, risk arbitrage, dual listed arbitrage and statistical
arbitrage, as is indicated in the ensuing sections.
6.2.2.1 FUTURES ARBITRAGE
The single stock futures analysis into the futures relating to the ALSI Top 40 shares
shows a general profitability per trade of R1,746, given the constraints applied to the
volumes that could be traded and there were about 1,155 trade opportunities
Page 232
MANAGING PURE AND STATISTICAL EQUITY ARBITRAGE OPPORTUNITIES WITHIN THE SOUTH AFRICAN ENVIRONMENT- CRONJE, P (2004)
217
identified by the research. Of these, 699 trades proved to be profitable after taking
into consideration the effects of transaction costs, securities lending costs and cost of
capital. This leaves a net profitability over the two-year period of about R1.22 million.
One of the factors that restricted the profitability as discussed in this research is the
fact that a strong focus was given to ensuring that the information used in the
research was of such a nature that both the futures trade and the underlying trade
were effected within 30 minutes of one another. In reality, the profitability of this
strategy may be greater due to the fact that execution could occur over a longer
period, as the mismatches are generally visible for a longer period according to the
empirical research results obtained from respondents who trade this type of
arbitrage.
The research showed that the SSF positions could be closed out prior to the contract
maturity in cases where the market prices have converged to the expected levels and
the profits have been realised. Where the trading strategy was applied in this
manner, a capital saving resulted due to the shorter duration of the trade and a
reduction in the securities lending costs and the funds used.
6.2.2.2 INDEX ARBITRAGE
The time series analysis and the findings pertaining to index arbitrage on the ALSI
Top 40 futures was positive. The research identified 1,737 profitable trade
opportunities over the four year period and these trades netted an average
profitability of about R6,500 per trade and a total profitability of about R11.28 million
after transaction costs. The transaction costs involved in this trading activity were
found to be extremely high as a result of the fact that where the physical shares were
to be purchased the traders would need to trade each of the shares in the index
twice, once to acquire the position and once to get rid of the position at the respective
institutions trading costs.
For the purposes of the research the average transaction cost of R60 was applied.
However, it should be noted that the research assumed that the required order would
be filled through one transaction, but in reality it may take a number of hits to fill the
order. In this case the cost may go up by the STRATE and JSE charges levied on
each trade.
Page 233
MANAGING PURE AND STATISTICAL EQUITY ARBITRAGE OPPORTUNITIES WITHIN THE SOUTH AFRICAN ENVIRONMENT- CRONJE, P (2004)
218
The research did not differentiate between brokers and banks or asset managers, but
assumed that all parties would incur the UST costs associated with the trades – in
reality, the brokers would not incur this cost. Securities lending costs applied in the
research was set to the average of the empirical research, which was indicated to be
1%.
6.2.2.3 RISK ARBITRAGE
The analysis of risk arbitrage proved that this is an extremely profitable trading
strategy and that the South African environment is no different to the international
environment, based on the reported research findings, in that the strategy provides
double digit returns on both a real and annualised return basis.
The method applied was to analyse the SENS data provided by the JSE and identify
companies that were in the process of being taken over. Shares in the company
being acquired were then purchased or sold depending on the premium or discount
at which the takeover transaction was taking place.
Corporate events that were excluded from the research included the take over of
private companies, as there was no share price data against which to track the
convergence to the premium or discount, and corporate events that involved offshore
companies were also excluded. The reason why the offshore leg was excluded was
due to differing legislation and the local exchange control factors, which inhibit the
majority of the companies in the South African environment from partaking in these
events.
Therefore only local events pertaining to listed companies were analysed, and the
findings presented relating to these corporate events. This trading strategy provided
profits after costs of about R3 million, given the trading costs and trade volume
assumptions that were made.
6.2.2.4 DUAL LISTED ARBITRAGE
Dual listed arbitrage was also found to be a profitable strategy, although there are a
limited number of institutions with the legal ability to trade these strategies given the
interference by the government through exchange control.
Page 234
MANAGING PURE AND STATISTICAL EQUITY ARBITRAGE OPPORTUNITIES WITHIN THE SOUTH AFRICAN ENVIRONMENT- CRONJE, P (2004)
219
The view held by the research was that in the event that the exchange control factor
was removed the market would become significantly more efficient as a result of the
local and international markets’ ability to act on the price mismatches in both the
underlying markets and the derivative markets of South Africa and the markets where
the alternate listing occurs. The results of the analysis showed there were about
2400 trade opportunities, and these trades generated about R13.7 million after costs.
6.2.2.5 STATISTICAL ARBITRAGE
Under the review of statistical arbitrage a couple of identification strategies were
explored. The first was the method described by Reverre (2001), which is basically
an extension of pairs trading, as it relies on the fact that the shares involved are
correlated in a significant manner – even if they are not in the same industry or
related/sister companies.
The findings around the Reverre (2001) method were that the strategy is successful
before transaction costs are factored into the equation. There are a large percentage
of trades, that lose money, and the actual costs involved in trading this strategy were
large enough to remove all of the profits from the trades that did make money. This is
due in part to the assumptions made in terms of the number of shares that were
traded, and as the volume traded increases the effect of transaction costs diminishes
up to a point.
As with many trading strategies that are put forward, the results look impressive
when viewed in isolation; however, the aim of the research was to incorporate an
element of reality in terms of the practical costs that need to be covered when trading
the strategies, and only where these practicalities are catered for and the strategy
still performs well is it worthwhile to pursue the strategy. The problems surrounding
this strategy become obvious when comparing the net profit before costs which was
about R5.9 million against the R6.6 million UST costs that are incurred in the trading.
When factoring in other costs the total loss for this strategy was about R1.149 million.
Therefore the strategy can only find application with institutions that are UST exempt.
The Meissner et al (2002) method proved to be more profitable and reliable in that its
degree of success in predicting the out-of-sample moves of the ALSI Top 40 index. In
this analysis the ALSI Top 40 was set to be the lagging market relative to the
European and Asian markets.
Page 235
MANAGING PURE AND STATISTICAL EQUITY ARBITRAGE OPPORTUNITIES WITHIN THE SOUTH AFRICAN ENVIRONMENT- CRONJE, P (2004)
220
The findings showed that the Asian market was the best predictor of the ALSI Top 40
and that where the Asian market moved by a significant percentage on any given
day, the ALSI Top 40 was very likely to move in the same direction the following day.
The results of the research for the four-year period over which the analysis was done
can be summarised as follows:
• In all cases where the Asian weighted basket moved up by more than 3% the
ALSI Top 40 moved in same direction by roughly 1.947%. In cases where the
Asian weighted basket of indexes moved up by between 2% and 2.5% or 2.5 and
3%, the ALSI Top 40 moved up by 1.405% and 1.969% respectively. This trading
strategy netted 544 trades of which 65% were profitable. The net profit generated
by this strategy was about R2.2 million when trading ten contracts per trade
signal.
• Where the move in the Asian weighted index was downward the relationships
were even more impressive and for the relative moves of 2% and 2.5%, 2.5% and
3% and above 3%, the respective instances where the ALSI Top 40 moved in the
same direction were 86.66%, 100% and 100% with the respective percentage
moves being –1.386%, -1.140% and –8.593%. This last figure was driven by an
outlier position that resulted in this large percentage increase.
6.3 CONCLUSIONS
The research showed that of the 80 institutions that were included in the sample, only
27 of the respondents traded any form of equity and equity derivative arbitrage. Of
these institutions that were involved in these arbitrage forms, it is obvious that certain
arbitrage types are traded more actively than others. Of the respondents who
completed the questionnaire 14 were involved in pure arbitrage trading while only
eleven institutions were involved in risk arbitrage and only eight were involved in
statistical arbitrage trading. Three were involved in volatility arbitrage and only two
traded dual listed arbitrage. It is evident that arbitrage trading is limited within the
South African market.
Chapter 5 provided a blueprint that can be used to establish an arbitrage operation,
and also suggests some enhancements which aim to increase profits through the
creation of a process that relies less on human intervention and which implies that
Page 236
MANAGING PURE AND STATISTICAL EQUITY ARBITRAGE OPPORTUNITIES WITHIN THE SOUTH AFRICAN ENVIRONMENT- CRONJE, P (2004)
221
systems can in reality perform many of the routine processes surrounding the pure
arbitrage processes such as SSF, index arbitrage and dual listed arbitrage. These
systems can also be extended to various statistical arbitrage types that may not
receive a high degree of attention simply because they generate a relatively low
profitability on a per trade basis. The idea is that the system can perform the basic
analysis and execute the trades without human intervention. Even in the case of
arbitrage types where the profitability is marginal.
A key component to this automation should be the ability of the process to introduce
stop loss limits as all statistical trading strategies do have a down side which needs
to be actively managed for profitability to be enhanced. The stop loss limits should be
implemented at a trade level, and monitored through an automated process to
ensure that where these stop loss limits are breached that the trades are closed out
within a minimum period of time.
The proposed enhancements to the arbitrage trading process also imply that where
the system’s calculation of proposed directional trades is overridden by the traders,
these must be recorded such that the system’s theoretical performance over time can
be compared to the performance of the trader. This then implies that additional
measures have been created to measure the performance of the traders, as the
general approach that is presented is that if the traders attained their budgets then
they performed adequately and hence they will be remunerated on that basis. This
additional measure will allow for an improved manner in which to control the arbitrage
trading environment, while facilitating a learning process whereby traders can be
shown where their views were incorrect, relative to that predicted by the system. An
added advantage would be situations where the trader follows a different
methodology to that of the system, and consistently attains enhanced results relative
to the system. In such circumstances the system should be updated to reflect the
improved process – assuming that due diligence has been performed to ensure that
the results were not of a short-term nature.
This process not only addresses the common problem highlighted in the empirical
findings regarding the requirement for improved equity arbitrage identification and
execution, but it also aims to improve decision making by allowing the measurement
of the expected profitability of each deal in a manner which considers all the cost
drivers at the trading limit levels specified by the business.
Page 237
MANAGING PURE AND STATISTICAL EQUITY ARBITRAGE OPPORTUNITIES WITHIN THE SOUTH AFRICAN ENVIRONMENT- CRONJE, P (2004)
222
Clearly, the solutions offered in this research are not an off-the-shelf products and
will require the South African and international markets to improve their systems
capabilities within the context of their own infrastructure. In terms of providing a
meaningful management solution there are no simple or manual processes that will
truly provide the answers that are required to effectively measure and control the
arbitrage trading processes. A further consideration is that the results should be
reviewed periodically to determine the relevance of the statistical and mathematical
models that are applied in the system and which are used to identify the trading
opportunities. Technological systems capabilities are therefore important in applying
the proposed processes.
Chapter 5 also provides a statistical technique similar to that of Meissner et al (2002)
and Lo & MacKinley (1995) that can be applied to predict moves in the ALSI Top 40
using three resource-based indexes. While this method provides profitable results, it
should again be stressed that applying stop loss limits enhances these results. While
the focus of this research was on equity derivative arbitrage, the methodology
applied in Chapter 5 is transferable to other areas of arbitrage – given that the
appropriate mathematical models are applied to cater for the pricing requirements.
The above arbitrage management concept may be extended to the prediction of
index movements by applying the appropriate in-sample independent variables to
predict the out-of-sample dependent variable. This process provides an illustrative
example of the application of statistical processes beyond the information provided in
the literature review section covered in Chapter 2.
6.4 RECOMMENDATIONS FOR FURTHER RESEARCH
Although the research was undertaken within the South African environment,
international published methodologies were applied. For this reason the findings
should be easily transferable to other markets. Furthermore, the application of the
mathematical pricing formula is fairly homogenous and only subtle adjustments for
settlement methods, rate fixes and day count conventions should be required in
different countries/markets.
The next level of analysis in the statistical and volatility arbitrage areas could pertain
to the creation of predictors from predictors in that each arbitrage type is
conventionally viewed in an independent manner which looks for a specific factor or
Page 238
MANAGING PURE AND STATISTICAL EQUITY ARBITRAGE OPPORTUNITIES WITHIN THE SOUTH AFRICAN ENVIRONMENT- CRONJE, P (2004)
223
leading indicator or a deviation from a mean. No research or model has to date been
created which attempts to bring all these factors together in one cohesive unit that
creates probabilities from a host of other silos of probabilities. It is this consolidated
view of arbitrage that will be the next level of arbitrage theory and it will rely on the
basic building blocks that this research has discussed.
Dual listed arbitrage was covered in this research, and found to be extremely
profitable. The logical extension of this research should be into an analysis of other
exchanges that trade South African shares and also into the area of American
Depository Receipts (ADRs) and Global Depository Receipts (GDRs), as these
instruments should show results that are similar in nature to the findings of this
research. Further analysis that may be considered and that could prove valuable,
would relate to the volatility arbitrage between markets in that where dual listed
instruments have options traded in both markets, there should be cases where the
implied volatility of the same shares differ between countries. This volatility difference
may create mispricing between the markets and participants that have the ability to
trade both markets may be in a position to buy in the cheap market and sell in the
expensive market, while hedging the currency risk. This will create another form of
dual listed arbitrage, that may be researched.
The topic of convertible arbitrage has received a fair amount of focus in the
international markets. Published research has not been done in this area in South
Africa and should therefore be commenced to provide information regarding its
occurrence and the extent to which institutions trade this type of arbitrage.
The final suggestion in terms of further research would be the arbitrage opportunities
that present themselves between the credit default swap (CDS) markets and the
equity default swap (EDS) markets. This research will be cutting edge (for now) in
that the EDS market is still in its infancy within the global market place and empirical
data within the South African environment could be limited to a couple of institutions
in the South African market. This type of arbitrage is primarily correlation related and
relies on the fact that the equity default spreads will increase in a similar manner to
those of the credit spreads at times when the company is in distress.
Page 239
MANAGING PURE AND STATISTICAL EQUITY ARBITRAGE OPPORTUNITIES WITHIN THE SOUTH AFRICAN ENVIRONMENT- CRONJE, P (2004)
224
BIBLIOGRAPHY
Ackert L F. & Tian Y S. 1999. “Efficiency in the Index Options Markets and
Trading in Stock Baskets”. Working Paper Series (Federal Reserve Banks of
Atlanta), June 99, Vol. 99 Issue 5, 36.
Ammann M. & Herriger S. 2002. AIMR. pp42-55.
Baker H. 1992. “Why U.S. Companies List on London, Frankfurt and Tokyo Stock
Exchanges” American University, Washington, D.C. 2.
http://fisher.osu.edu/fin/faculty/karolyi/papers/FIIFinal0298.pdf. Accessed 10 June
04.
Baker M. & Savasglo S. 2002. “Limited Arbitrage in Mergers and Acquisitions”,
Journal of Financial Economics. pp1-44.
www.courses.fas.harvard.edu/~ec2728/Papers/Baker_Savasoglu_2002.pdf.
Accessed 13 January 2004.
Basak S.& Shapiro A. 2001. “Value-at-Risk Based Risk Management: Optimal
Policies and Asset Prices”, Review of Financial Studies. Issue 14, p318-378
Bhardway R K. & Brooks L D. 1999 “Future Evidence on Dividend Yields and the
Ex-dividend Day / Stock Price Effect” Journal of Financial Research, Issue 22,
Winter, p503-514.
Black F. & Scholes M. 1973. “The Pricing of Options and Corporate Liabilities”
Journal of Political Economy. 637-659.
Bloomberg Data Services. 2003. December, (accessed January – December
2003).
Board J. & Sutcliffe C. 1996. “The dual listing of stock index futures: Arbitrage,
spread arbitrage, and currency risk”. .Journal of Futures Markets . February, 16
(1): 29
www.moneymax.co.za/help/MMX_school/journals/journal57_part5.pdf. Accessed
5 February 2004.
Page 240
MANAGING PURE AND STATISTICAL EQUITY ARBITRAGE OPPORTUNITIES WITHIN THE SOUTH AFRICAN ENVIRONMENT- CRONJE, P (2004)
225
Brigham E F. & Gapenski L. C. 1997. Financial Management. Theory and
Practice. Eighth Edition. Ohio. United States of America. Dryden Press.
Britten-Jones M. & Neuberger A. 1996. “Arbitrage pricing with incomplete
markets”. Applied Mathematical Finance, Issue 3, p 347-363.
Business Week 11/13/89 “Index arbitrage is not the problem.” Issue 3133, p186,
1/3p.
Cannina L. Roni R. M. Richard T & Kent W. 1998. “Caveat Compounder: A
warning about using daily CRSP equal weighted index to compute long-run
excess returns ”. The Journal of Finance Issue 53. p403-416.
Chance, D M. 1987. “Parity Tests of Index Options”. Advances in Futures and
Options Research Issue 2 p47-64.
Chew L. 1996. “Managing Derivative Risks. The Use and Abuse of Leverage”.
England. John Wiley and Sons.
Chew S. 2003. “Short Selling and SBL: Myth and Reality”. OCBC Securities
Private Ltd. p 8-11.
Chorafas D N. 1995. “Managing Derivatives Risk. Establishing Internal Systems
and Controls”. United States of America: Irwin Professional Publishing.
Chung Y P. 1991. “A Transactions Data Test of Stock Index Futures Market
Efficiency and Index Arbitrage Profitability”. Journal of Finance Vol XLVI No 5.
Cornelli F. & Li LD., 2000, “Risk Arbitrage in Takeovers”
http://ideas.repec.org/p/fth/pennfi/17-98.html. Accessed 10 January 04.
Cuoco D., He H. & Issaenko S. 2001. “Optimal Dynamic Trading Strategies with
Risk Limits”, 1-26. http://icf.som.yale.edu/pdf/cuoco.pdf . Accessed 5 January 04.
Dickey DA. & Fuller WA. 1979. “Distribution of the estimators for autoregressive
time series with a unit root”. Journal of the American Statistical Association Issue
74. 427-431.
Page 241
MANAGING PURE AND STATISTICAL EQUITY ARBITRAGE OPPORTUNITIES WITHIN THE SOUTH AFRICAN ENVIRONMENT- CRONJE, P (2004)
226
Domowitz I. Glen JD. & Madhavan A. 1998. “International Cross-listing and Order
Flow Migration: Evidence from an Emerging Market.” Journal of Finance. Issue
53: 2001-2027.
Ervine J. & Rudd A. 1985 “Index Options: The Early Evidence”. Journal of
Finance Issue 40, 743-756.
Fearson & Harvey.1993.”The risk and Predictability of International Equity
Returns”. Review of Financial Studies Issue 6, 527-566.
Fortune P, 1996. “Anomalies in option pricing: The Black Scholes model
revisited”. New England Economic Review Mar Apr. p17, 24p.
Froot K. & Perold A. 1997. “Global Equity Markets: The case of Royal Dutch and
Shell”. Harvard Business School, Case 9-296-077, July
Galbraith J R. 1995. “Designing Organisations: an executive briefing on strategy,
structure and process”. United States. Jossey- Bass.
Ganley J & Trebeschi G. [2000?] “Equity Markets under Stress: Tests for
Arbitrage Anomalies in the Stock-futures Basis”. Bank of England Abstract.
http://www.imes.boj.or.jp/cbrc/cbrc-19.pdf p435-461. Accessed on 15 July 04.
Garbade K. & Silber W. 1983. “Price movements and price discovery in futures
and cash markets”. Review of Economics and Statistics. p289-297.
http://216.239.37.104/search?q=cache:5cEHXHP7Em4J:staff.mysmu.edu/yktse/J
EF.pdf+garbade+and+silber+1983&hl=en&ie=UTF-8. Accessed June 03.
Gomes A. 2001. “Takeovers, Freezeouts, and Risk Arbitrage”. University of
Pennsylvania. p1-48.
Hanousek J. & Nemecek L. 2002. “Mispricing and lasting arbitrage between
parallel markets in the Czech Republic”, The European Journal of Finance, Issue
8, p49-69.
Page 242
MANAGING PURE AND STATISTICAL EQUITY ARBITRAGE OPPORTUNITIES WITHIN THE SOUTH AFRICAN ENVIRONMENT- CRONJE, P (2004)
227
Harris FH., McInish, T H. Shoesmith GL. and Wood R A. 1995. “Cointegration,
error Correction and Price discovery on Informationally-linked Securities
Markets”. Journal of Finance and Quantitative Analysis. Issue 30, 564-579.
Horwitz R. & Rodrigues L. 1996. “Merger Arbitrage Funds. Do They Deliver What
They Promise?”. Capital Market Risk Advisors.
Hull J C. 2000. “Options Futures and Other Derivatives”. United States: Prentice
Hall. International Inc.
Huysamen GK. 1994. “Psychological Measurement: An introduction with South
African Examples”. 4th impression. Pretoria. Academica.
Jarrow & Turnbull. 1996. “Derivative Securities”. :Southern Western College
Publishing.
Jindra J. & Walking RA. 1999, “Arbitrage Spreads and the Market Pricing of
Proposed Acquisitions”, Ohio State University. p 1-45.
Joen, B N. & Von Furstenburg G M. 1990. “Growing International Co-movement
in Stock Price Indexes”. Quarterly Review of Economics and Business. Vol 30,
No 3, Autumn. p15-30.
JSE Centenary Publication 1987. Johannesburg. p:134
Karolyi A G. & Shannon J. 1998. “Where’s the risk in the risk arbitrage?” Working
paper, Richard Ivey School of Business, The University of Western Ontario.
Keim D. & Stambarg R. 1986. “Predicting Returns in the Stock and Bond
Markets”, Journal of Financial Economics Issue 17, 357-390.
Kempf A. 1996. “The relation between spot and futures prices: The impact of the
early unwind option”. European Financial Management, Vol 2 Issue 3, 367-368.
Klien R A. & Liederman J. 1996. “Derivatives Risks and Responsibilities”. United
States of America: Irwin Professional Publishing.
Page 243
MANAGING PURE AND STATISTICAL EQUITY ARBITRAGE OPPORTUNITIES WITHIN THE SOUTH AFRICAN ENVIRONMENT- CRONJE, P (2004)
228
Kumara A. & Miller TM. 1995. “Daily and intradaily Tests of European Put-Call
Parity”, Journal of Financial and Quantitative Analysis Issue 30 p519-539.
Larcker. D. & Lys T. 1987. “An Empirical Analysis of the Incentives to Engage in
Costly Information Acquisition: the Case of Risk Arbitrage”, Journal Of Financial
Economics.111-126
Lasfer A. 1995. “Ex- Day Behaviour: Tax or Short Term Trading Effects” Journal
of Finance, Issue 50, Papers and Proceedings of the Fifty-Fifth Annual Meeting,
American Finance Association, Washington D.C., January 1995 pp 875-897.
Leedy PD. 1993. "Practical Research: Planning and Design (fifth edition)". New
York, USA: MacMillan
Lo A. & Mackinley CA. 1995. “Maximising Predicatability in the Stock and Bond
Markets”. NBER Working Paper Series No 5027. pp1-37.
Mackinlay. C A. & Ramaswamy K. 1988. “Program trading and the behaviour of
stock index futures”. Review of Financial Studies. Issue 1. 137- 158.
Meissner G., Sehgel M. & Teo SH. 2002. “Does International Stock-Index
Arbitrage Exist?” http://www.pbfea2002.ntu.edu.sg/papers/2004.pdf. Accessed 10
December 2003.
Miller M. H. 1997. “Merton Miller On Derivatives”. United States: John Wiley &
Sons Inc.
Mitchell M. & Pulvino T. 2001. “Characteristics of Risk and Return in Risk
Arbitrage”. Journal of Finance, Vol LVI, No 6 Dec. pp 2135-2175.
Money. 1995: “How you too can profit big from todays takeover manie with a
minimum of risk”. Vol. 24 Issue 4, p181,
Natenberg S. 1994. “Option Pricing and Volatility”. Revised Edition. New York.
United States: Irwin.
Page 244
MANAGING PURE AND STATISTICAL EQUITY ARBITRAGE OPPORTUNITIES WITHIN THE SOUTH AFRICAN ENVIRONMENT- CRONJE, P (2004)
229
Pulvino M T. & Stafford E. 2002 “Limited Arbitrage in Equity Markets”. 1-46
www.afajof.org/Pdf/april_02/MitchellPulvinoStafford.pdf. Accessed 12 December
2003.
Rashes M S. 2001. “Massively Confused Investors Making Conspicuously
Ignorant Choices (MCI-MCIC)”. Journal of Finance. Vol. LVI, Issue 5: October. pp
1911-1927.
Raynor, G. 1995. “Risk Arbitrage, Lotus Blossoms”, Business Press. Vol. 8 Issue
8.p 15.
Prebon Training Services SA. 2001: Registered Person Examination.
Johannesburg
Reilly F K. & Brown K C. 1997. “Investment Analysis and Portfolio Management”.
Fifth Edition. United States of America: The Dryden Press.
Reverre S. 2001. “The Complete Arbitrage Deskbook”. United States: McGraw-
Hill.
Roll R. 1984. “A simple Implicit Measure of the effective BID ASK Spread in an
Efficient Market” Journal of Finance, Issue 39: 1127-1139.
Rubenstein M. 1999. “Rubenstein on Derivatives”. London: Risk Books
Shao S P. 1976. “Statistics for Business and Economics”. Third Edition.
Columbus, Ohio: Charles E Merrill Publishing Company.
Siegel A F. 1997.”Practical Business Statistics”. Third Edition. New York. United
States: Irwin.
Siew H L. 2003. “Program trading is really just a trading tool”. http://business-
times.asia1.com.sg/sub/companies/story/0,4574,74423,00.html. Accessed 3
March 03.
Page 245
MANAGING PURE AND STATISTICAL EQUITY ARBITRAGE OPPORTUNITIES WITHIN THE SOUTH AFRICAN ENVIRONMENT- CRONJE, P (2004)
230
South African Journal of Business Management. 2000. “Macroeconomic variables
and the cross-section of the Johannesburg Stock Exchange Returns”. Vol 31.
Issue. 1. p31. p13.
Stoll. H R. 1988. “Index futures, program trading and stock market procedures”,
Journal of Futures Market. Issue 8. 391 – 412.
Stoll H R. & Whaley R.E. 1990 “The dynamics of stock index and stock index
futures returns”, Journal of Financial and Quantitative Analysis, 25(4), pp. 441-
468.
The Economist. 1990 “Dancing in Step”. 24 March 2001. p 90.
The Economist. 1990 “Free Money”. 21 July. Volume 316 Issue 7664.
Capital Markets p16,3p
The Economist. 2001. “Highly Contagious”. 24th March 2001. p 84-93.
“US Equity Statistical Arbitrage Aug 1999 to 30 Nov 2002”.
http://www.onemsf.com/pdf/manager/statistical.pdf. Accessed 1 March 2003.
Wander B H. & Bein D M. 2002. “How to Incorporate Hedge Funds and Active
Portfolio Management into an Asset Allocation Framework. Analytic Investors,
Risk management Perspectives”, June. p 2-7
Wall Street Journal. 1987. The Crash of '87 – “Black Monday: What Really Ignited
The Market's Collapse After Its Long Climb - An Early Sell-Off Ran Amok As
Weak Links Gave Out; A Clogged Order System” --- Role of Fidelity Investments:
December.
Wang G H K. & Yau J. 1994. “ A time series approach to testing for market
linkage union root and cointergration tests”. Journal of Futures Markets 14. 457-
474.
Ward K. 1998. “Corporate Financial Strategy”. United Kingdom: Butterworth-
Heinemann.
Page 246
MANAGING PURE AND STATISTICAL EQUITY ARBITRAGE OPPORTUNITIES WITHIN THE SOUTH AFRICAN ENVIRONMENT- CRONJE, P (2004)
231
“Why do Companies list Abroad? A survey of the Evidence and its Managerial
Implications, Financial Markets and Instruments”, The NYU Salamon Centre for
Research in Financial Institutions and Markets.
Zikmund W G. 1997. “Exploring Marketing Research (6th edn)”, Orlando, Florida,
United States: Dryden Press.
Websites without author references
http://ftse.jse.co.za [2000?].Accessed on 4 March 2004.
www.banking.org.za [1999?]. Accessed on 15 July 2003.
www.fsb.co.za [1998?]. Accessed on 20 November 2003.
www.investopedia.com/terms/s/statisticalarbitrage.asp [2002?]. Accessed on 15
December 2003.
www.JSE.co.za [1999?]. Accessed on 2 January 2002.
www.macroanalytics.com/html/risk_arbitrage.html [1999?]. Accessed on 12
November 2002.
www.SAFEX.co.za [2000?]. Accessed on 5 March 2002.
www.STRATE.co.za [2000?]. Accessed 14 February 2003.
www.Investorwords.com [2000?]. Accessed March 2003.
www.riskglossary.com [2002?]. Accessed 13 May 2003.
www.wealtheffect.com/stocksb8f.asp [2001?]. Accessed on 12 November 2002.
Page 247
MANAGING PURE AND STATISTICAL EQUITY ARBITRAGE OPPORTUNITIES WITHIN THE SOUTH AFRICAN ENVIRONMENT- CRONJE, P (2004)
232
APPENDIX 1
DUAL LISTED SHARES
Company
Issuer
Code Primary Secondary Secondary SecondarySecondary
Secondar
y
African Oxygen
Limited AFX
JSE
Securities
Exchange
South Africa
Namibia Stock
Exchange
Alexander Forbes
Limited AFB
JSE
Securities
Exchange
South Africa
Namibia Stock
Exchange
Anglo American
Platinum
Corporation
Limited ANANP
JSE
Securities
Exchange
South Africa
London Stock
Exchange
Anglo American
Plc ANAAL
London Stock
Exchange
JSE Securities
Exchange South
Africa
Botswana Stock
Exchange
Namibia Stock
Exchange
Schweizer Borse
Swiss Exchange
AngloGold Limited ANANO
JSE
Securities
Exchange
South Africa
Australian Stock
Exchange
London Stock
Exchange
Euronext Paris
Societe
Anonyme
Anglovaal Mining
Limited ANLM
JSE
Securities
Exchange
South Africa
London Stock
Exchange
Avis Southern
Africa Limited AVS
JSE
Securities
Exchange
South Africa
Botswana Stock
Exchange
Namibia Stock
Exchange
Barloworld Limited BAW
JSE
Securities
Exchange
South Africa
Euronext Brussels
Stock Exchange
German Stock
Exchange
London Stock
Exchange
Namibia Stock
Exchange
Schweizer
Borse Swiss
Exchange
Page 248
MANAGING PURE AND STATISTICAL EQUITY ARBITRAGE OPPORTUNITIES WITHIN THE SOUTH AFRICAN ENVIRONMENT- CRONJE, P (2004)
233
BHP Billiton Plc BIBLT
London Stock
Exchange
JSE Securities
Exchange South
Africa
Euronext Paris
Societe Anonyme
Bicc Cafca Limited BIC
Zimbabwe
Stock
Exchange
JSE Securities
Exchange South
Africa
Brait S.A. BRAIT
Luxembourg
Stock
Exchange
JSE Securities
Exchange South
Africa
London Stock
Exchange
Canadian
Overseas
Packaging
Industries Limited CAKVC
London Stock
Exchange
JSE Securities
Exchange South
Africa
Conafex Holdings
Societe Anonyme CNX
Luxembourg
Stock
Exchange
JSE Securities
Exchange South
Africa
Dimension Data
Holdings plc DIDDT
London Stock
Exchange
JSE Securities
Exchange South
Africa
Durban
Roodepoort Deep
Limited DUSM
JSE
Securities
Exchange
South Africa
Australian Stock
Exchange
Euronext Brussels
Stock Exchange
London Stock
Exchange
Euronext Paris
Societe Anonyme
Nasdaq Stock
Market
Electronic Media
Network Ltd &
Supersport
International MNS
JSE
Securities
Exchange
South Africa
Nigerian Stock
Exchange
Ellerine Holdings
Limited ELH
JSE
Securities
Exchange
South Africa
Botswana Stock
Exchange
Namibia Stock
Exchange
Energy Africa
Limited ENR
JSE
Securities
Exchange
South Africa
Luxembourg Stock
Exchange
Falcon Investment
Holdings Societe
Anonyme FLC
Luxembourg
Stock
Exchange
JSE Securities
Exchange South
Africa
Zimbabwe Stock
Exchange
Page 249
MANAGING PURE AND STATISTICAL EQUITY ARBITRAGE OPPORTUNITIES WITHIN THE SOUTH AFRICAN ENVIRONMENT- CRONJE, P (2004)
234
Firstrand Limited FSR
JSE
Securities
Exchange
South Africa
Namibia Stock
Exchange
Gold Fields
Limited GOGOF
JSE
Securities
Exchange
South Africa
Euronext Brussels
Stock Exchange
London Stock
Exchange
Euronext Paris
Societe
Anonyme
Schweizer Borse
Swiss Exchange
Harmony Gold
Mining Company
Limited HAPS
JSE
Securities
Exchange
South Africa
Euronext Brussels
Stock Exchange
London Stock
Exchange
New York Stock
Exchange
Euronext Paris
Societe Anonyme
Berlin Stock
Exchange
Highveld Steel and
Vanadium
Corporation
Limited HVL
JSE
Securities
Exchange
South Africa
Frankfurt Stock
Exchange
Impala Platinum
Holdings Limited IMPO
JSE
Securities
Exchange
South Africa
London Stock
Exchange
Investec Limited INL
JSE
Securities
Exchange
South Africa
Namibia Stock
Exchange
Investec Plc INP
London Stock
Exchange
JSE Securities
Exchange South
Africa
JD Group Limited JDG
JSE
Securities
Exchange
South Africa
Namibia Stock
Exchange
Kolosus Holdings
Limited KOS
JSE
Securities
Exchange
South Africa
Namibia Stock
Exchange
Liberty Group
Limited LIBU
JSE
Securities
Exchange
South Africa
London Stock
Exchange
Page 250
MANAGING PURE AND STATISTICAL EQUITY ARBITRAGE OPPORTUNITIES WITHIN THE SOUTH AFRICAN ENVIRONMENT- CRONJE, P (2004)
235
Liberty
International Plc LILII
London Stock
Exchange
JSE Securities
Exchange South
Africa
London Finance &
Investment Group
Plc LOJM
London Stock
Exchange
JSE Securities
Exchange South
Africa
Lonmin Plc LOLMI
London Stock
Exchange
JSE Securities
Exchange South
Africa
Lonrho Africa plc LOLAF
London Stock
Exchange
JSE Securities
Exchange South
Africa
Metorex Limited MEMTX
JSE
Securities
Exchange
South Africa
London Stock
Exchange
Metropolitan
Holdings Limited MET
JSE
Securities
Exchange
South Africa
Namibia Stock
Exchange
MICC Property
Income Fund
Limited MCP
JSE
Securities
Exchange
South Africa
Namibia Stock
Exchange
Monteagle
Holdings Societe
Anonyme MTE
Luxembourg
Stock
Exchange
JSE Securities
Exchange South
Africa
Mutual & Federal
Insurance
Company Limited MAF
JSE
Securities
Exchange
South Africa
Namibia Stock
Exchange
Namibian Sea
Products Limited NMS
Namibia
Stock
Exchange
JSE Securities
Exchange South
Africa
Naspers Limited NPN
JSE
Securities
Exchange Nasdaq Stock Market
Page 251
MANAGING PURE AND STATISTICAL EQUITY ARBITRAGE OPPORTUNITIES WITHIN THE SOUTH AFRICAN ENVIRONMENT- CRONJE, P (2004)
236
South Africa
Nictus Beperk NCS
JSE
Securities
Exchange
South Africa
Namibia Stock
Exchange
Oceana Group
Limited OCE
JSE
Securities
Exchange
South Africa
Namibia Stock
Exchange
Old Mutual plc OLOML
London Stock
Exchange
JSE Securities
Exchange South
Africa
Malawi Stock
Exchange
Zimbabwe Stock
Exchange
Namibia Stock
Exchange
Pretoria Portland
Cement Company
Limited PPC
JSE
Securities
Exchange
South Africa
Zimbabwe Stock
Exchange
Randgold &
Exploration
Company Limited RNG
JSE
Securities
Exchange
South Africa Nasdaq Stock Market
Richemont
Securities AG RCH
Schweizer
Borse Swiss
Exchange
JSE Securities
Exchange South
Africa
SABMiller Plc SOSAB
London Stock
Exchange
JSE Securities
Exchange South
Africa
Sanlam Limited SLM
JSE
Securities
Exchange
South Africa
Namibia Stock
Exchange
Santam Limited SNT
JSE
Securities
Exchange
South Africa
Namibia Stock
Exchange
Sappi Limited SAVVI
JSE
Securities
Exchange
German Stock
Exchange
London Stock
Exchange
New York Stock
Exchange
Page 252
MANAGING PURE AND STATISTICAL EQUITY ARBITRAGE OPPORTUNITIES WITHIN THE SOUTH AFRICAN ENVIRONMENT- CRONJE, P (2004)
237
South Africa
Shoprite Holdings
Limited SHP
JSE
Securities
Exchange
South Africa
Namibia Stock
Exchange
Simmer & Jack
Mines Ltd SIIF
JSE
Securities
Exchange
South Africa
London Stock
Exchange
Standard Bank
Group Limited SBK
JSE
Securities
Exchange
South Africa
Namibia Stock
Exchange
Stilfontein Gold
Mining Company
Ltd STRYE
JSE
Securities
Exchange
South Africa
London Stock
Exchange
Euronext Paris
Societe Anonyme
Tiger Brands
Limited TIIH
JSE
Securities
Exchange
South Africa
London Stock
Exchange
Tongaat-Hulett
Group Limited,
The THGL
JSE
Securities
Exchange
South Africa
London Stock
Exchange
Trans Hex Group
Limited TSX
JSE
Securities
Exchange
South Africa
Namibia Stock
Exchange
Truworths
International
Limited TRU
JSE
Securities
Exchange
South Africa
Namibia Stock
Exchange
Wankie Colliery
Company Limited WAKA
Zimbabwe
Stock
Exchange
JSE Securities
Exchange South
Africa
London Stock
Exchange
Page 253
MANAGING PURE AND STATISTICAL EQUITY ARBITRAGE OPPORTUNITIES WITHIN THE SOUTH AFRICAN ENVIRONMENT- CRONJE, P (2004)
238
Wooltru Limited WLO
JSE
Securities
Exchange
South Africa
Namibia Stock
Exchange
Woolworths
Holdings Limited WOWOW
JSE
Securities
Exchange
South Africa
London Stock
Exchange
Zambia Copper
Investments
Limited ZAKK
JSE
Securities
Exchange
South Africa
London Stock
Exchange
Euronext Paris
Societe Anonyme
Page 254
MANAGING PURE AND STATISTICAL EQUITY ARBITRAGE OPPORTUNITIES WITHIN THE SOUTH AFRICAN ENVIRONMENT- CRONJE, P (2004)
239
APPENDIX 2
RESEARCH QUESTIONNAIRE
Empirical Research into Arbitrage in the SA Market
1. Index Futures and Single Stock Futures
General
If you do not trade index and single stock futures arbitrage please answer question 1 of
this section; if you trade index and single stock futures arbitrage please answer
questions 2 onwards.
1. If you do not trade futures arbitrage, why is this the case? (please tick the all
applicable boxes)
No system
No interest
Not part of your core business
It does not exist
Other (please specify)
2. Do you believe that your futures arbitrage process can be improved and in which
areas? Please check appropriate blocks.
No, it can't be improved
Improved identification processes
Improved execution processes
Improved market risk processes
Improved ability to measure the MTM of the performance of each trade
Other (please specify)
Page 255
MANAGING PURE AND STATISTICAL EQUITY ARBITRAGE OPPORTUNITIES WITHIN THE SOUTH AFRICAN ENVIRONMENT- CRONJE, P (2004)
240
3. For how long have you taken advantage of futures arbitrage opportunities?
< 1 Year
> 1 year < 3 years
> 3 years < 5 years
> 5 years
4. What is the average time that opportunities are visible in the market?
= 1 day
> 1 day < 1 week
> 1 week < 2 weeks
> 2 weeks < 1 month
> 1 month
5. Do these trade opportunities meet your profitability requirements? Yes No
6. What is your profitability requirement?
7. What is the average number of index arbitrage transactions you enter into on a
weekly basis?
< 5 transactions
> 5 < 10 transactions
>10 < 20 transactions
> 20 < 50 transactions
> 50 transactions
8a. Do you have a formal system to identify the futures arbitrage opportunities? Yes No
If yes, which system is used?
8b. Do you use spreadsheets linked to a live data sources to calculate any price
differences?
Yes No
Page 256
MANAGING PURE AND STATISTICAL EQUITY ARBITRAGE OPPORTUNITIES WITHIN THE SOUTH AFRICAN ENVIRONMENT- CRONJE, P (2004)
241
9. What percentage of the index and SSF arbitrage positions do you close out prior to
the future maturing?
< 10%
> 10% but < 30%
> 30% but < 50%
> 50%
10. Do you adopt a stop loss strategy in the futures arbitrage strategy?
For all positions
For some positions
Never
11. What is the average stop loss level?
<5%
>5% < 10%
>10% > 15%
>15% > < 20%
>20%
12. Why do you apply this particular stop loss level?
Dividends.
13. Do you use continuous or discreet dividends for the index arbitrage?
Continuous
Discreet
Both
In what proportion?
14. In SSF and index arbitrage, do you use continuous or discreet dividends?
Continuous
Discreet
Both
In what proportion?
Page 257
MANAGING PURE AND STATISTICAL EQUITY ARBITRAGE OPPORTUNITIES WITHIN THE SOUTH AFRICAN ENVIRONMENT- CRONJE, P (2004)
242
15. What dividend forecast do you use?
Bloomberg
Inet
Reuters
Analysts forecasts
Other (please specify)
16. If you are using discreet dividends, how do you apportion the interim and final
dividend flows in Index Arbitrage?
Apportioned equally
Analysts forecasts
Other (please specify)
17. If you are using discreet dividends how do you apportion the interim and final
dividend flows in SSF Arbitrage:
Apportioned equally
Analysts forecasts
Other: please specify.
Risks
18. What are the risks that you consider meaningful in these future arbitrage trades?
Please mark all applicable options.
Execution Risk
Credit Risk – counterparty risk
Market Risk – sensitivity to the underlying instrument
Other
Page 258
MANAGING PURE AND STATISTICAL EQUITY ARBITRAGE OPPORTUNITIES WITHIN THE SOUTH AFRICAN ENVIRONMENT- CRONJE, P (2004)
243
19. Do you generally use static hedges to manage the market risks that result from the
Index and SSF futures trades?
Yes No
If not, please define the method used.
20. Do you use a partial differential hedge (PDH) to determine the hedge requirements? Yes No
21. What do you use to hedge the Index and SSF positions? (check the relevant boxes)
Underlying % of the time
Futures % of the time
Options % of the time
Warrants % of the time
Other
22. Do you find liquidity to be a constraint in index arbitrage in the context of the ALSI
index?
Yes No
23. When going short stock and long the ALSI future, can you readily source the ALSI
contracts and the underlying shares?
Yes No
24. Do you use a representative basket of the ALSI to effect your hedge in order to
reduce cost?
Yes No
25. If you answered "No" to question 24 above, why do you not use a representative
basket to hedge out your risk?
You do not wish to be exposed to the residual risk that may result from hedging only in
the representative basket.
You consider the representative basket to be an ineffective means to hedge the
exposure.
Other (please specify):
Page 259
MANAGING PURE AND STATISTICAL EQUITY ARBITRAGE OPPORTUNITIES WITHIN THE SOUTH AFRICAN ENVIRONMENT- CRONJE, P (2004)
244
26. What risk limits are applied to Index and SSF trades? Please specify.
Cost Associated With Futures Arbitrage
27. Please rank the cost drivers that you incur in futures arbitrage form 1 to 4, with 1
being the smallest and 4 being the largest.
Transaction / Hedging costs
Securities lending cost
Staff
Systems
2. Risk or Merger Arbitrage
Def: Arbitrage opportunities that present themselves as a result of corporate activities, e.g.
takeovers, cash share offers etc.
General
If you do not trade risk arbitrage, please answer question 1 of this section; if you do trade risk
arbitrage, please answer questions 2 onwards. .
1. If you do not trade risk arbitrage, why is this the case?
No system
No interest
Not part of your core business
It does not exist
Other (please specify).
Page 260
MANAGING PURE AND STATISTICAL EQUITY ARBITRAGE OPPORTUNITIES WITHIN THE SOUTH AFRICAN ENVIRONMENT- CRONJE, P (2004)
245
2. Do you believe that your risk arbitrage process can be improved and in which areas?
Please check appropriate blocks.
No, it can't be improved
Improved identification
Improved execution
Improved market risk
Improved ability to measure the MTM of the performance of trades or structures
Other (please specify)
3. For how long have you taken advantage of risk arbitrage opportunities?
< 1 Year
> 1 year < 3 years
> 3 years < 5 years
> 5 years < 10 years
> 10 years
4. What is the average time that opportunities are visible in the market?
= 1 day
> 1 day < 1 week
> 1 week < 2 weeks
> 2 weeks < 1 month
> 1 month
5. Do these trade opportunities meet your profitability requirements? Yes No
6. What is your profitability requirement?
7a. Do you have a formal system to identify the risk arbitrage opportunities? Yes No
If yes, which system is used?
Page 261
MANAGING PURE AND STATISTICAL EQUITY ARBITRAGE OPPORTUNITIES WITHIN THE SOUTH AFRICAN ENVIRONMENT- CRONJE, P (2004)
246
7b. Do you use spreadsheets linked to a live data source to identify opportunities to
calculate the opportunities?
Yes No
8. Do you adopt a stop loss strategy in the risk arbitrage strategy? Yes No
9. What is the average stop loss level?
<5%
>5% < 10%
>10% > 15%
>15% > < 20%
>20%
Risks
10. Do you use a PDH to determine the hedge requirements? Yes No
11. How do you hedge the exposure created by risk arbitrage?
Underlying Instruments
Options
Forwards
Futures
12. What do you use to establish the hedging requirement?
Partial Differential Hedge/Delta on the futures curve
Partial Differential Hedge on volatility curve
Delta
Vega
Gamma
Other (please specify)
13. What are the risks that you consider meaningful in these types of trades?
Execution Risk
Credit Risk – counterparty risk
Market Risk – sensitivity to the underlying
Legal Risk
Other (please specify)
Page 262
MANAGING PURE AND STATISTICAL EQUITY ARBITRAGE OPPORTUNITIES WITHIN THE SOUTH AFRICAN ENVIRONMENT- CRONJE, P (2004)
247
14. Do you generally find these transactions converge according to your expectations; and if
not, why is this the case?
Transaction do converge according to expectations
Regulatory reasons
Deal is revised in a direction which inhibits price convergence to expected level
The time it takes to conclude the deal – the cost of holding the position removes the potential
margin that was expected
15. What market risk limits are applied to risk arbitrage trades? Please specify.
Cost Associated With Risk Arbitrage
16. Please rank the cost drivers that you incur in risk arbitrage form 1 to 4, with 1 being the
smallest and 4 being the largest.
Transaction / Hedging costs
Securities lending cost
Staff
Systems
3. Dual Listed Arbitrage
General
If you do not trade dual arbitrage please answer question 1 of this section , if you trade dual
listed arbitrage, please answer questions 2 onwards.
1. If you do not trade any dual listed arbitrage opportunities, why is this the case?
No system
No interest
Not part of your core business
Don't have the legal ability to trade dual listed arbitrage
It does not exist
Other (please specify).
Page 263
MANAGING PURE AND STATISTICAL EQUITY ARBITRAGE OPPORTUNITIES WITHIN THE SOUTH AFRICAN ENVIRONMENT- CRONJE, P (2004)
248
2. Do you believe that your dual listed arbitrage process can be improved and in which
areas? Please check appropriate blocks.
No, it can't be improved
Improved identification
Improved execution
Improved market risk
Improved ability to measure the MTM of the performance of trades and structures
Other (please specify)
3. Do you use derivatives in any manner to gain additional gearing?
No, only the underlying is traded
Yes, warrants and OTC options and are traded
Yes, futures and forwards are traded
4. Do you trade dual listed arbitrage for:
Dividend effects % of trades
Currency effects % of trades
Other reasons (please specify):
5. Do these trade opportunities meet your profitability requirements? Yes No
6. What is your profitability requirement?
Page 264
MANAGING PURE AND STATISTICAL EQUITY ARBITRAGE OPPORTUNITIES WITHIN THE SOUTH AFRICAN ENVIRONMENT- CRONJE, P (2004)
249
7. For how long have you traded dual listed arbitrage?
< 1 Year
> 1 year < 3 years
> 3 years < 5 years
> 5 years < 10 years
> 10 years
8. What is the average number of dual listed transactions you enter into on a monthly basis?
< 5 transactions
> 5 < 10 transactions
>10 < 20 transactions
> 20 < 50 transactions
9a. Do you have a formal system to identify the dual listed arbitrage opportunities? Yes No
If yes, which system is used?
9b. Do you use spreadsheets linked to a live data sources to calculate and identify the
trading opportunities?
Yes No
10. Do you adopt a stop loss strategy in the dual listed arbitrage strategy? Yes No
11. What is the average stop loss level?
<5%
>5% < 10%
>10% > 15%
>15% > < 20%
>20%
Page 265
MANAGING PURE AND STATISTICAL EQUITY ARBITRAGE OPPORTUNITIES WITHIN THE SOUTH AFRICAN ENVIRONMENT- CRONJE, P (2004)
250
12. How do you hedge the dual listed securities arbitrage transactions that you enter into?
(mark all applicable options)
By taking the equal and opposite position on the London Stock Exchange
By trading futures and forwards in a manner which neutralises the exposure created by the
long /short position in the underlying instrument on the local exchange
By trading put and call options in a manner which creates a net Delta-neutral position
By hedging out the currency exposure that is created by transacting on the LSE
Other (please elaborate)
Risks
13. Do you use a PDH to determine the hedge requirements? Yes No
14. How do you hedge the exposure created by statistical arbitrage?
Underlying % of the time
Futures % of the time
Options % of the time
Warrants % of the time
Other (please specify)
15. What do you use to establish the hedging requirement?
Partial Differential Hedge/Delta on the futures curve
Partial Differential Hedge on volatility curve
Delta
Vega
Gamma
Other (please specify)
Page 266
MANAGING PURE AND STATISTICAL EQUITY ARBITRAGE OPPORTUNITIES WITHIN THE SOUTH AFRICAN ENVIRONMENT- CRONJE, P (2004)
251
16. What are the risks that you consider meaningful in these types of trades?
Execution Risk
Credit Risk – counterparty risk
Market Risk – sensitivity to the underlying
Legal Risk
Currency Risk
Other (please elaborate) –
17. Do you find liquidity to be a constraint in these transactions? Yes No
18. Do you find the international market for the dual listed securities (underlying and
derivatives) to be more liquid than the local market?
Yes No
19. What risk limits are applied to dual listed trades? Please specify.
Costs Associated With Dual Listed Arbitrage
20. Please rank the cost drivers that you incur in dual listed arbitrage form 1 to 4, with 1
being the smallest and 4 being the largest.
Transaction / Hedging costs.
Securities lending cost.
Staff
Systems
Page 267
MANAGING PURE AND STATISTICAL EQUITY ARBITRAGE OPPORTUNITIES WITHIN THE SOUTH AFRICAN ENVIRONMENT- CRONJE, P (2004)
252
4. Statistical Arbitrage
General
If you do not trade statistical arbitrage, please answer question 1 of this section; if you do
trade statistical arbitrage, please answer questions 2 onwards.
1. If you do not trade any statistical arbitrage opportunities, why is this the case?
No system
No interest
Not part of your core business
Don't have the legal ability to trade dual listed arbitrage
It does not exist
Other (please specify).
2. Do you believe that your statistical arbitrage process can be improved and in which areas?
Please check appropriate blocks.
No it can't be improved
Improved identification
Improved execution
Improved market risk
Improved ability to measure the MTM of the performance of trades and structures
Other (please specify)
3. Do you participate in any of these statistical arbitrage types?
Underlying securities Yes No
Pairs trading. Yes No
Statistical relationships. Yes No
Other (please specify).
Page 268
MANAGING PURE AND STATISTICAL EQUITY ARBITRAGE OPPORTUNITIES WITHIN THE SOUTH AFRICAN ENVIRONMENT- CRONJE, P (2004)
253
Derivatives Yes No
Statistical arbitrage between derivative and or the underlying Yes No
Volatility arbitrage. Yes No
Other (please specify).
4. Are there any other types of statistical arbitrage types that your firm trades? Yes No
If yes please specify:
5. If yes to any one of question 3 and 4 do you use derivatives in any manner to gain
additional gearing?
Yes No
6. Do these trade opportunities meet your profitability requirements? Yes No
7. What is your profitability requirement?
8. For how long have you traded statistical arbitrage?
< 1 Year
> 1 year < 3 years
> 3 years < 5 years
> 5 years < 10 years
> 10 years
9. What is the average number of statistical arbitrage transactions you enter into on an
monthly basis?
< 5 transactions
> 5 < 10 transactions
>10 < 20 transactions
> 20 < 50 transactions
Other (please specify)
Page 269
MANAGING PURE AND STATISTICAL EQUITY ARBITRAGE OPPORTUNITIES WITHIN THE SOUTH AFRICAN ENVIRONMENT- CRONJE, P (2004)
254
10a. Do you have a formal system which is used to identify statistical arbitrage opportunities? Yes No
If yes which system is used?
10b. Do you use spreadsheets linked to a live data sources to calculate and identify trading
opportunities?
Yes No
11. Do you apply statistical arbitrage trading to all shares or only the liquid shares? Yes No
12. Do you adopt a stop loss strategy in the statistical arbitrage strategy and at what level do
you apply the stop loss?
Yes No
<5%
>5% < 10%
>10% > 15%
>15% > < 20%
>20%
Risks
13. How do you hedge the exposure created by statistical arbitrage?
Underlying Instruments
Options
Forwards
Futures
14. What do you use to establish the hedging requirement?
Partial Differential Hedge/Delta on the futures curve.
Partial Differential Hedge on volatility curve.
Delta
Vega
Gamma
Other (please specify)
Page 270
MANAGING PURE AND STATISTICAL EQUITY ARBITRAGE OPPORTUNITIES WITHIN THE SOUTH AFRICAN ENVIRONMENT- CRONJE, P (2004)
255
15. What are the risks that you consider meaningful in these types of trades?
Execution Risk
Credit Risk – counterparty risk
Market Risk – sensitivity to the underlying
Legal Risk
Currency Risk
Greeks
Other –
16. Do you find the lending pool to be adequate to facilitate these transactions? Yes No
17. Do you use a partial differential hedge to determine the size and the direction of the
hedges that are required to neutralise the exposures on the book?
Yes No
If not, what do you use?
18. What risk limits are applied to statistical arbitrage trades? Please specify.
Cost Associated With Statistical Arbitrage
19. Please rank the cost drivers that you incur in statistical arbitrage form 1 to 4, with 1 being
the smallest and 4 being the largest.
Transaction / Hedging costs.
Securities lending cost.
Staff
Systems
Page 271
MANAGING PURE AND STATISTICAL EQUITY ARBITRAGE OPPORTUNITIES WITHIN THE SOUTH AFRICAN ENVIRONMENT- CRONJE, P (2004)
256
5. Volatility Arbitrage
General
If you do not trade volatility arbitrage, please answer question 1 of this section; if you do
trade volatility arbitrage, please answer questions 2 onwards.
1. If you do not trade volatility arbitrage, why is this the case?
No system
No interest
Not part of your core business
Don't have the legal ability to trade dual listed arbitrage
It does not exist
Other (please specify).
2. Do you believe that your volatility arbitrage process can be improved and in which areas?
Please check appropriate blocks.
No, it can't be improved
Identification
Execution
Market Risk
Ability to measure the MTM of the performance
Other (please specify)
3. Do you participate in volatility arbitrage via statistical arbitrage types? Yes No
4. Do you have instances where these volatility arbitrage trades are considered pure
arbitrage? Please elaborate.
Yes No
Page 272
MANAGING PURE AND STATISTICAL EQUITY ARBITRAGE OPPORTUNITIES WITHIN THE SOUTH AFRICAN ENVIRONMENT- CRONJE, P (2004)
257
5. Do these trade opportunities meet your profitability requirements? Yes No
6. What is your profitability requirement?
7. What types of volatility arbitrages do you capitalise upon?
Spread Arbitrage
Different issuers – where companies have similar structures and balance sheets and operate
in the same industry
Speculative, i.e. increase or decrease in volatility
Reversion to theoretical (historical) volatility
Other Statistical (please elaborate)
8. Do you apply volatility arbitrage to all shares or only the liquid shares? Yes No
9. For how long have you traded volatility arbitrage?
< 1 Year
> 1 year < 3 years
> 3 years < 5 years
> 5 years < 10 years
> 10 years
10. What is the average number of statistical arbitrage transactions you enter into on an
annual basis?
< 5 transactions
> 5 < 10 transactions
>10 < 20 transactions
> 20 < 50 transactions
Other (please specify)
Page 273
MANAGING PURE AND STATISTICAL EQUITY ARBITRAGE OPPORTUNITIES WITHIN THE SOUTH AFRICAN ENVIRONMENT- CRONJE, P (2004)
258
11a. Do you have a formal system to identify volatility arbitrage opportunities? Yes No
If yes, which system is used?
11b. Do you use spreadsheets linked to a live data sources to calculate and identify the
opportunities?
Yes No
12. Do you adopt a stop loss strategy in the statistical arbitrage strategy? Yes No
13. What is the average stop loss level?
<5%
>5% < 10%
>10% > 15%
>15% > < 20%
>20%
14. What do you use to establish the hedging requirement?
Partial Differential Hedge/Delta on underlying curve.
Delta
Vega
Gamma
Other (please elaborate)
Risks
15. How do you hedge the exposure created by volatility arbitrage?
Underlying Instruments
Options
Forwards
Futures
Page 274
MANAGING PURE AND STATISTICAL EQUITY ARBITRAGE OPPORTUNITIES WITHIN THE SOUTH AFRICAN ENVIRONMENT- CRONJE, P (2004)
259
16. What do you use to establish the hedging requirement?
Partial Differential Hedge/Delta on underlying curve, e.g. Delta buckets
Partial Differential Hedge on volatility curve, e.g. vega buckets
Delta
Vega
Gamma
Other (please specify)
17. What are the risks that you consider meaningful in these types of trades?
Execution Risk
Credit Risk – counterparty risk
Market Risk – sensitivity to the underlying
Legal Risk
Currency Risk
Greeks
Other (please specify)
18. Do you find the lending pool to be adequate in these transactions? Yes No
19. Do you use a partial differential hedge to determine the size and the direction of the
hedges that are required to neutralise the exposures on the book?
Yes No
If not, what do you use?
20. What risk limits are applied to volatility arbitrage trades? Please specify.
Page 275
MANAGING PURE AND STATISTICAL EQUITY ARBITRAGE OPPORTUNITIES WITHIN THE SOUTH AFRICAN ENVIRONMENT- CRONJE, P (2004)
260
Cost Associated With Volatility Arbitrage
21. Please rank the cost drivers that you incur in volatility arbitrage form 1 to 4, with 1 being
the smallest and 4 being the largest.
Transaction / Hedging costs.
Securities lending cost.
Staff
Systems
6. Strategic and Operational Processes
General
1. Do you have the ability to model arbitrage opportunities based on:
Historical profit maximisation scenarios?
Monte Carlo profit maximisation scenarios?
Other (please specify):
2. Are all the equity arbitrage types managed in one area Yes No
Centralised?
Decentralised?
Combination of both? Please elaborate.
3. Why do you prefer this structure?
4. Do you believe that your arbitrage operations can be improved? Yes No
How?
Page 276
MANAGING PURE AND STATISTICAL EQUITY ARBITRAGE OPPORTUNITIES WITHIN THE SOUTH AFRICAN ENVIRONMENT- CRONJE, P (2004)
261
5. Does the risk management process for equities and equity derivatives fall within the
general business market risk framework?
Yes No
6. How do you measure the general effectiveness of the arbitrage traders?
Performance against budget
Other
7. At what point would you consider discontinuing your arbitrage operations?
If it does not meet profitability requirements for 1 year
If it does not meet profitability requirements for 2 years
If it does not meet the profitability requirements for 3 years
If it does not meet the profitability requirements for 4 years or more
8. Do you consider arbitrage operations to provide any strategic advantage in the event that
the trading is not profitable?
Yes No
Why?
9. Do all arbitrage trades roll up into your existing risk framework, i.e. risk and trading
systems?
Yes No
If no, why not?
10. Do you believe the arbitrage risks need to be viewed independently? Yes No
If yes, why?
11. What are the average securities lending costs expressed as a percentage of the notional
amount borrowed?
12. What are the average futures trading costs?
13. What are the average equity trading costs?
Page 277
MANAGING PURE AND STATISTICAL EQUITY ARBITRAGE OPPORTUNITIES WITHIN THE SOUTH AFRICAN ENVIRONMENT- CRONJE, P (2004)
262
14. What management tools do you use to manage the arbitrage operations?
Identification tools
Risk tools
Trader monitoring tools
Profit maximisation tools
Other (please specify).
15. What additional management tools would you consider useful in managing arbitrage
opportunities?
16. What is the arbitrage management business structure used in your treasury?
Equity Arbitrage forms part of Equity Derivatives
Equity Arbitrage forms part of a general arbitrage desk
Other (please specify)
17. How many traders are used in your arbitrage operation?
1
2
3
4
> 4
18. What is the average cost of a trader annually?
< R250 000
>250 0000 < 350 000
> R400 000 < 550 000
Page 278
MANAGING PURE AND STATISTICAL EQUITY ARBITRAGE OPPORTUNITIES WITHIN THE SOUTH AFRICAN ENVIRONMENT- CRONJE, P (2004)
263
> R 600 000
19. Are the traders specialists who only focus on arbitrage trading? Yes No
Why or why not?
20. Do you intend to expand your arbitrage operations into areas discussed within this
questionnaire?
Yes No
Why or why not?
21. Do you intend to expand your arbitrage operations into other arbitrage types not covered
in this research? Please specify.
Yes No
Why or why not?
22. Do you have the ability to calculate the Rho that results from the arbitrage positions? Yes No
23. Do you actively manage the interest rate risk (Rho) that results from the arbitrage
positions?
Yes No
How?
24. Do you have the ability to calculate the Vega of the arbitrage positions? Yes No
25. Do you actively manage the volatility risk (Vega) that results from the arbitrage positions? Yes No
How?
26. Do you have the ability to calculate the Delta of the arbitrage positions? Yes No
27. Do you actively manage the risk that results from changes in the price of the underlying
instrument (Delta) that results from the arbitrage positions?
Yes No
How?
Page 279
MANAGING PURE AND STATISTICAL EQUITY ARBITRAGE OPPORTUNITIES WITHIN THE SOUTH AFRICAN ENVIRONMENT- CRONJE, P (2004)
264
28. Do you have the ability to calculate the gamma of the arbitrage positions? Yes No
29. Do you actively manage the Gamma risks that results from the arbitrage positions? Yes No
How?
30. How do you test for the sensitivities that are associated with these and other limits?
Page 280
MANAGING PURE AND STATISTICAL EQUITY ARBITRAGE OPPORTUNITIES WITHIN THE SOUTH AFRICAN ENVIRONMENT- CRONJE, P (2004)
265
APPENDIX 3
CONTENT VALIDITY QUESTIONNAIRE
1) Does the questionnaire flow in a natural manner?
2) Is it clear what the questionnaire hopes to determine?
3) Were the questions clear? If not, which ones should be reviewed?
4) Were the questions ambiguous in any manner? If so, which ones?
5) Were all the questions relevant? If not, which questions should be reviewed?
6) Were the questions too sensitive in nature and therefore avoided?
7) How long did it take to complete the questionnaire?
8) Do you have any comments about the questionnaire, other that those covered
in the above questions?
Yes No
Yes No
Yes No
Yes No
Yes No
Yes No