Managing Risk on the Railway Infrastructure Allan M. Zarembski, Ph.D., P.E., FASME 1 , Joseph W. Palese, PE, MSCE, MBA 1 ZETA-TECH Associates, Inc., Cherry Hill, New Jersey, USA, [email protected]Abstract Risk management and together with its associated management of safety is a fundamental focus of railway officers worldwide. This includes the issue of derailment prevention as well as the related issue of risk management for those categories of track failure or degradation that can result in a derailment. Recently, a new generation of track safety management tools has been developed that quantify and analyze the “risk” associated with key track failure modes. This paper will describe three such new generation risk management tools that deal directly with track safety in key track failure (and derailment) areas. These models have been implemented on railways in the US and worldwide and have been shown to be effective tools in controlling and reducing the risk of derailments in their respective track risk areas. The specific models to be discussed in this article are: • Broken rail risk model, which quantifies the risk of occurrence of a broken rail (and associated broken rail derailment) and allows railways to adjust their UT test schedules to reduce that risk. • Track buckling risk model which identifies and prioritizes locations of high potential buckling risk and directs railway engineers to them for appropriate action • Vehicle/track geometry risk model, which identifies and prioritizes locations of high potential for vehicle/track geometry related derailments. All three of these models rely on research that has been developed over the last several decades, and the resulting body of knowledge on the theory behind these track failure modes. All of these models are designed to be applicable in large-scale applications, to identify potential failure sites across an entire route, division or railway system. Applications up to 25,000 miles (40,000 km) have been made using these risk analysis tools across an entire rail network. Results, in full-scale applications on major railways in the US and Europe have shown significant and quantifiable reductions in derailments themselves and in corresponding derailment causing conditions. In several large-scale applications of the broken rail risk model, significant benefits in terms of reduced occurrence of broken rails and reduced broken rail derailments have been reported. In one such application, a reduction in broken rails (service defects) on the order of 28% was reported over a three- year application period. Concurrently, the same railway reported a reduction in rail caused derailments of 33%. Similar results were reported on another large-scale railroad application this past year. Likewise, full-scale applications of the buckling risk assessment model resulted in a high percentage of high risk sites identified for immediate action by local forces. On one major railway application, between 30 and 50% of the identified sites were the subject of immediate corrective action by local forces. This railway likewise reported a dramatic reduction in both track buckling related derailments and track buckling incidents.
Transcript
Managing Risk on the Railway Infrastructure
Allan M. Zarembski, Ph.D., P.E., FASME1, Joseph W. Palese, PE, MSCE, MBA1
ZETA-TECH Associates, Inc., Cherry Hill, New Jersey, USA, [email protected]
Abstract
Risk management and together with its associated management of safety is a fundamental focus of railway officers worldwide. This includes the issue of derailment prevention as well as the related issue of risk management for those categories of track failure or degradation that can result in a derailment. Recently, a new generation of track safety management tools has been developed that quantify and analyze the “risk” associated with key track failure modes. This paper will describe three such new generation risk management tools that deal directly with track safety in key track failure (and derailment) areas. These models have been implemented on railways in the US and worldwide and have been shown to be effective tools in controlling and reducing the risk of derailments in their respective track risk areas. The specific models to be discussed in this article are:
• Broken rail risk model, which quantifies the risk of occurrence of a broken rail (and associated broken rail derailment) and allows railways to adjust their UT test schedules to reduce that risk.
• Track buckling risk model which identifies and prioritizes locations of high potential buckling risk and directs railway engineers to them for appropriate action
• Vehicle/track geometry risk model, which identifies and prioritizes locations of high potential for vehicle/track geometry related derailments.
All three of these models rely on research that has been developed over the last several decades, and the resulting body of knowledge on the theory behind these track failure modes. All of these models are designed to be applicable in large-scale applications, to identify potential failure sites across an entire route, division or railway system. Applications up to 25,000 miles (40,000 km) have been made using these risk analysis tools across an entire rail network. Results, in full-scale applications on major railways in the US and Europe have shown significant and quantifiable reductions in derailments themselves and in corresponding derailment causing conditions. In several large-scale applications of the broken rail risk model, significant benefits in terms of reduced occurrence of broken rails and reduced broken rail derailments have been reported. In one such application, a reduction in broken rails (service defects) on the order of 28% was reported over a three-year application period. Concurrently, the same railway reported a reduction in rail caused derailments of 33%. Similar results were reported on another large-scale railroad application this past year. Likewise, full-scale applications of the buckling risk assessment model resulted in a high percentage of high risk sites identified for immediate action by local forces. On one major railway application, between 30 and 50% of the identified sites were the subject of immediate corrective action by local forces. This railway likewise reported a dramatic reduction in both track buckling related derailments and track buckling incidents.
WCRR2006 2
Introduction
In recent years, railways have turned to the discipline of risk management to improve safety and reduce the potential risk of accidents or derailments. Since accidents and derailments are very low probability of occurrence events, it is necessary to focus on the derailment causes themselves and develop risk management tools that quantify and analyze the “risk” for each key derailment or accident area. One such “high risk” area, for which a risk management approach has been developed, is broken rail safety, a major track-caused derailment category. In the United States alone, an average of over 280 derailments a year have occurred over the last 8 years with a total average annual cost of over $100 Million. Increased testing has a direct effect on this behavior, where both the service defect rate and the number of derailments decrease with increased testing. However, increased testing is expensive and should be judiciously applied. Simply increasing testing “across the board” is not the best approach. Rather, assessment of the rail condition, and the “risk” of broken rails (service defects) offers the most efficient and cost effective approach to increasing rail testing. A second such high-risk area is that of track buckling. Track buckling, the sudden lateral movement of the track due to thermally generated longitudinal rail forces, remains a major track failure mode both in North America and worldwide. Over the last five years, there have been, on average, 34 derailments a year in the US alone, with a FRA reported cost of over $11 Million annually. These derailments, coupled with high maintenance costs associated with buckling prevention, have forced railway systems to pay careful attention to those factors that can influence the potential for track buckling. Since techniques to monitor the neutral temperature of the rail, and thus predict the onset of buckling by measurement, are very limited and difficult to employ, railroads generally rely on preventive measures to control buckling risk. Yet a third such high-risk area is the vehicle/track interaction area, where a combination of geometric parameters or repeated geometric anomalies can lead to unsafe vehicle dynamic response. Current track recording car based measurement of geometric parameters and comparison to pre-set safety limits is insufficient. This is evidenced by the more than 100 such vehicle-track interaction related derailments reported in the US alone each year. The need fro a more focused approach to identify these high-risk areas is apparent.
This paper will address these three high derailment areas and show how a risk based approach has been used to help identify high risk areas and effectively and economically focus resources on these high risk areas to control and reduce the number of derailments.
Broken Rail Risk Management
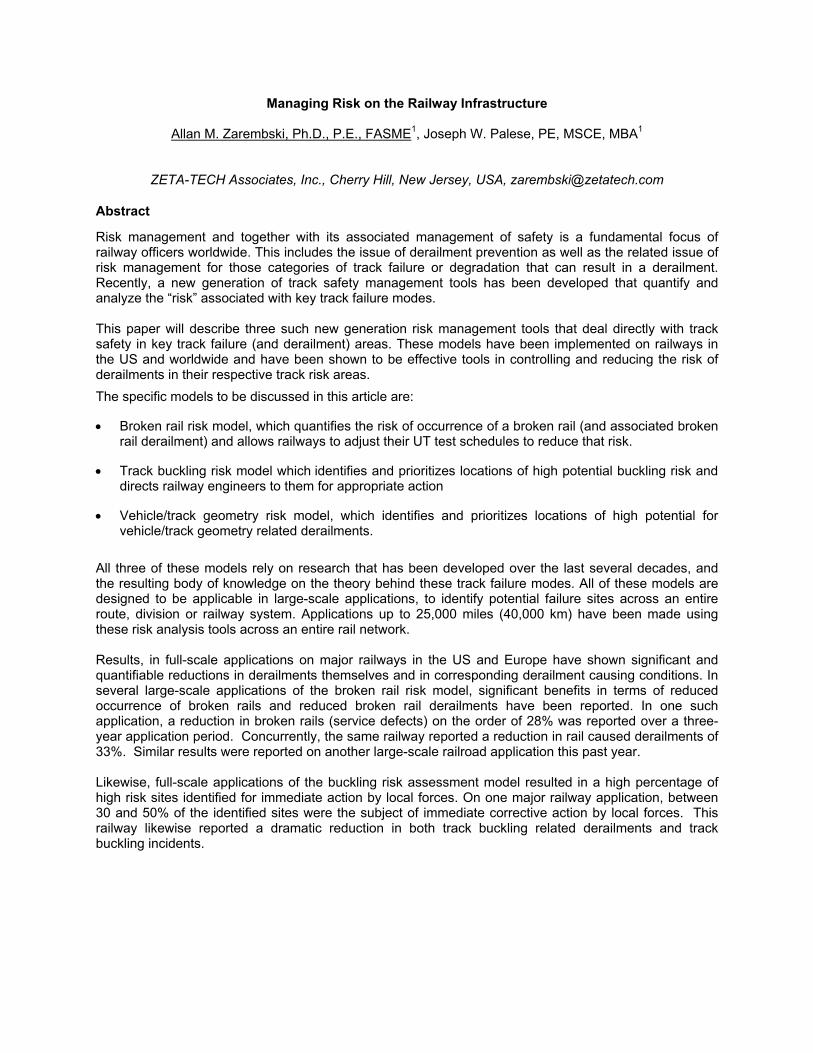
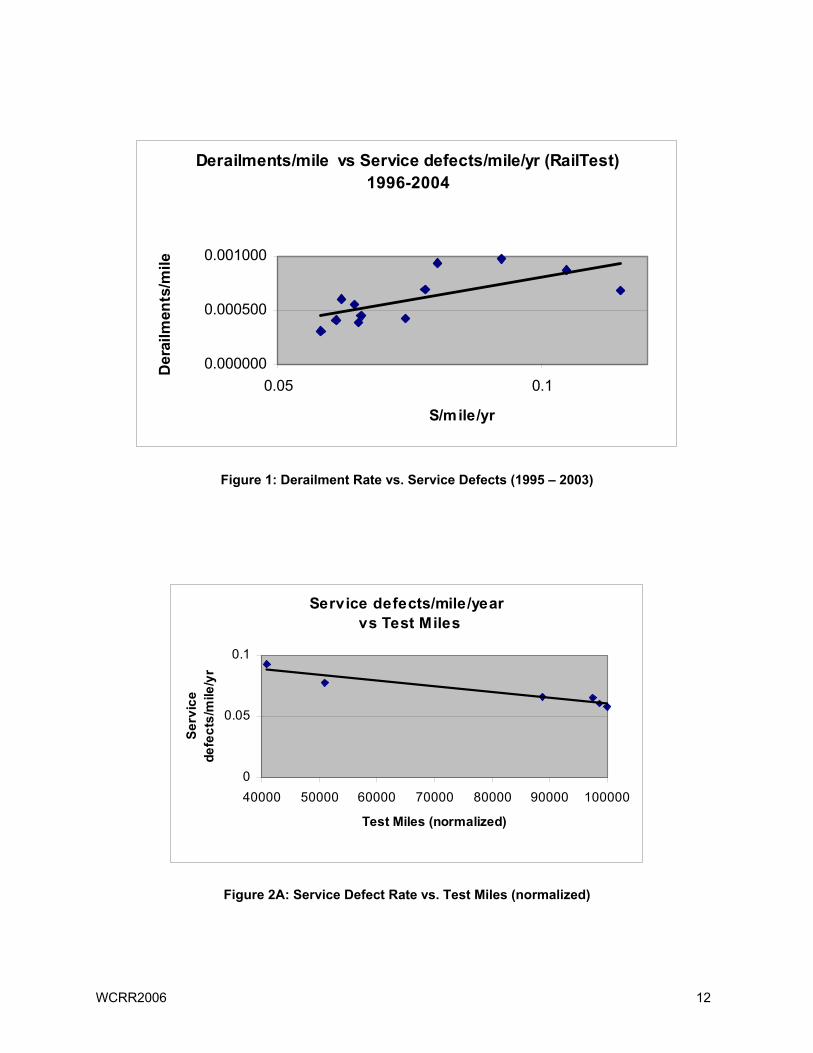
Control of broken rail derailments is a serious concern to maintenance of way officers worldwide. Research studies have shown a relationship between rail defect occurrence and broken rail derailments [1, 2]. Furthermore, breaking rail defects into two “detection” categories - detected defects1 and service defects2- have shown a strong correlation between service defects and derailments. Early US studies found that for fatigue related defects, a broken rail derailment occurred every 133 service defects for a derailment per defect rate of 0.0075 [2]. Subsequent research, focusing on control of rail service defects by improved inspection efficiencies, showed the potential for controlling the risk of broken rail derailments by reducing the percentage of service defects and the associated service defect rate [3, 4]. Examination of data from over 50,000 km (30,000 miles) of railroad date for the period 1995 though 2003 supports the findings of a relationship between rail defects, particularly service defects, and derailments [5]. Figure 1 illustrates this behavior showing a strong relationship between derailment rate (derailments per mile of track) and service defects. 1 Those defects located by non-destructive inspection processes such as ultrasonic testing. 2 Those defects located by visual inspection, observation of breaks, etc
WCRR2006 3
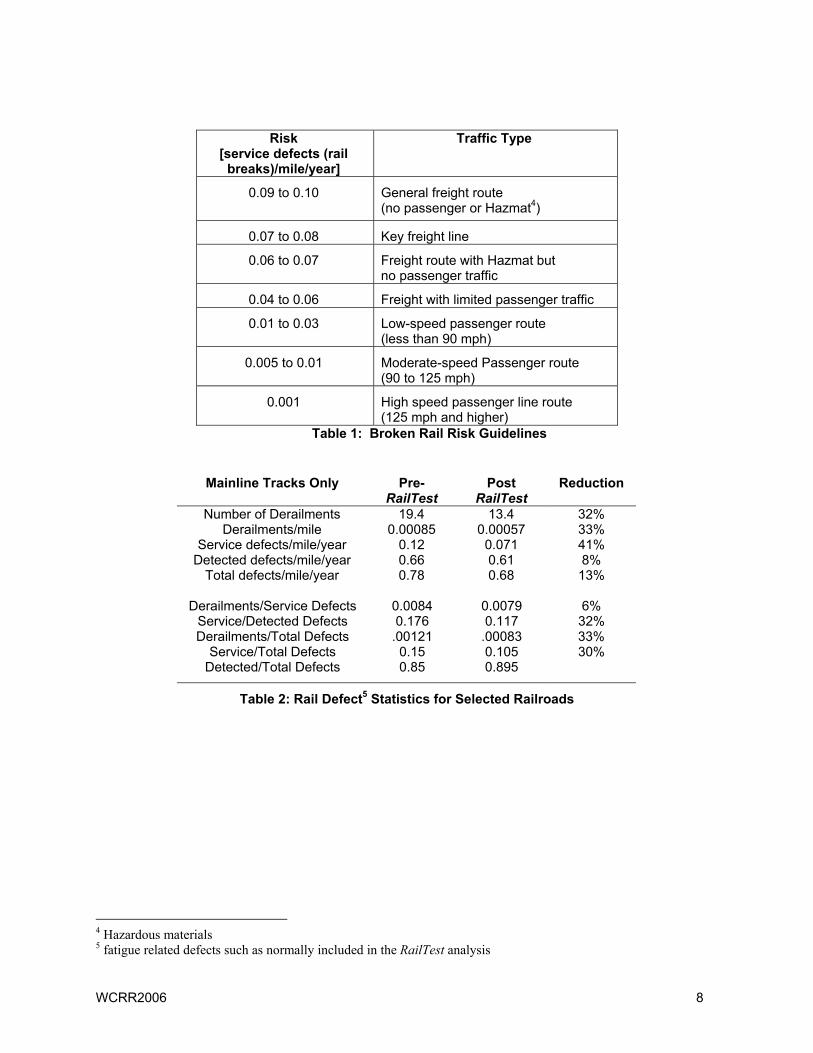
Increased testing has a direct effect on this behavior, as shown in Figures 2A and 2B, where both the service defect rate and the number of derailments decrease with increased testing. However as noted previously, increased testing is expensive and as such must be optimized. Simply increasing testing “across the board” is not the best approach. Rather, assessment of the rail condition, and the associated “risk” of broken rails, which has been found to be related to the rate of service defects, offers the most efficient and cost effective approach to increasing rail testing. Such an approach was developed by Volpe National Transportation Systems Center of the US Department of Transportation in the early 1990s [3]. This approach was modified and adapted by ZETA-TECH into its RailTest risk based ultrasonic test scheduling model and has been applied extensively in the United States and Europe [4]. The objective of this analysis methodology is to schedule ultrasonic testing (UT) so that a defined level of risk (of rail failure) is held constant, even as rail ages. Risk is defined as the number of service defects (e.g. rail breaks) per mile per year, which, as shown above, is related to the occurrence of broken rail derailments. The risk analysis methodology addresses several key factors that affect the occurrence of rail breaks, to include defect initiation and growth and the reliability of the non-destructive detection technique. It analyzes the probability that a rail defect will “escape” detection and grow to critical size before the next scheduled rail test. It then adjusts the rail test schedule to minimize the risk of “missing” such a defect. A key parameter in this scheduling process is the risk itself, defined as service defects per mile per year. Analysis of defect records on thousand of track segments has shown that many locations of higher than acceptable risk do occur and that these locations have a higher probability of experiencing a broken rail. Table 1 presents risk guidelines developed by ZETA-TECH through application of this broken rail risk methodology on a broad range of freight and passenger railways in North America and Europe [4]. Those track segments that exceed these risk levels are deemed high-risk areas and must be addressed by improved UT testing, either through the use of better equipment or through improved test scheduling. Improved test scheduling has been achieved on several major rail systems in the US and Europe through application of the RailTest risk based methodology with dramatic and consistent results. For example, a multi-year application on BNSF shows a well documented reduction in both service defects and in rail related derailments. This is illustrated in Figure 3, which shows service defect and derailment rate for nine-year period from 1985 through 2003. There was a well-defined reduction in service defect rate and in broken rail derailments from time of RailTest application in 1988. Table 2 presents a consolidated set of rail defect data comparing conventional UT scheduling techniques (“pre-RailTest”) and risk based scheduling (“post-RailTest”). As can be seen, the derailment rate decreases by about 1/3 (33 %). Similarly, the service defect rate decreases by over 40% and the ratio of service defects to total defects (percentage of defects not-found by UT testing) decreases by 30%. However, the ratio of derailments to service defects remains virtually constant, 0.008 or one derailment every 125 defects, thus supporting the earlier results that there is strong relationship between service defects and broken rail derailments.
In an application of RailTest on the Scotland Zone of Network Rail, the relationship between allowable level of risk and required miles of UT testing was evaluated, as illustrated in Table 2 [6]. As can be seen in this table, the additional testing required to achieve a lower level of risk can be determined together with the associated extra cost. Thus the impact of moving from current risk levels to a more “appropriate’ level, as defined in Table 1, can be assessed.
In these and other large-scale applications of RailTest, significant benefits in terms of reduced occurrence of broken rails and reduced broken rail derailments have been reported.
WCRR2006 4
Quantifying and Controlling the Risk of Track Buckling
Track buckling, is likewise of concern to railways worldwide, because of the sudden nature of its occurrence and associated high the potential for a derailment. Research studies have indicated that one out of every ten buckles results in a derailment [7]. As noted previously, there are currently no effective techniques for large scale monitoring of the potential for track buckling. Although extensive research has been addressed at the development of non-destructive techniques to measure longitudinal rail force, and thus monitor the potential for track buckling, these techniques have not proved successful to date. The result is a focus on visual monitoring and inspection. Recently, however, a risk based methodology for the assessment of track buckling potential has been developed using track buckling theory and the newest generation of track buckling analysis models [8, 9]. This methodology has been implement into a production analysis model, called BuckleRisk, which allows for large-scale application on large railway networks. This model is designed to identify high-risk track buckling sites using site-specific risk factors to develop a site “risk” value. Based on the magnitude of this value, the potential for a track buckle occurring at the site is defined and the need for any follow up action identified. In this methodology the railway is divided into small homogeneous analysis segments, of the order of 0.2 to 0.4 km in length, and, for each segment, a buckling risk value or “risk factor” is calculated based on track, traffic and environmental conditions present at that segment. These risk factor values are based on track buckling theory which relates the potential for track buckling to the increase in rail temperature above the neutral or force free temperature of the rail and to the buckling resistance of the track structure. Using the relationship between temperature and longitudinal rail force, the buckling risk values were designed to correspond to an “equivalent” temperature increase. Thus buckling risk consists of:
• Base risk which is the actual rail temperature increase above neutral for a given site • Supplemental risk factors which are track and traffic related and that effect the strength or neutral
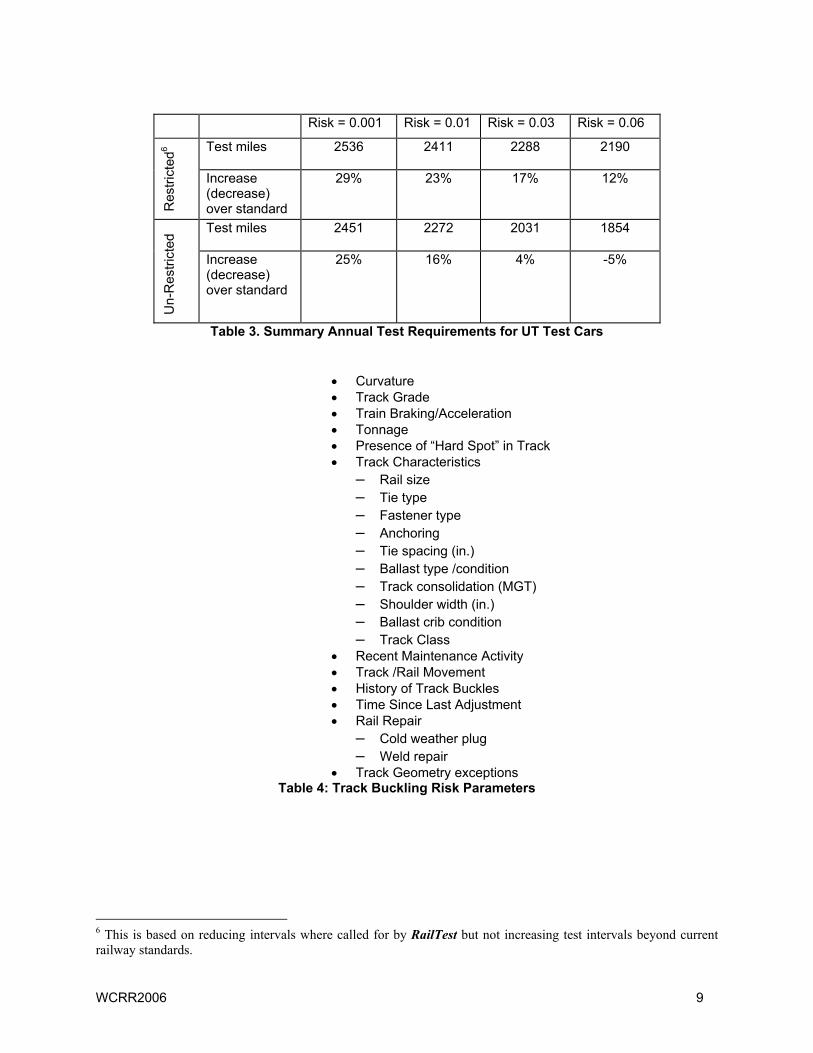
temperature of the track; defined in terms of “equivalent’ increase or decrease in temperature above the base value. A partial listing of these risk factors is shown in Table 4.
By adding together the base risk with the supplemental risk factors, an “equivalent” temperature increase is developed which in turn is directly related to the risk of the track segment buckling. The higher this risk value the greater the potential for track buckling at that site.
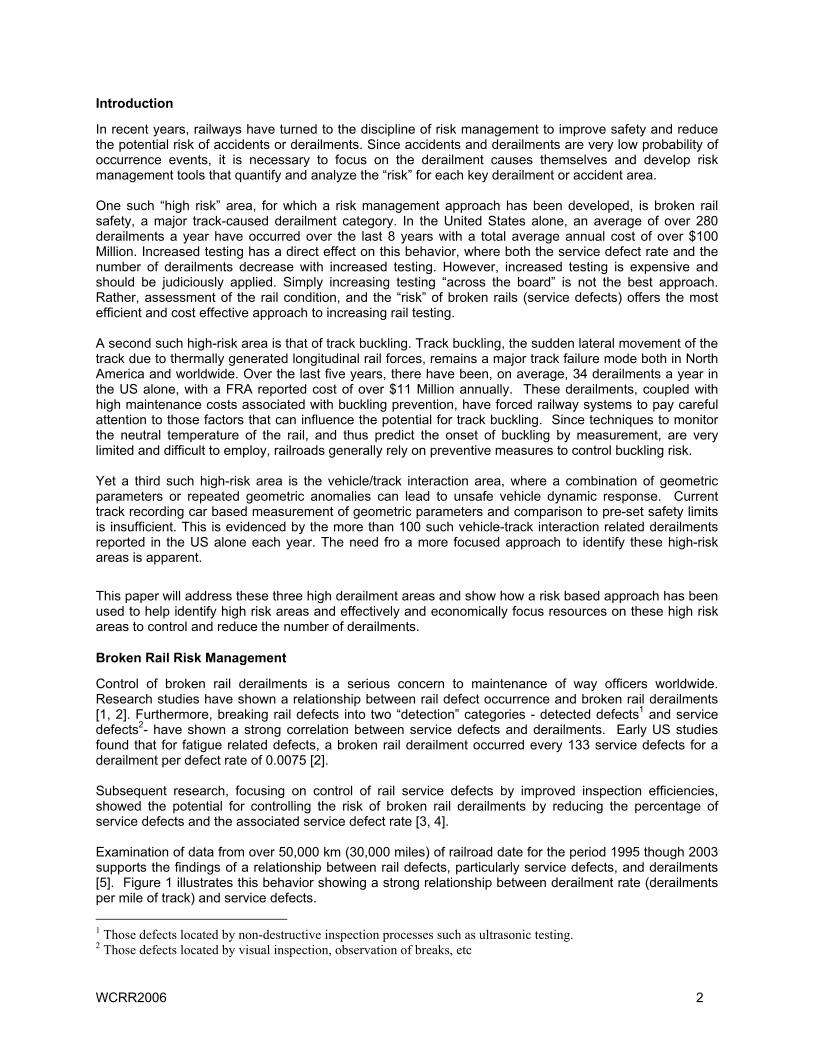
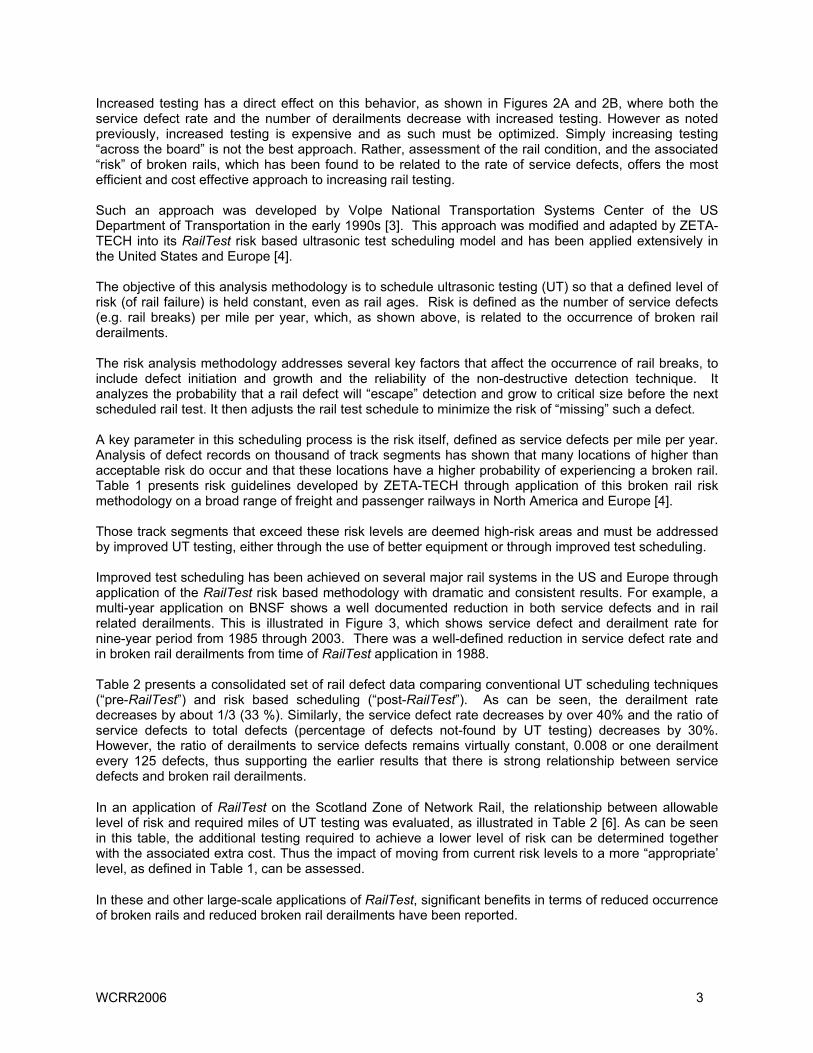
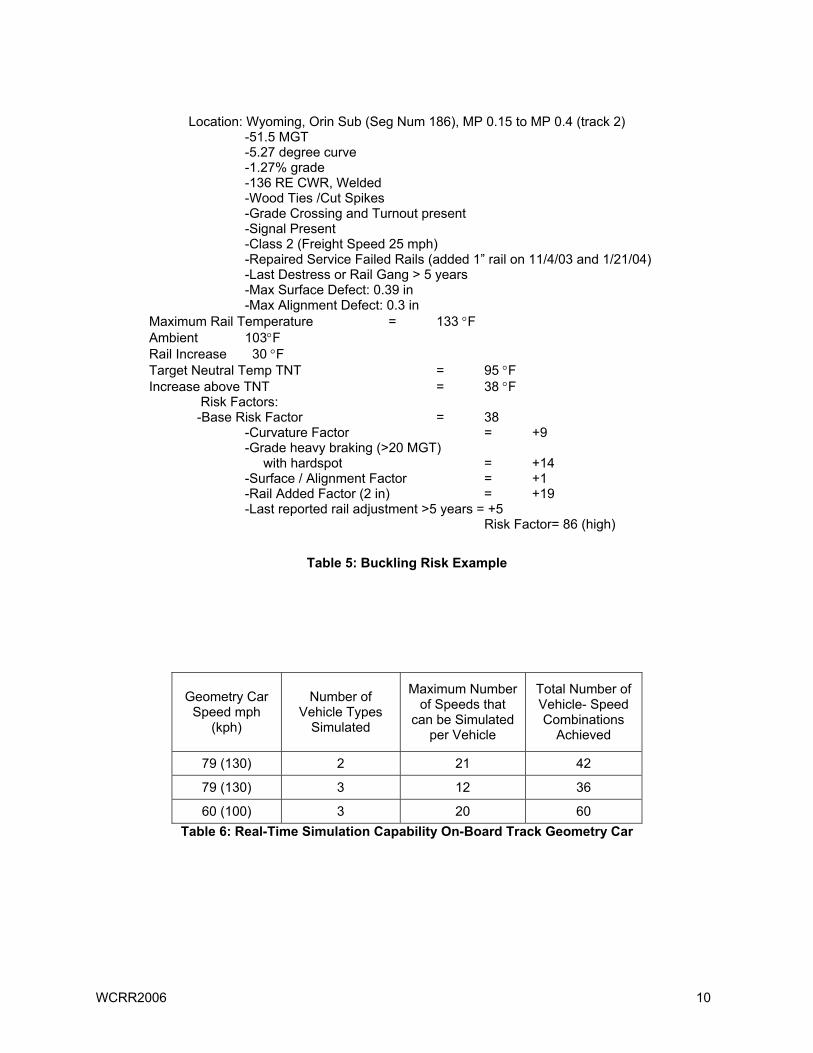
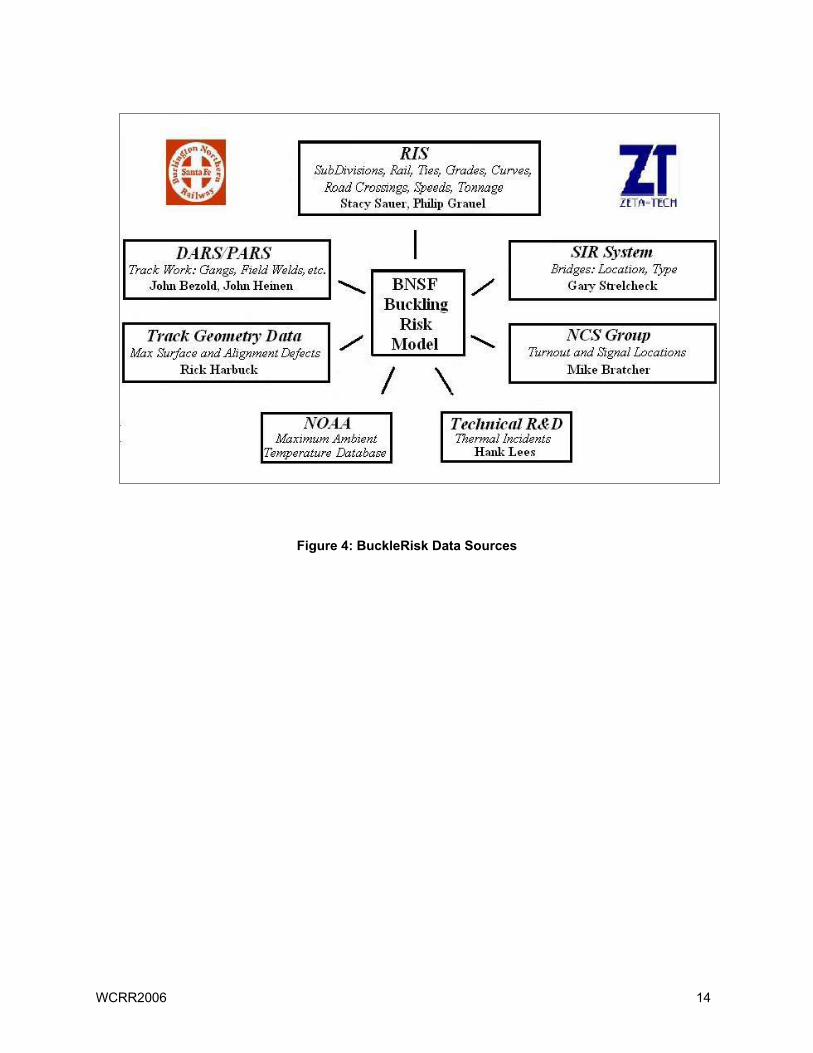
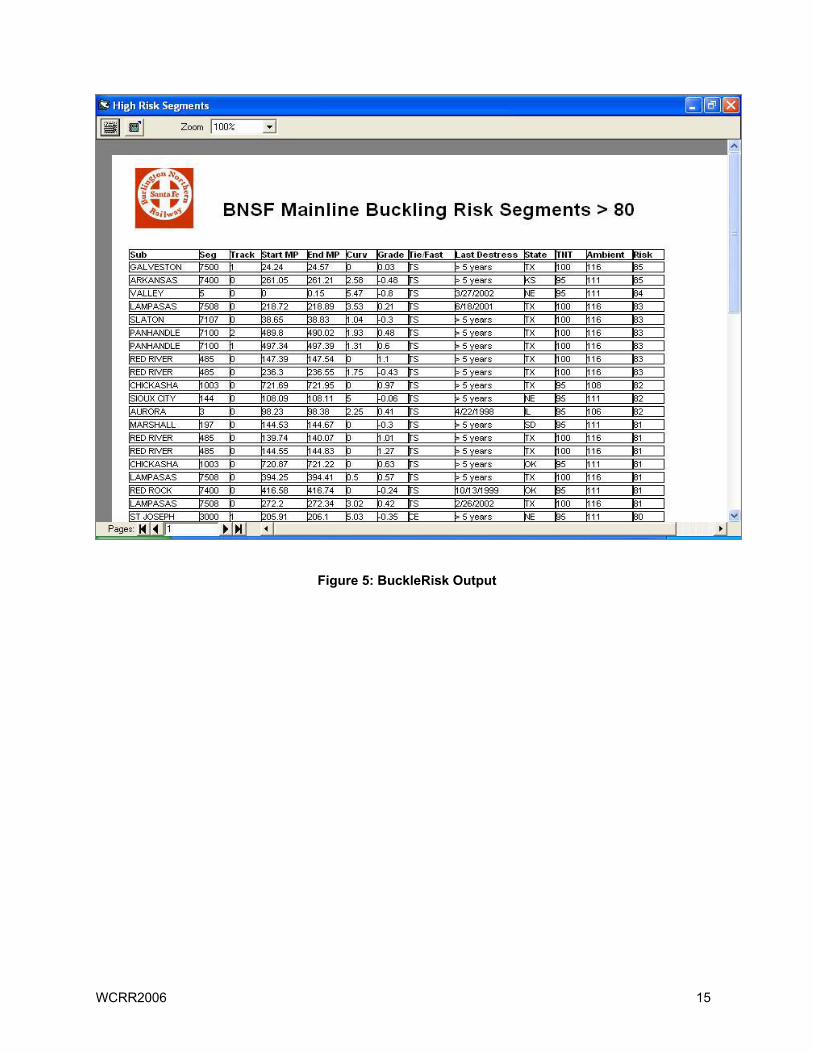
Table 5 illustrates the application of the buckling risk factor methodology. This example is taken from an actual BNSF track segment [8]. It should be noted that the other factors were not applied since they were not relevant to or present in this segment. The risk factor of 86 represents a high-risk site. Follow up field inspection of this site confirmed the high buckling risk assessment and led to follow up action by local forces. In a recent full system application on the BNSF Railroad in the US [8], 24,200 track miles were analyzed, divided into 133,012 segments, with an average segment length of 0.30 km. For each of these segments, data was collected from BNSF and external databases as shown in Figure 4. The risk analysis identified 30 segments (0.02% of system) considered very high risk with index values greater than 80 [see Figure 5] and an additional 961 segments (0.72% of system) considered high buckling risk with index values of between 70 and 79. The 30 very high-risk segments underwent immediate inspection by local forces. As a result of these follow up inspections, 9 of the 30 segments (30%) were destressed (rail removed) immediately (see Figure 6). Several additional BuckleRisk runs were made through the summer hot weather season (June through August), which likewise identified high-risk areas for destressing and observation. Overall, the application of the BuckleRisk model on BNSF identified over 100 very high risk sites during the 2004 buckling season, contributing to the 2004 work year having the lowest number of track buckling derailments in recent BNSF history.
WCRR2006 5
Track Geometry
The current approach for assessing the safety of railway track includes the inspection of track geometry, usually with the use of an automated track-recording car. Track geometry measurements, such as gage, surface, alignment, cross level, and twist, are measured and compared with predefined limits, usually railway or government defined standards. These standards, while often loosely based on the dynamic behavior of select rail vehicles, are generally defined based on what can actually be measured by the recording cars, rather than what conditions increase the risk of vehicle/track related derailments.
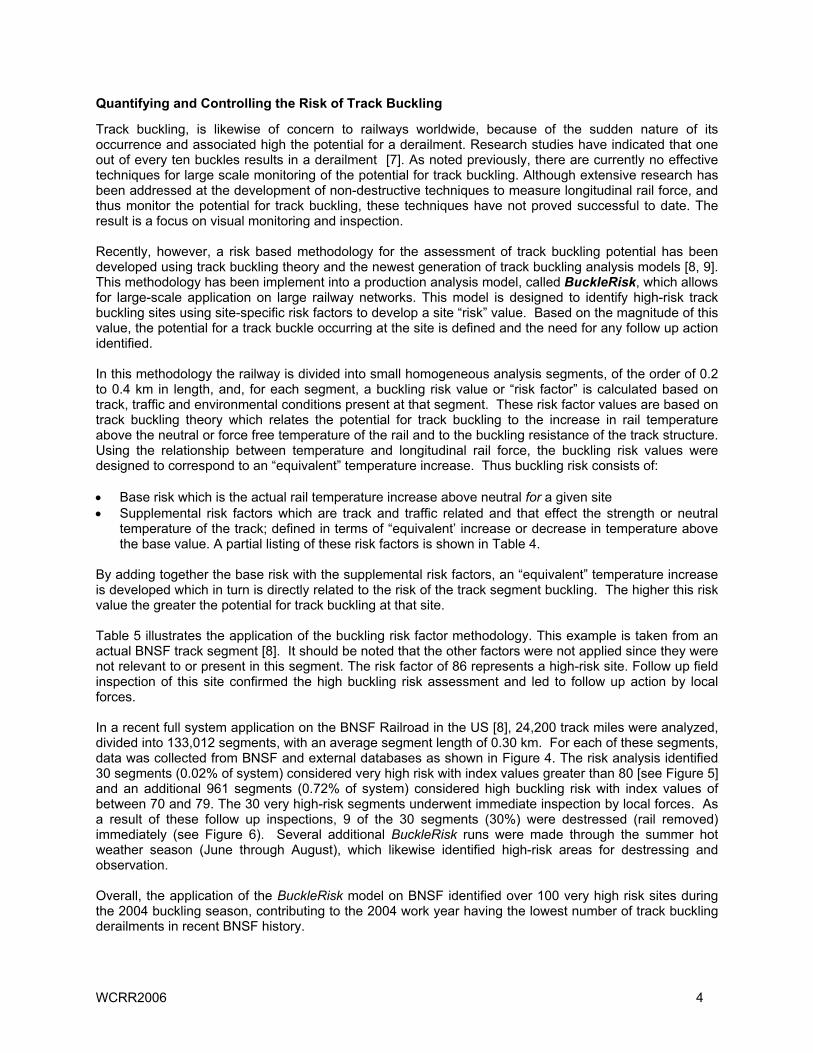
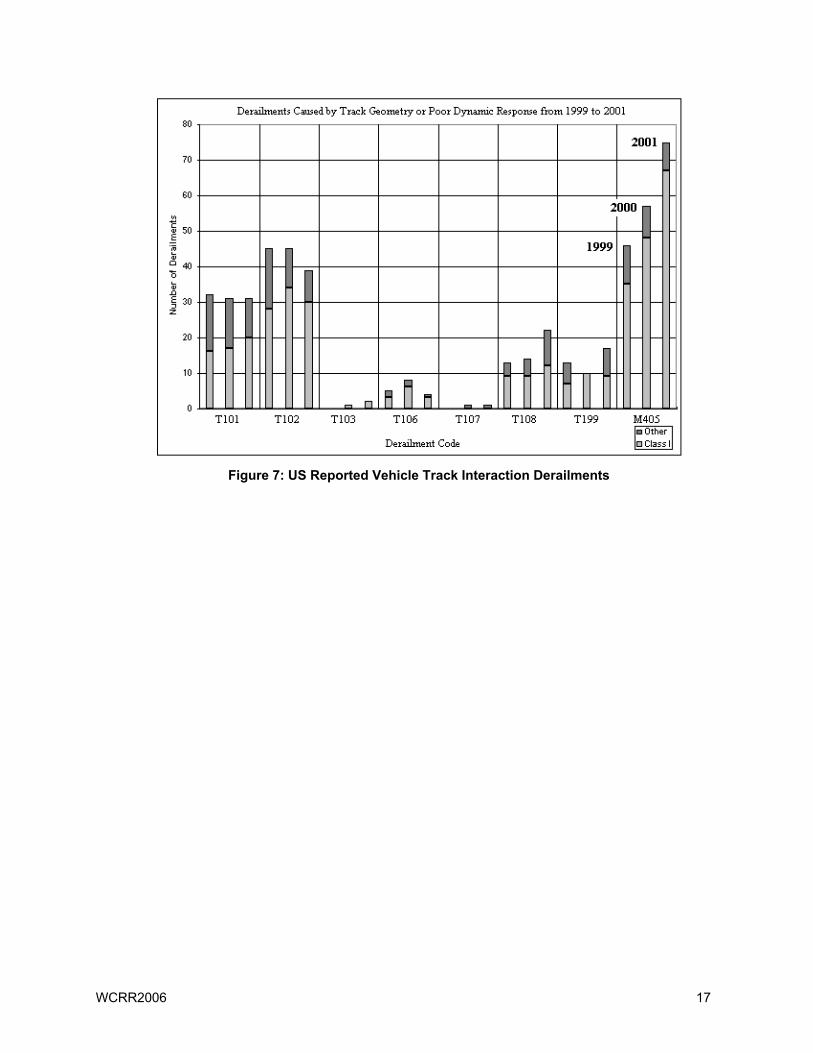
This approach, while effective, in general, still does not capture all of the conditions that can lead to a vehicle/track related derailment. This can be clearly seen in Figure 7, which shows a three-year history of US derailments that were reported to be caused either by track geometry problems or by poor dynamic response of the rail vehicle. Derailments caused by poor rail vehicle dynamics make up a significant percentage of those reported as geometric or dynamic causes3.
Here too a need for a more focused, risk-based approach was identified. Specifically, a method for assessing track geometry based, not only on static geometry standards, but also on the interaction between the track and vehicle. This endeavor has led to the development of dynamic simulation model that is used to perform this real-time analysis using a continuous input stream of track geometry data (on the track geometry car). The objective is to identify locations producing unsafe vehicle performance in the field and provide the railroad with an immediate defect report that will allow them to take fast corrective action.
In order to be a practical and effective system, any such real time analysis tool must identify locations in track likely to result in dynamically unsafe vehicle performance. Such a system must be capable of running in real-time on board a track geometry vehicle traveling at full track speed and to simultaneously different vehicle types and speeds. This is to ensure a comprehensive analysis that takes into account the variations in vehicle response due to such attributes as truck spacing, weight, and variations in truck suspension characteristics, etc. The desire to assess track safety for a range of simulated speeds stems from the fact that not all derailments occur precisely at track speed; many occur during operations well below posted speed limits.
The resulting system, TrackSafe, has the capability of simultaneously simulating several vehicle types with each vehicle being analyzed over a range of traveling speeds [10-13]. This is illustrated in Table 6, which shows that up to 60 vehicle-speed combinations can be analyzed simultaneously at a test speed of 60 mph (100 kph).
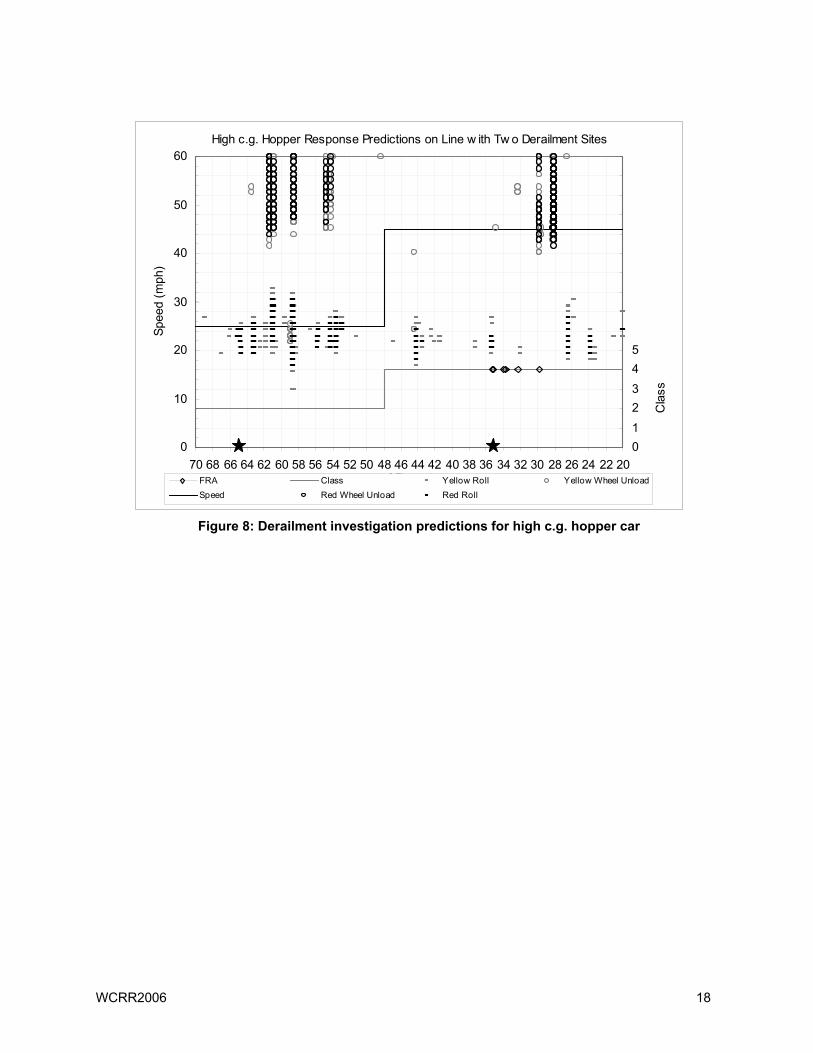
Using the measurements of surface and cross-level that are input to TrackSafe, the model generates response predictions for the car body bounce, roll angle, pitch angle, vertical acceleration, and vertical wheel. These values are determined on a foot-by-foot basis for every foot that input geometry data is supplied. Using established thresholds for these values, response predictions are assessed to determine if the rail vehicle is well behaved, or if it exhibits significant derailment potential. A recent analysis of a rail line which had experienced several geometry related derailments was performed using TrackSafe [13]. Figure 8 shows results from the derailment investigation. In this analysis, the two derailment sites were both flagged with “red” roll violations over a range of speeds. This result further showed the importance of testing at a wide range of operating speeds and not just at track speed. It was only in the small range of speeds from 20 to 25 miles per hour where red level roll warnings were predicted.
However, examination of the derailment investigation results in Figure 8 shows that there were more locations flagged with red-level dynamic response warnings than just the two places where the
3 US FRA derailment causes: T101 Cross level of track irregular (at joints), T102 Cross level of track irregular (not at joints), M405 Interaction of lateral/vertical forces (includes harmonic rock off)
WCRR2006 6
derailments took place. In total, over the 50-mile segment, there were 16 unique locations identified as being likely to produce unsafe response. Thus, an important issue is the ability to prioritize the list of track locations expected to produce potentially unsafe response. The resulting prioritization index can be used to determine which of the locations identified by TrackSafe are the most critical. Given constraints on time and money, this prioritization index is a key factor in the decision-making process regarding track repair and maintenance. Table 7 presents the TrackSafe prioritization index as applied to the 16 high-risk locations. Note: Both of the derailment sites received a full rating of 100. One other site also was rated with a 100. This location rated highly due to the curvature and the wide range of speeds predicted to lead to poor response. All other locations received priority ratings ranging from 78.8 to 23.65. With such a list, the railroad has better information about which locations are the most in need of attention.
Another recent real time implementation, performed on a major US railroad at track speeds of 50 mph (83 kph), examined four different railway vehicle models each with 21 speeds being simulated. TrackSafe was able to conduct the 84 simultaneous simulations in real-time aboard the geometry vehicle and identify a number of locations throughout the line that resulted in poor (red-level) dynamic response predictions for each car and varying speeds. This included sites where traditional track geometry defects were not identified, but where observation of dynamic behavior of vehicles, confirmed high dynamic activity. The results over a 152-mile line segment are shown in Table 8, which shows 21 unique locations flagged by TrackSafe due to predictions of poor dynamic response (red violations). This amounts to an average of one (1) flagged track location every 7.23 miles over the 152-mile line. It should be observed that no one-car type flagged all 21 locations. This finding shows the importance of testing the track for multiple vehicle types simultaneously.
Summary
These risk based assessment tools have been shown to contribute directly to a reduction in track failures (broken rails, track buckles) and their associated derailment classes through their ability to selectively identify high risk locations and bring remedial action to bear on these identified locations. All three of these models rely on research that has been developed over the last several decades, and the resulting body of knowledge on the theory behind these track failure modes. All of these models are designed to be applicable in large-scale applications, to identify potential failure sites across an entire route, division or railway system. Applications up to 25,000 miles (40,000 km) have been made using these risk analysis tools across an entire rail network. The results have been clear and impressive. Use of risk-based test scheduling techniques reduces the risk of derailments. In the case of broken rail derailments, use of risk based assessment and rail test scheduling allows for the determination of optimum rail test intervals, per segments of track, based on a defined level of risk for that segment. The result has been a demonstrated reduction in the rate of broken rails and broken rail derailments by 30% or more. Furthermore, the use of service defect rate based risk definitions also defines the maximum allowable risk for different classes of track. Thus, appropriate levels of risk are quantified, thus allowing for comparison of current defect levels with “desired” levels, such as 0.06 to 0.08 for freight only routes, 0.04 to 0.06 for freight lines with limited passenger traffic, and 0.01 to 0.001 for passenger dominated lines, with higher speed lines requiring lower allowable levels of risk. Likewise, full-scale applications of the buckling risk assessment model resulted in a high percentage of high risk sites identified for immediate action by local forces. On one major railway application, between 30 and 50% of the identified sites were the subject of immediate corrective action by local forces. This railway likewise reported a dramatic reduction in both track buckling related derailments and track buckling incidents.
The use of risk based assessment techniques represents a new approach to identifying locations with high potential for failure, and allows railways to more efficiently utilize their resources to manage safety and control risk.
WCRR2006 7
References:
1. Orringer, O. and Bush, M. W., “Applying Modern Fracture Mechanics to Improve the Control of Rail Fatigue Defects in Track”, Bulletin of the American Railway Engineering Association, Bulletin 689, Volume 84, September 1982. 2. Zarembski, A. M., “Rail Defect Type vs. Derailment Risk”, Tracking R&D, Railway Track & Structures, July 1988.
3. Orringer, O., “Control of Rail Integrity By Self-Adaptive Scheduling of Rail Tests”, US Department of Transportation Federal Railroad Administration Report, DOT/FRA/ORD-90/) 05, June 1990. 4. Zarembski, A.M., Palese, J.W., “Risk Based Ultrasonic Rail Test Scheduling: Practical Applications in Europe and North America, Conference Contact Mechanics and Wear of Rail/Wheel Systems (CM2003), Gothenberg, Sweden, June 2003. 5. Zarembski, A.M., Palese, J.P., “Characterization of Broken Rail Risk for Freight and Passenger Railway Operations”, 2005 AREMA Annual Conference, Chicago, IL, September 25-28, 2005 6. Palese, J.W., Zarembski, A.M., “Practical Applications of Risk Based Ultrasonic Rail Test Scheduling in Europe and North America, Asset Management for Railway Infrastructure Asia 2005, Singapore, February 23-24, 2005. 7. Zarembski, A. M., and Magee, G., “An Investigation of Railroad Maintenance Practices to Prevent Track Buckling”, American Railway Engineering Association 80th Annual Technical Conference, Chicago, IL, March 1981. 8. Zarembski, A.M., Grissom, G.T., Henry M. Lees, “Development of Track Buckling Risk Analysis Methodology”, AREMA 2004 Annual Conference & Exposition, Nashville, TN, September 19-22, 2004. 9. Zarembski, A.M., Grissom, G.T., Lees, H.M., “Assessing the Risk of Track Buckling”, Railway Track & Structures Magazine, February, 2005. 10. Bonaventura, C. S., Palese, J. W., and Zarembski, A. M., “Intelligent System for Real-time Prediction of Railway Vehicle Response to the Interaction with Track Geometry”, Proceedings of the 2000 ASME/IEEE Joint Railroad Conference, pp. 31-45, April 2000. 11. Bonaventura, C. S., Palese, J. W., and Zarembski, A. M., “Real-time Prediction of Railway Vehicle Response to the Interaction with Track Geometry”, Implementation of Heavy Haul Technology for Network Efficiency - Proceedings of A Specialist Technical Session, pp. 5.1-5.9, May 5-9, 2003. 12. Bonaventura, C. S., Palese, J. W., and Zarembski, A. M., “Performance of a Track Geometry Car Based Real-Time Dynamics Simulator using Multiple Vehicle Types”, Proceedings of the IMECE 2003: 2003 ASME International Mechanical Engineering Congress and Exposition (IMECE ’03), November 16-21, 2003. 13. Bonaventura, C. S., Palese, J. W., and Zarembski, A. M., “TRACKSAFE: A Track Geometry Car Based Real-Time Dynamics Simulator”, Proceedings of ASME JRC2005 2005 Joint Rail Conference, March 16-18, 2005, Pueblo, Colorado
WCRR2006 8
Risk
[service defects (rail breaks)/mile/year]
Traffic Type
0.09 to 0.10 General freight route (no passenger or Hazmat4)
0.07 to 0.08 Key freight line
0.06 to 0.07 Freight route with Hazmat but no passenger traffic
0.04 to 0.06 Freight with limited passenger traffic
0.01 to 0.03 Low-speed passenger route (less than 90 mph)
0.005 to 0.01 Moderate-speed Passenger route (90 to 125 mph)
0.001 High speed passenger line route (125 mph and higher)
Table 1: Broken Rail Risk Guidelines
Mainline Tracks Only Pre-
RailTest Post
RailTest Reduction
Number of Derailments 19.4 13.4 32% Derailments/mile 0.00085 0.00057 33%
Service defects/mile/year 0.12 0.071 41% Detected defects/mile/year 0.66 0.61 8%
Table 7: Prioritization Indices for Locations Flagged for Poor Response
Milepost SET MET LET EBC JCH
26.13 X X X 69.92 X 73.28 X 91.74 X
102.39 X 107.18 X X 107.51 X X 107.59 X 107.70 X X 115.01 X 123.48 X X X X X 128.98 X 131.83 X 133.95 X 134.18 X X X 134.20 X 134.64 X 134.78 X 136.64 X X 137.02 X 151.31 X
Table 8: Predictions of Poor Dynamic Response by Vehicle Type
WCRR2006 12
Derailments/mile vs Service defects/mile/yr (RailTest)1996-2004
0.000000
0.000500
0.001000
0.05 0.1
S/mile/yr
Der
ailm
ents
/mile
Figure 1: Derailment Rate vs. Service Defects (1995 – 2003)
Service defects/mile/year vs Test Miles
0
0.05
0.1
40000 50000 60000 70000 80000 90000 100000
Test Miles (normalized)
Serv
ice
defe
cts/
mile
/yr
Figure 2A: Service Defect Rate vs. Test Miles (normalized)
WCRR2006 13
Derailments vs Test Miles
0
10
20
30
40000 50000 60000 70000 80000 90000 100000
Test Miles (normalized)
Der
ailm
ents
Figure 2B: Derailments vs. Test Miles (normalized)
BNSF Service Defect Rate vs Derailment Rate
0
0.05
0.1
0.15
0.2
0.25
1995
1996
1997
1998
1999
2000
2001
2002
2003
year
Serv
ice
defe
cts/
mile
/yea
r
0
0.0002
0.0004
0.0006
0.0008
0.001De
railm
ents
/mile
ServiceDef/mile/yrDerail/mile
Figure 3: Derailment Rate vs. Service Defect Rate, US Class 1 RR (1995 – 2003)
WCRR2006 14
Figure 4: BuckleRisk Data Sources
WCRR2006 15
Figure 5: BuckleRisk Output
WCRR2006 16
Risk Factor Sub Division Name Line
Segment BMP EMP Action Taken
Notes
82 AURORA 3 98.23 98.38 Y Destressed 04/12/04, 1" out80 AURORA 3 180.93 181.11 Y Destressed 04/16/04, 0.5" out84 VALLEY 5 0 0.15 No Field inspected, nothing found, discrepancies w / data 80 KOOTENAI RIVER 36 1,402.22 1,402.42 Y Destressed 4 locations, 8.5" out80 SEATTLE 51 10.39 10.51 No Destressed 09/24/03, 1" out80 SEATTLE 51 10.4 10.51 No Destressed 12/02/03, 3.5" out82 SIOUX CITY 144 108.09 108.11 No Destressed on 7/29/0380 SIOUX CITY 144 105.31 105.62 No Notes stating reason for no destress81 MARSHALL 197 144.53 144.67 Y Destressed TNT 04/22/0483 RED RIVER VALLEY 485 147.39 147.54 Y Destressed but no date, 2" out83 RED RIVER VALLEY 485 236.3 236.65 Y Destressed but no date, 2" out81 RED RIVER VALLEY 485 139.74 140.07 No Destressed but no date, 1.5" out81 RED RIVER VALLEY 485 144.55 144.83 No Destressed but no date, 2" out80 THAYER SOUTH 1,001 495.81 496.06 No Still need to w ork on 1 Work Order, 6.5" out82 CHICKASHA 1,003 721.69 721.95 No Destressed but no date.81 CHICKASHA 1,003 720.87 721.22 No Destressed but no date.80 ST JOSEPH 3,000 205.91 206.1 No Is 0'45" curve not 5 degree curve80 CHILLICOTHE 7,000 36.29 36.41 No retied in 2003 w ith new ins jt cut in and 0" rail added 80 CHILLICOTHE 7,000 37.06 37.2 No retied in 2003 w ith new ins jt cut in and 0" rail added 80 MARCELINE 7,000 264.47 264.69 Y Destressed 4/16/04, 2.5" out83 PANHANDLE 7,100 497.34 497.39 No Gave 2 Work order numbers. No dates of action83 PANHANDLE 7,100 489.8 490.02 No Gave 2 Work order numbers, 4.5" rmvd. On 1 WO.83 SLATON 7,107 38.65 38.83 No Mail Note: Location of TO not in res. area. (?)85 ARKANSAS CITY 7,400 261.05 261.25 No Note: no rail added locations remaining81 RED ROCK 7,400 416.56 416.74 Y Removed 2" w hen w elding joint85 GALVESTON 7,500 24.24 24.57 No Destressed 11/19/0380 GALVESTON 7,500 125.95 126.16 No Destressed 11/25/0383 LAMPASAS 7,508 218.72 218.89 Y Destressed 03/31/04, 0.5" out81 LAMPASAS 7,508 272.2 272.34 No Destressed 07/02/03, 2.25" out81 LAMPASAS 7,508 394.25 394.41 No Destressed 11/12/03
30 High Risk Sites Reported: Action Taken on 9 sites ( 30%)
High Risk Segment Report of February 2004 and Follow Up Action
Figure 6: High Risk Segment Report of February 2004 and Follow Up Action
WCRR2006 17
Figure 7: US Reported Vehicle Track Interaction Derailments
WCRR2006 18
Figure 8: Derailment investigation predictions for high c.g. hopper car
High c.g. Hopper Response Predictions on Line w ith Tw o Derailment Sites