Managing Risks in Consumer Credit Industry A working paper submitted to “Policy Conference on Chinese Consumer Credit” on August 7, 2004 in Beijing, China Jack Niu 1 Executive Vice President MBNA America Wilmington, Delaware U.S.A. June 2004 Abstract In the past 10 years, the value of consumer credit industry in the US has doubled reaching a spectacular level of US$2,000+ trillion by 2003. Meanwhile, the risk management of consumer lending industry has been becoming more and more critical to protect the interest of both lenders and consumers. The risks of consumer credit industry consist of two major categories: credit risk and systemic risk. Both risks are tightly related to the regulatory environment of this industry. This paper focuses on the practice of credit risk management, the systemic risk prevention, and the corresponding regulatory measures. Case studies and practices in credit card will be used to illustrate these focus points. During the recent two decades, the credit risk management strategies, especially for credit card, have been becoming more and more sophisticated with the availability of statistical models, credit scores, and analytical tools. Automatic credit decision-making strategies in acquisition underwriting and complicated portfolio risk management strategies have been widely utilized by consumer lending institutions for most of their products, i.e. auto loans, home equity loans, and credit cards, etc. On the other hand, regulations and laws in this industry have correspondingly enhanced to prevent systemic risk proactively. In this paper, risk management theory and case studies will be discussed to demonstrate the importance of credit risk management. In addition, this paper will briefly review China’s consumer credit market, and provide a cross-examination on consumer lending regulations between the US and China. Recommendations on risk control means and key regulatory improvements in China will be made as well. Keywords: credit risk, systemic risk, charge-off, credit bureau, risk score, auto loans, credit card, credit insurance, and consumer credit regulations, etc. 1 The author would like to thank the conference organizers Professor Bruce L. Reynolds and his assistants of the Department of Economics, University of Virginia and Professors Justin Yifu Lin and Minggao Shen of the China Center for Economic Research (CCER). The author is also grateful to the sponsors of the conference – the CCER, the Chinese Economist Society, the International Finance Corporation, the Filene Research Institute, the Center for Credit Union Research at University of Wisconsin, and CUNA Mutual Group in the USA. The views and conclusions in this paper only represent the author’s own opinion. The author reserves all rights. Please send correspondence directly to: [email protected] via email.
Transcript
Managing Risks in Consumer Credit Industry
A working paper submitted to “Policy Conference on Chinese Consumer Credit” on August 7, 2004 in Beijing, China
Jack Niu1
Executive Vice President MBNA America
Wilmington, Delaware U.S.A.
June 2004
Abstract In the past 10 years, the value of consumer credit industry in the US has doubled reaching a spectacular level of US$2,000+ trillion by 2003. Meanwhile, the risk management of consumer lending industry has been becoming more and more critical to protect the interest of both lenders and consumers. The risks of consumer credit industry consist of two major categories: credit risk and systemic risk. Both risks are tightly related to the regulatory environment of this industry. This paper focuses on the practice of credit risk management, the systemic risk prevention, and the corresponding regulatory measures. Case studies and practices in credit card will be used to illustrate these focus points.
During the recent two decades, the credit risk management strategies, especially for credit card, have been becoming more and more sophisticated with the availability of statistical models, credit scores, and analytical tools. Automatic credit decision-making strategies in acquisition underwriting and complicated portfolio risk management strategies have been widely utilized by consumer lending institutions for most of their products, i.e. auto loans, home equity loans, and credit cards, etc. On the other hand, regulations and laws in this industry have correspondingly enhanced to prevent systemic risk proactively. In this paper, risk management theory and case studies will be discussed to demonstrate the importance of credit risk management. In addition, this paper will briefly review China’s consumer credit market, and provide a cross-examination on consumer lending regulations between the US and China. Recommendations on risk control means and key regulatory improvements in China will be made as well. Keywords: credit risk, systemic risk, charge-off, credit bureau, risk score, auto loans,
credit card, credit insurance, and consumer credit regulations, etc.
1 The author would like to thank the conference organizers Professor Bruce L. Reynolds and his assistants of the Department of Economics, University of Virginia and Professors Justin Yifu Lin and Minggao Shen of the China Center for Economic Research (CCER). The author is also grateful to the sponsors of the conference – the CCER, the Chinese Economist Society, the International Finance Corporation, the Filene Research Institute, the Center for Credit Union Research at University of Wisconsin, and CUNA Mutual Group in the USA. The views and conclusions in this paper only represent the author’s own opinion. The author reserves all rights. Please send correspondence directly to: [email protected] via email.
Table of Contents
List of Tables ..................................................................................................................... 3
List of Figures.................................................................................................................... 3
Part 1. Introduction ......................................................................................................... 4
Part 2. Managing Underwriting Risk, Portfolio Risk and Systemic Risk .................. 5
2.1 A Brief Review of the US Consumer Credit Market .................................................. 6 2.2 Risk Assessment and Credit Scores........................................................................... 10 2.3 Managing Underwriting Risk ................................................................................... 13 2.4 Managing Portfolio Risk and Using Automation System ......................................... 17 2.5 Decomposing the Dollar Loss Rate within an Organization .................................... 21 2.6 Managing Systemic Risk and the Role of Consumer Credit Regulations & Laws.... 23 2.7 Summary ................................................................................................................... 25
Part 3. Case Studies on Credit Card ............................................................................ 26
3.1 Citibank in India: Launching Credit Card in an Emerging Market........................ 26 3.2 LG Card of Korea: a Lesson for China’s Consumer Credit Market ........................ 28 3.3 NextCard of USA: An Innovator’s Cost.................................................................... 31 3.4 Summary ................................................................................................................... 32
Part 4. Chinese Consumer Credit Industry................................................................. 33
4.1 A Brief Review of the Chinese Consumer Credit Market ......................................... 33 4.2 Credit Risk Management........................................................................................... 37 4.3 Cross-examination on Regulations and Laws........................................................... 37 4.4 Recommendations ..................................................................................................... 37 4.5 Summary ................................................................................................................... 37
Part 5. Conclusions ........................................................................................................ 37
Consumer credit is one of the major markets in the US economy. Consumer credit is broadly understood to mean any of the many forms of commerce under which an individual obtains money or goods or services to repay the money or to pay for the goods or services, along with a fee or interest at some specific future date or dates. The US consumer credit market has shown that economic stability based on sound fundamentals will bring economic prosperity, high employment rate, low interest rates, and increased demand for credit by consumers. Over the past decade, the US consumer credit market has grown significantly. By the end of 2003, the US consumer credit market has reached US$2,000 trillion doubling that of 1993. For most, credit cards and other secured and unsecured lending have provided people with greater control and flexibility when managing their finances while collectively benefiting the economy.
The sound fundamentals of the US consumer credit market associate with a fair, safe, and competitive market environment that supports the consumers, communities, lenders, and economy of the United States. Such environment is possible should the regulations and laws protect the rights of consumers and lenders, the market invest on state-of-the-art science and technology, the governing agent stand up for fair and open market practice, and consumers and lenders have the mutual trust. The evolution of the US consumer credit market reflects the development of such sound fundamentals. From 1971’s first consumer credit protection law – Equal Credit Reporting Act, to the current personal bankruptcy law revision, a series of regulations and laws have been implemented just to ensure a fair and safe market environment for the consumer credit market. On the other hand, lenders have dramatically improved their ability to compete in a fair lending environment. Among all the improvements, managing risks with sophisticated tools is one of the most important improvements that enable the lenders to open the market to all the consumers at a controllable risk level.
Managing risks in the consumer credit market is one of the critical dimensions to ensure the industry grows within a healthy environment. Effective regulations and laws will provide a safeguard for the industry from systemic risk, whereas sophisticated credit risk policy, strategies, and tools will provide institutions and consumers with risk protections. In this paper, managing risks in consumer credit industry is the primary focus.
In Part 2, there will be discussions on two major forms of credit risk: underwriting risk and portfolio risk. Both theoretical descriptions and the most commonly used practice in managing credit risk in the US will be revealed. In addition, systemic risk and the regulatory environment in the US consumer credit market are also going to be discussed.
To illustrate different scenarios discussed in Part 2, three case studies in credit card industry will be demonstrated in Part 3 so that the reasons behind both successful and failed stories in managing different types of risks around the world can be understood.
In Part 4, brief review on current situation in Chinese consumer credit market and comparisons between the US and China will finally lead to several recommendations to the policy makers in the Chinese consumer credit industry.
Part 2. Managing Underwriting Risk, Portfolio Risk and Systemic Risk
Growth in consumer credit market can hold either positive or negative implications for the economy and markets. The consumer credit markets in the US and Korea, which we will discuss in the case studies later, are two outstanding examples to illustrate such implications. Economic activity is stimulated when consumers borrow within their means to buy cars and other major purchases. On the other hand, if consumers pile up too much debt relative to their income levels, they may have to stop spending on new goods and services just to pay off old debts otherwise they may experience financial difficulties to pay the lenders. Lenders, who failure to or less capable to identify consumers’ ability to payback, may associate with a weak risk control system.
The demand for credit also has a direct bearing on interest rates. If the demand to borrow money exceeds the supply of willing lenders, interest rates rise. If credit demand falls and many willing lenders are fighting for customers, they may offer lower interest rates to attract business. The US consumer credit today is experiencing the second scenario, especially the credit card industry. The sacrifice on the interest income may often be compensated by the improvement of the asset quality so that the effective profitability of the lender would not suffer in a long-term run. This requires an accurate risk assessment system and a corresponding underwriting risk criteria so that lenders can survive in the current price competition in the US consumer credit market.
The risks of consumer credit industry consist of two major categories: credit risk and systemic risk. The credit risk in general is an estimate of the probability that a borrower will not repay all or a portion of a loan on time. Systemic risk is often used to describe the risk of a sudden, unexpected event that would harm the financial system to an extent that economy may suffer. The assessment of credit risk can be done in two stages in most cases: 1) loan application and underwriting, and 2) during the course of the loan payment. In the first case, the lender can only assess the credit risk by studying the borrower’s credit history, while in the second case, the lender can not only continue to examine the credit history, but also monitor the current payment behavior to better assess the credit risk. Commonly, lenders refer to the first stage as underwriting risk management, and the second stage as the portfolio risk management. The portfolio risk management is particularly critical for revolving products, such as credit card, whose loan outstanding is purely driven by the behavior and financial situation of the consumers. Both credit risk and systemic risk are also tightly related to the regulatory environment.
In this Part 2, the paper will focus on the current US consumer credit market starting with a brief market review followed by the introduction of credit scores, underwriting risk management, portfolio risk management, and regulation and laws in relation to the systemic risk management.
2.1 A Brief Review of the US Consumer Credit Market
Overview
Outstanding consumer credit accounts for over two-thirds of the U.S. gross domestic product (GDP). Consumer credit is supplied by a combination of banks, financial services companies, insurance companies and retailers. Of these, banks dominate the market. Banks also securitize their loans through finance companies, and consumer credit is then a financial instrument exploited by the financial markets. In most cases, consumer credit is a low-risk asset, particularly when secured against property. Unsecured credit is usually checked by credit scoring software before being granted, ensuring that most mainline lenders have low levels of bad debt.
The consumer credit market in the US reached US $2,000 trillion in 2003. The primary products are mortgage loans, auto loans, personal finance loans, and credit cards, etc. There are supplementary products associated with the US consumer credit market, such as credit insurance and fee-based products for retail merchandise and services. In 1970s, US government created Government Sponsored Enterprises (GSE) to provide secondary market built on top of the consumer credit products. This secondary consumer credit market has also grown significantly along with the consumer credit market, and it stabilizes the US economy, especially in times of economic distress.
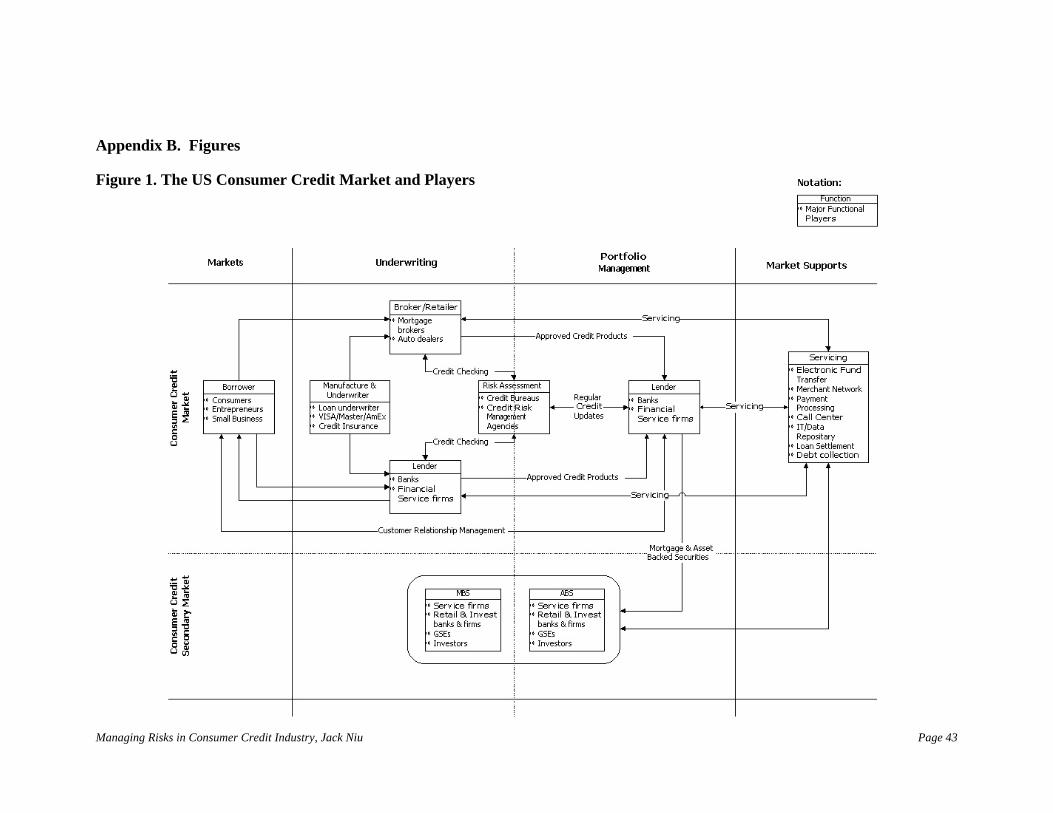
As shown in a conceptual illustration in Figure 1, the consumer credit market in the US involves multiple dimensions of functions with each function having several major players. In general, retail banks dominate the markets for mortgages, remortgages, personal loans, auto loans, and credit cards. While the investment banks and investment companies dominate the secondary market of the consumer credit products, that is the security markets in which asset backed securities (ABS) and mortgage backed securities (MBS) are the primary products. In this section, this paper will briefly review the major functions and major players in the US consumer credit market and the issues this market is facing.
Major Functions and the Players
As shown in Figure 1, the major functions in the US consumer credit market include: credit product underwriting and manufacture, brokerage and retail, lender, risk assessment, and servicing. Each of these functions has its unique role in the consumer credit market supported by the players within that function. For example,
• Lender: the function of the lender is to drive the growth of the consumer credit market. The major players are retail banks and financial services companies. For
example, top 10 US banks dominate the mortgage and auto loan markets, while specialized financial services companies, i.e. MBNA America, Capital One, etc. share significant market with the top US retail banks in the credit card market.
• Broker and Retailer: The function of the broker and retailer in this market is to provide consumers with convenience of access to credit products. Typical players are automobile dealers for auto loans and mortgage brokers to provide branch services for mortgage and refinance.
• Risk Assessment: The function of the risk assessment is to provide critical information for brokers, retailers, and lenders on the credit worthiness of consumers. The primary players in this function are credit bureaus2 and credit risk management agencies. Fair Isaac, Corp. (FICO) has been the leading analytical solution firm in the US in the credit risk management area. FICO provides wide range of services including credit scoring, risk strategy development, and analytical services. The FICO credit score has been widely used by the consumer credit lenders while making credit decisions. The classic statistical modeling techniques used in FICO has been extensively utilized among the lenders. Recent development in neuro-network technology to predict fraudulent behavior has also shown a convincing record as a new way to detect credit risk. We will discuss the major credit bureaus in the US in the next section.
• Credit Checking: The processes between credit bureaus and lenders are basically checking the credits of consumers at both underwriting stage and portfolio management stage. Credit scores are normally checked at the time of underwriting risk assessment. Once a credit request is approved, lenders normally periodically check the credit scores at either quarterly or monthly basis depending upon the type of the credit product and the risk level of the consumer.
• Manufacture and Underwriter: The manufacture and underwriter provide the credit products. For example, VISA and MasterCard provide credit cards to banks and credit card companies as a credit product to sell to consumers. American Express, on the other hand, runs its won credit product – T&E credit card parallel to VISA and MasterCard in this market. Many insurance companies also provide credit related products. One of the examples is the credit insurance, which provides consumers with insurance against default in the case of difficulties in a life event, and offers lenders with a complementary product for additional revenue resources. Credit insurance is one of the revenue generating products for the credit lenders. There are many forms of credit insurance to protect consumers from potential financial difficulty. Meanwhile, credit lenders share the exceptionally high revenue with the underwriting credit insurance firms. Major players in the credit insurance market are American Bankers Insurance Group and the CUNA Mutual Group, etc.
2 There are 3 major credit bureaus in the US: EquiFax, Experian, and Trans Union. Each of these 3 credit bureaus develops risk scores that are designed to predict the default rate for each individual consumer on their file. Usually, a risk score predicts the probability of a consumer to default within the next 12 months. Detailed information about these 3 credit bureaus is available on their internet websites as listed at the end of this paper.
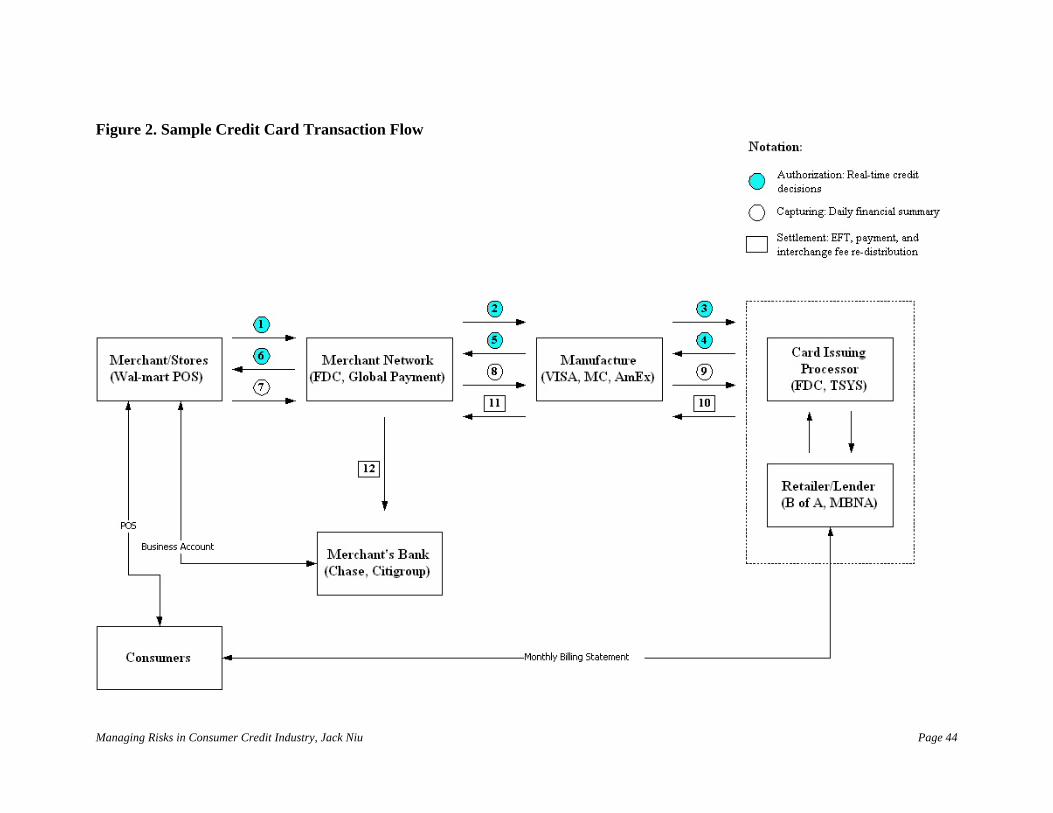
• Servicing: The servicing function plays a critical role in the entire consumer credit market. For example, the electronic fund transfer and the merchant network are the fundamental supporting players to make the consumer credit product possible. Data repository and payment processing are also critical to settle the financial relationship among the merchants, consumers, manufactures, and lenders. Call centers, loan settlement, and debt collection are crucial elements of customer service and relationship management. Sometimes, lenders contract out their data processing and repository business to other companies. Total System Services, Inc (TSYS) and First Data Corp. (FDC) are the two dominating companies in this function. In a simple example where a customer uses credit card to make a purchase in a store, many players in the servicing function will involve to complete a single transaction as shown in Figure 2. In the “Authorization” process in Figure 2, steps 1 through 6 go through the entire loop of credit decision from point-of-sale (POS), to merchant network, to VISA/MasterCard, and to the lender’s credit decision system (in the case lender contract out data process system, TSYS and FDC will normally interacts with the lender’s decision system). Based on the credit decision made at real-time, the decision is returned via the same path to POS. This entire authorization process for a single transaction normally takes about 2 to 10 seconds. At the end of each day, the merchant network in Figure 2 will summarize the financial records and send them in batches to the manufacture and lenders so that the lenders can initiate the payments according to the rules set by the manufactures. In the “Settlement” process, the lender will distribute interchange fees to each processing player according to the rules, then pay the merchant the sales amount after the fees to its bank, and at monthly basis send billing statement to the customers for the entire transaction amount.
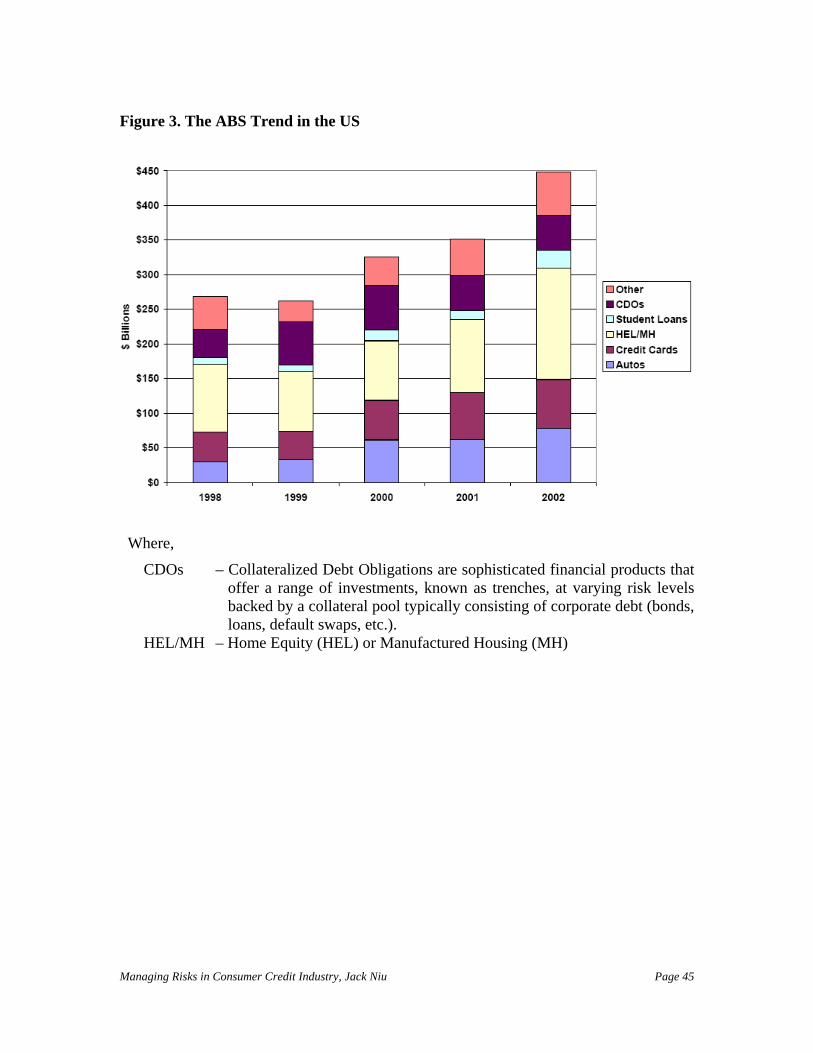
• The Secondary Consumer Credit Market: The secondary consumer credit market is based on the securitization of the consumer credit assets. There are two major categories in this market: the asset-backed securities (ABS) and mortgage-backed securities (MBS). ABS are bonds or notes backed by loan papers or account receivables originated by banks, credit card companies, or other providers of credit, but not mortgages. Similarly, MBS are bonds or notes backed by mortgages. Both the MBS and the ABS markets have been growing significantly during the past 20 years. The securitization of home equity loans (HEL) and credit card assets has been booming in the recent 10 years. Figure 3 illustrates the recent trend for the US ABS market.
The brief review above of the consumer credit market provides a general view of different functions and players in this market. There are a lot of details and important issues that should be discussed, i.e., credit checking process, credit bureau system, and secondary consumer credit market, etc. However this paper will continue to focus on managing risks in the consumer credit market. To address the current risk management issues in the US, we use credit card as the example below.
Issues in the Consumer Credit Market
As one of the major consumer credit products in the US, credit card market has drawn significant attention. Two consortia of banks, Visa and MasterCard, dominate the credit-card market and these banks are often members of both consortia. Historically, it has been difficult to enter the credit market unless the new entrant is a Visa or MasterCard member. One exception is the American Express, who issues its own credit card. With falling general interest rates the competition on pricing is getting tougher and consumer credit through credit cards has become much cheaper. However, the increasing popularity of debit cards where there is no revolving credit element in the transaction and home equity loans where lower revolving interest rates are offered, suggests that the credit card in the US is not only competing among card issuers, but also battling with other consumer credit product lines.
Along with the dramatic growth in the past decade, there have been issues generated in this market during the same time. For example, the increasing tend of personal bankruptcy filing has been one of the concerning issues in the US consumer credit market. In a recent Consumer Federation of America (CFA) report regarding the expansion of consumer credit and increase in consumer bankruptcy filings, CFA concluded a few results. For example,
• Rise of Consumer Bankruptcy: Deregulation of consumer credit on interest rates has not produced a significant decrease in interest rates. Instead, deregulation has prompted aggressive marketing and a loosening of underwriting standards that have contributed to a rise in consumer bankruptcies.
• Americans maybe in Over-indebtedness: Eighty percent of all households have at least one credit card. With well over one billion cards in circulation, the average household has about a dozen credit cards. About sixty percent of cardholders carry credit card debt from month to month. The average credit card debt for households that carry a balance is more than $10,000. Americans owe more in credit card debt than for education.
• Credit Card Issuers have contributed to the rise in Consumer Bankruptcies: The FDIC observes that by marketing high-risk debt to customers who are at substantial risk for non-payment, credit card issuers have contributed to the rise in consumer bankruptcies.
• Over-extending the credit to low-income and students: at least 50 mailings went to every America household per year resulting one-third of lower income families spend more than 40% of their income on debt repayments.
In response to this “reckless lending practices” as classified by CFA, federal regulators in the US have begun to require lenders to be more responsible. In January of 2003, the Federal Reserve Board, FDIC, and other bank regulators issued new regulations requiring credit card companies to tighten up “account management and loss allowance practices”. The underlining statement of CFA’s conclusion is that the lenders should tighten the underwriting risk criteria and enhances the ability in credit risk management activities, especially to the sub-prime consumers.
Credit Risk Management:
Among all the consumer credit management practices, credit risk management has been one of the major focuses. Credit card, in particular, has developed very sophisticated risk management tools in order to meet the challenge of this open-end revolving product driven by consumers’ economical and demographical behavior. The credit risk management usually happens in two phases: 1) underwriting risk management, and 2) portfolio risk management. In both phases, the lenders will utilize the risk assessment tools to review the credit applications. In the next section, we will first briefly review the risk assessment tools before we discuss the underwriting risk management and portfolio risk management.
2.2 Risk Assessment and Credit Scores
Risk Assessment Background and Methodology:
As mentioned at the beginning of this paper, the consumer credit means a promise to repay at some future time with fees or interests. However, the future is not predictable with perfect accuracy. In other words, not all credit debts will be repaid as agreed, which leads to the concept of credit risk. Therefore, the best way a lender can do is to make an imperfect prediction and estimate the degree of risk. Such process of prediction is called risk assessment. The goal of risk assessment is to accept only those risks that a lender considers low enough so that, over a great many of such credit applications, the lender will still be profitable.
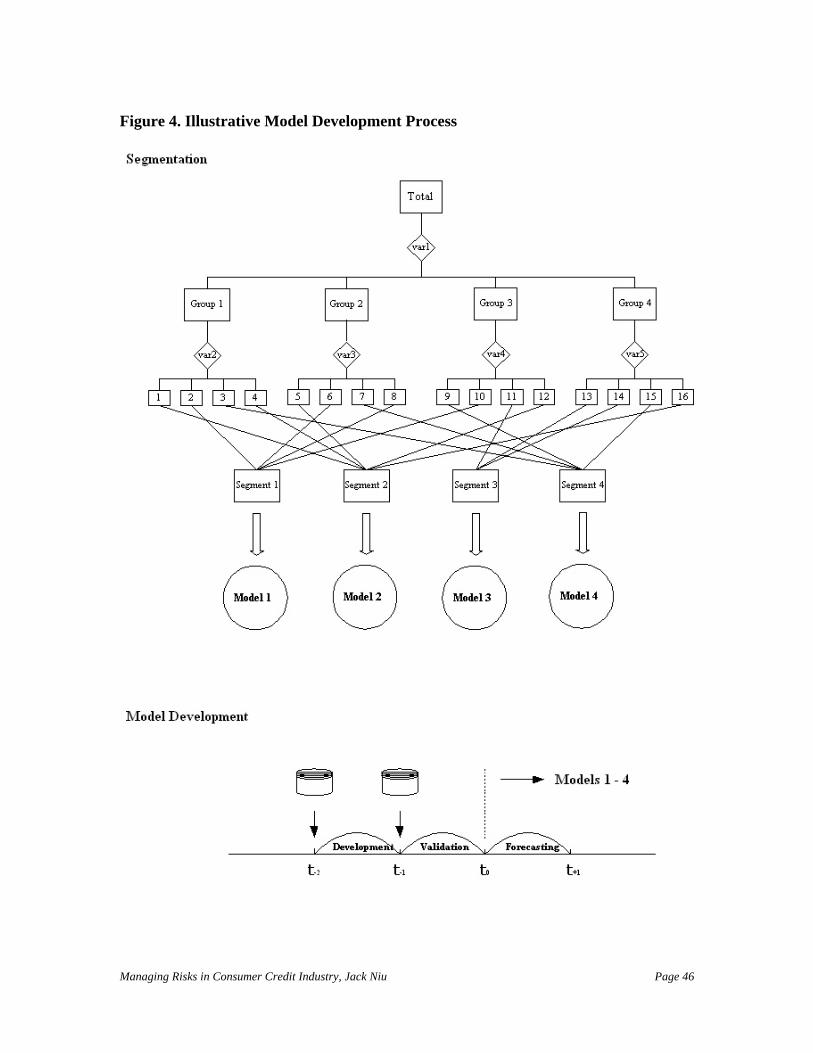
The commonly used tool today for risk assessment is credit scoring. The methodology of credit scoring is to use statistical models based on historical performance of a unique group of customers to form a formula to predict its future performance. As shown in Figure 4, there are primarily two steps to build statistical models. Since most statistical models are only applicable to “homogeneous” segments, the most common practice is to divide the total population into several homogeneous segments where consumers within each segment shares similar financial and behavioral profiles. This step is often referred to as segmentation as shown in Figure 4. Then for each segment, there will be a unique statistical model to be built to predict the credit risk.
The most commonly used statistical methodology is the logistic regression method. Logistic regression is a technique for analyzing problems in which there are one or more independent variables, which determine an outcome that is measured with a dichotomous variable in which there are only two possible outcomes. In logistic regression, the dependent variable is binary or dichotomous. The goal of logistic regression is to find the best fitting model to describe the relationship between the dependent variable – probability to default and a set of independent (predictive) variables. Logistic regression
generates the coefficients of a formula to predict a logit transformation of the probability of default as shown below:
nnX XXXn
iii ααααα ++++=∑=
=...Logit(p) 22110
0……………Equation 1
where, p is the probability of default. The logit transformation is defined as the logged odds:
Good ofy ProbabilitDefault ofy Probabilit
p1pOdds =−
= ………...……………Equation 2
and,
⎥⎦
⎤⎢⎣
⎡=
p-1pln Logit(p) ……………………………….……..…..Equation 3
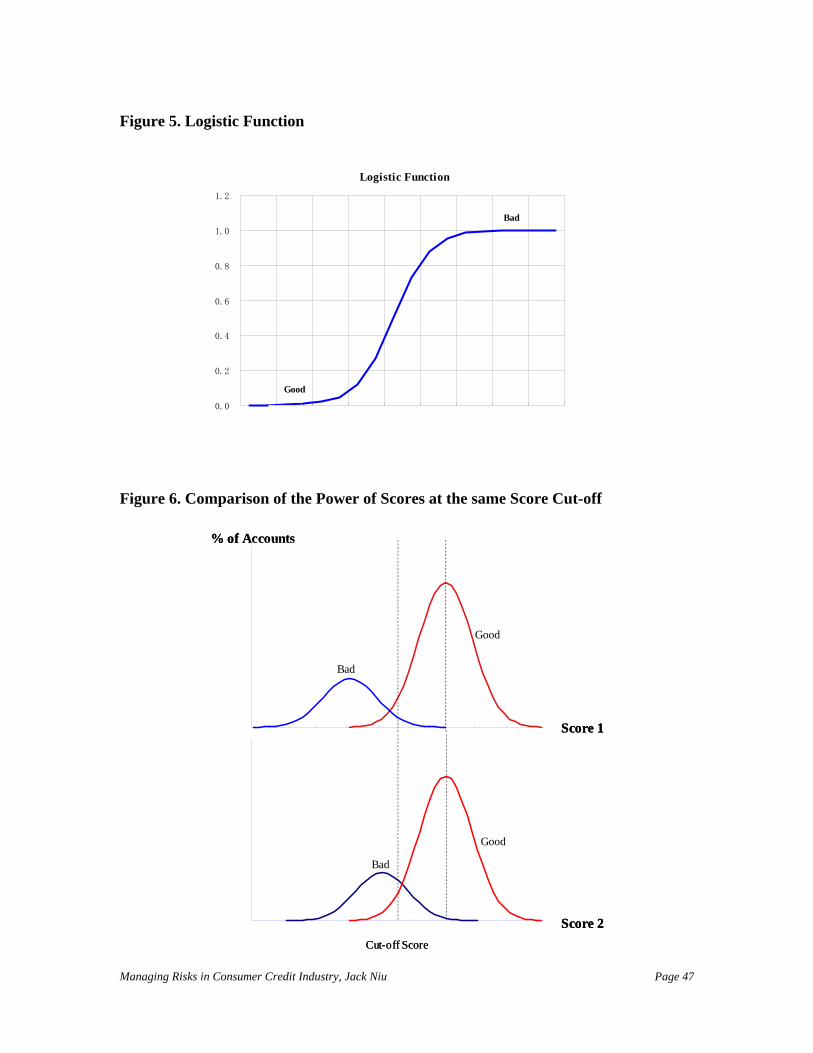
This method uses logistic function, which gives a 0 to 1 distribution as shown in Figure 5, as the basis to define default event as bad with a value of 1 and good credit history as good with a value of 0. The logistic function in this case can be written as:
∑+
−=
=
n
iii X
e 01
11Default ofy Probabilitα
………………………Equation 4
where, is the same as Logit(p) in Equation 1, which is the sum of statistically
significant variables multiplied by its coefficients. The variables can be those from hundreds of variables in credit bureau reports, or those performance variables from all the lenders.
∑=
n
iii X
0α
The logistic regression estimates the probability of default, which leads to credit scores to separate good and bad customers. The bigger the separation, the stronger the model’s predictive power. For example, in Figure 6, two scores have the same cut-off point. Score 1 sacrifices the same number of good customers as Score 2 while cutting off the majority of the bad accounts. Score 2, however, still has significant number of bad customers allowed while sacrificing the same number of good customers. This demonstrates the importance of having a credit score with strong predictive power.
Credit Scores:
Equation 4 outputs probabilities ranging from 0 to 1. However in the risk assessment environment, people tends to use scores rather than probabilities. The conversion between probability and score varies depending upon what and how people would like to construct the scores. For example, one can assign a score value of 485 for odds ratio at
1:1. In addition, one can also assign this score so that odds ratio doubles for every 40 score points. To construct such score, one can use a conversion formula as:
The FICO credit score is widely used in the US consumer market. FICO score is a credit score developed by Fair Isaac & Co and is constructed in the similar way as Equastion5. There are really three FICO scores computed by data provided by each of the three bureaus––Experian, Trans Union, and Equifax. Some lenders use one of these three scores, while other lenders may use the middle score. Credit scores analyze a borrower's credit history considering numerous factors such as:
• Late payments
• The length of time credit has been established
• The amount of credit used versus the amount of credit available
• Length of time at present residence
• Employment history
• Negative credit information such as bankruptcies, charge-offs, collections, etc.
• Major and minor derogatories
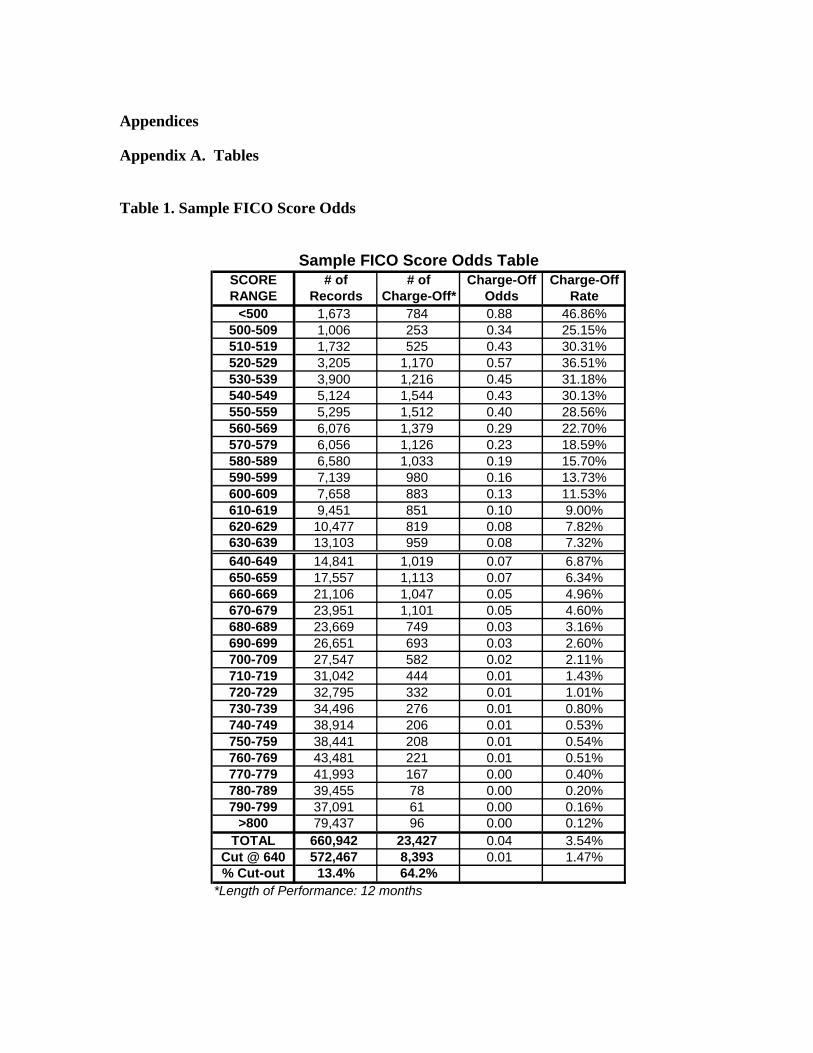
Table 1 demonstrates a sample FICO score odds table with a scenario score cut-off at 640. It is clear that setting a cut-off score at 640 at underwriting risk assessment will disqualify 13.4% of the total applications, but 64.2% of the bad applications will be declined. The total charge-off rate for all the applications through the door would be 3.54%. With the 640 cut-off, the approved application will only have 1.47% loss rate.
Besides FICO scores, there are several other scores that lenders often use to manage the credit risk as shown in Table 2. Among these scores, Behavior Score is the most popular and predictive score that is used in the portfolio management area. The major difference between Behavior Score and FICO is that Behavior Score uses the most recent performance information at monthly basis for a specific credit product. Whereas FICO uses at least 3 month old credit information for all the loans of each consumer. The Automated Credit Application Processing (ACAP) score is another score that is widely used particularly in auto loans and personal finance loans, as it considers the entire credit history of the consumers along with other credit bureau attributes.
Risk Assessment of Consumer Credit Assets:
There have been many research studies on consumer credit risk management. Most of these research studies consider the consumer credit management in primarily four different stages, i.e.
1. Credit scoring
2. Credit decision-making
3. Portfolio risk management
4. Loss forecasting & asset quality monitoring
The first stage handles the risk assessment at individual level by estimating the probability of default for each consumer. Once the risk profile of a consumer is assessed, a lender will have to make a credit decision at the underwriting. The portfolio risk management at the third stage is to minimize the losses for a consumer credit portfolio. This stage is particularly important to revolving products, i.e. credit card, which consumers have the flexibility to control the amount of credit they would like to take from the lenders. There are risk control strategies, collection tactics, and risk mitigation tools that are implemented to support the overall portfolio risk reduction. Finally, in order to provide a guideline on consumer credit asset quality, to support high level lending policies and regulations, and to comply with international conventions, i.e. New Basel II Accord, and capital allocation of corporate loan loss reserve, etc. lenders have to perform loss forecasting for the consumer credit portfolios.
This paper will focus on the credit decision-making and portfolio risk management stages although there are many researches and studies available on the loss forecasting initiatives. In the following two sections, we will discuss the underwriting risk and portfolio risk management although it is also very important to manage all four stages of the consumer credit management.
2.3 Managing Underwriting Risk
Underwriting is a multi-step process of evaluating a credit application to determine the risk involved for a lender, decision-making of credit, and writing policies to specify the risks and liabilities for both the lender and consumers. Underwriting risk is the lender’s exposure to financial losses resulting from the underwriting of a credit application to be granted. Managing underwriting risk reflects a lender’s philosophy in terms of the extent of the risk assumed, approaches in the mitigation of risks, and acceptable risk-adjusted rate of return.
Managing underwriting risk is one of the most critical functions in credit risk management. The overall credit quality of the lending portfolio can be dynamically controlled at an optimal underwriting risk level so that the desired risk-adjusted rate of return can be achieved. Managing underwriting risk is particularly critical for insurance and reinsurance companies since their underwriting policies directly impact the losses of the business without any behavioral pattern prior to the claims. Whereas lenders for consumer credit products, such as credit card, have portfolio management tools to minimize the losses after underwriting. As mentioned above, the practice of managing underwriting risk in the US consumer credit market always replicates lender’s taste of
risk–taking appetite. This is also true for the practice of the portfolio risk management, which will be discussed in the next section.
The practice of managing underwriting risk in the US has been primarily focused on accurately identifying the risk exposure of credit. Based on the risk assessment, lenders can make lending decisions and terms of the credit products according to the corresponding risk level. To assess the risk level of an applicant, lenders in the US often use risk scores from credit bureaus, internally developed risk scores, revenue or income information, and overall debt records of the applicant from credit bureaus. Depending upon the credit product an applicant applying for and the channel of a credit application, the lenders have different underwriting risk criteria to make lending decisions.
Reactive and Proactive Credit Decisions:
Auto loan applications could come through the branches of a bank, or through automobile dealers3. Since customers initiate the purchase of an automobile as well as the loan applications, the lenders are always in a reactive position. This is very different for the credit card solicitations in the US where a lender is in a proactive position and therefore has the time and options to cheery-pick the profiles of the customers it desires to target. In the reactive situation, however, a lender has to be ready to make a credit decision within a limited time frame and has to face customers with all kinds of credit profiles. This means, in order to react to the auto loan applications with a timely manner and a proper credit decision, a lender has to evaluate the credit worthiness of the applicant at real time.
Up until a decade ago, loan officers in a bank made most of the auto loan credit decisions in the US. However, such judgmental credit decision practice always associates with human errors even with specific credit policy guidelines. With the availability of credit bureau scores at real-time about 10 years ago, the lenders in the US started to implement the automatic scoring system with real-time link to credit bureaus. This type of automatic credit decision-making platform, as shown in Appendix B. Figures
Figure 1, can make decisions for the most of the loan applications with an improved accuracy of risk assessment. Besides automatic credit decision, lenders also have other underwriting risk criteria to handle loans that cannot be automatically decisioned.
In the reactive situation, lenders have to consider only those applications coming through the door, then make credit decision to take relatively good customers from this population. In the proactive situation, lenders can selectively target those customers with the desirable credit profile. The stronger the capability of risk assessment of a lender, the bigger universe of consumers this lender can face to. The benefit of proactive lending has stimulated lenders to develop sophisticated statistical models to enhance their risk assessment capability in the recent years. The following two sections will briefly review 3 Sometimes, auto loan applications coming through the bank branches are also called direct auto loans, and those coming through the automobile dealers are called indirect auto loans.
the reactive underwriting environment for auto loans and proactive credit card solicitations in the US consumer credit market.
Auto Loans Underwriting Process:
In general, an auto loan application needs to check several key decision elements. For example:
• Risk scores matrix (i.e. FICO and ACAP), and sometimes revenue score
• Applicant’s household income
• Debt to income ratio
• Total requested loan amount
• Major and minor derogatory and amount
• Bankruptcy, delinquency, and collection history ever
• Loan terms
In an automatic credit decision system, lenders normally have pre-determined underwriting risk criteria to expedite the process of loan applications. Table 3 is an illustrative example of an underwriting risk criteria based on both FICO and ACAP scores. In Table 3, applications in Zone A will be automatically declined due to their charge-off level. On the other hand, applications in Zone C will be automatically approved because of their excellent scores. Applications in Zone B, however, need additional information, such as those listed above, to make a credit decision. Credit policies can overwrite automatically decisioned applications in either way. Such overwrite process, although with a very limited occasions, is often referred to as either low-side overwrite if the automatic decision is to decline the application or high-side overwrite if the automatic decision is to approve the application. The interest rate a consumer received in the loan term may vary according to the risk level of the consumer. Such practice of the lenders to adjust the interest rate against the risk level is called risk-based pricing. This is often used in the indirect auto loan environment.
The direct auto loan always associates with a better credit risk performance than the indirect auto loan portfolio. This is because those customers who have relationship would be more likely to go to their branch than those without a bank relationship. People with a low credit score knowing that they may not be able to get an auto loan from a bank, even with a bank relationship, would ask the dealer to submit their application. Dealers often send the same application to all banks to find out who would take the risk. By nature, the indirect auto loans have a worse credit profile than the direct auto loans. However, the number of applications from indirect loans is significantly high enough for the lenders to balance the credit decision between revenue and credit risk.
Credit Card Direct Mail Processing:
In the credit card case, the credit decision-making is a proactive process. In the US, most of the new credit cards are booked via direct mail channel. Credit card issuers, such as Capital One and Bank One, apply the statistical techniques to maximize the direct mail response rate by building custom-made risk and response scores before they cut the final mailing files. Mathematical tools such as experimental design or factorial design with test/control segments are well developed in the US credit card issuers to identify the right customers with the right product.
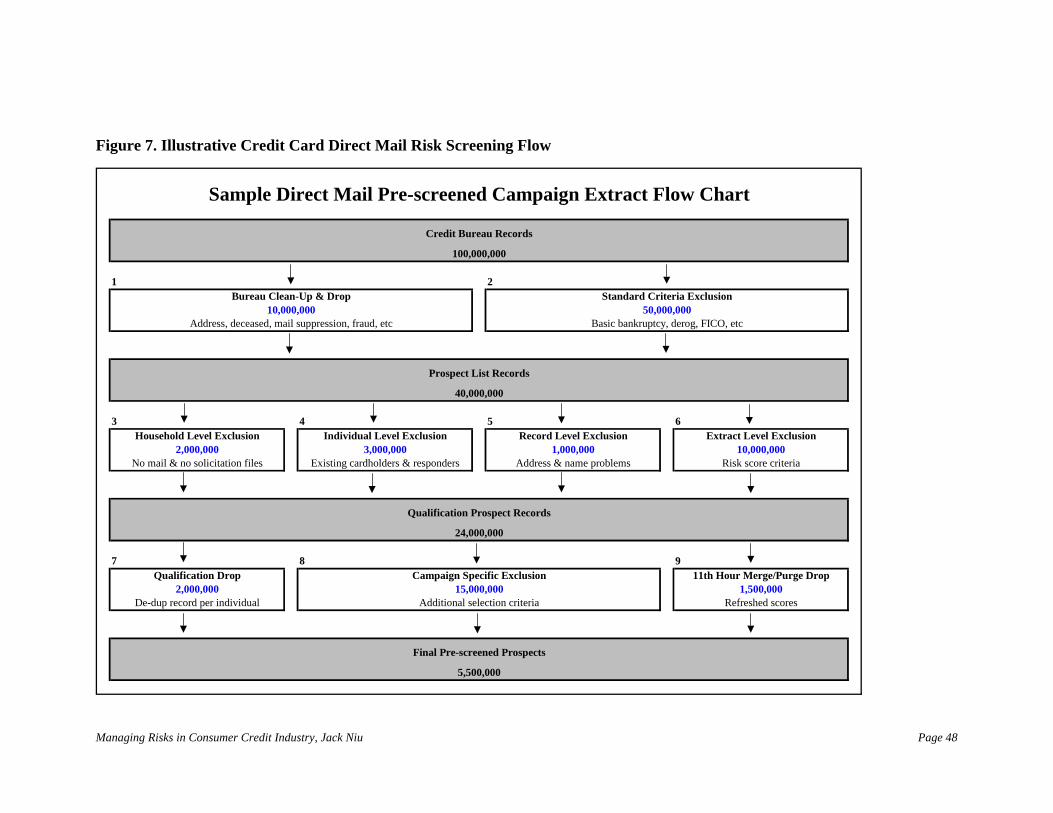
Figure 7 illustrates the process of screening the prospect consumers from a pool of credit bureau list. This process can be roughly divided into 9 steps:
• Step 1: drops those records with incorrect or incomplete information.
• Step 2: then excludes those accounts that do not meet generic risk score criteria to be included into the campaign, i.e. bankruptcy history, FICO<600, etc. These two steps combined excluded 60% of the population.
• Step 3: complies with consumer lending regulations to exclude those consumers who indicated not to be included in direct mail campaigns.
• Step 4: drops out those consumers who already have a credit card account with the lender or who already responded to a previous mail but have not had an account yet.
• Step 5: excludes those consumers who have problematic addresses.
• Step 6: excludes those consumers who fail the specific score cut-offs defined by the lender.
• Step 7: remove duplicate records for the same individual.
• Step 8: excludes those consumers who fail the specific criteria for the campaign. For example, lender can develop a response score for each consumer. For a specific campaign, lender may only want to target the top 50% high response consumers so that lender can increase its marketing efficiency.
• Step 9: performs the last minute check on all the above exclusion criteria before creating the final direct mail files.
This process reflects the flexibility of the proactive credit lending environment in terms of the risk appetite of the lenders. All these steps in this process are to select good credit quality consumers while maintaining the response rate of the direct mails so as to reduce the cost of each new account.
Each lender has its own credit policy for the credit decision making process and guideline. Once a consumer responds to the credit card offer, the next step to the lender is to make the credit decision. The credit line assignment is one of the critical steps to determine the future profitability of this customer. The key factors determine the credit lines are:
• Risk score matrix based on newly updated scores, i.e. FICO and Bankruptcy, etc. and sometimes revenue score
• Applicant’s household income
• Total existing external credit line and balances
• Customer relationship with the lender
Besides the credit risk criteria, lenders often have other restrictions on regulation issues, such as total credit exposure, fair lending practice, and privacy issue.
From the overall credit risk management perspective, credit decision making to extend credit to consumers only solves part of the credit risk management issue. This is because the overall credit risk management concerns about the total dollar amount at risk. However, all the credit decision making while extending the credit are based on credit risk scores, which are designed to predict the likelihood of default by unit. In other words, the criteria in extending credit is based on the probability of default rate, rather than the dollar amount that will be default in the future.
For closed-end credit products in which the amount of credit and terms are fixed once approved, such as auto loans and mortgage, the amount of dollars at risk can be estimated based on the approved credit amount and the terms of the loans. However, open-end credit products, such as credit card, the final amount of dollars at risk can not be fully estimated at underwriting stage and it is driven by the financial profile and behavior of the consumers. Therefore, the portfolio risk management for the open-end credit products is critical to the overall credit risk management issues. In the credit risk management theory, which will be discussed in the next chapter, the credit decision making at the underwriting stage only determines the initial asset quality with a corresponding credit limit at the lender’s preference. The dollar amount of assets that could be potentially at risk, which directly leads to the losses of the lender, should primarily be managed through portfolio risk management strategies for open-end credit products. The combined efforts between credit decision making and portfolio risk management influences the overall credit risk level of a lender. In the next section, we will focus on the portfolio risk management practice in the US.
2.4 Managing Portfolio Risk and Using Automation System
Portfolio risk management is one of the most critical functions in consumer credit market. It directly impacts the asset quality and portfolio losses. Failure to develop effective and proactive risk management strategies will directly lead to an increased credit loss level.
The credit risk focuses on the dollar amount at risk. Often, analysts will look at the loss rate or charge-off rate of a portfolio to determine the quality of the asset. Theoretically, the dollar loss rate is determined by:
where, the Dollar Loss Rate (DLR) is the loss rate of a portfolio for a period of 12 months, Charge-Off (C/O) Amount is the cumulative dollar amount charged off, and the Total Receivable is the average receivable in the 12-month period.
It is easy to derive that the DLR can be divided into two parts:
⎥⎦
⎤⎢⎣
⎡×⎥⎦
⎤⎢⎣⎡=
Balance Avg.Balance C/O Avg.
Accounts of # TotalAccounts C/O of #DLR ………….Equation 7
Where, Total # of Accounts represents the total number of accounts with balances in the portfolio, while Avg. C/O Balance and Avg. Balance represent the average balance of charge-off accounts and average balance for all accounts with balances. Clearly, the first bracket is exactly what a risk score predicts, and it is determined by the score at the initial credit decision-making and the subsequent score updates. Whereas the ratio in the second bracket represents the effectiveness of risk control strategies on the credit risk. This is because the more effective of the risk control strategies, the smaller the ratio will be.
To proactively take immediate actions on accounts that associate with higher probability of default during the course of the account life, a credit risk manager has to manage a few critical risk control indicators besides delinquency and charge-off rates.
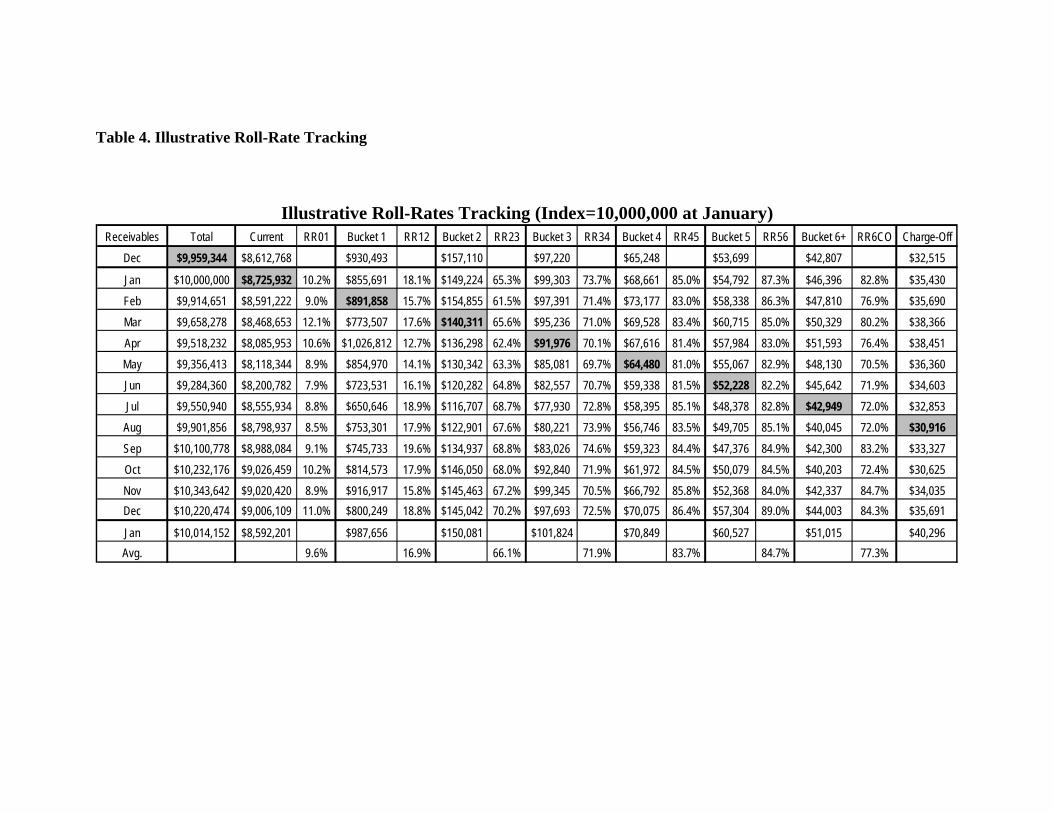
Managing Roll-Rates:
Roll-rate is defined as the ratio between the amount of the dollars past due at n days past due in this month and the amount of the dollars past due at (n-30) days past due in the previous month. This ratio represents the % of dollars at a delinquency stage in a month flows to the next delinquency stage in the following month.
Using credit card as an example, the grace period for credit card ranges from 25 to 29 days. Lenders often call the payments that are within the grace period (less than 30 days past due) as current delinquency bucket, or bucket 0. Payments that are 30 to 59 days past due are called as first delinquency bucket or bucket 1, and so on. The dollars amount that are more than 180-209 days past due have to be classified as charge-off balances according to the US regulations. Therefore, the amount of dollars that is 210 and more days past due are charged off balances.
The notation RR01 symbolizes for the total balance in bucket 1 in this month as a percent of the total balance in bucket 0 in last month. Therefore, RR12 means the total balance
that are 60 to 89 days past due this month as percent of the total balance that were 30 to 59 days past due last month, and so on.
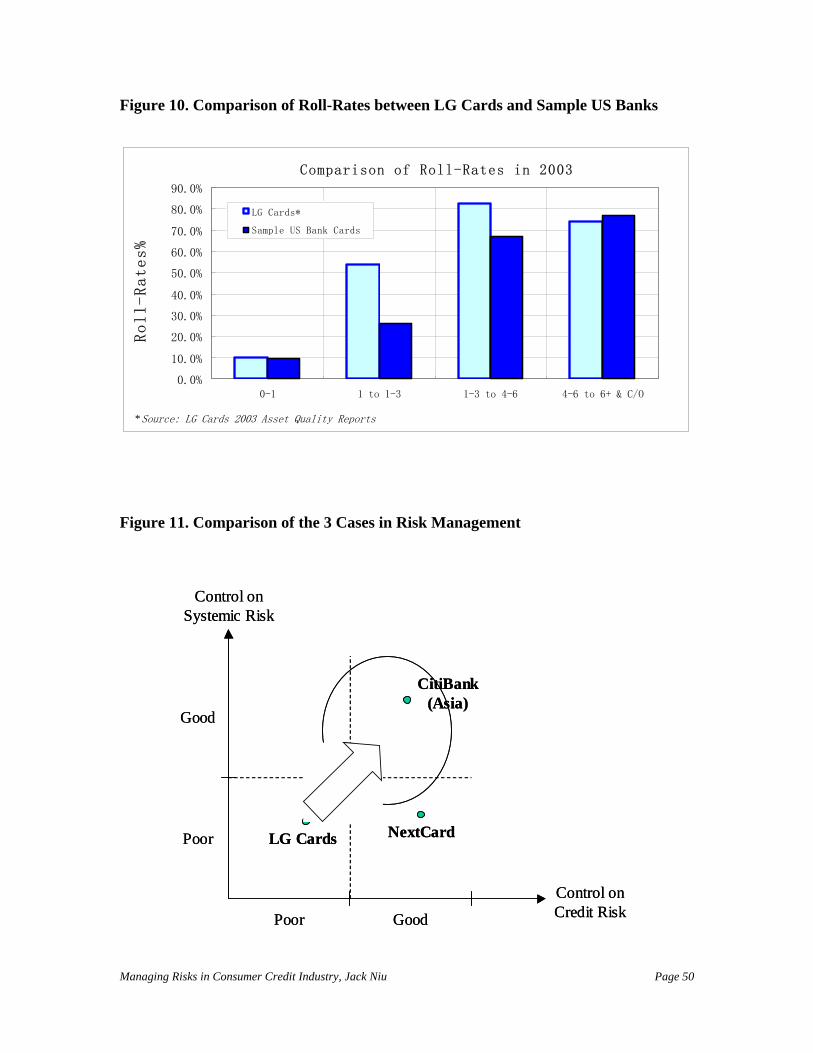
Roll-rates are the best measures for the effectiveness of collection center on the NPL recovery efforts. It is widely recognized that RR12 and RR23 are the most important two roll-rates to manage. Table 4 is a sample report to illustrate the roll-rates in a credit card business. The shaded cells in Table 4 indicate how the roll-rates are calculated and the ranges of 12-month average roll-rates for each delinquency bucket.
Tracking Balance Control Factors of Credit Cards:
Balance Control Factor (BCF) is defined as the ratio between the average balance for all accounts in a delinquency bucket and average balance for all non-past due accounts. It can also be given as:
where, i=1,2,…,6, and charge-off. BCFs are the best measure for the effectiveness of the risk control strategies in the portfolio risk management function.
For example, since most consumer credit lenders build up their portfolios by giving promotional interest rate or reward program to attractive the consumers, the balance building programs, such as a promotional 0% APR offer for balance transfer for 6 months onto a credit card account, may potentially adversely affect the average charge-off balance. This is because the adverse selection of this type of balance building programs may increase the average balance of charge-off accounts while also increasing good performing balances as well. In order to measure the effectiveness of the risk control strategies, the credit risk managers often use the trend of BCFs. For example, if the BCFs trend down, that means while lenders increasing the balances, more good balances have been put on the portfolio than the bad balances in average either through the promotional risk criteria or through the behavior based risk control system (i.e. Triad in the Total System or Adaptive Control System in the FDR system, which will be described in the next sections). On the other hand, if the BCFs trend up, that may indicate that the risk criteria for the balance building programs has actually put more bad balances in average than good balances leading to a worsened asset quality.
Utilizing Automation System:
Adaptive Control System (ACS) is the backbone of a risk control system. It is one of the products from the First Data Resources, Inc (FDR) which is a subsidiary of the First Data, Corp. (FDC). Similar to ACS, Total System, Inc. (TSYS) also has a system called Triad. Both ACS and Triad manage the fundamental risk control strategies for credit
card and line of credit products on a platform that interacts with database containing consumer historical performance and makes either real-time decision or periodic actions to the accounts. Using ACS as the example, there are 5 major modules in the ACS platform:
• Delinquency/Collection
• Authorization
• Credit Line Management
• Overlimit Management
• Reissue
Besides these 5 main modules, there are a few other functions in the ACS, i.e. the payment defender and fraud protection modules.
Each module in ACS consists of multiple strategies in the form of decision trees developed based on historical performance using statistical analysis. Among different strategies, there are champion and challenger strategies to test the best performance at random sampling basis.
The strategies in Delinquency and Collection module determine whom, when, and how a delinquent account is being contacted. The authorization strategy makes real-time decision for all cardholder transactions through point of sale, merchant acquirer, VISA/Master network, and the decision trees within this authorization strategy. The decision is normally completed within a few seconds from the point of sale to approval. The strategies in Credit Line management module automatically determine the actions to increase or decrease the credit line of an account at monthly basis with certain rules applied. The reissue strategies determine who and how long the credit card should be reissued for each account to be expired within the next 90 days. Lastly, the overlimit strategies decide whom, when, and how to contact an account that is currently over its credit limit.
The payment defender module is designed to prevent non-sufficient fund issue for cardholders paying by check or not guaranteed payment channels. The fraud protection triggers referral system at real time once the logic of fraud in the system detects a suspicious transaction.
The automation system, such as Triad or ACS, is the most critical risk control tool in credit card business. The effectiveness of the risk control strategies reflects lender’s ability to control credit risk. The measure of the effectiveness of such automation system is primarily based on the BCF ratios for all delinquency and charge-off levels over time. All lenders consider their risk control strategies, such as decision trees in the ACS platform, as proprietary property. The automation system enables the lenders to design the risk control strategies so that good performing customers will always receive the best treatment, whereas delinquent customers or customers with severe deteriorating credit scores will receive adverse actions to minimize the exposure of credit to these customers. Such dynamic, proactive, and selective actions based on sophisticated statistically driven
strategies bring the risk control tools to a level that lenders have never been reached before.
2.5 Decomposing the Dollar Loss Rate within an Organization
As mentioned above, the overall credit risk control should focus on the dollar loss rate. From Equation 7, we can derive that,
∑=
×
×= co
0i0i
co
)!!(RRRate) NPL-(1
Rate)Default (BCFDLR …………………Equation 10
where, BCFCO is the BCF for charge-off accounts, Default Rate is the future unit charge-off rate determined by the risk score, and NPL Rate is the ratio between total number of any stage past due accounts and total number accounts with balances. The last term in the equation defines the cumulative roll-rates RR0i!!, for example RR04!!=RR01*RR12*RR23*RR34, here i ranges from 0, 1, 2,…, to charge-off. The most important fact in Equation 10 is that, consumer credit lenders can determine the effectiveness of their credit risk control by different departments within the organization.
Roles and Responsibilities around DLR:
The consumer credit lenders can set credit risk control goals to specific functional areas to promote a comfortable credit risk management environment. This is because DLR is not only can be managed by parts to achieve risk control goals as shown in Equation 10, but also can be used to coordinate among functional areas within an organization so that given a special situation where one of the terms in Equation 10 has an unexpected event, other functional areas can be adjusted or tasked accordingly to still achieve the same DLR goal. For example:
• BCFCO measures the effectiveness of the risk control strategies in the portfolio management and risk management department; Functional areas such as people manage the ACS platform are particularly responsible for this measure.
• Default Rate measures the future charge-off rate of a portfolio. In the real business world, the default rate not only is determined by the risk score distribution of the portfolio, but also reflects a joint effect of the asset quality of the entire existing portfolio should the economic environment remain stable, the effectiveness of the delinquency management, and even the current macro-economic impact to the foreseeable future consumers’ attitude toward their debts, etc. Therefore, functional areas such as collection center, loss
forecasting, and economic department should jointly be responsible for the default rate.
• NPL Rate measures the NPL rate in terms of number of accounts. This is partially driven by the underwriting criteria and partially driven by the adverse selection responding to the offers from the Marketing department. Therefore, both marketing and underwriting credit risk management functions are responsible for this term.
• The term ∑ is the trickiest one in Equation 10. This is because this
terms seems to have a reserve relationship with DLR, meaning the bigger this term, the smaller the DLR. However, this is not really the case. This is because this terms is highly correlated with at least two, if not all three other terms in Equation 10. For example, the bigger this term, the bigger the Default Rate. On the contrary, the bigger this term, the smaller the term (1-NPL Rate). Therefore, there is no direct relationship between this terms and DLR. Actually, three other terms can be used as boundary conditions to derive an optimal value for this term so that DLR can be minimized. No such research has been available so far. Since collection center has direct impact on this term, there have been studies in operation science to best manage the staffing level to achieve the best DLR in some lenders.
=
co
0i0i )!!(RR
The Equation 10 sets a foundation for the credit risk management control measurement. The functional implication in this equation helps the credit lenders to specifically set risk control goals and supports quantitative analysis in coordinating functional areas.
Best Practice of Risk Management in a Credit Card Operation:
Although each functional area can work toward the goal tasked by the organization, there are definitely interactions among the terms in Equation 10. More importantly, one organization cannot just focus on the risk control without considering the trade-off between risk control and revenue generation. Therefore, coordination among functional areas in terms of roles and responsibilities is critical to the success of the organization.
Appendix C provides a sample “best practice” for a credit card company in terms of risk management as well as the coordination among all functional areas.
2.6 Managing Systemic Risk and the Role of Consumer Credit Regulations & Laws
Systemic Risk:
In the US, financial regulations and laws are designed to accomplish a wide range of objectives for the financial system. One of the key purposes of these regulations and laws is to protect the economy against systemic risk. Systemic risk is often used to describe the risk of a sudden, unexpected event that would harm the financial system to an extent that economy may suffer. Whereas credit risk relates to the riskiness of an individual loan, and portfolio risk relates to an individual bank’s aggregate portfolio, systemic risk involves the aggregate portfolios of all banks and financial services companies in the system taken together.
The safety nets that have been arranged to protect banks from systemic risk have succeeded in preventing banking panics, but at the cost of distorting incentives for risk taking. A well-functioning financial system makes a critical contribution to economic performance by facilitating transactions, mobilizing savings and allocating capital across time and space. Financial institutions provide payment services and a variety of financial products that enable the corporate sector and households to cope with economic uncertainties by hedging, pooling, sharing and pricing risks. A stable, efficient financial sector reduces the cost and risk of investment and of producing and trading goods and services.
Safeguarding financial markets and institutions from shocks that might pose a systemic risk is the prime objective of financial regulations. Such shocks may originate inside or outside the financial sector and may include the sudden failure of a major participant in the financial system, a technological breakdown at a critical stage of settlements or payments systems, or a political shock such as an invasion or the imposition of exchange controls in an important financial center. Such events can disrupt the normal functioning of financial markets and institutions by destroying the mutual trust that lubricates most financial transactions.
Consumer Credit Regulations and Laws in the US:
The regulations and laws have designed with specific objectives. For example, regulatory authorities in major financial markets, i.e. Financial Services Authority in the US (FSA, UK) and Federal Reserve Board in the US (FRB, USA) are often tempted to exploit the central role played by the financial sector in modern economies in order to achieve some social purposes. Budget constrained governments frequently use the banking system as a source of off-budget finance to fund initiatives for which they chose not to raise taxes or borrow. The Community Reinvestment Act (CRA) in the US is a good example for that. Over time the politically connected lending can have a devastating impact on the efficiency and safety and soundness of the financial system as we have learned from the experience of many central and eastern European countries and the recent Asian banking crises. The United States has also used regulation to achieve
the social objective, first articulated by Thomas Jefferson, of preventing large concentrations of political and economic power within the financial sector, especially among banks. Until recently, the United States had restricted the ability of banking organizations to expand across state lines. Restrictions continue against bank participation in non-banking activities.
Starting in April 1971 with the Fair Credit Reporting Act, the consumer credit regulations and laws in the US has developed to be the most sophisticated and completed one in the world. There are more than 20 regulations and laws that have been implemented in the US to protect the interest of both lenders and consumers. The following lists some major regulations and laws that governs the day-to-day consumer credit lending practice in the US:
• Credit Card Issuance Act
• Consumer Leasing Act
• Credit Practices Rule
• Equal Credit Opportunity Act
• Electronic Fund Transfer Act
• Fair Credit and Charge Card Disclosure Act
• Fair Credit Billing Act
• Fair Credit Reporting Act
• Fair Debt Collection Practices Act
• Real Estate Settlement Procedures Act
• Right to Financial Privacy Act
• The Bankruptcy Reform Act
• The Federal Consumer Credit Protection Act
• Truth in Lending Act
• Uniform Consumer Credit Act
The role of consumer credit regulations and laws in the US is to protect the credit information of consumers from misuse or identity theft. For example, the Fair Credit Reporting Act defines the usage and the scope of individual credit information. The credit bureaus can only provide individual credit information to credit lenders, insurance, hiring employees, and federal and state courts, etc. Unless agreed by the individual, the credit bureaus cannot release individual’s credit information to any other party. Otherwise it is considered as illegal credit reporting.
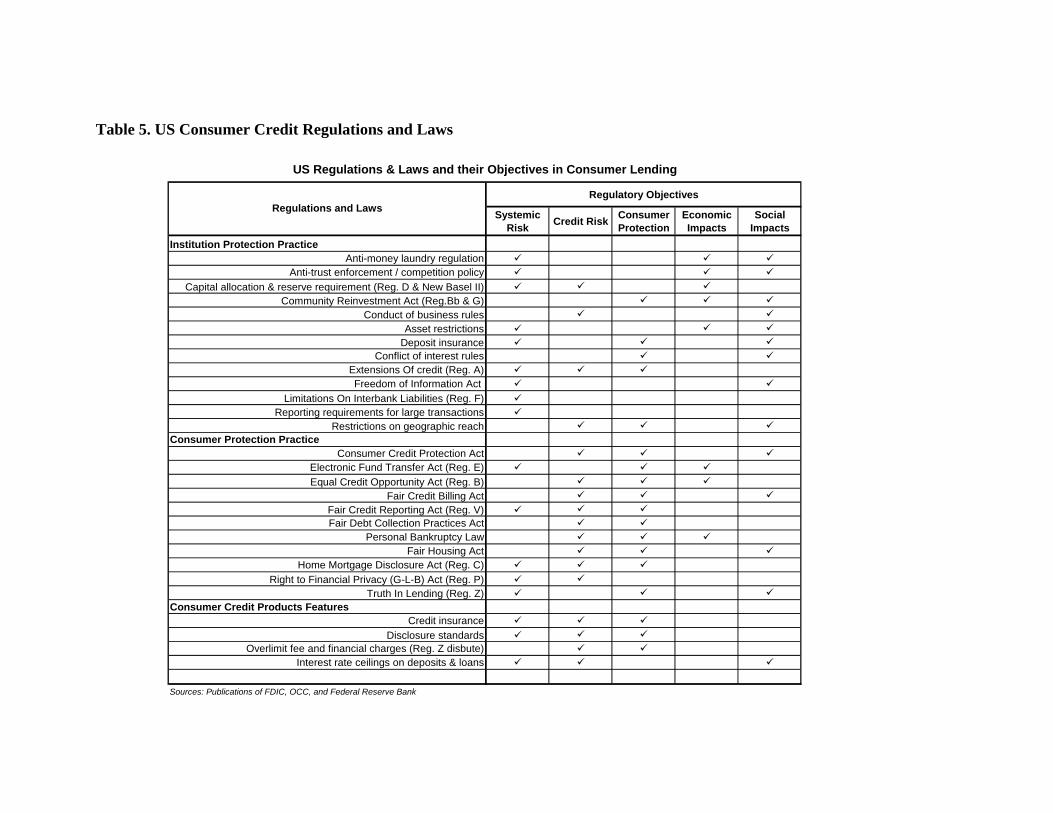
The background and objectives for all the regulations and laws in the US have also led the consumer credit lenders restricted by many specific rules. In Table 5, we summarize the consumer credit regulations and laws in the US in terms of their objectives and
protection areas. It is important to note that the consumer protection regulations are mostly related to the institutions credit risk and consumer protection objectives. While the institution protection regulations are more likely to have the objectives to handle systemic risk, economic impact , and social impacts.
2.7 Summary
The US has the most energetic and competitive consumer credit market in the world. Consumer credit has become an integral part of American’s daily lives. For many, it is the lifeline that enables them to deal with the emergencies that arise, helping match regular income against the irregular demands, and risks of modern life. For some, it is unfortunate to take out loans that are inappropriate, expensive, and beyond their economic capability. Others are tipped into debt by a sudden change in circumstance. But there are also consumers that are preyed upon by loan sharks, whose activities often exploit the socially deprived sections of social community. Consumer credit, by its nature, can introduce risks of its own to the consumers while providing financial relief to the majority of the consumers.
On the other hand, the lenders in the US are in a competitive and efficient financial services market that plays an essential role to raise the level of sustainable economic growth in the US economy. An innovative consumer credit market has developed rapidly over the last 30 years in the US. In recent years, this has helped to support growth in the US economy and cushion the impact of subdued global demand. However, the fastest growing sector of the US consumer credit market is the lowest income consumers. These riskier borrowers typically carry a higher debt burden, pay more interest, and suffer more defaults. Market competition, eagerness to grow, and starving for fee incomes and interest yield drive the lenders to aggressively market to the low-income sector of the consumers. Such market trend has led to a series of issues in consumer credit risk management. The risk control strategies and tools of the US lenders, along with the rise of consumer credit risk, have significantly improved. In this chapter, this paper has introduced current practice in both underwriting risk management and portfolio risk management in the US consumer credit market.
In addition, this paper also initiated the discussion on systemic risk management, which leads to the introduction of regulatory environment in the US consumer credit market. The regulations and laws in the US consumer credit, although it has generally stood the test of time extremely well, are also under revisions to better protect the interests of both consumers and lenders. These regulations and laws has set a standard for other countries in the world to examine the their consumer credit market in terms of fairness of lending, transparency of market, over-indebtedness of consumers, and most importantly the control of risks.
Part 3. Case Studies on Credit Card
The goal of this paper is to review the practice of managing risks in the US consumer credit market and introduce such practice to the China consumer credit market as a reference. Last chapter has briefly reviewed risk management practice in the US consumer credit market. In this chapter, this paper will show 3 real business world cases in credit card market to further illustrate the importance of managing risks. The purpose of selecting these 3 credit card cases is to share relevant previous experiences in the world consumer credit market with the lenders and policy makers in the China consumer credit market.
As previously introduced, managing risks in the consumer credit market involves underwriting risk, portfolio risk, and systemic risks under a certain regulatory and economic environment. The cases below will illustrate successful and failing examples in credit card practices in 3 very different financial markets and regulatory environment.
3.1 Citibank in India: Launching Credit Card in an Emerging Market
Background:
India in late 1980s had 80% of country’s population living in rural areas. Agriculture formed the foundation of India’s economy. The majority of country’s wealth was concentrated among a small group of urban households. Credit card penetration was extremely low and it served as a status symbols for India’s upper-middle-class consumers. The annual income was screwed to the low income side with 90% of population with the income less than US$2,000 and only about 5% higher than $6,000. The annual per capita income of India was $350.
On the other hand, Citibank’s Asia Pacific Consumer Bank enjoyed its success after its opening of consumer business in Asia in 1978. Citibank in India had 6 branches and about 61,000 customers out of 900 million total country population. Most of the consumer credit products for Citibank in India was coming from 15,000 auto loan customers if not including customers with only saving and checking accounts. Citibank (Asia) had been facing the challenges from local competitors and other international players. By the end of 1988, the earning for Citibank of all Asia regions reached $69.7 million. However, the goal for earning by 1990 was tasked at $100 million by the corporation. In order to realize the $100 million earning goal, Citibank (Asia) considered to penetrate its consumer credit products into this emerging market. A proposal to launch a new consumer credit product – credit card in Asia was on its way.
However, this proposal met with skepticism from most of the functional areas within Citibank corporate. The reasons were very simple: no credit bureau in most Asian
countries, low consumer income, culturally no fitting with revolving products, relatively unstable economic and political conditions, etc. In other words, there was no condition to ensure a comfortable handle of credit risk and systemic risk. In addition, according to the business proposal, credit card by itself as a stand-alone business would not make money for Citibank given all the above reasons and its limited number of branches in Asian countries. In contrary to the skepticism, consumer product managers in Asia felt optimistic about launching credit card. This was because the managers for consumer products, i.e. auto loan, mortgage, and personal line of credit, etc. considered credit card as a cross-selling channel and virtual branches to reach millions of consumers.
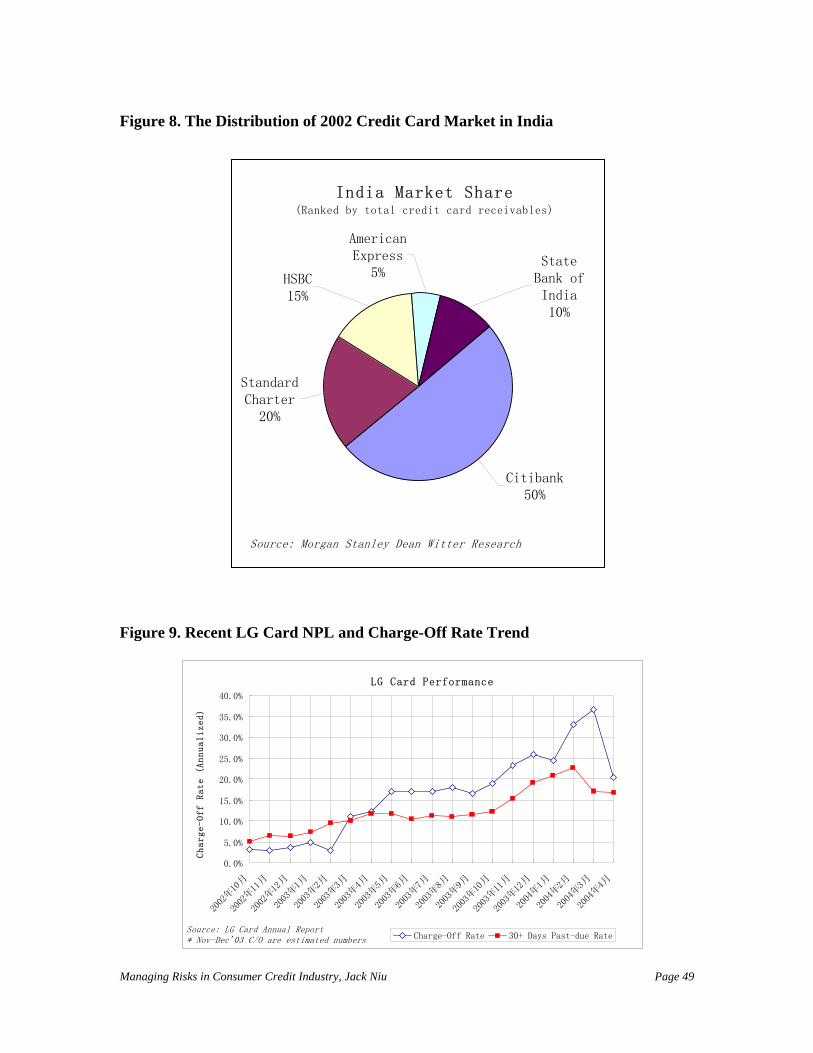
While the opinions were divided, Citibank (Asia) decided to implement a sequential plan to test countries one by one. Such approach will minimize the risk while Citibank opening the credit card operation, and will maximize the learning from one country to help the rest of the countries. India was one of the countries Citibank (Asia) started first. With a huge population and polarized income structure, Citibank valued the Indian consumer credit market was one of the largest in Asia. With the prestigious brand name, Citibank was very successful in India. By 2001, Citibank (Asia) had a 50% market share in India with Standard Charter running second with a 20% market share according to a Morgan Stanley Dean Witter research in 2002 as shown in Figure 8.
The main question in this case is - how could Citibank achieve such an extraordinary success given a poor risk management environment in India? It is well known that, although massively populated, India has a small and difficult consumer credit market with profitable growth prospects only for those players prepared to make considerable investments. The limited technology infrastructure, the lack of credit checking system, and negative attitudes toward borrowing among the consumers are major obstacles for the foreign lenders to join the market. Knowing all these, Citibank had the following business model:
Controlling Credit Risk and Fraud:
In order to gain confidence in control risks in Indian consumer credit market, Citibank targeted the high-end customer market (top 5-10% highest income) first with a limited credit exposure to start with. Meanwhile, Citibank also started to build a data warehouse for the Asian Pacific region to share the consumer credit information. With sophisticated risk control expertise in the US, Citibank utilized its risk control strength to combine with local specific information to established its own consumer lending underwriting credit risk policies and a conservative portfolio risk strategies. Later on, Citibank built specific credit risk scoring models for the Asian Pacific region countries based on local consumer performance. Another concern in Indian consumer credit market was the fraud issue. While transferring the fraud management techniques from the US to India, Citibank also emphasized on risk-based pricing to off-set the fraud triggered credit losses.
Building the Relationship and Marketing the Brand Name:
The primary learning Citibank had was that building relationship with consumers with multiple products would significantly reduce the credit risk exposure. The cross-sell strategy in India worked favorably for Citibank resulting a dominating 50% market share in credit card. The growth in other consumer credit product was part of the result of using credit card as virtual branches to reach out consumers. Such strategy benefited Citibank’s overall profitability of consumer credit products in India. On the other hand, Citibank had a excellent brand name equity in Indian consumer market. Marketing its brand name would help both the growth of business and managing risks.
Working with Regulatory Environment:
India had hardly any consumer credit regulations and laws that were comparable with those in the US. Besides the lack of credit bureau system issue, high fraudulent transactions was also a severe issue to Citibank. In order to be able to risk-based price the consumers, Citibank worked with Indian policy makers to make sure it could price the APR according to consumers’ risk level. Citibank also took very cautious approach in managing systemic risk. Due to the lack of consumer protection laws and credit reporting regulations, and a relative unstable economic and political environment in India, Citibank paid attention in building scale at a stead pace while patiently work with the environment changes over time. Benefited by the dramatic growth of Indian economy in recent years, Citibank’s investment paid off today. India have built up its consumer credit regulations to protect both consumers and lenders.
In summary, Citibank’s success showed us that even in an unfavorable emerging market environment such as India in 1988, consumer credit lenders could also manage both credit and systemic risks through the initial developing stage to build the scale by steps. Citibank has one of the best credit risk management teams in this world. Yet, they have to build up its risk management system from scratch in India to ensure the control of credit risk. Taking a calculated risk with a sound cross-sell business model at a sustainable pace brought Citibank a successful growth in its India market. Citibank presented a global best practice on entering an emerging market with carefully designed strategies to control risks.
3.2 LG Card of Korea: a Lesson for China’s Consumer Credit Market
Background:
Credit card in Korea started in 1999 after Korea’s financial crisis in 1997 and 1998. Given that no consumer credit in the past 50 years was available, sudden access to credit
for Korean consumers inevitably led to a dramatic growth of consumer credit. Credit card companies, such as LG Card Co, also experienced such dramatic growth. By 2003, LG Card already became the largest credit card issuer in South Korea with 19 million customers – over 40% of nations population having a credit card issued by LG Card.
However, the Korean consumer credit market in 2003 faced the toughest challenge that the country has ever experienced – the NPL rates in consumer credit market had dramatically increased. Credit card delinquencies also increased dramatically, rising to 11.2% in January 2003 - far higher than the 5% delinquency rate in the United States. LG Card suffered a fatal increase of NPL and charge-off rates. As shown in Figure 9, LG Card had less than 5% charge-off rate before February 2003. However, its portfolio performance worsened significantly with as high as 22.7% and 36.5% for NPL and charge-off rates, respectively in the first quarter of 2004. By the end of 2003, LG Card was already at the edge of bankruptcy. The company, saddled with a mountain of debt that its customers are struggling to repay, finally narrowly escaped from bankruptcy in January 2004 after a $4.5 billion bailout by its creditors and the parent LG Group. However, with continued increase of NPL and charge-off rates in 2004 as shown in Figure 9, LG Card announced on July 2, 2004 that it seeks additional $1.3 billion aid from creditors in order to keep the company in business.
Can LG Card survive this time? What really happened to LG Card and the consumer credit market in Korea? To understand these questions, we should look at the LG Card case in the following areas:
Regulation Environment:
The Korean economic crisis in 1997 and 1998 was basically a financial crisis resulting from excessive foreign and domestic borrowings by firms and financial institutions. Total foreign debts of private financial institutions and large companies in Korea reached US$150 billion in 1997. The domestic loans of private sector corporations have grown following the bankruptcy of some major companies, foreign lenders and investors suddenly withdrew from the Korean market, refusing roll-overs of existing loans and hold additional loans. In this process, the demand of dollars increased sharply as domestic borrowers had to repay the foreign loans, and the Korean Won started to depreciate rapidly. The monetary authority was improperly advised to protect the currency, and the inappropriate and futile attempt ended with the exhaustion of foreign reserves. The foreign exchange crisis broke out and the exchange rate soared to nearly 2,000 Won per dollar in December 1997 from around 800 Won before the crisis. The Korean economic crisis was later bailed out by IMF stand-by loan.
After the financial crisis, Korea started its rebuild of its financial market. In order to stimulate the domestic demand, Korean government started to loosen regulation on household loans by commercial banks in 1999. Such relaxation of regulation on extending credit launched a household loan and real estate boom. The deregulation of credit card companies also drove the consumption boom. It seems that Korean
government tends to favor regulatory changes instead of using monetary and fiscal policy to manipulate the boom-and-bust cycle of credit markets. Many of the times, this use of regulatory change is more politically motivated than that in western countries. For example, Korea’s previous strong demand was upheld by a credit-expansion policy, which was politically motivated prior to December 2002 presidential election.
Credit Risk Management Capability:
Lack of ability to manage credit risk and systemic risk is one of the major reasons that endangered Korea’s consumer credit market. The fact that LG Card requires that credit card balances to be paid in full at the end of each month implies that either LG Card has weak capability to manage the revolving credit risk or its product design may be part of the cause for the high NPL rate.
In order to assess the credit risk management capability, we have compared the roll-rates of LG Card to that of a sample pool of US card business as shown in Figure 10. It is obvious that the most critical roll-rates RR12 and RR23 for LG Card are significantly higher than those for the US banks. The roll-rate RR12 for LG Card doubles that of the US banks. This is a strong indication of a very weak risk control capability. In fact, the credit risk management capability in Korea was not ready for the booming consumer credit market. For example, when the Korean consumer credit market faced challenge in early 2003, as shown in the chart, the LG Card did not show strong control on its credit risk as measured by the roll-rates and NPL rates.
Over-extending of Credit:
LG Card, like other credit card firms in South Korea, is still struggling to cope with the aftermath of a boom in easy credit that left many consumers overstretched. Korean lenders have made credit too easy for the consumers, this basically abolish the credit risk control in the lending practice. On the other hand, Korean consumers took credit far beyond their actual demands. Although lack of credit checking and credit reporting were part of the causes, over-extending credit was the primary root-cause of the credit card crisis in 2003.
The Role of Government:
As mentioned above, regulations in Korea sometimes are driven by political motivations rather than economic incentives. The 2003 consumer credit crisis in Korea should partially blame the government since the government promoted consumer credit by loosening the regulations on lending restrictions. When crisis occurs, the government came out to bailout companies in financial problem. Such practice of the government actually demoralize the entire consumer credit market. This is because loosening the
regulation and then bailing out troubled companies is effective telling the consumers that there will be no penalty for not repay the loans since there will always be someone to pay. For instance, many Korean cardholders heard the talk of a state-bail out of LG Card, and then they actually rushed out to max out their credit cards thinking the debt would be written off. Such role of government contributed the worsening of the consumer credit market in Korea today.
In summary, LG Cards failed to manage credit risk under the circumstance of post-systemic risk era. In an emerging market like Korea, although managing risks in consumer credit is critical to the success of the business, the role of government is also critical to safeguard the entire consumer credit market from being exploited.
3.3 NextCard of USA: An Innovator’s Cost
Background:
NextCard was co-founded in 1996 by Jeremy and Molly Lent with the mission of redefining the banking experience for the internet consumers. It was an innovative business model with a prominent claim on cutting-edge technology. As a subprime credit lender, NextCard was once considered as “…the single best-positioned, most attractive web-oriented stock on planet earth” by an analyst from Second Curve Capital hedge fund. However, on October 31, 2001, 5 years after its birth or 2 years after its IPO with trade history over $40 per share, NextCard stock on Nasdaq plunged 84% to under $1. Failing to keep the promise to the investors to become profitable in Q401, the lender told investors that regulators from OCC had demanded that the company clean up its financials, increase protection against bad loans and exit certain business lines.
While NextCard claiming that they have the state-of-the-art risk management tools in this innovative business, the company still suffered a sudden failure on asset quality leading to the death of the company. Why? What went wrong?
Innovator’s Technology:
NextCard was indeed well equipped with all necessary capabilities to be the leading innovator in the consumer credit market. NextCard spent 2 years in building their proprietary credit risk scoring models specifically based on internet applications and online customer behavior. Their web-based real-time credit decision-making platform, the pioneering eCommerce MoversSM, web-advertising strategy, and micro level account management of the portfolio risk management were regarded as the state-of-the-art practice of credit risk management. Even right before the collapse of its stock, NextCard was believed by the analysts that it has the potential to grow into a flagship firm as the
next generation consumer lending institution. Some people may say it was the federal regulator who stopped the NextCard. Yes, indeed NextCard was told by regulators to suspend its certain re-pricing programs and fee-based product strategies. However, was NextCard just a victim of federal regulators? Ultimately, the Federal Reserve Board should be blamed for fueling the massive credit expansion over the past 10 years. The US regulators were too slow to jump on the offenders of unprincipled lending before the sub-prime lenders started to suffer credit losses.
Wrong Customers and Wrong Timing:
The business model of NextCard would work well in a booming or regular economic condition without dramatic macro economic changes. In other words, sub-prime credit lending models appear to work fine when the economy is booming. Sub-prime lenders can off-set their risks by accurately risk-based price the customers with a proper credit exposure. During the go-go years, interest rates may look high, but because the deadbeats aren't defaulting in large numbers, the "risk-pricing" seems to be correct. But, as the credit cycle turns, many more loans go bad than lenders expect. The value of score under this economic circumstance no longer mean the same odds as that under a stable economic situation. The answer might be to push up rates even higher to cover the new risks associated with a stagnant economy. But fewer people would want to borrow at higher levels. Moreover, higher rates would be even harder to pay back, meaning higher losses. That is the subprime paradox. Unfortunately, credit seekers on the internet are often sub-prime customers. Therefore, by its business model, NextCard has to deal with the sub-prime customers.
When the US .com bobble broke several years ago, NextCard was just at its peak time. Unfortunately, the consumers started to hit back on the lenders with sloppy performance. The fact that the NextCard had to target sub-primer customers during the economic downturn made itself an inevitable victim of its business model.
In summary, in a well-developed financial market environment like the US, even a credit lender is capable of managing credit risk well, its ability to adapt the change of the macro-economic environment in order to avoid risks is also critical to the safety of the lender. NextCard shows that, not only managing risks, but also selection customer profile and timing are the determining factors to the success of a business.
3.4 Summary
The three cases in this chapter has demonstrated different scenarios in consumer credit market. Each case associates with different challenges in a different market environment, However, all three cases can be compared at a common basis, which is the relative control on credit risk and systemic risk. Figure 11 shows that, among the three cases,
Citibank (Asia) had a relatively better credit risk control as well as the systemic risk control. Whereas the NextCard had a relatively poor control on systemic risk even its credit risk control was one of the best. The LG Card, although also doing credit card business in an emerging market like Citibank, suffered poor controls on credit risk and systemic risk. For each case, there are other factors that are not comparable to other cases but unique to the case itself, these factors are also valuable wisdom for the future lenders to learn from.
In addition, the cases also reveal the relationship between credit risk and systemic risk: failing to manage the systemic risk may cause the collapse of credit risk management, as shown in the LG Card case. Systemic risk relates to the losses reserve and New Basel II accord to protect the firm from unexpected shocks. Credit risk control reduces risk exposure when the macro economic condition remains relative stable. When dramatic change happens at macro economic level, i.e. recession, economic booming, etc. the credit risk management may be put in danger given the unknown incremental risk exposure from the systemic risk side.
Part 4. Chinese Consumer Credit Industry
4.1 A Brief Review of the Chinese Consumer Credit Market
China’s financial system has been primarily state-owned and largely closed, while the non-state sector of the real economy has enjoyed substantial growth in the past two decades of economic reform. In arranging access to credit and capital markets, the state-dominated financial system has consistently favored the state-owned enterprises (SOEs), while non-state sectors have been less able to access such resources. Such unbalanced credit and capital resources issue hindered the growth of the economy. Realizing the problem, China started to gradually deregulate the state-dominated financial system. First in mid-1980s, China allowed to set up joint stock commercial banks. By mid-1990s, China approved its first private sector bank. Starting late 1990s, China started to grant license to foreign financial services companies as an important step to open up its financial market. The recently announced qualified foreign investment institution (QFII) scheme should help to further open up and integrate China’s domestic financial market into the global market.
China has a 4-tier banking system. Within this system, the People’s Bank of China (PBOC) is the central bank for China. Under PBOC, all banks in China may be grouped into 4 tiers as shown in Figure 12. Tier 1 has 3 policy banks, whose main task is to separate policy lending from commercial lending in order to ensure the four state-owned commercial banks (SOCBs)4 to only undertake commercially oriented lending. Tier 2
4 Refer to Figure 12 for the abbreviation of all Chinese banks.
has 4 SOCBs, whose main function is to act as a commercial bank to form the backbone of China’s commercial banking industry. Tier 3 has 11 joint-stock commercial banks (JSCBs), which are owned by various local governments, large, medium or even private enterprises versus those SOCBs that are 100%-owned by the central government. Tier 4 has several hundred of banks and companies, i.e. 100+ city commercial banks, numerous rural and urban credit cooperatives, about 200 trust and investment companies, and 200+ foreign banks or registered representative offices, as well as financial services companies, leasing companies, and asset management corporations.
China’s state-owned banking sector has a severe problem in non-performing loans (NPL5, hereafter). The total NPL for the state-owned banking sector is estimated at about RMB4.0 trillion. While the loan losses are estimated at about RMB1.56 trillion, which doubles the total capital and reserves of RMB0.74 trillion for the entire sector. The NPL ratios of the 4 SOCB by 2002 are 29.78%, 27.51%, 19.35%, and 42.12% for ICBC, BOC, CCB, and ABOC, respectively. Fortunately, benefited from the growing deposits and government support, the state-owned sector has not faced serious liquidity problem yet. In addition, the high NPL rates do not mean the same as that of the US. This is because most of the NPL assets are SOEs assets, which are not allowed to liquidate or bankrupt according to China’s laws. In other words, government properties can not be sold. The high NPL rates are the result of cumulative NPL over many years of operation. Recently, the average NPL ratio for SOCBs has been lowered to 22.2% by the end of June 2003. This is still obvious that the state-owned banking system needs re-capitalization, drastic overhaul in credit underwriting, and systemic risk control to improve profitability.
China’s JSCBs, on the other hand, starting with a relatively better position in asset quality with an average NPL ratio around 14%, now also suffers high NPL ratios. In a recent statement released by the China Banking Regulatory Commission (CBRC), it warned that the entire JSCBs sector could face the danger of bankruptcy should the JSCBs continue to grow its debts and fail to control NPL. By the end of April 2004, the 11 JSCBs have total debts of RMB 4.0 trillion with the total assets of RMB 4.15 trillion, while the NPL increased by RMB 4.7 billion during the first quarter of 2004. Clearly, the risk control is the No.1 issue for the entire China’s banking system.
Under the pressure and challenge for a better asset quality, the Chinese government has taken a series of impressive initiatives to reform the SOCBs, such as setting up asset management companies (AMCs), providing additional bank capital and improving bank profitability in the past few years. However, all these endeavors are likely to take time to bear fruit. In order to lower the NPL ratios for China’s banking industry while AMCs are working on the NPL, China must develop other business lines with a big growth potential, i.e. mortgages and credit cards in the consumer credit market, so that the overall asset quality of China’s banks with the new lending can be improved. Under such circumstances, the consumer credit market came in at a good time to boost both the consumer credit market and the overall asset quality.
5 The NPL is normally defined as all the loans that are more than 30 days past its payment due date.
The consumer credit market in China took off just a few years ago. Today, consumers in China have the opportunity to apply for mortgage, auto loan, personal loan, student loan, and secured and unsecured bankcards. In the past 5 years, China’s consumer credit market experienced a dramatic 52% growth, among which auto loans grew 110%, bankcards grew 36%, and mortgage grew as high as 10 times. Even with such growth rate, the Chinese consumer credit market still has a huge room to grow. For example, the mortgage industry has an average of 60% growth rate per year, but it is still only 8% of the total GDP compared to 17% in Taiwan, 44% in the US, and 45% in Hong Kong. Although the consumer credit market grew significantly, the percent of interest bearing sales is still low. Consumers in China are still not willing to borrow today. This can be seen in the following areas.
China has lower auto financing rate (ratio between auto finance and auto sales) than that of the US. For example, auto loan only represents 10%-15% of the total automobile sales compared to 80% of that in the US. Today, the number of families that have the capability to purchase automobiles is estimated to be 7 million by the government and this number will potentially reach 42 million by 2005. Such gap in auto financing rate between China and the US reflects both the culture differences and potential market opportunity.
China has a small student loan market. In 1998, China launched its first student loan program and piloted in eight cities in 1999 and then spread throughout the country. By May of this year, 534,000 college students had applied for loans, while 169, 000 of them had received loans, worth 1.26bn Yuan6 according to the Ministry of Education of China. On the other hand, China has 12 million college students with 20% of them having financial difficulties, meaning their monthly family incomes are lower than the basic cost of living in the local area. With the increasing trend of the cost of living, the demand for student loan is expected to be even higher than it is today. In the U.S. from 1966-1999, an estimated 50 million students have taken more than 115 million student loans equaling more than $335 billion under U.S. federal student loan programs. These loans are insured by the state governments and reinsured by the Federal government. In average, more than 50% of all fulltime students at 4-year colleges and universities in the US take student loans. The current student loan default rate in the US for students attending 4-year colleges averages 6.9%. In addition to the student loan market, the US has also developed the secondary credit market for the student loans – Asset Backed Securities (ABS, hereafter). However, the secondary credit market for the entire financial industry is still underdeveloped in China.
The mortgage market has been growing fast since China started its consumer mortgage market in 1998. Based on a recent consumer survey by the National Bureau of Statistics of China, 80% of the homeowners would take a mortgage in China, 48% prefers a 10-year mortgage, 26% prefers a 20-year mortgage, and only 6% prefers a longer term 6 Yuan (¥) is the currency of China. It is sometimes also called RMB. The IMF officially registers China as having a managed floating exchange rate, but its foreign exchange system might be better characterized as a virtual peg to the US dollar combined with comprehensive, direct capital account controls. For example, as of June 14, 2004, 1US$=8.276600Yuan with a narrow fluctuation range between 8.2765 and 8.2775 for the past 12 months.
mortgage. In a 2004 research report “The Development of Real Estate in China and Financial Support”, the People’s Bank of China, the central bank of the People's Republic of China, indicates that the mortgage loans in China have reached US$142.3 trillion by the end of 2003. This is a 42.5% growth from 2002 and equals as many as 27 times of the mortgage loans in 1998 leading to a compound growth rate of 92.8% per year in the past 6 years. However, the central bank also warns the potential risks in the mortgage industry in the same report. Currently, the mortgage industry in China has not shown significant credit risk issues. This is because most of the mortgage loans are still at their early stage. In addition, systemic risk is another major concern by the central bank. This is because the commercial banks in China involves in all phases of real estate industry, i.e. real estate development finance, construction loans, land reserve loans, and commercial and consumer mortgage loans. Such full range of involvement in one industry could post a dangerous threat of systemic risk to the commercial banks in China had one or more sections of the real estate industry fail to perform.
China’s credit card market has just started. As of the end of 2002, there were 500 million bankcards circulating in the market. But only 1% of these bankcards were true credit card (credit card, hereafter), the 99% of them were actually debit cards issued by banks without revolving credit line (bankcards, hereafter). Today, the average number of credit cards per person in the US is about 4 compared to near zero in China. China’s credit card industry has a huge market in the near future.
Motivated by the exciting booming trend of Chinese consumer credit market, the investors from both domestic and global institutions are seriously considering entering China market. One of the key questions that all the investors would first ask would be the risk they will be facing in the Chinese consumer credit market. Unfortunately, China has a weak risk management system. This is because most of the state owned banks have high NPL rates, worsening asset quality, low asset sufficient rates, and weak internal and external risk control capability. There is already an increasing concern about the risks in consumer credit market in China. The credit reporting infrastructure is just at its starting stage, which can not fully support the dramatic growth of the consumer credit market. Such financial environment will certainly post a tough challenge to the investors, especially foreign investors to come to China.
The current situation mentioned above illustrates a mix picture of the consumer credit market in China today. The Chinese consumer credit market is huge, attractive, and underdeveloped, but it also associates with significant credit risk and systemic risk issues. More regulations and laws are needed to better position the consumer credit industry so as to protect both lending institutions and consumers to ensure a healthy financial environment in the future.
In helping to better understand the risk control capability of Chinese consumer credit industry, the following sections will look into more details in the current situations of credit risk management, systemic risk management, and regulations and laws in China compared to those in the US.
4.2 Credit Risk Management 4.3 Cross-examination on Regulations and Laws 4.4 Recommendations 4.5 Summary
Part 5. Conclusions
5.1 Future Challenges to the consumer credit market
5.2 Conclusions
Shaded sections are 90% done. To be imported.
Appendices
Appendix A. Tables
Table 1. Sample FICO Score Odds
Sample FICO Score Odds Table
SCORE # of # of Charge-Off Charge-OffRANGE Records Charge-Off* Odds Rate
Home Mortgage Disclosure Act (Reg. C)Right to Financial Privacy (G-L-B) Act (Reg. P)
Truth In Lending (Reg. Z)Consumer Credit Products Features
Credit insuranceDisclosure standards
Overlimit fee and financial charges (Reg. Z disbute)Interest rate ceilings on deposits & loans
US Regulations and Laws
Appendix B. Figures
Figure 1. The US Consumer Credit Market and Players
Managing Risks in Consumer Credit Industry, Jack Niu Page 43
Figure 2. Sample Credit Card Transaction Flow
Managing Risks in Consumer Credit Industry, Jack Niu Page 44
Figure 3. The ABS Trend in the US Where,
CDOs – Collateralized Debt Obligations are sophisticated financial products that offer a range of investments, known as trenches, at varying risk levels backed by a collateral pool typically consisting of corporate debt (bonds, loans, default swaps, etc.).
HEL/MH – Home Equity (HEL) or Manufactured Housing (MH)
Managing Risks in Consumer Credit Industry, Jack Niu Page 45
Figure 4. Illustrative Model Development Process
Managing Risks in Consumer Credit Industry, Jack Niu Page 46
Figure 5. Logistic Function
Logistic Function
0.0
0.2
0.4
0.6
0.8
1.0
1.2
Bad
Good
Figure 6. Comparison of the Power of Scores at the same Score Cut-off
Cut-off Score
Score 2
Score 1
Good
Good
Bad
Bad
% of Accounts
Cut-off Score
Score 2
Score 1
Good
Good
Bad
Bad
% of Accounts
Managing Risks in Consumer Credit Industry, Jack Niu Page 47
Figure 7. Illustrative Credit Card Direct Mail Risk Screening Flow
Sample Direct Mail Pre-screened Campaign Extract Flow Chart
Credit Bureau Records
100,000,000
1 2Bureau Clean-Up & Drop Standard Criteria Exclusion
PBOC – People’s Bank of China CADB – China Agriculture Development Bank CDB – China Development Bank EIBC – Export Import Bank of China ABOC – Agriculture Bank of China BOC – Bank of China CCB – China Construction Bank ICBC – Industrial and Commercial Bank of China
Jack Niu, Managing Risks in Consumer Credit Industry Page 51
Appendix C. Best Practice of Risk Management in a Credit Card Operation
To be completed (90% done)
Appendix D. References and List of Internet Links
References
• To be completed (90% done)
List of Internet Links The People’s Bank of China: http://www.pbc.gov.cn/english/
The Federal Reserve system in the US: http://www.federalreserve.gov/
Major Credit Bureaus in the US:
• EquiFax: http://www.equifax.com/
• Experian: http://www.experian.com/
• TransUnion: http://www.tuc.com/
Federal Reserve Bank of Philadelphia, Payment Card Center: http://www.phil.frb.org/pcc/
Major US Federal laws influencing the credit industry:
• The Federal Consumer Credit Protection Act http://www.access.gpo.gov/nara/cfr/waisidx_99/16cfr444_99.html
• Truth in Lending Act http://www4.law.cornell.edu/uscode/15/1691.html