+ All Categories
Home > Documents > MANAGING RURAL WATER SYSTEMS FOR SUSTAINABLE …

MANAGING RURAL WATER SYSTEMS FOR SUSTAINABLE …

Date post: 15-Mar-2022
Category:
Upload: others
View: 1 times
Download: 0 times
Share this document with a friend
135
i MANAGING RURAL WATER SYSTEMS FOR SUSTAINABLE LIVELIHOOD IN GHANA; THE CASE OF GA EAST MUNICIPAL ASSEMBLY BY HANSON OHENE–BUDU THIS THESIS IS SUBMITTED TO THE UNIVERSITY OF GHANA, LEGON IN PARTIAL FULFILLMENT OF THE REQUIREMENTS FOR THE AWARD OF M. PHIL AGRICULTURAL EXTENSION DEPARTMENT OF AGRICULTURAL EXTENSION COLLEGE OF AGRICULTURAL AND CONSUMER SCIENCES UNIVERSITY OF GHANA, LEGON OCTOBER, 2012 University of Ghana http://ugspace.ug.edu.gh
Transcript

i

MANAGING RURAL WATER SYSTEMS FOR SUSTAINABLE LIVELIHOOD IN

GHANA; THE CASE OF GA EAST MUNICIPAL ASSEMBLY

BY

HANSON OHENE–BUDU

THIS THESIS IS SUBMITTED TO THE UNIVERSITY OF GHANA, LEGON IN

PARTIAL FULFILLMENT OF THE REQUIREMENTS FOR THE AWARD OF

M. PHIL AGRICULTURAL EXTENSION

DEPARTMENT OF AGRICULTURAL EXTENSION

COLLEGE OF AGRICULTURAL AND CONSUMER SCIENCES

UNIVERSITY OF GHANA, LEGON

OCTOBER, 2012

University of Ghana http://ugspace.ug.edu.gh

ii

DECLARATION

I hereby declare that with the exception of the references to other people’s work, which have all

been duly cited, this thesis herein submitted is entirely my own research work, and that it has not

been presented in whole or in part for any degree at this university or elsewhere.

…………………. Date……………………….

Hanson Ohene-Budu

(Student)

……………………………. Date…………………………

Dr. P.B. Atengdem

(Supervisor)

University of Ghana http://ugspace.ug.edu.gh

iii

DEDICATION

I dedicate this thesis to God Almighty for how far he has brought me. It is also dedicated to all

my family members, especially my three daughters and dear wife for their understanding for my

long absence from home, financial support and encouragement to make this work possible.

University of Ghana http://ugspace.ug.edu.gh

iv

ACKNOWLEDGEMENT

I am very grateful to my able supervisors; Dr. P. B. Atengdem and Dr. S. D. Boateng for their

excellent supervision, constructive criticisms and insightful suggestions to enable me complete

this work successfully. I am also indebted in gratitude to all my lecturers, not forgetting my

course mates, whom I learnt many things from. I have not forgotten the entire administrative

staff of the department of Agricultural Extension.

I am also highly grateful the GEMA who permitted me to carry out this research work in their

area. I am most grateful to Mr. Johnson of the MWST department and Mr. Percy Bukari of the

planning department for the kind of information they provided me with. Finally, I thank the

managers of the water scheme as well as members of the water board who availed themselves for

the focus group discussions. Special mention goes to Mr. Terry Darko for the kind of support he

gave me. I thank all those who have contributed in diverse ways to see to the completion of this

thesis.

University of Ghana http://ugspace.ug.edu.gh

v

ABSTRACT

The study was carried out in the Ga East Municipal Assembly of the Greater Accra Region of

Ghana. The area was chosen because it is one of the newly created municipalities, facing

infrastructural, water and sanitation challenges. The area was one time prone to water borne

diseases like typhoid, guinea worm, and worse of all buruli ulcers. However, between the years

2005 /2006 a DANIDA sponsored programme in collaboration with CWSA of the GWCL,

provided many of the communities in the municipality with portable drinking water. The broad

objective of the study was to examine the extent to which stakeholders implement sustainable,

cost-effective and environmentally friendly management options for water resources in the Ga

East Municipality. 138 household heads were selected using a two-stage sampling procedure.

The first stage involved the selection of the communities, and the second stage involved

sampling for the household heads using systematic sampling procedure. Questionnaire was used

to collect data from the respondents. A checklist was also developed to conduct discussion with

relevant stakeholders. Participant observation was also employed by taking an “environmental

tour” in the communities to ascertain the conditions surrounding the water facilities. The findings

of the study revealed that (1) the level of participation by the beneficiary communities regarding

the provision of the facility was very low, (2) majority of the respondents (over 75%) were more

willing to pay extra cost for expansion and improved water services, (3) households conceded

that the provision of the water has actually influenced their lives, and (4) the facility sites are

well maintained. The overall results showed that the management of the water scheme is very

good, except that a lot more needed to be done to expand the facility to the outskirts and to those

who wish to connect the water to their homes.

University of Ghana http://ugspace.ug.edu.gh

vi

TABLE OF CONTENTS

DECLARATION ............................................................................................................................ ii

DEDICATION ............................................................................................................................... iii

ACKNOWLEDGEMENT ............................................................................................................. iv

ABSTRACT .................................................................................................................................... v

TABLE OF CONTENTS ............................................................................................................... vi

LIST OF TABLES .......................................................................................................................... x

LIST OF FIGURES ....................................................................................................................... xi

LIST OF MAPS ............................................................................................................................ xii

ABBREVIATIONS AND ACRONYMS .................................................................................... xiii

CHAPTER ONE ............................................................................................................................. 1

INTRODUCTION AND BACKGROUND ................................................................................... 1

1.0 INTRODUCTION ................................................................................................................. 1

1.1BACKGROUND .................................................................................................................... 1

1.2 PROBLEM STATEMENT ................................................................................................... 4

1.3 RESEARCH QUESTIONS ................................................................................................... 9

1.4 OBJECTIVES OF THE STUDY ........................................................................................ 10

1.5 JUSTIFICATION OF THE STUDY................................................................................... 10

1.6 LIMITATIONS OF THE STUDY ...................................................................................... 11

1.7 OVERVIEW OF THE STUDY AREA .............................................................................. 11

1.7.1 Demographic Characteristics ........................................................................................ 13

1.7.2 The Physical and Natural Environment of the Area ..................................................... 13

1.7.3 Economic Infrastructure and Services .......................................................................... 14

1.7.4 Water and sanitation situation ...................................................................................... 15

CHAPTER TWO .......................................................................................................................... 16

LITERATURE REVIEW ............................................................................................................. 16

2.0. INTRODUCTION .............................................................................................................. 16

2.1. THEORETICAL FRAMEWORK ..................................................................................... 16

2.1.1 The Theory of Public Good .......................................................................................... 16

2.1.2. The Demand – Driven Model ...................................................................................... 17

University of Ghana http://ugspace.ug.edu.gh

vii

2.2. CONCEPTUAL FRAMEWORK ...................................................................................... 18

2.2.1. Explanation of the Framework .................................................................................... 20

2.3 TRENDS OF POVERTY IN DEVELOPING COUNTRIES ............................................. 21

2.4. THE RURAL COMMUNITY ........................................................................................... 22

2.4.1. Characteristics of Rural Areas ..................................................................................... 24

2.4.2 Why are rural areas important? .................................................................................... 25

2.5. RURAL HOUSEHOLD ..................................................................................................... 26

2.6. SUSTAINABILITY OF RURAL LIVELIHOOD ............................................................. 27

2.7. NATURAL RESOURCE ................................................................................................... 28

2.8. LIVELIHOOD ASSETS / RESOURCES .......................................................................... 29

2.9. WATER MANAGEMENT SYSTEMS ............................................................................. 31

2.9.1 Water Management and the MDGs .............................................................................. 33

2.9.2. The MDGs and their Relevance to the Water Sector in Ghana ................................... 33

2.10 NATIONAL WATER POLICY OF GHANA .................................................................. 35

2.11 THE RURAL WATER SECTOR IN GHANA ................................................................ 36

2.10.1 Expansion of water supply to rural areas in Ghana .................................................... 38

2.12 IMPORTANCE OF IMPROVED WATER SUPPLY SYSTEM ..................................... 40

2.12.1. Economic benefits of reduced collection time .......................................................... 41

2.12.2 Economic costs of breakdowns in water supply ......................................................... 41

2.13 IMPROVING DOMESTIC WATER SUPPLY SYSTEM ............................................... 42

2.14 PROMOTING PARTICIPATION IN RURAL WATER SUPPLY ................................. 42

2.15 CLIMATE CHANGE AND THE ROLE OF WATER .................................................... 44

2.15.1 Impacts of Climate Change on Water Resources ....................................................... 45

CHAPTER THREE ...................................................................................................................... 47

RESEARCH METHODOLOGY.................................................................................................. 47

3.0 INTRODUCTION .......................................................................................................... 47

3.1 RESEARCH DESIGN ........................................................................................................ 47

3.2 STUDY POPULATION ..................................................................................................... 48

3.3 THE TARGET POPULATION .......................................................................................... 49

3.4 SAMPLING PROCEDURE ................................................................................................ 49

3.5 SAMPLE SIZE .................................................................................................................... 51

3.6 DATA COLLECTION INSTRUMENTS ........................................................................... 53

University of Ghana http://ugspace.ug.edu.gh

viii

3.7 ANALYSIS OF DATA ....................................................................................................... 55

3.8 CHALLENGES FROM THE FIELD ..................................................................................... 56

CHAPTER FOUR ......................................................................................................................... 57

RESULTS AND DISCUSSIONS ................................................................................................. 57

4.0 INTRODUCTION ............................................................................................................... 57

4.1 SOCIO - ECONOMIC PROFILE OF THE HOUSEHOLDS ............................................ 57

4.1.1 Gender distribution ....................................................................................................... 57

4.1.2 Age distribution of respondents .................................................................................... 58

4.1.3 Level of education ........................................................................................................ 59

4.1.4. Marital Status ............................................................................................................... 61

4.1.5 Household size and density: ......................................................................................... 62

4.1.6 Role of participants in the family ................................................................................. 63

4.1.7 Economic status of respondents ................................................................................... 63

4.1.8 Sources and levels of income ........................................................................................... 65

4.2 WATER SITUATION AND SOURCES IN THE AREA .................................................. 67

4.3 KNOWLEDGE OF THE PROVIDER OF THE UTILITY ................................................ 69

4.4 PARTICIPATION OF THE COMMUNITY IN THE PROVISION OF THE UTILITY .. 70

4.5 CASH CONTRIBUTION BY COMMUNITY .................................................................. 74

4.5.1 Fund Raising Strategies ................................................................................................ 76

4.6 STABILITY OF WATER SUPPLY ................................................................................... 77

4.7 WATER PRICING REGIME/SYSTEM ............................................................................ 78

4.8 HOUSEHOLDS DAILY EXPENDITURE ON WATER .................................................. 79

4.9 IMPROVING THE EXISTING WATER SYSTEM .......................................................... 81

4.10 WATER SAFETY AND QUALITY ................................................................................ 81

4.10.1 State and sources of water in the communities .............................................................. 82

4.10.2 Location of Public Pipe Stands ................................................................................... 84

4.11 WILLINGNESS TO PAY FOR IMPROVED WATER SERVICES ............................... 86

4.12 WATER AND HEALTH .................................................................................................. 89

4.13 THE MANAGEMENT OF THE FACILITY ................................................................... 91

4.13.1 Formation of the Management Board ......................................................................... 92

4.13.2 Functions of the Watsan Committees and the Boards ................................................ 92

4.13.3 The Executive Committee .......................................................................................... 93

University of Ghana http://ugspace.ug.edu.gh

ix

4.13.4 Functions of the Executive Committee ...................................................................... 93

4.13.5 Supporting Agencies................................................................................................... 95

4.14 REVENUE MOBILIZATION .......................................................................................... 95

4.15 CAPACITY BUILDING................................................................................................... 96

4.16 MANAGING THE ENVIRONMENT OF THE FACILITIES ........................................ 96

4.17 CHALLENGES FACING THE BOARD IN THE MANAGEMENT OF THE UTILITY

................................................................................................................................................... 97

CHAPTER FIVE .......................................................................................................................... 99

SUMMARY, CONCLUSION AND RECOMMENDATIONS ................................................... 99

5. 0 INTRODUCTION .............................................................................................................. 99

5.1 SUMMARY ........................................................................................................................ 99

5.2 FINDINGS OF THE STUDY ........................................................................................... 100

5.3 CONCLUSION AND LESSONS LEARNT .................................................................... 105

5.4 RECOMMENDATIONS .................................................................................................. 107

REFERENCES ........................................................................................................................... 110

APPENDIX 1 .............................................................................................................................. 115

APPENDIX 2 .............................................................................................................................. 119

APPENDIX 3 .............................................................................................................................. 121

University of Ghana http://ugspace.ug.edu.gh

x

LIST OF TABLES

Table 3.1 Number of Communities in each Zone………………………………………………..50

Table 3.2 Number of Towns and Households Selected………………………………………….51

Table 3.3 Data required and the instrument to be used…………………………………..............54

Table 4.1 Gender / Sex of respondents…………………………………………………………..57

Table 4.2 Educational Level of Respondents……………………………………………............60

Table 4.3 Household Size………………………………………………………………………..63

Table 4.4 Role of Participants in the Family…………………………………………………….64

Table 4.5 Primary Occupation of the Study Area……………………………………………….64

Table 4.6 Average Monthly Income Grouped…………………………………………...............66

Table 4.7 Distribution of public pipe stands per community…………………………….............69

Table 4.8 Knowledge of Provider of the Water Utility………………………………………….70

Table 4.9 Households’ Participation in water management……………………………………..72

Table 4.10 Community contribution……………………………………………………………..76

Table 4.11 Distribution of Households Contributions…………………………………………...77

Table.4.12 Cost of Water………………………………………………………………………...78

Table 4.13 Determination of cost of water………………………………………………............78

Table 4.14 Perception of the state of Water……………………………………………………...84

Table 4.15 Water Safety…………………………………………………………………............84

Table 4.16 Distance to Pipe Stands in the Communities………………………………………...85

Table 4.17 Willingness to Pay ………………………………………………………..................87

Table 4.18 Estimated Deaths from Water-Related Diseases…………………………….............90

Table.4.19 Representation on the Water Board………………………………………….............94

University of Ghana http://ugspace.ug.edu.gh

xi

LIST OF FIGURES

Figure 2.1 Diagrammatic presentation of Conceptual Framework……………………………...19

Figure 4.1 Age Distribution of Respondents…………………………………………………….58

Figure 4.2 Marital Status of Respondents………………………………………………………..61

Figure 4.3 Distribution of Economic Activities………………………………………………….65

Figure 4.4 Households Average Daily Expenditure on Water ………………………………….80

Figure 4.5 Amount Households are willing to Pay……………………………………………...88

University of Ghana http://ugspace.ug.edu.gh

xii

LIST OF MAPS

Map 1.1 Map of Ga East Municipality within Greater Accra Region…………………………12

University of Ghana http://ugspace.ug.edu.gh

xiii

ABBREVIATIONS AND ACRONYMS

CBNRM - Community Based Natural Resources Management

COM - Community Ownership and Management

CSOs - Community Service Organizations

CWSA - Community Water and Sanitation Agency

CWSP - Community Water and Sanitation Project

DA - District Assembly

DANIDA - Danish International Development Agency

GEMA - Ga East Municipal Assembly

GWSC - Ghana Water and Sewage Cooperation

GWCL - Ghana Water Company Limited

GPRS - Ghana Poverty Reduction Strategy

HIPC - Highly Indebted and Poor Country

IDWSD - International Drinking Water Supply and Sanitation Decade

ILO - International Labour Organization

MDGs - Millennium Development Goals

MWST - Municipal Water and Sanitation Team

MHMT: - Municipal Health Management Team

MWSA - Municipal Water and Sanitation Agency

NCWSSP - National Community Water Supply and Sanitation Policy

NCWSP - National Community Water and Sanitation Programme

NGO - Non Governmental Organization

NRM - Natural Resource Management

PPP - Public-Private Partnerships

UN - United Nations

University of Ghana http://ugspace.ug.edu.gh

xiv

UNDP - United Nation Development Programme

WATSAN - Water and Sanitation Committee

WSDB - Water and Sanitation Development Board

WRC - Water Resources Commission

WHO - World Health Organization

WTP - Willingness to Pay

WUAs - Water User’s Associations

University of Ghana http://ugspace.ug.edu.gh

1

CHAPTER ONE

INTRODUCTION AND BACKGROUND

1.0 INTRODUCTION

This chapter presents an introduction and background information to the study. It gives an

exposition of the research problem, raises questions about the problem and states the objectives

of the study. Also discussed in this chapter are the justification, limitations of the study and an

overview of the study area, which provides further insight information on the geography, the

economic as well as the physical attributes of the area.

1.1BACKGROUND

The year 2005 marks the beginning of the United Nations “International Decade for Action:

Water for Life” (Moe and Rheingans, 2006). Within this framework is a renewed effort to

achieve the Millennium Development Goals (MDGs) with the sole aim of reducing by half, the

percentage of the world’s population without sustainable access to safe drinking water by 2015

(Moe and Rheingans, 2006). There is however, little uncertainty that those striving to reach that

goal will not be able to bring sustainable supplies of water to majority of the rural people in the

next few years (Lockwood, 2004). This is because in the view of Moe and Rheingans (2006),

majority of rural poor live in areas which are resource poor, highly heterogeneous and risk prone.

This fear and uncertainty of water not reaching the rural poor was confirmed by the

WHO/UNICEF (2006), who projected that over 1.1 billion people lack access to improved water

supplies. This means providing safe drinking water to meet the MDGs will necessitate extensive

economic resources, sustainable technological solutions and spirited political will.

University of Ghana http://ugspace.ug.edu.gh

2

According to Henderson and Wade (1996) providing safe and affordable drinking water has been

linked to the essential factors that enhance both human well‐being and to securing sustainable

livelihoods. Rural livelihoods therefore, depend on a wide range of resources such as land and

water, but access to such resources varies greatly among communities and household members.

The use and control of these resources must be understood in order to plan and implement

interventions that can assist rural people to strengthen their livelihoods (FAO, 2004).

The DFID (1999) explained livelihood as a way of putting people at the centre of development.

Similarly, Chambers and Conway (1992) cited by Scoones (1998), have earlier said that

livelihood is the capabilities, assets (including natural and social resources) and activities that are

required for a means of living. The preferred combination of assets and activities undertaken at

the household level is often referred to as the household’s “livelihood strategy”, which

encompasses not only activities that generate income but also other kinds of elements such as

cultural and social choices (Ellis, 2000).

The concept of sustainability in water resource management has now gained much attention than

ever, because issues related to water resources are becoming more complex. By applying the

sustainability principles, it is anticipated that available water resources can be utilized not only

by the existing generation but also by future generations (Scoones, 1998). Similarly, Carney

(2002) cited by Rajendra (2006), explained that a livelihood is only sustainable when it can cope

with and recover from stresses and shocks and maintain or enhance its capabilities and assets

both now and in the future, without undermining the natural resource base.

University of Ghana http://ugspace.ug.edu.gh

3

Water is a valuable natural resource, vital for life, development and for the maintenance of a

healthy ecosystem. It can be a matter of life and death, depending on how it occurs and how it is

managed (WHO/UNICEF 2006). When it is too much or too little it can bring destruction,

misery or death. Irrespective of how it occurs, if properly managed, it can be an instrument for

economic survival and growth. Water can be an instrument for poverty alleviation and at the

same time bringing prosperity to all. However, when it is inadequate in either quantity or quality,

it can be a limiting factor in poverty alleviation and economic recovery, which may then result in

poor health, low productivity, food insecurity and inhibited economic development (UN-

WATER/AFRICA, 2004, cited in Gbadegesin and Olorunfemi, 2007).

Water resources management must therefore seek to address the linkages and trade-offs among

ecological needs and services, human welfare, and desired human uses of water (NRC 2000). It

is through the interaction of the environmental, economic, and social-cultural sectors that

sustainable water resources can occur. The management of water thus, involves utilization,

conservation, protection and control that incorporate physical, social, economic as well as

environmental interdependence (NRC 2000). According to USAID (2006), water management

involves collection, piping, purification, storage, transportation, distribution, and

commercialization of potable water.

The new emphasis on water resources management now recognise that water is a commodity of

strategic importance because of increasing demands and rising costs, coupled with diminishing

supplies. It also recognize that it is no longer feasible in a long term, cost-effective and

environment friendly manner to increase water supply by building additional dams and

conveyance systems, sinking new wells, and constructing desalinization plants. It is now

University of Ghana http://ugspace.ug.edu.gh

4

accepted that solutions must be found at the user-end of the pipe, which is, improving water use

productivity, reducing conveyance losses, reusing water and optimizing allocation (Sanstrom,

1997, cited in Gbadegesin and Olorunfemi, 2007). This has become necessary because as

population increases and development calls for increased allocations and provision of both

groundwater and surface water for the domestic, agriculture and industrial sectors, the pressure

on water resources intensifies, leading to tensions, conflicts, and excessive pressure on the

environment is of serious concern (UN, 2011).

1.2 PROBLEM STATEMENT

Water, an important natural resource, has always played a key role in economic development,

and economic development has always been accompanied by water development. Investment in

water management has been repaid through livelihood security and reductions in health risks,

vulnerability and poverty. The contribution of water to poverty alleviation comes in many ways;

through sanitation services, water supply and affordable food, enhanced resilience of poor

communities faced with diseases, climate shocks and environmental degradation. Water quality

can improve health through better sanitation and hygiene and, when applied at the right time, can

enhance the productivity of land, labour and other productive inputs. In addition, healthy

freshwater ecosystems provide multiple goods and services essential to life and sustainable

livelihood (UN-WATER, 2006).

Water management play a key role as part of strategies to achieve most of the MDGs, either by

directly contributing to or indirectly creating conditions where the different goals and targets are

more likely to be attained. The Millennium Declaration calls for sustainable water management

strategies at the national, regional and local levels which promote both equitable access and

University of Ghana http://ugspace.ug.edu.gh

5

adequate supplies. Realizing that this will call for commitments of resources and political will to

create the institutional capacities, favorable governance conditions, and adequate flows of

investments are needed to make it happen (ADB, 2004).

However, the management of water resources has been one of the most critical challenges facing

many developing countries today. The exploitation of high-value natural resources – minerals

and timber has often been described as one of the key factors which can set off violation of

conflict around the world. The increasing competition over diminishing renewable resources

such as land and water is on the rise. They have come under increasing pressure from both

increasing population and higher levels of economic activity per capita and further aggravated by

environmental degradation and climate change (UN-EU, 2008).

The current approaches to local water management, according to Khanal (2003) can be

summarized by two key actions:

• Development and empowerment of Water User’s Associations (WUAs) as new form of

governance and management of water system;

• Supporting the new organization through participatory design process to help build up their

capacity to manage water and provide better working conditions through more compatible

technologies and water management practices.

Participatory and process-based intervention by stakeholders and social learning has been widely

called for to support water management. However studies have shown that they fall short in real

practice. Though efforts have been made to shift away from blue-print towards the process

approaches, in reality, blue-print ideas about project planning and implementation dominates the

University of Ghana http://ugspace.ug.edu.gh

6

intervention, and learning and participation are mostly confined at local level of project

implementation. Participatory and process-driven approaches have become a sort of ‘good

theory, poor practice’. There is a need for fundamental changes in the way projects are designed

and implemented to achieve participatory development in real world situation (Khanal, 2003).

Another major constraint in embedding participatory approaches in water management comes

from lack of initial learning of the system environment both by the users and outside facilitators.

Water resources systems are socio-technical systems and technology of the system shapes and

are shaped by ecology and society. Designing for participation for water management should

thus begin considering both the human and the physical dimension of the system. The strength of

participatory design depends first on what people, both users and designers know about the

system, and its opportunities and constraints. The use of participatory approaches without

understanding of system environment ultimately leads to its instrumental use without any scope

for beneficial change (Khanal, 2003).

The lack of access to safe drinking water is at the heart of the poverty trap. In Africa alone, it is

estimated that over 25% of the population (approximately 200 million people) are currently

experiencing water stress, and more countries are expected to face high risks in the future. This

may lead to increase food and water insecurity for water deficits (Ludi, 2009).

It is also on record that in many African countries, the most affected by water scarcity are

women and children who go out to search for water. They suffer in terms of illness, drudgery in

water collection, and lost opportunities because of the time that water collection consumes. In

some drier areas, they can spend as long as half a day to get just one bucket of water. This affects

University of Ghana http://ugspace.ug.edu.gh

7

children’s education, since they have to skip classes in order to go around looking for water.

Worse of all, the water that is available in most cases is unsafe for drinking, and this contributes

to the spread of water borne diseases, like cholera, bilharzia, amoebic dysentery and typhoid

fever. Therefore, the presence of clean, safe, and sustainable water supply in rural Africa is

essential for the improvement of people’s lives for health, education and economic growth

(NPCA, 2010).

In Ghana, following a review of policies and the results achieved at the end of the IDWSD in

1990, reforms were introduced in the early 1990’s to accelerate the coverage of the rural

population with good drinking water and sanitation facilities (Fresh Water Ghana, 2004). The

Rural Water Department of the Ghana Water Company Limited (GWCL) was then set up as an

autonomous Community Water and Sanitation Agency (CWSA) by an Act of Parliament (Act

564) in 1998. A new policy was introduced that requires that supply of water to rural areas be

demand driven and community managed. The beneficiary communities were then required to

make a contribution of at least 5% of the capital cost of providing the facility (CWSA, 2007).

Through this policy Ghana under the MDG 7 target 7C reduced the proportion of the population

without access to improved drinking water from 44% in 1990 to 16.2% in 2008. This implies that

Ghana is on track to achieving the MDGs target of reducing by half the proportion of the

population without access to improved water sources well ahead of the 2015 target date

(NDPC/GoG/UNDP, 2010).

However, despite the massive investment and impressive improvements in ‘water coverage’ in

Ghana, large numbers of people in rural areas still do not have access to adequate water supplies.

Many systems that exist are not functioning adequately or at all due to broken pumps and other

University of Ghana http://ugspace.ug.edu.gh

8

factors. As a result people are often stuck with systems that provide intermittent supplies,

shortages during dry seasons and drought, and rely upon costly supplies from water vendors

during periods of scarcity. According to Butterworth and Soussan (2001) the causes of these

persisting water supply failures can be attributed to engineering shortcomings, physical

constraints not properly addressed at the planning stage, institutional/ management failures

among others.

According to the GPRS 1 (2002), the factors which have constrained the supply of water to rural

areas in Ghana include; low installed plant capacity, limited ability of communities to contribute

to capital costs, lack of local community education and participation, lack of co-ordination of

sector agencies, low bore-hole yield, poor quality of ground water, and managerial challenges,

which include low levels of training of local maintenance staff with the result that bore-holes

remain out of service for longer than necessary, and difficulty in establishing spare parts outlets

in remote rural areas.

There is also substantial evidence as noted by Lockwood (2004) to suggest that after a number of

years of operation, many rural water systems face a variety of problems and obstacles if they are

to maintain services. The major problems stem from inappropriate technical or financial designs

and these include: (i) problems with physical infrastructure, such as system breakdown or lack of

available spare parts, (ii) financial problems largely associated with the failure to pay tariffs or

with high operating costs for systems relying on electricity for pumping, (iii) managerial /

organizational problems, such as the politicization of management committees, (iv) health

problems caused by the failure to maintain improved hygiene practices, relating to the proper use

University of Ghana http://ugspace.ug.edu.gh

9

of water and excreta disposal facilities, and (v) environmental problems leading to a reduction in

source water quantity or quality.

The Ga East Municipal Assembly being one of the infant municipalities in the Greater Accra

Region is not only facing physical infrastructural challenges but is also saddled with water

constrains. The Municipal Assembly is responsible for water supply in the rural areas and small

towns. The Assembly is currently managing three small towns’ piped schemes through Water

and Sanitation Development Boards (WSDD), which cover twenty-three communities. This

places an obligation on the Assembly to ensure that the facilities are managed in a sustainable

manner. This research is therefore intended to assess how the stakeholders are managing the

water infrastructure systems, improve upon the existing schemes, increasing access to clean

drinking water in the municipality and the impact this is making on the overall livelihood of the

people.

1.3 RESEARCH QUESTIONS

This study is intended to provide answers to the following questions:

1. To what extent does the water management structure represent the interests of all stakeholders

/ users?

2. How does the water tariff regime affect the income levels of rural households?

3. To what extent does the participation of rural community members influence quality of

decision making in the management of rural water system?

University of Ghana http://ugspace.ug.edu.gh

10

1.4 OBJECTIVES OF THE STUDY

The broad objective of the study is to examine the extent to which stakeholders implement

sustainable, cost-effective and environmentally friendly management options for water resources

in the Ga East Municipality.

The specific objectives are:

1. To assess the level of participation of rural community members in the provision and

management of rural water system.

2. To investigate the willingness of rural households to pay for improved water supply services.

3. To assess how the provision of improved water services has influenced the lives of rural

households.

4. To undertake an environmental site assessment of the available water resources of the

beneficiary communities.

1.5 JUSTIFICATION OF THE STUDY

The outcome of the study is expected to help improve basic water supply services in the Ga East

Municipality. This study will hopefully provide information to support a means not only to

increase the demands of water supply for the rural communities, but also assist in gaining

community support for needed funds for maintenance and to secure sense of ownership. The

study will thus contribute to existing knowledge in the management of water resources.

The study is therefore anticipated to contribute to:

1). Effective rural water supply and systems for sustainable livelihoods.

University of Ghana http://ugspace.ug.edu.gh

11

2). An understanding of how participatory decision making has taken root in the selected

communities, and how it is creating inter-personal and intra-organizational relationships in the

rural water supply system.

1.6 LIMITATIONS OF THE STUDY

The presence of a spouse, children and / or other family members in the course of the interview

potentially influenced the kind of answers respondents gave to some “sensitive questions”.

Although the study targeted heads of households, it ended up including “young adult

respondents” because “the head” was not around at the time of the interview. It would have

better if the researcher had investigated all the towns provided with water facilities. However,

that was not possible due to time and resource constraints. More importantly, the municipality’s

proximity to the nation’s capital, Accra has greatly influenced the migration of many more

people to the municipality. For this reason majority of the “migrant respondents” included in the

study could not adequately provide answers to some of the questions posed to them.

1.7 OVERVIEW OF THE STUDY AREA

The study was carried out in the Ga East Municipality of the Greater Accra. The municipality

was created out of the then Ga District Assembly on 18th of February 2004 by Local

Government Act, 1993 (Act 462). The Municipal Assembly is located in the northern part of

Greater Accra Region. It is one of the ten (10) districts in the region and covers a Land Area of

166 sq km. It shares boarders with four districts, namely; Ga West Municipal Assembly

(GWMA) on the west, Adenta Municipal Assembly (AdMA) on the east, on the south by Accra

Metropolitan Assembly (AMA) and on the north by the Akwapim South District Assembly

(ASDA). There are about 65 settlements in the municipality with Abokobi, a well known

University of Ghana http://ugspace.ug.edu.gh

12

Presbyterian community as the capital. The population is concentrated mainly along the urban

and peri-urban areas of the municipality particularly along the border with AMA to the south,

and these include Madina, Dome, Taifa and Haatso (www.ghanadistricts.com, March 10, 2012).

Figure 1.1 Map of Ga East Municipal within Greater Accra Region

Credit: GEMA

University of Ghana http://ugspace.ug.edu.gh

13

1.7.1 Demographic Characteristics

The 2010 national housing and population census recorded a total of 259,668 persons in the

municipality. This figure exceeded the 2000 population census with a total population of 161,

873 persons. This means there have been additional 97,795 persons who have moved and

residing in the municipality within the last ten years. This also means the municipality increased

in population wise by 60.41%. The population is now made up of 127,258 males and 132,410

females, representing 49.01% and 50.99% respectively (GSS, 2012).

The growth of the population is mainly due to the influence of migration inflows. The projected

population is considered rather high considering the inflow of people into the municipality since

its creation in 2004. The structure of the population has about 49 % males and 51% females with

an average household size of 6.2. There are about 65 settlements in the municipality with

Abokobi, a well known Presbyterian community as the capital. The population is concentrated

mainly along the urban and peri-urban areas of the municipality particularly along the border

with AMA to the south, and these include Dome, Taifa and Haatso. The relatively high

proportion of women calls for specific policies to address their concerns such as access to

potable water. (www.ghanadistricts.com, assessed 10th March, 2012).

1.7.2 The Physical and Natural Environment of the Area

The Municipality falls in the savannah agro-ecological zone. Rainfall pattern is bi-modal with

the average annual temperature ranging between 250C in August and 28.40C between February

and March. The Municipality has two main vegetations namely shrub lands and grassland. The

shrub lands occur mostly in the western outskirts and in the north towards the Aburi hills and

consist of dense cluster of small trees and shrubs that grow to an average height of about five

University of Ghana http://ugspace.ug.edu.gh

14

meters. The grassland which occurred to the southern parts of the district has now been

encroached upon by human activities including settlements (www.ghanadistricts.com, 10th

March, 2012).

1.7.3 Economic Infrastructure and Services

The Ga East Municipality has a great deal of opportunities for both private investment and joint

ventureship with the public sector. There are four main economic activities in the municipality

which are industry, service, agriculture and commerce. However, farming is the major economic

activity for about 55% of the economically active population. About 70% of the rural population

depends on agriculture as their main source of livelihood with about 95% of them being small

holders. The major agricultural activities are crop and livestock production. Among the wide

range of crops grown are cassava, maize and a host of vegetables. There are a number of poultry

farms in and around Oyarifa and Abokobi. The major ones include Amas Farms and Vida Farms

at Oyarifa and the Abokobi Agric Station (GEMA, 2012).

Even though tourism has become one of the main sources of income and employment generation

in the country, the Ga East Municipal Assembly is yet to reap its full benefits. There are a

number of tourist sites that has the potential of rivaling some of the well known tourist sites in

the country. Though largely undeveloped, these sites hold the key to the area’s development if

steps are taken to tap the large potential they present. These sites include the Royal Danish

Plantation, Frederiks cave (Danish Slave Fort) built in 1832 by King Frederik VI at Sesemi, the

African Village near Sesemi. The historical origin of Abokobi as a settlement for Presbyterian

missionaries and their cemetery, and a number of archaeological sites at Oyarifa are potential

avenues for income generation for the assembly (GEMA, undated).

University of Ghana http://ugspace.ug.edu.gh

15

1.7.4 Water and sanitation situation

Supplying clean drinking water to the urban/ peri-urban areas of the municipality has been a

major challenge to the assembly, more so when it has no direct control over urban water supply.

However, the Assembly is responsible for rural water supply. The Assembly is currently

managing three small towns’ piped schemes through Water and Sanitation Development Boards

(WSDD). These are Abokobi-Oyarifa-Teiman-Sesemi scheme, Kweiman-Danfa scheme and

Pantang Area Pipe scheme, and these cover twenty-three communities GEMA, 2012).

The rate of waste generation and management in the Municipality is a matter of concern to the

Assembly. With the increasing influx of people and the rapid urbanization, huge amounts of

human and industrial waste are generated at an alarming rate. It is estimated that about 750

tonnes of solid waste is generated monthly out of which 490 tonnes are collected which

represents 65%. This leaves a substantial amount of backlog that creates various kinds of

inconveniences including health hazard to people in the municipality

The situation is compounded by the inadequate machinery and equipment by the Assembly and

the private collectors. Also the absence of proper engineered final disposal site is a major

constraint. The constant burning of the waste at the dumping site is creating serious air pollution

and threatening the life of people in the surrounding communities (GEMA, 2012).

University of Ghana http://ugspace.ug.edu.gh

16

CHAPTER TWO

LITERATURE REVIEW

2.0. INTRODUCTION

This chapter deals with the literature review to serve as the basis of the study. The presentation

begins with the theoretical and conceptual framework of the study, followed by a brief

discussion on trends of poverty in developing countries, characteristics of rural communities and

ends with climate change and the role of water. The literature specifically deals with natural

resources, livelihood strategies and outcomes, water supply system and sustainability, policies,

institutions and processes.

2.1. THEORETICAL FRAMEWORK

This section examines some approaches to enhancing management of communal resources, of

which the following are considered.

2.1.1 The Theory of Public Good

A public good, (sometimes referred to as a “collective good” or a “social good”) as defined by

economic theory, is a good that, once produced, can be consumed by an additional consumer at

no additional cost. A second characteristic is sometimes added, specifying that consumers cannot

be excluded from consuming the public good once it is produced (Holcombe, 1997).

The theory was first propounded by Samuelson in 1954, who defines collective consumption

goods as goods “which all enjoy in common in the sense that each individual’s consumption of

such a good leads to no subtraction from any other individual’s consumption of that good”. It

University of Ghana http://ugspace.ug.edu.gh

17

was emphasized that public good differ distinctively from private good, which can be parceled

out among different individuals. In the case of private good, it is possible to refer to total

consumption as the sum of each individual’s consumption. In contrast, from Samuelsson’s

definition, it follows that for public good, each individual may consume all of the good. In that

case for public good the total amount consumed is the same for each individual (Krepelka,

2007).

A Public Good has two distinct characteristics:

i. Non-rivalry or Jointness: Where several individuals can consume the same good without

diminishing its value. That is once the good is produced for one person, additional consumers

can consume at no additional cost. Goods that are joint in consumption are also called collective-

consumption goods or non-rival consumption goods (Holcombe, 1997).

.

ii. Non-excludability: where an individual cannot be prevented from consuming the good. That is

it is difficult to keep people from consuming the good once it has been produced. That is no

individual can sanction the consumption of the good. Even if the individual has the sanction

there is no ready mechanism by which it can be enforced (Holcombe, 1997).

2.1.2. The Demand – Driven Model

The components of a demand-driven process though somewhat differ depending on whom one

asks, but many people would generally agree that managing a community project should:

i. Involve households in the choice of both technology and institutional and governance

arrangements;

University of Ghana http://ugspace.ug.edu.gh

18

ii. Give women a larger role in decision-making than has historically been the norm;

iii. Require households to pay all of the operation and maintenance costs of providing water

services and at least some of the capital costs (Whittington et al 2008).

The underlying principle for households and women involvement in the choice of technology

and decision making process was to guarantee that engineering designs were responsive to local

needs and realities. Cost recovery through user fees is to ensure that: (1) households pay for

services to provide revenues to keep the system running, and to reduce dependency on higher-

levels of government. (2) charging households (part of) the capital cost of system construction

prior to installing the water supply system to establish a “demand filter” that theoretically

prevented water systems from being built in communities where they were low-priority

development projects, and (3) capital contributions by communities was expected to foster a

sense of community ownership of the facilities, which in turn was expected to solidify a

commitment to use and maintain the facilities (Whittington et al, 2008).

2.2. CONCEPTUAL FRAMEWORK

Water, according to Kim (1991) can be seen as a final product and/or a service that is provided to

consumers / users who have certain demand characteristics. In this study, water is much more

regarded as a service rather than a product. Therefore this framework is derived from a service

perspective. As a service the major concepts in consideration are; water as a service, livelihood

strategy, management of water supply system and the sustainability of this resource to continue

to provide the service as shown in Figure 2.1

University of Ghana http://ugspace.ug.edu.gh

19

University of Ghana http://ugspace.ug.edu.gh

20

2.2.1. Explanation of the Framework

This conceptual framework is built from the sustainable livelihoods thinking, which places

people at the center of development efforts (Chambers 1997, Carney and Ashely 1999). The

framework, however, introduces the theory of institutions and institutional change into it. The

management of rural water system in the framework is defined to include, the infrastructure

system, monitoring system, water distribution system, and rehabilitation, water pricing/tariff

regime, participation of community members, and the leadership style of the managing authority

of the water system. This is expected to influence water services.

The justification for improved domestic water supply system in rural areas is that it improves

rural livelihoods. For the purpose of this study, the livelihood outcome is defined to include

households’ wellbeing, reduced poverty, capacity building of rural household, improved health

and education, increase control over income, strong voice and reduced vulnerability of rural

households. This should translate into sustainability of the water system. Since this study focuses

on water systems, sustainability in the framework has been defined as: ‘the maintenance of an

acceptable level of services throughout the design life of the water supply system’ (Jennifer and

Tarvis, 2010).

In considering water as a service as appeared in the framework is seen as a system of supplying a

public need (water). It is, therefore, expected that the sustainability of the water services should

produce an improvement in rural water supply system which will lead to reduced drudgery and

enhance rural livelihoods. This translate into creating more time for personal and productive

uses, and above all, make water more available for both domestic and commercial uses.

University of Ghana http://ugspace.ug.edu.gh

21

Institutions, derived from a broad perspective of sociological and anthropological literatures

definition is ‘regularized practices or patterns of behaviour structured by rules and norms of

society which have persistent and widespread use’ (Scoones, 1998). Institutions thus may be

formal and informal, often fluid and ambiguous, and usually subject to multiple interpretations

by different actors. Institutions are also dynamic, continually being shaped and reshaped over

time. Power relations are rooted within institutional forms, making contestation over institutional

practices, rules and norms always important. They are thus part of a process of social

negotiation, rather than fixed ‘objects’ or ‘bounded social systems’ (Scoones, 1998).

2.3 TRENDS OF POVERTY IN DEVELOPING COUNTRIES

For many decades poverty has continued to permeate rural areas in many developing countries.

This situation arises from inappropriate public policies and poorly designed programmes and

projects which have both served to impoverish rural communities. The initiatives aimed at

bringing a transformation of the rural standards of living have not had the desired impact on rural

poverty reduction. Recent initiatives designed to put in place, decentralized mechanisms for rural

development offer possibilities for building on. However, they need to avoid problems associated

with an over centralization of functions and responsibilities, which are often carried out with

little or no input from the affected communities (Maina, 2009).

Maina, (2009) maintains that the social dimension of poverty is manifested in lack of basic

needs, food, health, shelter and education together with inability to engage in productive

endeavour, among a host of other problems which the poor people struggle with. The social and

economic consequences of poverty permeate the entire society afflicting even the well off, such

that not even the wealthy are able to live in peace and comfort where widespread poverty exists.

University of Ghana http://ugspace.ug.edu.gh

22

The spatial dispersion of rural population increases the cost and difficulty of providing basic

goods and services effectively. Specific economic conditions in rural areas also result in fewer

development opportunities being available than in urban locations, where agriculture is generally

the most important economic sector. This makes rural areas highly dependent on the

performance of a single crop where investments are risky due to weather and other conditions. In

addition, the tax base is limited, resulting in local governments in rural areas, often being unable

to mobilize sufficient resources to finance their own development programs (Maina, 2009).

Rural areas are often politically marginalized, leaving little opportunity for the poor to influence

government policies, including policies regarding what they produce. In many developing

countries, policies have consistently discriminated against agriculture through high levels of

taxation and other macroeconomic policies. As a result such policies adversely affect agricultural

performance together with the rural economic base, resulting in a net transfer of resources out of

rural areas. Combination of these factors result in high incidence of poverty and low level of

development as manifested in low income levels, illiteracy, and infant mortality among others.

However, poverty varies by regions, countries, and by socio-economic characteristics of

households in one region (Karingi 2001).

2.4. THE RURAL COMMUNITY

It has been entire easy for many writers to come out with the real meaning of what constitute

“rurality”. According to IIASA (2002), early definitions of “rurality” were based on sociological

theories, which highlighted the intrinsic differences between urban and rural communities. But

the simplistic notion of a sharp urban–rural dichotomy was soon rejected in favour of the urban–

rural continuum model developed by Redfield in 1941. This drew on evidence from the USA,

University of Ghana http://ugspace.ug.edu.gh

23

which demonstrated a continuous gradation, rather than the existence of discrete rural and urban

categories. Moreover, it was this model of a rural–urban continuum which provided the

conceptual framework within which “rurality” indices themselves were developed. Rather than

searching for real units which in some way were uniquely urban or rural, rurality indices instead

attempted to measure the diversity of rural environments, by locating particular localities along a

spectrum between urban and rural extremes.

In reality, the concept of "rural" cannot be narrowly defined. In fact, many definitions of rural

exist. The way people think of rural largely depends on where they are from and where they live.

While many people consider anything outside a large metropolitan area as rural, residents of

sparsely populated agricultural areas think of even small cities as urban. In practice, the U.S.A.

for instance defines rural in two ways: first, for highway functional classification and outdoor

advertising regulations, rural is considered anything outside of an area with a population of

5,000; second, for planning purposes, rural is considered to be areas outside of metropolitan

areas 50,000 or greater in population. This definition leaves a lot of room for significant

differences within these categories (Federal Highway Administration, 2012).

Therefore, it is prudent to describe rural based upon what we see across the country. In Ghana

the CWSA, (2004) described rural community as a group of households who refer to their

settlement by the same name. It is described to include groups of individuals living in close

proximity to each other and other social groups, grassroots entrepreneurs or associations able to

identify a need and come together to access project funds.

University of Ghana http://ugspace.ug.edu.gh

24

2.4.1. Characteristics of Rural Areas

Rural areas throughout the world, especially in the developing countries tend to possess similar

characteristics. Some of these characteristics are that populations are spatially dispersed;

agriculture is often the dominant economic activity, which is quite often the exclusive economic

sector, and limited resource mobilization opportunities. These characteristics imply that people

living in rural areas are often faced with a set of factors that pose challenges to their

development. The spatial dispersion of rural populations often increases the cost and difficulty to

effectively provide rural goods and services (ISRDS, 2000).

Although rural Ghana shares much in common with other countries, some features and

development challenges are unique. Like in many other countries, much of Ghana’s rural space

is sparsely populated. The demographics of rural Ghana like South Africa reflect its past policies

and the hurdles impeding efforts of rural people to maintain intact families. Many rural areas in

Ghana are dislocated settlements where people live in abject poverty with its attendant high costs

of transport for jobs and to accomplish basic tasks of daily life. Rural housing is often

substandard or nonexistent, and many people are migrants working in urban areas. The level of

interdependence between rural communities and distant large cities is very interesting. However,

the population is still quite mobile in search of better living conditions and jobs in the urban

towns (ISRDS, 2000).

Among other things the manufacturing base of rural people is weak compared to their urban

counterparts due to poorly developed infrastructure. It has also been noted that the specific

economic conditions in rural areas result in fewer opportunities. Agriculture and other natural

resource based activities provide the basis for many livelihoods. Local governments have little or

University of Ghana http://ugspace.ug.edu.gh

25

no tax base and weak human capacity and are rarely able to mobilize sufficient resources to

finance their own development programmes. It is also in evidence that traditional authorities

retain more influence over the population than is the case in urban areas. More importantly, the

operation of factor markets in rural areas is often imperfect, rendering the search for efficient

outcomes a daunting tax. Not only that, rural areas are often politically marginalized, leaving

little opportunities for the rural poor to influence political decisions and policies compared to

their urban counterparts (ISRDS, 2000).

2.4.2 Why are rural areas important?

While the urban-industrial agglomerations are certainly the centers of economic and social

development in many parts of the world, rural areas will become more important in the future.

The following are some of the reasons why rural areas are important to many economies;

1. The quality and reliability of our food supply depends on the economic, political and social

conditions of the agricultural sector and the state of our rural environment. Despite the

emergence of global food markets, most of world’s food is still produced in the rural areas.

2. Rural areas provide vital natural resources to urban centers, such as freshwater, timber, or

biomass. These resources are becoming increasingly important - either because of their scarcity,

or due to their special relevance for sustainable development.

3. Many sports and recreational activities, such as horseback riding, downhill skiing, hiking,

rafting, climbing, playing golf, or parachute gliding, require the open space, the beauty, or the

land-characteristics of rural areas. On weekends and during the holidays there is usually

a massive movement of the urban population to the countryside. The beauty of natural and

cultural landscapes is production factors in large sections of our tourist industry.

University of Ghana http://ugspace.ug.edu.gh

26

4. Many valuable natural ecosystems are located in rural areas. Some of them have a high density

of endangered species and have been declared biodiversity reserves. Protected rural areas are not

only important for preserving a rich gene pool for future generations, but also for educating

urban populations about the beauty of untouched natural landscapes.

5. With an expanding transportation and information infrastructure and relatively low

transportation and communication costs, rural areas in urban proximity are becoming attractive

living environments to certain urban populations. In many parts of Europe are facing a new wave

of sub-urbanization, which will require new approaches in regional and infrastructure planning.

2.5. RURAL HOUSEHOLD

People make their livelihoods within the context of a household. Many authors/writers have used

therefore used different definitions to show that households are diverse both in composition and

socio-economic status, and that they vary greatly from one culture to another and even within the

same community. It serves as the central point for biological production, socialization,

organization, planning and distribution of resources (FAO 2004).

‘A household’, according to SWELL (undated), ‘is a social unit where people are linked by some

or all of the following: blood, family, marriage, staying together, supporting each other, culture,

shared resources, and everything they have, do or own.’ Similarly, Matlon (1988) cited by FAO

(2004, p.21) defines a rural household as “the smallest group of persons usually, but not

exclusively kin - related, who form a more or less independent production and consumption unit

during the cropping season”. According to Chant (1997) cited by FAO (2004), households often

comprise of individuals who live in the same locality and who have common arrangements for

University of Ghana http://ugspace.ug.edu.gh

27

basic domestic and/or reproductive activities such as cooking and eating. In the view of

Gebremedhin (1997) cited by FAO (2004) a rural household “is a social and economic unit on

which its members depend for economic survival, maintenance, and social advancement.”

2.6. SUSTAINABILITY OF RURAL LIVELIHOOD

Planning for what combination of interventions is most appropriate in a particular site presents

some major challenges. For a start, defining what a sustainable livelihood is in a particular

context is always open to debate. The sustainable livelihood definition encompasses a range of

different criteria, some of which may conflict. ‘Sustainable livelihoods’ is thus a normative

concept which is made up of multiple and in some cases contested elements. SWELL (undated)

defined livelihood as a way of making a living. To make a living one needs to own or have

access to particular assets or resources, material and non-material. As people continue to engage

in different activities and strategies to make a living, what they use will depend on the resources

available to them. For instance, people require certain skills, time, relationships, tools and

materials to be able to grow, find, buy or barter for food, or to collect, buy and store water. They

will need the same kinds of resources to generate an income. If people do not own or have access

to the resources they need, they will be limited in how they make a living.

Carswell et al (1997) cited by Scoones (1998), describe sustainable livelihoods as a set of issues

which encompass much of the broader debate about the relationships between poverty and

environment. Nonetheless, there is often little clarity about how contradictions are addressed and

trade-offs are assessed. As e established earlier, the definitions of sustainable livelihood is often

unclear, inconsistent and relatively narrow. Without clarification, there is a risk of simply adding

to a conceptual muddle. Chambers and Conway (1992) in Scoones (1998) defined livelihood as

University of Ghana http://ugspace.ug.edu.gh

28

that which comprises the capabilities, assets and activities required for a means of living. A

livelihood is therefore sustainable when it can cope with and recover from stresses and shocks

maintain or enhance its capabilities and assets, while not undermining the natural resource base.

The SWELL (undated) workshop participants also defined sustainable livelihood as “a better

way of making a living; where people are able to maintain or even enhance their way of living on

an ongoing basis, relying on the assets and resources available to them”.

2.7. NATURAL RESOURCE

Whenever we talk about natural resources, reference is often made to major resources like land,

water, minerals, forests, fisheries, pasture and wild flora and fauna (wildlife). The sustainable

management of these resources is therefore of vital importance for rural livelihoods. This is

because majority of the rural poor are directly dependent upon natural resources (Boyd and

Turton, 2000). In the views of Bojö (2000), the management of these resources contributes to

poverty alleviation, and that they should be used in a sustainable manner to enhance human

welfare.

However, the management of natural resources has been one of the most critical challenges that

have bedeviled developing countries in recent times. The exploitation of high-value natural

resources, including minerals and timber has often been cited as key factors triggering, or

sustaining violation of conflict around the world. Furthermore, increase in competition and

conflict for diminishing renewable resources, such as land and water is on the ascendancy. This

is further aggravated by environmental degradation, population growth and climate change (UN-

EU, 2008).

University of Ghana http://ugspace.ug.edu.gh

29

The World Bank (1992) noted that as much as natural resources provide fundamental life support

in the form of consumptive and public-good services, they are coming under increasing pressure

from both increasing population and higher levels of economic activity per capita. Water as one

of such resources for human survival is becoming an increasingly scarce commodity in many

parts of the world. According to Engelman and Le Roy (1993), in the year 1990 alone 28

countries with a total population of about 335 million experienced “water stress.” This figure is

expected to go up to around 50 countries, there by affecting some 3 billion people by 2025. The

affected population could increase from 131 million in 1990 to between 800 million and 1.1

billion people by 2025.

In addition to water scarcity, the problem of access to safe water supplies is also intensifying.

Currently, one-fifth of the Earth’s population does not have access to safe drinking water.

Engelman and Le Roy (1993) predicted that between 1990 and 2000 an additional 900 million

people will be born in regions without access to safe water. The WHO also estimates that more

than 5 million people die each year from diseases caused by unsafe drinking water and lack of

water for sanitation and hygiene (Watson et al., 1998).

2.8. LIVELIHOOD ASSETS / RESOURCES

Resources are the means of production available to a person, household or group of people that

can be used in their livelihood activities. These assets are the basis on which livelihoods are built

and, in general, the greater and more varied the asset base the higher and more durable the level

of social security. The ability to pursue different livelihood strategies is dependent on the basic

University of Ghana http://ugspace.ug.edu.gh

30

material and social, tangible (things that can be seen or touched - land, water, capital and

production equipment) and intangible assets (which include skills, knowledge, self-esteem,

labour, time and social capital) that people have in their possession (FAO, 2004).

Drawing on an economic image the FAO (2004) further noted that livelihood resources may be

seen as the ‘capital base’ from which different productive streams are derived, from which

livelihoods are constructed. Carney (1998, in Soussan et al, 2004) suggests that there are five

dominant forms of livelihood assets:

• Natural Capital: the natural resource stock from which resource flows useful to livelihoods

are derived (soil, water, air, genetic resources etc.).

• Social Capital: The horizontal and vertical social resources (networks, membership of groups,

relationships of trust, access to wider institutions of society) upon which people draw in pursuit

of their livelihood.

• Human Capital: The skills, knowledge, ability to labour and good health important to the

ability to pursue livelihood strategies.

• Physical Capital: The basic infrastructure (transport, shelter, water, energy, and

communications) and production equipment and means which enable people to pursue their

livelihoods.

• Financial Capital: The financial resources which are available to people (savings, supplies of

credit, regular remittances or pensions) and which provide them with different livelihood

options.

University of Ghana http://ugspace.ug.edu.gh

31

2.9. WATER MANAGEMENT SYSTEMS

Water management was usually the responsibility of local institutions with a number of other

social and natural resource management (NRM) functions. Indeed, land use and water

management were often seen as two sides of the same coin. Land and water rights to a large

extend, were treated in indigenous systems as naturally connected (Orindi and Huggins, 2005).

Most indigenous systems of water management have been based on the perception that water for

certain limited uses was a free, open-access resource, while access to other uses was regulated

and controlled by specific groups (chiefs, clan leaders, or household heads). It is possible to

generalize that amidst the great variation found in water governance systems, the amount of

control increases in proportion to the degree of labour invested in the water source (Huggins,

2003).

Water management thus involves the utilization, conservation, protection and control that

incorporate physical, social, economic as well as environmental interdependence. According to

USAID (2006), water management involves; water Collection, piping, purification of non-

purified water and the storage, transportation, distribution, and commercialization of potable

water.

Gbadegesin and Olorunfemi (2007) also established that water management undergo a five stage

procedures. The first is the governance and decision-making stage. The second stage is the water

balance modeling. It is at this stage that the question: how much resources are available and who

needs it? is answered. It involves determining the volume of water available over space and time,

the present and future water needs as indicated by population growth, industrialization and

University of Ghana http://ugspace.ug.edu.gh

32

changing habit of use, and the socio-economic and ecological implications of water supply and

demand. The third is the management guideline development. The question, who gets how

much? is answered. It involves defining the policies, regulations and enabling environment as

well as the mechanism for sharing water resources between competing interests. The fourth stage

is the implementation stage, and it involves the determination of cost and price. Other issues

such as funding, institutional or capacity building, environmental sustainability, and public

awareness are tackled at this stage. The last stage is the water supply stage. It involves supplying

water for different uses and evaluating the use of water and its implications such as the human

dimensions of water supply, environmental sustainability, trans-boundary conflict of interests,

and effects of economic and population growth.

The proper management of water resources therefore impacts almost all aspects of society and

the economy, including food production and security, domestic water supply and sanitation,

health, energy, tourism, industry and the functioning of ecosystems. Under present climatic

variability, water stress is already high, particularly in many developing countries. Managing

water has always implied that societies deal with natural variability in the water supply and its

effect on competing uses. Climate change threatens to increase this variability, shifting and

intensifying extreme weather patterns, and introducing greater uncertainty in the quantity and

quality of water supply over the long term. Adaptation to the current climate variability, while

having direct benefits, can also help society to better prepare for the expected increased

variability in the future. Considering the increasing tension that water scarcity will place on the

environment and the importance of water in development mitigation, water management become

increasingly difficult. Therefore, the establishment of new institutions, networks, and better

University of Ghana http://ugspace.ug.edu.gh

33

coordination and exchange of information will be necessary (www.unwater.org, assessed 26th

June 2011).

2.9.1 Water Management and the MDGs

Improved water management can make a major difference to poverty reduction. The goals and

targets set out in the Millennium Declaration and the MDGs provide a specific structure for

analyzing the relationship between poverty reduction and water management. Water

management can play a key role as a part of strategies for achieving most the MDGs, by either

directly contributing or indirectly creating conditions where the different goals and targets are

more likely to be attained (ADB, 2004).

The Millennium Declaration calls for sustainable water management strategies at the national,

regional and local levels to promote both equitable access and adequate supplies. Being aware of

this will require commitments of resources and political will to create the institutional capacities,

conditions of conducive governance and adequate flows of investments needed to make it

happen. This is unlikely to be forthcoming unless a more coherent case that demonstrates the role

of water in poverty reduction is presented. Such a case can be based on demonstrating the

essential role of water in achieving the full set of Millennium Declaration goals and targets

(ADB, 2004).

2.9.2. The MDGs and their Relevance to the Water Sector in Ghana

The Government of Ghana has fully embraced the MDGs and considers the goals and drive

created around the MDGs as critical to Ghana’s own agenda for socio-economic growth. The

University of Ghana http://ugspace.ug.edu.gh

34

recent version of the Ghana Poverty Reduction Strategy (GPRS) which spelt out the detailed

medium term measures and targets for achieving the set goals from 2003-2005 is consistent with

the MDGs. Thirteen of the MDGs indicators are included in the GPRS core list. With regard to

development of the WSS Sector, the GPRS states a government commitment to “lifeline” tariff

and the setting of a regulatory unit to safeguard provision of water to the poor (TREND Group,

2003).

On the donor side, the access of Ghana to HIPC funds and the increasing attention to Multi-

donor Budget Support are considered clear indications of the importance the Government of

Ghana attaches to the achievement of MDG goals. On the whole Ghana is likely to achieve the

over-arching goals of halving extreme poverty well before the target 2015. There is less certainty

about the goals related to the water sector to be achieved. Institutional bottlenecks associated

with the decentralization process and the weak situation with sector financing has forestalled the

required accelerated development. Based on current trends the achievements of the MDG within

the sector are highly unlikely (TREND Group, 2003).

According to the UN, (2006), Water scarcity issues and the way they are addressed will affect

the successful achievement of most of the Millennium Development Goals. The eradication of

poverty and hunger in rural areas is related closely to fair and equitable access for the most

vulnerable people to basic livelihood assets (including land and water) for domestic and

productive uses. Because increased demand usually threatens the sustainability of the

environment in situations of scarcity, water scarcity management is also crucial to achieving the

goals of environmental sustainability.

University of Ghana http://ugspace.ug.edu.gh

35

2.10 NATIONAL WATER POLICY OF GHANA

The Government of Ghana in 1998 implemented the National Community Water and Sanitation

Program, which provided the basis for a new water policy. In the programme, the private sector,

district governments, and communities emerged as important players with primary responsibility

for planning and implementation (Kleemier, 2002). The CWSA was created as an independent

agency that is responsible for the rural drinking-water supply and for facilitating the

implementation of the national community and sanitation strategy. The CWSA adopted a

fundamentally different approach than the GWSC: coordinating and facilitating a community-

managed water supply (Lane, 2004). The CWSA has offices at the regional level but relies on

assigned district-assembly staff for implementation at lower levels.

The enactment of the community water and sanitation strategy, paved the way to formulate a

national policy with launching of a new water policy in October 2005. The National Water

Policy of Ghana aims at providing a framework for the sustainable development and utilization

of Ghana’s water resources. It is targeted at all water users, water managers and practitioners,

investors, decision-makers and policy makers within the central and decentralized government

structures such as the district assemblies, non-governmental organizations and international

agencies. The policy outlines the various cross-sectoral issues related to water-use and the links

to other sectoral policies such as relating to sanitation, agriculture, transport and energy. Ghana’s

Water Vision for 2025 is aimed to “promote an efficient and effective management system and

environmentally sound development of all water resources in Ghana” (Ministry of Works and

Housing, 2005, in Entsua-Mensah, et. al. 2007).

University of Ghana http://ugspace.ug.edu.gh

36

The three important development frameworks that inform Ghana’s water policy are:

• The global - Millennium Development Goals (Ministry of Works and Housing, 2003, in

Entsua-Mensah, et. al. 2007)

• The African region - New Partnership for African Development (NEPAD, 2001, in Entsua-

Mensah, et. al. 2007)

• The national – Ghana Poverty Reduction Strategy (Government of Ghana, 2000, in Entsua-

Mensah, et. al. 2007)

The Ghana Poverty Reduction Strategy (2003 – 2005), states in parts that “increasing access to

potable water is key to achieving health outcomes and sustained poverty reduction.” The GPRS

envisages improving provision of water to rural, peri-urban and unserved poor urban areas. A

Strategic Environmental Assessment (SEA) conducted on the GPRS showed that water, as a

cross-cutting thematic issue is highly relevant to promoting livelihood, health and vulnerability

issues in Ghana (Entsua-Mensah, et. al 2007).

2.11 THE RURAL WATER SECTOR IN GHANA

The Water and Sanitation Decade of the 1980’s has shown that achieving lasting benefits from

water supply interventions involves much more than building facilities. Governments have over

the years tended to pay more attention to building new facilities than to ensuring the use of

existing ones. Governments have thus played the role of provider rather than service promoter.

Roles for service planning, implementation, cost recovery, operations and maintenance, and asset

ownership are poorly defined and communicated. Although communities are usually expected to

provide a share of cost it is often unclear how the level of contribution has been determined or

how the level relates to demand. Furthermore, governments frequently assume that communities

University of Ghana http://ugspace.ug.edu.gh

37

will somehow “manage” their facilities, but do not help build capacity or commitment to do so

(Jennifer and Travis, 2009).

In Ghana the state-owned and centrally managed Ghana Water and Sewage Cooperation

(GWSC), established in 1965, has been responsible for both rural and urban water supplies (Yan,

Asante and Birner, (2010) in Bohman, (2005). The majority of rural water supplies were

boreholes fitted with hand pumps. The GWSC and non-governmental organizations (NGOs)

carried out most of the drilling in Ghana. There was only one Ghanaian private drilling company

before 2000 (Yan, Asante and Birner, (2010) in Kleemier, 2002).

The GWSC focused its attention on urban water supplies and did not have enough staff and

revenues for hand pump maintenance and rural pipe operations. It had just two or three staff at

the headquarters handling rural supplies, decision making for the rural sector passed de facto to

the large regional projects financed by external support agencies (WSP-AF, 2002). Finally, it

failed to ensure long-term sustainability of the rural water-supply facilities (Yan, Asante and

Birner, (2010) in Eguavoen 2008). For these and many other challenges confronting the sector,

the Government of Ghana in 2004, established the “Water Directorate” within the Ministry of

Water Resources, Works and Housing. The main focus of the Directorate’s activities is on

overall water resource management and drinking water supply. The Directorate coordinates the

activities of the main sector agencies, which are the Water Commission, the Ghana Water

Company Limited, and the Community Water and Sanitation Authority (EU-Ghana, 2010).

University of Ghana http://ugspace.ug.edu.gh

38

Prior to this new developments, the central government and external support agencies have since

1990 been responsible for planning, construction and maintenance of rural water supplies, with

little participation of the private sector except for the foreign consulting firms hired to run

projects and international contractors to drill boreholes (WSP-AF, 2002). By the year 2000, the

structure of the rural water sector in Ghana had been transformed. The function of central

government had reduced and changed from controlling the planning, construction and

maintenance of the entire scheme to facilitating others to carry out these responsibilities. The

private sector, district governments and communities had emerged as important players with

primary responsibility for planning and implementation, including the provision of limited co-

financing for construction and full financing for maintenance. GWSC itself had been

transformed in the process. Responsibilities for rural supplies, which was defined as any supply

small enough to be managed by a community organization, had been separated and were legally

owned and managed by local government and communities, facilitated by the independent

Community Water and Sanitation Agency (CWSA). In the process the government had

withdrawn from drilling; CWSA contracted with private firms for borehole siting, construction

and supervision, including procurement and setting standards. The same government act that

established CWSA also transferred ownership and implementation responsibilities to districts

and communities (WSP-AF, 2002).

2.10.1 Expansion of water supply to rural areas in Ghana

The Ghana Water Company Limited, which is a state owned company under the Ministry of

Works and Housing, was responsible for both urban and rural water supply and sewerage for a

population of some 15 million people. Most of the company’s staff and resources, however, were

University of Ghana http://ugspace.ug.edu.gh

39

devoted to the urban sector. As a result, donors and NGOs who wanted to work in rural water

and sanitation found themselves setting up large regional projects that were almost independent

from the Government, both in their policies and in their implementation (UN, 2005).

By the mid-1980s, the Government realized that the water situation was unsustainable and

increased the water tariff tenfold. A stakeholder group was established to adopt best practices

associated with the International Drinking Water Supply and Sanitation Decade (1981-1990).

The result was a draft sector strategy, which was discussed and refined with line ministries, local

government, and private sector. Once the national policy for rural water supply, sanitation and

hygiene education was finalized, it was implemented as a pilot project in the Volta region,

supported by the UNDP and the Dutch Government. It was then scaled up as the First

Community Water and Sanitation Project (CWAP-1), a $20 million World Bank-supported

programme. The Community Water and Sanitation Agency (CWSA) was therefore created. First,

the functions related to rural community water supply were placed in a separate division,

facilitating better monitoring of donors’ grants. Later in 1998, the division was made into an

independent agency, whose main tasks were coordination and facilitation (not implementation)

of community-managed water supplies (UN, 2005).

At the same time the Government devolved certain responsibilities from the national level to

districts and communities. The district assemblies became responsible for processing and

prioritizing community applications for water supply, awarding contracts for hand-dug wells and

latrine construction, and running a latrine subsidy programme. In order to be eligible for

assistance, communities had to establish gender-balanced water and sanitation committees,

complete plans detailing how they would manage their system, and contribute 5% of capital

costs in cash, and pay all operational and maintenance costs. The final element of the strategy

University of Ghana http://ugspace.ug.edu.gh

40

was an unprecedented private sector provision of goods and services, covering borehole drilling,

operations and maintenance, latrine construction and community mobilization (Entsua-Mensah,

et. al 2007).

By 2000 the reforms were complete and CWSA had settled into its role of helping the district

assemblies implement a national community water and sanitation programme. CWSA formulates

strategies, standards and guidelines for the sector, coordinates the work of NGOs and donors,

and encourages private sector participation in water and sanitation activities. The communities

have primary responsibilities for managing their water and sanitation services, while small-scale

private sector firms take care of repairs and spare parts (Entsua-Mensah, et. al 2007).

The national Government of Ghana played a crucial role in developing policy but is not involved

in implementation. The Ministry of Works and Housing (the parent ministry of CSWA) sets the

overall policy for the sector, while the Ministry of Local Government and Rural Development

supports district assemblies and tries to mediate between district assemblies and line ministries.

The Ministry of Finance does not yet accord water and sanitation sufficient priority, as indicated

by the low percentage of funds allocated in the Poverty Reduction Strategy Paper (PRSP) (UN,

2005).

2.12 IMPORTANCE OF IMPROVED WATER SUPPLY SYSTEM

Water is crucial in rural areas since it encourages activities such as agriculture, small scale

industrial activities, homes and outdoors. To serve this purpose, water is supplied from

production facilities such as dams, reservoirs, and tanks. Supplying water is therefore a crucial

task since any fault occurred in the water distribution system might affect the users.

University of Ghana http://ugspace.ug.edu.gh

41

The use of water can be put into two broad means, which are;

2.12.1. Economic benefits of reduced collection time

When water supply service is improved, users not only save money (since they do not have to

buy water at high cost, and /or time, since fetching water becomes much quicker), but the time

saved can be used for other activities: either productive (economic), domestic (such as looking

after children, cooking, cleaning, etc.), personal (sleeping, socializing, etc.), or development and

management related activity such as attending meetings, carrying out group work, participating

in community activities (James, 2003).

Evidence has shown that benefits have been calculated for the hypothetical situation where

service is improved such that each woman needs to spend only one hour per day collecting

water. If she has the freedom to allocate such newly created free time, and if additional economic

opportunities are available, she can invest this time in productive activity, not all of which need

be water-based. In the present case, financial returns of such investment are calculated on the

basis of returns per hour from the activities currently available in these villages, viz., plantations,

salt making, handicrafts, dairying, gum collection and daily wage labour (James, 2003).

2.12.2 Economic costs of breakdowns in water supply

Inadequate, irregular or unpredictable water supply mean that users have to spend more time and

effort on their water-collecting chore, as they have to locate and use an alternative more distant

or inconvenient source. If these users (especially women) are engaged in productive activity,

e.g., household enterprise or wage labour, they either have to spend extra time to collect water or

University of Ghana http://ugspace.ug.edu.gh

42

extra money to pay someone to collect water for them. Poor water supply thus has a cost, which

can be offset by improvement in domestic water supplies (James, 2003).

2.13 IMPROVING DOMESTIC WATER SUPPLY SYSTEM

Access to safe and affordable water is central to enhancing both human well‐being and to

securing sustainable livelihoods. However, the links between improvement in the domestic rural

water supply and rural enterprise are not always apparent to policy makers. Rather, the usual

policy justification for spending money to improve rural water supply is either aimed at

improving health and hygiene in rural communities, or to reduce the drudgery often borne by

women and girls of walking long distances to fetch water, especially during the summer. A study

in rural Gujarat in western India (IRC, FPI and SEWA, 2001) has shown that, in addition to these

benefits, women in rural enterprises can also get the direct economic benefits of increased

incomes, and indirect social benefits of greater participation in household decision-making, from

improved domestic water supplies. If income-generating activities are provided alongside

improvement in water supply, women can use the time saved to earn extra income for the family.

Such extra earning can be an important succour in times of stress and also act to empower

women, which can improve gender relations within families and in village societies at large

(IRC, FPI and SEWA, 2001).

2.14 PROMOTING PARTICIPATION IN RURAL WATER SUPPLY

Water supply requires a participatory approach that aims at strengthening collaboration among

the three key stakeholders – the government, private sector and CSOs (communities, NGOs,

research centres and professional associations). Public-Private Partnerships (PPP) are seen in this

University of Ghana http://ugspace.ug.edu.gh

43

context to be an effective means to establish cooperation between public and private actors and

to bundle up their financial resources, know-how and expertise to meet the challenges facing

service provision. While this approach promises several benefits, experience shows that

involving private actors in the provision of basic services needs to be carefully planned and

monitored if the benefits of such a model are to be fully realized and the numerous potential

drawbacks avoided (UN, 2005).

One of the biggest challenging aspects facing PPPs remains the need to reconcile two competing

aspects: governments finding ways to fulfill their socioeconomic responsibilities for ensuring

services to all citizens on one hand, while at the same time striving to preserve the interests of

private investors on the other. Also, an important factor is that private companies operating in the

sector need to be convinced that investing in any particular water supply project offers more

attractive returns than other available investment options in the country (UN, 2005).

In the view of the UN (2005) in order to support the principles of good corporate governance and

fulfill their responsibilities, private operators and other stakeholders should consider the

following policy actions:

i. Extend services to vulnerable populations in urban and rural areas;

ii. Create the right environment and mechanisms for multiple accountability and efficiency

of service providers;

iii. Develop flexible service options and standards in order to meet the needs of consumers;

University of Ghana http://ugspace.ug.edu.gh

44

iv. Promote private sector participation as a means for increasing investment in service

provider infrastructure as well as for enhancing the efficiency and performance of service

delivery;

v. Ensure that options for private participation are based on realistic investment and service

targets with appropriate share of risks and responsibilities between public and private

groups of partners;

vi. Promote dialogue with target consumers to ensure that contracts and programmes address

their specific needs and ensure that channels for communication are available.

2.15 CLIMATE CHANGE AND THE ROLE OF WATER

Water is the lifeblood of the planet, and the state of this resource affects all natural, social and

economic systems. Water serves as the fundamental link between the climate system, human

society and the environment. Over the last few decades, climate change has observed to be

severely impacting the hydrological cycle and consequently, water management. This has in turn

brought significant effects on human development and security. Adaptation to climate change is

closely linked to water and its role in sustainable development. To recognize this reality and to

respond accordingly presents development opportunities. Various adaptation methods that deal

with climate variability and build upon existing land and water management practices have the

potential to create flexibility to climate change and to enhance water security and to directly

contribute to development. Innovative technological practices and implementation of strategies

are also needed at the appropriate levels for adaptation as well as for mitigation (UN, 2010).

University of Ghana http://ugspace.ug.edu.gh

45

Climate change has substantial impacts on both water resources demand and availability. It is

critical to understand the processes driving these changes, the sequences of the changes and their

manifestation at different spatial and temporal levels. These changes are likely to be an

increasingly powerful driver of water availability, acting with other drivers that are already

having a serious impact on its quality and availability. Increased water related risks associated

with the changes in frequency and intensity of extreme events, such as droughts, floods, storm

surges, and landslides, will put additional strain on water resources management and increase

uncertainty about quantity and quality of water supplies. These risks will continue regardless of

mitigation measures applied over the coming decades. Society needs to find ways to adapt to the

changes that are expected and to render its water infrastructure and services more resilient in

coping with new conditions and extreme weather patterns (UN, 2010).

Climate change is a complex problem that has increased the need for an integrated, multi-

sectoral and multidisciplinary response. Apart from the normal water domain, decision-makers in

other spheres (finance, trade, energy, housing, regional planning, agriculture) must use and

consume water efficiently. Sustainable management and development of water resources will

play a pivotal role in preparing societies’ ability to adapt to climate change in order to increase

resilience and achieve development goals-this call for policy and governance shifts, investments

and changes in the way water concerns are addressed in development strategies and budgets

(UN, 2010).

2.15.1 Impacts of Climate Change on Water Resources

Water is the primary medium through which climate change influences the earth’s ecosystem, as

well as the livelihood and well-being of societies. Global warming is likely to intensify, and this

University of Ghana http://ugspace.ug.edu.gh

46

may accelerate the global hydrological cycle. Changes in precipitation, with temperature

extremes are projected to cause and affect water resources availability through changes in form,

frequency, intensity and distribution of precipitation, soil moisture, glacier and ice/snowmelt,

river and groundwater flows, and lead to further deterioration of water quality. There is growing

evidence that this is already happening in many regions. The global picture, however, is

complicated and uneven, with different regions, river basins and localities being affected in

different degrees and in a variety of ways (UN, 2010).

From the supply side, climate change affects the water cycle directly, by way of the quantity and

quality of water resources available to meet the needs of societies and ecosystems. Climate

change can result in an increased intensity in precipitation, causing greater peak runoffs but less

of recharge of groundwater. Receding glaciers, melting permafrost and changes in precipitation

from snow to rain are likely to affect seasonal flows. Longer dry periods are equally likely to

reduce groundwater recharge, lower minimum flows in rivers and affect water availability,

agriculture, drinking water supply, manufacturing and energy production, thermal plant cooling

and navigation (UN, 2010).

The UN (2010) report on climate change continues that climate change will directly affect the

demand for water; for instance, changes in demands will derive from industrial and household

use, or from irrigation. Water demand for irrigation may increase as transpiration increases

owing to higher temperatures. Depending on future trends in water use efficiency and the

development of new power plants, the demand for water in thermal energy generation could

either increase or decrease (UN, 2010).

University of Ghana http://ugspace.ug.edu.gh

47

CHAPTER THREE

RESEARCH METHODOLOGY

3.0 INTRODUCTION

This section deals with the methodology of the study. The study was carried out in the Ga East

Municipality of the Greater Accra Region. The interview was carried out in the month of March,

2012. The sample for the study was drawn from a subscription of list of communities which have

been provided with water facilities in the study area, using systematic sampling technique to

select the households. In all, a total of 138 respondents (representing heads of household) were

targeted and all of them were reached out to, thereby achieving a 100% participation in the

survey. This chapter therefore covers the processes and sequence of activities adopted and used

to carry out the study. It explains the approaches and tools that were employed to achieve the set

objectives. The research design, the study population, sample size and sampling methods as well

as the instruments used and data collection methods have been explained in this chapter. The

chapter further gives insight into how data collected was managed and processed into this

document. It also throws light on the analytical tools adopted to analyze the data. Also stated are

the challenges encountered by the researcher in carrying out this research work.

3.1 RESEARCH DESIGN

In this study, a non-experimental descriptive survey design is considered appropriate. Non-

experimental research involves variables that are not manipulated by the researcher and instead

are studied as they exist. One reason for using non-experimental research is that many variables

of interest in it cannot be manipulated because they are attribute variables, such as gender,

socioeconomic status, learning style, or any other personal characteristic or trait (Belli, 2008).

University of Ghana http://ugspace.ug.edu.gh

48

A survey study on the other hand, is a means of gathering information about the characteristics,

actions, or opinions of a large group of people, referred to as a population. It involves

examination of a phenomenon in a wide variety of natural settings. In survey study, the

researcher has very clearly defined independent and dependent variables, and a specific model of

the expected relationships which is tested against observations of the phenomenon. However,

surveys are less appropriate than other methods such as case studies and naturalistic observation

when detailed understanding of context and history of given computing phenomena is desired

(Pinsonneault and Kraemer, 1992).

Survey research is most appropriate when:

(a) The central questions of interest about the phenomena are "what is happening?", and "how

and why is it happening?" Survey research is especially well-suited for answering questions

about what, how much and how many, and to a greater extent than is commonly understood,

questions about how and why.

(b) Control of the independent and dependent variables is not possible or not desirable.

(c) The phenomena of interest must be studied in its natural setting.

(d) The phenomena of interest occur in current time or the recent past (Pinsonneault and

Kraemer, 1992).

3.2 STUDY POPULATION

The study was designed to examine the extent to which stakeholders implement sustainable,

cost-effective and environmentally friendly management practices of water resources in the Ga

East Municipality. The population for this study therefore includes all households in the Ga East

Municipal Assembly.

University of Ghana http://ugspace.ug.edu.gh

49

3.3 THE TARGET POPULATION A target population for a survey refers to the entire set of units for which the survey data are to

be used to make inferences. It is generally a large collection of individuals or objects that is the

main focus of a scientific query, and defines those units for which the findings of the survey are

meant to generalize (SAGE, 2009).

The main target population for this study is the household / family heads in the study area.

However, in case of the absence of the family head, other adult persons who in one way or other

influence family decisions were included in the study. In addition to the above targeted group,

some members of the water board, the area managers of the water schemes and the municipal

water and sanitation team were consulted, and therefore included in the study.

3.4 SAMPLING PROCEDURE

A two-stage sampling procedure was used to select the household heads and respondents. The

first stage involved grouping the communities with water facilities into three zones, from which

sampling from the list was made. The zones were; (i) Abokobi-Teiman- Oyarifa, (ii) Kweiman –

Damfa and (iii) Pantang Area zones. With the exception of Abokobi-Teiman-Oyarifa zone which

has only three communities, which were all included in the study, a simple random sampling

technique was used to select three (3) communities from the other two zones to give a total of

nine (9) communities as areas of study (Table 3.1).

The second stage involved sampling for the respondents (household heads). The houses were

numbered and listed. A systematic sampling procedure where every nth member after randomly

selecting the first nth element as the starting point, was used to select fifteen (15) households

University of Ghana http://ugspace.ug.edu.gh

50

from Pantang and Kweiman – Damfa zones, while each community in the Abokobi-Teiman zone

had sixteen (16) households. In this study, the 6th number was selected as the starting point, and

it therefore follows that the 6th, 12th, 18th. ..nth element were used to select the households (Table

3.1).

Table 3.1 Number of Towns and Households Selected

Zones No. of

communities per zone

No. of Towns selected

No. of Households

Total

Abokobi –Teiman Kweiman - Danfa Pantang Area

3

10

11

3

3

3

16

15

15

48

45

45

Total 24 9 46 138

Source: Field data, May, 2012

All the three towns in the Abokobi-Teiman zone were used for the study, after which simple

random sampling was conducted for the remaining two zones to selected three towns from each

zone. Here special priority was given to Abokobi-Teiman zone because of their large population

sizes. In all, a total of one hundred and thirty eight (138) household heads / adults were contacted

for the study. Thus, the sample frame for the first stage was a list of communities, and for the

second stage, the list of heads of households / families.

The towns due for selection for the study were:

Pantang Area Zone: Aboman, Abladjei, Ajaku, Akporman, Ashongman Community, Boi,

Dravaga, Nyamekrom, Pantang Community, and Pantang Hospital.

University of Ghana http://ugspace.ug.edu.gh

51

Kweiman – Danfa Zone: Addoteiman, Ayi Mensah, Damfa, Danfa Hospital, Habitat A & B,

Habitat T, Kweiman, New Addoteiman, New Kweiman, Otinibi.

Abokobi – Teiman Zone: Abokobi, Oyarifa, Teiman.

The lists of the selected communities for the study after the selection are as follow

Pantang Zone: Boi, Akporman and Ashongman Town Kweiman – Damfa Zone: Kweiman, Addoteiman and Damfa

Abokobi – Teiman Zone: Teiman, Abokobi and Oyarifa

3.5 SAMPLE SIZE

The Ga East Municipal Assembly according to the 2010 National Population and Housing

Census recorded a total of 259,668 persons (GSS, 2012). In order to determine the sample size

from the target population, three factors were considered in the sampling of the households; the

desired level of confidence (95%), the error tolerance level (5%) and the proportion of the

population with access to potable water in the municipality (90%, GEMA, 2012). The sample

size was then determined by adopting the formula used by Godden (2004), where the population

is greater than 50,000.

Z 2 x (p) x (1 – p) SS = ____________ C2

Where; SS = Sample Size Z = = standard score at 95% Confidence Level (1.96),

P = Percentage of population picking a choice, expressed as decimal 90% (0.9). C = Confidence interval, expressed as decimal 5% (0.05).

University of Ghana http://ugspace.ug.edu.gh

52

Therefore, SS = (1.96)2 (0.9) (1-0.9) (0.05)2 = 138 (Heads of Households)

One hundred and thirty eight (138) household heads were therefore randomly sampled from the

nine communities and interviewed. Participant observation was also employed by taking an

“environmental tour” in each community to ascertain the conditions surrounding the water

facilities. The data collected from both primary and secondary sources were then collated,

synthesized and analyzed using both qualitative and quantitative approaches to draw conclusions

and inferences.

The interview schedule was mainly focused on heads of households. This is because the study

seeks for those who can influence family life. According to ILO Convention (No. 138, 1973), the

minimum age for admission to any type of employment or work which by its nature or the

circumstances in which it is carried out is likely to jeopardize the health, safety or morals of

young persons’ shall not be less than 18 years. An adult for this study is therefore, a person who

is 18 years and above, and who can influence family decisions in one way or another.

This study also adopted the WHO term of community management in service delivery.

According to WHO (1996) cited by Braimah and Fielmua (2011), community management

means that the beneficiaries of water supply and sanitation services have responsibility, authority

and control over the development of their services. Responsibility implies the community takes

ownership of the system, with all its attendant obligations and benefits as well as liabilities.

Authority indicates that the community has the legitimate right to make decision about the

University of Ghana http://ugspace.ug.edu.gh

53

system. Control here implies the community has the power to implement the decisions regarding

the use of the system.

3.6 DATA COLLECTION INSTRUMENTS

A structured questionnaire with semi structured questions was developed and used to construct

individual household interview schedule as well as other stakeholders involved in water scheme

in the study area to collect information. A checklist was also developed to conduct discussion

with members of the various local water boards as well as the district water and sanitation team.

In addition, relevant government documents on water were examined.

Table 3. 3: Data required and the instrument to be used.

Objective/Concept Type of data Source of data Instrument of data

collection

Household

characteristics

-Age of respondent

-Educational Level

-Occupation

-Average monthly

income

-Marital status

-Size of family

-Role in the family

Household Questionnaire

Economic Activities -Agriculture

-Petty trading

-Services

-Sand winning

Household

Municipal Assembly

Questionnaire

Interview

University of Ghana http://ugspace.ug.edu.gh

54

Main Source of Water -Stream

-Public stand pipe

-Hand dug well -

Borehole

Household

Questionnaire

Community

participation

Consultation

Informed

Household

Municipal Assembly

Questionnaire

Water Pricing System Fixing of price

Affordability

Willingness to pay

Household

Water Board

Questionnaire

Interview

Health / Environmental

Implications

Waterborne diseases

in the community

Household

MHMT

Questionnaire

Interviews

Water Management Resource mobilization

-Repairs/ maintenance

-Pricing of water

-Environmental

cleaning

Capacity building

Household

Water Board

Questionnaire

Interviews

Major Challenges -embezzlement of funds Household Questionnaire

University of Ghana http://ugspace.ug.edu.gh

55

-low tariff system

-regular breakdown of

facility

-lack of transparency /

accountability

-irregular board meeting

-low patronage of the

water facility

-interference

Water Board

MWST

Interview

Interview

Source: Author

3.7 ANALYSIS OF DATA

Since a survey design was used, the results obtained were transformed into data file for computer

analysis. In following the principles of Fowler, (2001), the five processes he outlined were used

to;

i. Decide on a format (The organization of the data file),

ii. Designed a code (How respondents answers were assigned values that can be

processed by a computer),

iii. Coding (turning responses into standard categories),

iv. Data entry (putting data into computer readable form), and

v. Data clearing (doing a final check on the data for accuracy, completeness and

consistency prior to onset of analysis).

University of Ghana http://ugspace.ug.edu.gh

56

The study largely used quantitative statistical techniques, mixed with qualitative descriptions to

analyze the data. It is believed that the use of the multiple methods provide construct validity, as

well as internal and external validity, while allowing complex issues to be examined using the

respondents’ language (Hines 2000, in Gerhardt, 2004). Creswell (2003) cited by Gerhardt

(2004) also indicates that the use of mixed-methods research equally assist in making better

interpretations because informants will be providing information that is both measurable and

analyzed through rich description. A mixed-methods approach will also aid in reducing

researcher bias and allowing documentation to be measured and analyzed more effectively.

Field notes were taken during the focus group discussion, the interview period as well as the

personal observations made during the environmental tour. The notes were reviewed regularly

and together with the responses gathered from the households’ interview were coded and

categories assigned to them. Major patterns and themes also identified. Descriptive statistics was

then used to present the results in tables, graphs and percentages while qualitative method was

used to explain events as they exist on the field. The unit of analysis for the study is households.

3.8 CHALLENGES FROM THE FIELD

The field work recorded instances of mixed up pages or missing pages in some questionnaires.

Although they initially delayed study, new copies were made to replace the missing pages. Some

respondents who opted to fill the questionnaire at a later date rather kept too long in submitting

their forms, while others completely misplaced theirs and they had to be supplied with new ones.

In the midst of these challenges a lot of help was received from the Municipal Water and

Sanitation Team of the municipal assembly, the water development board some opinion leaders.

University of Ghana http://ugspace.ug.edu.gh

57

CHAPTER FOUR

RESULTS AND DISCUSSIONS

4.0 INTRODUCTION

This chapter presents the empirical results of analysis and discussions of data from the 138

households heads used for the study. The data analyzed focused on the four main objectives set

for the study. Various variables were considered and used to address those specified objectives.

4.1 SOCIO - ECONOMIC PROFILE OF THE HOUSEHOLDS

In this study, the socio-economic characteristics of the households considered are; sex, age, level

of education, marital status, occupation, and income levels. These factors were considered

because they are very much related to the topic of study.

4.1.1 Gender distribution

The survey recorded 138 households (heads of household) participating in the interview. Of this

number 69.6% of those interviewed were men and 30.4% women as shown in Table 4 1.

Table 4.1 Gender / Sex of Respondents

Sex of respondents Frequency Percentage (%)

Male

Female

Total

96

42

138

69.6

30.4

100

Source: Field survey, March, 2012.

University of Ghana http://ugspace.ug.edu.gh

58

4.1.2 Age distribution of respondents

The survey primarily focused on households with emphasis on heads of households. However,

in the absence of a household head, the survey also considered any adult who in one way or

another contributes to family upkeep. According to the ILO Convention Article 3(1) (No. 138,

1973, p.4), “the minimum age for admission to any type of employment or work which by its

nature or the circumstances in which it is carried out is likely to jeopardize the health, safety or

morals of young persons’ shall not be less than 18 years.” The study therefore considered only

persons who are least 18 years and above for participation. From the field survey, the minimum

age of participants was 19 years and the maximum age was 68years as shown in Figure 4 1.

Figure 4.1 Age Distribution of Respondents

Source: Field survey, March, 2012.

University of Ghana http://ugspace.ug.edu.gh

59

From the age categorization group (Figure 4.1), the modal age group of participants in the survey

was 25 – 35 year group, who accounts for about 34.8%. This was followed by age group 35 – 45

years (30.4%). These two groups together account for almost three quarters of the total

respondents interviewed, and they can be described as the most active working groups because

majority of the respondent workers were also found in these age categories. However, the least

age group of participants was the 55 years and above (5.8%), who can also be described as

retiring or “not in active service” group. The participation of respondents who were less than 25

years and those between 46 – 55 years were 17.4% and 11.6% respectively.

4.1.3 Level of education

Todaro (1989) cited by Mwikisa (1999) discussed the issues of demand for education and its

supply. According to him, like any other good or service the demand for education is a ‘derived

one’. It is derived in the sense that it is acquired not for its own sake, but for the benefits it brings

to those who have acquired it. It is therefore, clear that each individual’s income is determined

by the amount of factors of production one owns, and how productive those factors are. While

some individuals maybe bequeathed with factors of production by nature, and others by virtue of

being born in rich families, the majority need education to acquire or improve the productivity of

their factors of production in order to improve their incomes.

The study revealed that educational status of community members is very low. According to

Table 4.2, the survey results show that 9.4% of the respondents had received no formal

education. These people could therefore not read, write or speak English language apart from the

local or their native languages. On the other hand, more than 90% of the respondents had

received some form of formal education. Out of this as high as 71.0% of those who had formal

education did not go beyond the basic education level and this is categorized as primary, junior

University of Ghana http://ugspace.ug.edu.gh

60

secondary school and Middle school. Secondary, vocational and technical education altogether

accounts for 17.4% of the respondent, with only 2.2% of them having obtained tertiary education

(Table 4. 2).

Table 4.2 Educational Level of Respondents

Educational level

Frequency Percent

No formal Education.

Basic Education.

Secondary Education.

Tertiary Education.

Total

13 98 24 3 138

9.4 71.0 17.4 2.2 100

Source: Field survey, March, 2012.

Among the reasons given by some respondents as to why they could not go beyond the basic

level education were that;

(1) Their parents could not afford secondary education because of poverty, though some of them

claimed they passed the common entrance examinations at the time (25.1%),

(2) They stayed with people who were not their real parents who did not have interest in their

education but for the services they rendered (8.7%),

(3) Parents preferential interest in the education of boys as against that of the girls (complains of

some women, 6.8%),

University of Ghana http://ugspace.ug.edu.gh

(4) Truancy (on the part of boys) and pregnancy (on the part of girls) caused them to drop out of

school, and therefore blamed themselves for not achieving higher education (12.5%).

(5) Hatred and maltreatment meted out by some teachers (10.3%).

(6) Late start of school and its antecedent frequent mockery in class by peers and teachers as

being over aged was the cause of their drop out (22.5%), and

(7) Others admitted that they were no

middle school or junior secondary level (14.1%).

4.1.4. Marital Status

According to Figure 4.2 the survey recorded quite a significant proportion of married couples

who are staying together and thi

27.2% of women) of those interviewed. This makes the number of married couples quite

remarkable in the municipality. On the hand 21.0% of those interviewed were not married, while

the divorced accounts for 11.6%, and widows/ widowers make up the remaining 2.9%.

Figure 4.2 Marital statuses of respondents

Source: Field survey, March, 2012.

21%

11.60%

2.20%

61

(4) Truancy (on the part of boys) and pregnancy (on the part of girls) caused them to drop out of

school, and therefore blamed themselves for not achieving higher education (12.5%).

) Hatred and maltreatment meted out by some teachers (10.3%).

(6) Late start of school and its antecedent frequent mockery in class by peers and teachers as

being over aged was the cause of their drop out (22.5%), and

(7) Others admitted that they were not academically good and therefore had to end it all at the

middle school or junior secondary level (14.1%).

According to Figure 4.2 the survey recorded quite a significant proportion of married couples

who are staying together and this accounts for 64.5% (which is made up of 37. 3% of men and

27.2% of women) of those interviewed. This makes the number of married couples quite

remarkable in the municipality. On the hand 21.0% of those interviewed were not married, while

ounts for 11.6%, and widows/ widowers make up the remaining 2.9%.

of respondents

Field survey, March, 2012.

64.50%

0.70%

Married

Not married

Divorced

Widows

Widowers

(4) Truancy (on the part of boys) and pregnancy (on the part of girls) caused them to drop out of

school, and therefore blamed themselves for not achieving higher education (12.5%).

(6) Late start of school and its antecedent frequent mockery in class by peers and teachers as

t academically good and therefore had to end it all at the

According to Figure 4.2 the survey recorded quite a significant proportion of married couples

s accounts for 64.5% (which is made up of 37. 3% of men and

27.2% of women) of those interviewed. This makes the number of married couples quite

remarkable in the municipality. On the hand 21.0% of those interviewed were not married, while

ounts for 11.6%, and widows/ widowers make up the remaining 2.9%.

Not married

University of Ghana http://ugspace.ug.edu.gh

62

4.1.5 Household size and density:

According to the survey results (Table 4.3), the areas under study suggest that the number of

persons per households range from 2 to 10, with an average household size of 6 persons per

household. The study further suggests that majority of the households have a family size of

between 5 and 6. However, the number of persons per households above 8 was very minimal.

This conforms to the 2000 national population and housing census in Ghana, which gives the

municipality an average record of 6.2 persons per household, and therefore described it as having

a relatively low population density with an average family size of 6 persons.

(www.ghanadistricts.com, 28th March, 2012).

Table 4.3 Household Size

Household size Frequency Percentage

2 – 4

5 – 7

8 – 10

Total

46

80

12

138

33.33

57.97

8.70

100

Mean = 2.56

Source: Field survey, March, 2012.

In this study, however, households with family sizes of between 2 to 4 is describe as low family

size and those with family size of between 5 to 7 is describe as average family size, while those

above eight is describe as having large family size.

University of Ghana http://ugspace.ug.edu.gh

63

4.1.6 Role of participants in the family

The survey results revealed that respondents play various roles in their family lives. From the

field survey (Table 4) it came out that over 60 % of the respondents play active role as family

heads. It was also noted that some women have assume the role of family heads. This is because

these women have either separated from their husbands through divorce, widowed, the man

being incapacitated or travelled outside the country, and therefore are more or less single parents.

On a whole 17.4% of the participants, though are adults and contribute to the upkeep of their

households, play their roles as sons and daughters because they still live with their parents. On

the other hand, quite a sizable number of them (22.5%) play their roles as wives and mothers to

the rest of the family/ household.

Table 4.4 Role of participants in their families

Role in family Frequency Percent

Head of family

Son

Daughter

Wife of family head

Total

83

9

15

31

138

60.1

6.5

10.9

22.5

100

Source: Field survey, March, 2012.

4.1.7 Economic status of respondents

The survey result (Table 5) shows that majority of those interviewed are artisans (47.1%) who

obtain their livelihood from masonry, carpentry, hairdressing, sewing, driving and electrical

works. Also nearly 30% of the respondents are engaged in petty trading, which is mostly

University of Ghana http://ugspace.ug.edu.gh

64

undertaken by women, while over 20% of the respondents are engaged in farming to obtain their

livelihood. Strangely enough, only a few of those interviewed (5.8%) are engaged in the formal

sector or are government workers like teachers, nurses, or the security services.

Table 4.5 Primary occupations of respondents

Occupation Frequency Percent

Agriculture

Petty trading

Artisans

Salary workers

Total

28

41

61

8

138

20.3

29.7

44.2

5.8

100

Source: Field survey, March, 2012.

The survey further revealed that about 23% of the sampled households are engaged in two or

more forms of economic activities to enhance their livelihoods as shown figure 4.3

University of Ghana http://ugspace.ug.edu.gh

65

4.1.8 Sources and levels of income

In order to established cash income, respondent were asked about their household monthly

earnings over the last 12 months from the kind of economic activities they are engaged in. In all

the areas of study only 6.8% of the households reported incomes from wages and salaries in the

last year. Similarly, about 90% of the sampled households have one or more self-employed

persons. On the other hand, over 16% received no income because they are either unemployed or

have advanced in age and are therefore dependent on remittances from their children and other

family members.

University of Ghana http://ugspace.ug.edu.gh

66

From the survey results the least income earner receives as low as GH¢ 30.00, while the highest

was GH¢ 600.00. The study further revealed that over 90% of the respondents are in the informal

sector who are mainly engaged in petty trading, farming, hairdressing, dressmaking, masonry,

carpentry among others. They therefore do not receive regular monthly income, neither are they

able to compute their actual monthly incomes. However, many of them have a conventional way

of estimating it. For these individuals the amount they collect from their “SUSU SAVINGS” at

the end of the month is considered their monthly income.

Table 4.6 Average Monthly Income Grouped

Income level (GH¢) Frequency Percentage

< 50.00

50.00 – 100.00

100.00 – 200.00

200.00 – 300.00

300. 00– 400.00

400.00 – 500.00

500.00+

Total

33

52

21

13

9

6

4

138

23.9

37.7

15.2

9.5

6.5

4.3

2.9

100

Source: Field survey, March, 2012.

Generally speaking, income levels can be said to be very low in the study area. According to the

2012 minimum wage of GH¢ 4.48, the least paid worker in Ghana is expected to earn a monthly

income of not less than GH¢ 98.56. However, (Table 4. 6) shows that more than 61% of the total

respondents earn incomes less than GH¢ 100. 00, and are therefore by this study described as

low income earners. This means almost 36% of the respondents earn incomes between GH¢

University of Ghana http://ugspace.ug.edu.gh

67

100.00 and GH¢500.00, with only 2.9% earning GH¢500.00 and above and these are those found

working in the formal /public sector such as teaching, fire services, nursing, and other such

mainstream government workers. These groups of people therefore receive regularized monthly

income.

4.2 WATER SITUATION AND SOURCES IN THE AREA

Water situation in many rural communities in Ghana have not been the best. Such communities

have over the years depended on unimproved water sources like streams, dams, rivers and other

such surface sources for their daily use. The water situation in the study area before the year

2005/2006 was not different from other rural communities in Ghana. Many communities in the

area used to depend on contaminated streams, stagnant waters and wells as their major water

sources, from which they fetch water for drinking, washing, cooking and other household chores.

These sources were very much polluted both by human activities and roaming animals, which

posed some serious health challenges to the people with a lot of water borne diseases like Buruli

ulcer, typhoid, bilharzia, cholera, guinea worm infections and many more of such water borne

diseases.

According to 2008 Ghana’s MDGs report on access to improved water: a household is

considered to have access to improved water supply if it uses improved drinking water sources or

delivery points including: piped water into dwelling, plot or yard; public tap/standpipe; tube

well/borehole; protected dug well; protected spring; and rainwater collection

(NDPC/GoG/UNDP 2010).

The understudy communities can be said to be enjoying safe and clean drinking water (piped

water) at moment from the local water network system, which are boreholes fitted with

University of Ghana http://ugspace.ug.edu.gh

68

mechanized pumps and powered by electricity. Water is therefore no longer a major problem in

the area as community members no longer drink from unsafe surface water sources. The water

use is drawn from the pumping stations into installed reservoirs from which it is distributed to

the various outlets. The utility was provided by DANIDA, a Danish International NGO, between

2005/20006, in collaboration with the Community Water and Sanitation Agency (CWSA) of the

Ghana Water Company Limited (GWCL). Although some few households have been able to

connect the facility to their homes, majority of the households continue to fetch water from the

public pipe stands.

The pumping stations are cited at Abokobi, Kweiman and Dravaga, serving the Abokobi –

Teiman – Oyarifa zone, Kweiman – Danfa zone and Pantang Area water zone respectively. On

the other hand the reservoirs have been built at Seseme, Ayi Mensah and Boi, from which water

is pumped into, stored and supplied to the communities. Each reservoir has a storing capacity of

25000 cubic meter of water. There are in all 39 public stand pipes in the nine (9) communities

selected for the study (Table 4.7).

University of Ghana http://ugspace.ug.edu.gh

69

Table 4.7 Distribution of public pipe stands per community.

Abokobi - 8

Addoteiman - 2

Akporman - 3

Ashongman Town - 4

Boi - 2

Danfa - 2

Kweiman - 3

Teiman - 4

Oyarifa - 11

Total - 39

Source: Field Data

The findings also revealed that the provision of the stand pipes from the water network system

residents now hardly fetch water from the surface water sources, not even in the harmattan

periods. It is only in times of dire need that members resort to hand dug wells for water.

According to the MHMT, the provisions of the water utilities have brought lots of reliefs and

improvement in the health and economic lives of the residents. Residents no longer walk long

distances and spending long hours to fetch water. Most importantly, the incidence of water borne

diseases in the area has also reduced and almost eradicated in the area.

4.3 KNOWLEDGE OF THE PROVIDER OF THE UTILITY

The water utilities in the area of study were provided by DANIDA, a Danish International NGO,

in collaboration with Community Water and Sanitation Agency (CWSA) between 2005/2006.

University of Ghana http://ugspace.ug.edu.gh

70

However, when the question was put about the knowledge of respondents about the provider of

the utility, only half of them (50.7%) knew that it was indeed provided by an NGO (DANIDA).

This means the other half (49.3%) did not know, and therefore attributed the provision of the

utility to either the district assembly, the communities themselves, or by the Member of

Parliament for the area (Table 4.8).

Table 4.8 Knowledge of Provider of the Water Utility

Provider of facility Frequency Percent

Community District Assembly NGO Others Total

7 53 70 8 138

5.1 38.4 50.7 5.8 100

Source: Field data, March 2012.

4.4 PARTICIPATION OF THE COMMUNITY IN THE PROVISION OF THE UTILITY

According to Talbot and Verrinder (2005) community participation is a concept that attempts to

bring different stakeholders together for problem solving and decision making. Goyet (1999) had

earlier defined it as the involvement of people in a community in projects to solve their own

problems. Thus, people cannot be forced to ‘participate’ in projects that affect their lives but

should be given the opportunity where possible. Community participation is therefore

particularly important in emergency situations where people may not be unaccustomed to their

surroundings and new sanitation facilities.

University of Ghana http://ugspace.ug.edu.gh

71

In Ghana, the CWSA is in charge of coordinating and facilitating the implementation of the

National Community Water and Sanitation Programme (NCWSP) in rural areas, which is carried

out directly by the communities and their District Assemblies. In communities with fewer than

50,000 inhabitants, water supply systems are owned and managed by the respective community

on a demand-driven basis. According to the NCWSP, these systems do not receive any cross-

subsidies and 5% of the total cost of providing the facility is paid by the operating community

(Yan, Asante and Birner, 2010)

In this study participation is not only taken to imply involving the community in the construction

of facilities, but it is also used to imply contributing ideas, making decisions and taking

responsibility. Drawing on Pretty’s (1995) typology of participation, the forms of participation of

water development board and household members were analyzed. From projects design through

to the implementation stage and operation, a number of indicators were identified and used to

examine the participation of beneficiary communities (Table 4.9).

University of Ghana http://ugspace.ug.edu.gh

72

Table 4.9 Households’ Participation in the Provision and Management of the Facility

Indicators Participated Did not participate

X2

Freq. (f) % Freq. (f)

%

1. Choosing the type of technology (BH, HDW, mechanized or with hand pump).

2. Determining hours of operation of facility.

3. Setting of water tariff/price

4. Election of board members

5. Determination of initial amount to be paid

6. Identifying possible sites for installation of facility

7. Provision of Labour

0 0.0 138 100 X2 = 49.5 df=5 Sig.

0 0.0 138 100 X2 = 49.5 df=5 Sig

0 0.0 138 100 X2 = 49.5 df=5 Sig

127 92.0 11 8.0 X2 = 86.05 df=5 Sig

53 38.4 85 61.6 X2 = 10.24 df=5 Non/Sig

47 34.1 91 65.9 X2 = 4.17 df=5 Non/Sig

28 20.3 110 79.7 X2 = 2.65 df=5 Non/Sig

Source: Field survey, March, 2012

Generally, the perception level of participation by the beneficiary communities in the installation

of the water facility was very low. From table 4.9 the beneficiary communities did not participate

in the areas of the choice of technology, determination of time / hours for the sale of water, and

setting of the water tariff. The choice of the kind of technology was decided by the provider of

the facility (DANIDA and CWSA) and the community was informed about it, and this according

to Pretty (1995) is passive participation. Similarly, The setting of the operational hours of the

University of Ghana http://ugspace.ug.edu.gh

73

facility (time of sale of water) and the pricing of the water are basically within the domain of

management and the governing board. Community members are only informed of any price

change (if any) through the water vendors, hence members participation are nil with regards to

the hours of operation and the pricing system.

The choice of site for the installation of the facility was considered as purely technical, and this

was carried out by the provider, though there seem to be some level of participation (34.3%) by

the communities. The percentage participation here is seen basically in terms of the land owners

or family heads of the respective proposed sites being contacted for the release of their lands for

the project. That is, either the household heads willingly release the land or they jointly

demarcated the areas within which the facilities could be sited. Participation in this sense

according to Pretty’s typology (1995) is by consultation. The drilling of the borehole and the

installation processes were mechanized hence community participation in the provision of labour

towards the installation of the facility was very minimal (20.3%). That is some few men from the

communities were engaged to build the offices. However, the participation of members regarding

initial cash contribution towards the construction of the facility was quite substantial (38.7%) and

this was also by consultation.

It emerged from the survey results that in order to let the community own the facilities for

maximum utilization, some members from the operational communities have been elected to

serve on the water governing board, which is the decision making body. Not only that all the

water vendors are members from the respective operational areas. This kind of participation

according to Pretty is interactive. This is where people participate in joint analysis, development

University of Ghana http://ugspace.ug.edu.gh

74

of action plans and formation or strengthening of local institutions. In this regard, participation is

seen as a right, not just the means to achieve project goals. The process involves interdisciplinary

methodologies that seek multiple perspectives and make use of systemic and structured learning

processes. As groups take control over local decisions and determine how available resources are

used, so they have a stake in maintaining structures or practices (Pretty, 1995).

Still on Table 4.9, the calculated X2 for choosing the type of technology, election of board

members, determining hours of operation of facility and setting of water tariff/price were greater

than the statistical figure of 11.07 at 5% level, showing significant differences in the level of

participation of community members in the provision and management of the water scheme.

However, that is not the case. It can therefore be said that this high level of participation by the

communities happened by chance. On the other hand, there were no significant differences in the

level of participation in the areas of identifying possible sites for installation of facility, provision

of labour and determination of initial amount to be paid.

4.5 CASH CONTRIBUTION BY COMMUNITY

The survey indicates that each of the beneficiary communities enjoying the utility made some

cash contributions towards the construction. The amounts paid represent the 5% mandatory

contribution of the beneficiary community and this was dependent on the population size of each

community.

According to Braimah and Fielmua (2011), contributions by a community in a project of this

nature are simply a vehicle of policy and not a financial necessity, because its share in the

University of Ghana http://ugspace.ug.edu.gh

75

funding of the NCWSP is very marginal. Cost sharing arrangement between development

partners and beneficiaries of the project as determined by the NCWSP is that beneficiary

communities pay 5% of the capital cost of facilities. External Support Agencies and the District

Assembly (i.e. government) pay 90% and 5% respectively. While this beneficiary contribution

has been very functional in certain better-off communities, the study revealed that it turned out to

be a major constraint for some communities in the study area due to high poverty levels and low

population size. This observation had been made earlier by Karikari (1996) cited in Braimah and

Fielmua (2011) that the premium placed on community financial obligation might create

obstacles for meeting the set objectives of providing rural areas with potable water. This is

because most settlements have very small populations, and many of them cannot afford the 5%

capital contribution. The results of the study, however, indicated that since the communities were

in dire need for clean, portable and safe drinking water, though some members defaulted in the

payment, it was not necessarily a barrier to the majority who willingly paid.

On the contribution of households in the communities, the survey results (Table 4.10) further

indicate that over 76% of the respondents admitted paying their contributions towards the

construction of the utility in their respective operational areas. However, 15.2% of them said no

such contributions were ever made, whereas 8% could not tell if such contribution were indeed

made. The least that could be said about these two groups of people is that either they were

young at the time, were not residing in the area at the time, or they simply did not pay their part.

University of Ghana http://ugspace.ug.edu.gh

76

Table 4.10 Cash Contribution by the Community

Household Contribution Frequency Percent (%)

Yes

No

Total

106

32

138

76.8

23.2

100

Source: Field survey, March, 2012.

4.5.1 Fund Raising Strategies

In order for communities to raise the necessary funds and meet their 5% quotas, the respective

community opinion leaders used various strategies to get the households to pay monies to that

effect. Among the strategies adopted to facilitate the payments, the most common and effective

one adopted was to levy each member of a household (children inclusive). The understanding for

including the children was that these children will eventually grow to become full members of

the community and therefore be direct beneficiaries of the facility. Depending on the population

size of the community and or number of people in a household, each member paid between GH¢

4.00 and GH¢ 20.00, as in Table 4.11.

University of Ghana http://ugspace.ug.edu.gh

77

Table 4.11 Distribution of Households Contributions Amount (GH¢) Frequency Percent

4.00

5.00

6.00

10.00

20.00

21

44

23

38

12

15.2

31.9

16.7

27.5

8.7

Total 138 100

Mean contribution = GH¢9.00

Source: Field survey, March, 2012.

The survey revealed that (Table 4.11) majority of the individuals in a household paid GH¢ 5.00

(31.9%) followed by GH¢ 10.00 (28.5%), with GH¢ 20.00 (7.7%) being the highest amount ever

paid by an individual in a household and also least of respondents. The field data further revealed

that the larger communities (like Oyarifa and Abokobi) which have “high populations/household

sizes” paid less amounts per person, whereas the smaller towns (Akporman, Kweiman) paid

higher amount per person due to their “low household sizes”.

4.6 STABILITY OF WATER SUPPLY

The flow and supply of water in the study area can be described as very stable. Water flows

almost 24 hours a day throughout the week. A disruption in supply is only experienced when

there is a major repair work to be undertaken at the pumping station, or power outage. The public

pipe stands are opened to the households / public in the mornings which is the rush hours from

6.00am to 10.00am, and then in the afternoon from 3.30pm – 6.00pm. The time lapse between

the morning and the afternoon is meant to give some resting period to the water vendors who are

University of Ghana http://ugspace.ug.edu.gh

78

all women, to attend to their families and other households’ needs. Patronage during this period

is also very low since many people leave for work.

4.7 WATER PRICING REGIME/SYSTEM

According to the UNDP (1990), providing assured drinking water in required quantities to the

entire population is one of the main objectives of public policy in most of the developing

countries. It is increasingly felt that pricing of water on cost basis is essential in order to ensure

economic and financial viability of water supply schemes.

The cost of water in the study area is five pesewas (5Gp) per bucket (34cm3), while the 25 liter

container cost ten pesewas (10 Gp). At this rate, (Table 4.12) nearly 74%, of respondents

concede that the rate at which the water is sold is low, while 18% of them consider it as

moderate, and only 8.0% felt it is rather high. These assertions by the participants suggest that

the cost of water in the area is generally low, accessible and affordable to the households.

Majority of households therefore expressed high satisfaction about the price, supply and flow of

water in the area.

Table.4.12 Cost of Water Cost of water Frequency Percent

Low price

Moderate

High price

Total

102

25

11

138

73.9

18.1

8.0

100

Source: Field survey, March, 2012.

University of Ghana http://ugspace.ug.edu.gh

79

The pricing of the water is actually determined by the governing board. However, the field data

(Table 4.13) showed that more half of the participants (65.2%) knew that the price is quoted by

the board. The rest of the respondents (34.8%) did not know. For them water pricing is

determined by the district assembly (26.1%), the towns’ unit committee (5.1%), or by the water

vendors (3.6%).

Table 4.13 Determination of cost of water Determination

of cost of water

Frequency Percent

District Assembly

Unit Committee

Water Board

Others

Total

36

7

90

5

138

26.1

5.1

65.2

3.6

100

Source: Field survey, March, 2012.

4.8 HOUSEHOLDS DAILY EXPENDITURE ON WATER

The survey results (Figure 4.3) indicates that majority of the households (between 27.5 – 81.0%)

spend 40Gp to 60Gp on water daily, with the greater majority (34.1%) spending 50Gp on water a

day. This means majority of the households on the average spend between GH¢12.00 to GH¢

18.00 a month on water for cooking, washing, and bathing. As established earlier, majority of the

people do not use the water for drinking as they claim that it is salty. For the low incomes earners

(below GH¢100.00) this expenses on water alone has some cost implications on their finance, as

majority admits that this affect their incomes, but because water is a necessity there is nothing

they can do. The result further established that those who spend between 60Gp – 80Gp were

University of Ghana http://ugspace.ug.edu.gh

80

noted have large household sizes of six (6) persons or more. On the other hand only a few

households (2.2% - 3.9%) of the respondents were noted to spend more on water a day (GH¢1.00

and above) , of which at least one household member was found to also use the water for their

businesses like hairdressing and kenkey selling other than the normal households use of water.

Figure 4.4 Average Daily Expenditure on Water

Source: Field survey, March, 2012.

It was also established that the average monthly payment by households who have home

connections was GH¢25.00, though some households paid as high as GH¢170.00 and others as

low as GH¢5.00. Checks on this high tariff on households with connections revealed that those

who paid as high as GH¢50.00 and above were also using the water for commercial purposes,

mostly by selling water to the public.

University of Ghana http://ugspace.ug.edu.gh

81

4.9 IMPROVING THE EXISTING WATER SYSTEM

The water system since its construction has not seen any major expansion yet. Majority of the

households therefore believed that they needed some improvement in the water supply system.

Respondents believe that since the communities are expanding, so must the facility be expanded

to commensurate with the increasing population. They therefore expect management and the

board to extend the facility to the other parts of their towns, especially the outskirts. Secondly,

some households wish to have the facility connected to their homes, but they have not been

successful due the high cost of connection fee. Some resident who have the facility connected to

their homes complain of faulty meters, giving wrong readings, and therefore giving high tariffs

for payment. Members also wish that the boards will procure stand-by generators since power

outages mean no supply of water. A prolong situation power failure is sometime very frustrating

to members, and the adverse effect is that members may have to resort to other unsafe water

sources for use.

4.10 WATER SAFETY AND QUALITY

Water naturally contains dissolved substances, non-dissolved particulate matter and living

organisms. Indeed, such materials and organisms are necessary components of good quality

water, because they help to maintain vital biogeochemical cycles. There are however, few

exceptions to this where naturally occurring substances trigger water quality challenges, which

become detrimental to human health (UN-Water, 2011). Among other negative factors which

have affected water quality in many parts of the world in recent times are unhygienic disposal

and inadequate treatment of human and livestock wastes, deficient management and treatment of

industrial residue, inappropriate agricultural practices and unsafe solid waste discharge. In

University of Ghana http://ugspace.ug.edu.gh

82

addition to the above, pollution and contamination from other sources such as dumping of

industrial waste, heavy metals, solvents toxic sludge, nitrate from fertilizer applications, which is

the most common chemical contaminant in underground water aquifers, manifest themselves in

the form of increased acidity and higher concentrations of nutrients, sediments, salts, trace

metals, chemical, as well as harmful pathogenic organisms that thrive in underground waters.

Poor water quality therefore has a direct impact on water in a number of ways. Polluted water

that cannot be used for drinking, bathing, industry or agriculture effectively therefore reduces the

amount of useable water in a given area (UN-Water, 2011). This section therefore discuses the

state and sources of water used as well as problems that confront households in obtaining water

for domestic uses. Critical problems confronting household in obtaining water for domestic uses

including time and distance are discussed with specific reference to their variations in the study

areas.

4.10.1 State and sources of water in the communities

Most rural areas in Ghana are endowed with several sources of water. The sources may vary

from natural sources like rivers, streams, ponds, rainwater, as well as man-made sources like

wells, boreholes and in few instances, pipe borne water. These rural households, by force of

circumstances depend on several sources of water supply since no one source is actually capable

of supplying all their water needs throughout the year.

Throughout the study area, majority of the respondents indicated they predominantly depended

on both surface and underground water sources, which are mainly streams, ponds and hand dug

wells. Rainwater was said to be the least frequently used source during the year because, in the

view of respondents they have no control over the rains especially at the time it is needed. The

other sources also sometimes dry up during the year, something which pose great challenge to

University of Ghana http://ugspace.ug.edu.gh

83

them because they will have to walk long distances and spend long hours in search of water.

However, respondents conceded that since the provision of the new water scheme (pipe water) in

2006, the water situation in the area has improved, and that water is no longer a problem. Water

is now easy to come by. Members (especially women and children) no longer walk long

distances and spending long hours in search of water. This assertion confirms a similar work by

The International Policy Centre for Inclusive Growth (IPCIG) in 2009 that, water infrastructure

seems to be associated with a lesser work burden for women. That is women’s total working

hours become fewer in communities provided with water, and fewer for those living closer to the

water source. Hence, having access to water infrastructure can reduce the time burden on

women. It is, however, not inherent that the time saved or gained on water collection would be

channeled into paid activities (IPCIG, 2009).

In this survey the results (Table 4.14) show that majority of the households reported that they

are satisfied with the quality of water supply in the area with only a few of them expressing some

reservations. The results show that although no one had a problem about the smell of the water,

quite a sizable number (34.8%) of the participants agreed and that water from the tap is very

clean and safe for use. However, over 65% of them have some reservations about the taste of the

water. They maintained that the water is salty, which makes the drinking of it quite distasteful.

Contrary to this assertion of ‘saltiness’ a check at the various water boards and management

indicate that per the standard and certification of Ghana Standard Boards the water is wholesome

for consumption. It was confirmed however, that it was when the facility was first installed that

the water tasted salty. However, over the years of constant pumping and supply that is no longer

the case. Therefore, this ‘saltiness of the water’ can be attributed to mere perception, behavioural

pattern, or taste preferential of consumers.

University of Ghana http://ugspace.ug.edu.gh

84

Table 4.14 Perception about the state of the Water Scheme

Source: Field data Similarly, more than ninety four per cent (94.2%) of the households maintain that the water from

the tap is very safe for human consumption as against five per cent (5.8%) who felt that although

the water is clean, it is not wholesome for human consumption because to them it is not properly

treated like water from Kpong and Weija water stations (Table 4.15).

Table 4.15 Water Safety

Water safety Frequency Percent

Yes

No

Total

130

8

130

94.2

5.8

100

Source: Field survey, March, 2012.

4.10.2 Location of Public Pipe Stands

All the public pipe stands are located at vantage points in the communities. From Table 4.16

majority of the households (about 70%) live at the centre of town where most of the populace is

concentrated as against 30% who live at the town outskirt. It is also noted that majority of those

who live in the town centers often walk a distance of between 10m – 50m to fetch water from the

State of water Frequency Percent

Smelly

Clean

Salty

Total

0

48

90

138

0

34.8

65.2

100

University of Ghana http://ugspace.ug.edu.gh

85

pipe stand, and they are therefore said to be closer to the facility. Only 2.9% of those whom live

at the town centers walk more than 50m to fetch water. This generally suggests that the

difficulties of households having to walk long distances thereby spending long hours in search

water has been curtailed. Residents are now in position to translate the “time gained” into

profitable economic ventures to improve their livelihoods.

Table 4.16 Distances to Pipe Stands in the Communities

Distance to

water source

Location of water source in

communities

Total

Centre of town Outskirt of town

10.0m

20.0m

50.0m

Others

Total

27

31

34

4

96

4

7

13

18

42

31

38

47

22

138

Average dist. = 24.0m Average dist.= 10.5m

Source: Field survey, March, 2012.

Similarly, a quite sizable number of residents or households (30.4%) live at the outskirt of town,

where over 42% of them walk a distance of more than 50m to and from the pipe stands (Table

4.16).

University of Ghana http://ugspace.ug.edu.gh

86

4.11 WILLINGNESS TO PAY FOR IMPROVED WATER SERVICES

One of the fundamental issues in water supply policy is to predict the responses of consumers to

a service to which they have not previously had access or characteristics of that service such as

improved reliability and increased prices ((Fafo-Series, 1998).

People’s willingness to pay for a service is an economic concept which aims to determine the

maximum amount of money consumer will pay for the supply of water. The revenues generated

through the purchase of water have been shown to equate to the cost of developing a city’s

public water utility. This has been an important revelation for water planning managers in

developing countries where urbanization is increasing rapidly and the demand for water is

growing faster than the existing weak infrastructure can meet with supply. Consequently, cost

recovery in local infrastructure development is now crucial for local governments. Clearly WTP

has a role in assessing acceptable water charges to users upon which water policy can be

developed with the confidence of achieving cost recovery (Kim, 1998).

According to Bin-Seraj (2007) cited by Braimah and

Fielmua (2011) in designing a tariff

structure of any good or service, it is crucial to match households’ willingness to pay with their

ability to pay. A person’s ability to pay for a good or service is entirely a financial trend that is

derived from income or expenditure information of households, which helps in the determination

of the optimal tariff structure of a service. Simply put, ability to pay is primarily a function of

income and cost of living, which in turn is a function of employment.

In this survey, respondents were asked a direct question on whether they are willing to pay extra

cost for expansion works on the facility to make water more accessible to them, to the extent that

University of Ghana http://ugspace.ug.edu.gh

87

individuals can connect the facility to their homes. With this question, majority of the households

“even poor ones” (75.4%) responded in the affirmative, indicating their willingness to pay extra

cost for reliable and quality water supply services. The households are willing to pay because

they see water as essential commodity and necessary for life, while 24.6% of them expressed no

such willingness (Table 4.17). Some of the reasons for those unwilling to pay were that (1) the

community members contributed towards the construction of the utility, (2) the water is not for

free, it is sold to the members, and (3) the amount collected over the years should be able make

the utility self financing.

Table.4.17 Willingness to Pay

Willingness to pay Frequency Percent

Yes

No

Total

104

34

138

75.4

24.6

100

Source: Field survey, March, 2012.

Respondents who said they were willing to pay were then presented with a realistic scenario, by

asking them how much they will be willing to pay for improved water supply services. A bidding

game method (Fafo-Series, 1998) was then used, whereby prices were offered in an increasing

order until a “negotiated price” has been reached with the respondents to which they are willing

to pay (figure 4.4).

University of Ghana http://ugspace.ug.edu.gh

Figure 4.5 Amount Households are Willing to Pay

Source: Field survey, March 2012

In this survey, (Figure 4) the results show that the amount of money respondents were willing to

pay for improved water services ranged from GH¢ 5.00 to GH¢ 50.00. Majority of the

households with more than half of the respondents (52.3%) preferred to pay n

5.00 for improved water services, followed by those willing to pay GH¢ 10.00 (22.5%) and GH¢

20.00 (10.8%) respectively. Beyond this only 4.5% were willing to pay for GH¢ 30.00, 3.6% for

GH¢ 40.00 and 6.3% for GH¢ 50.00. The overall willin

improved water services in spite of having made initial cash contributions towards the

construction of the utility can be described as very high and remarkable. On the average,

households were willing to pay about

communities

Also two groups of people emerged from the survey on the willingness to pay for improve water

services; the settler households and the indigenous households. Whereas the settler households in

52.25

22.52

0

10

20

30

40

50

60

5.00ghc 10.00ghc

pe

rce

nta

ge w

illin

g to

pay

88

Figure 4.5 Amount Households are Willing to Pay

Source: Field survey, March 2012

In this survey, (Figure 4) the results show that the amount of money respondents were willing to

pay for improved water services ranged from GH¢ 5.00 to GH¢ 50.00. Majority of the

households with more than half of the respondents (52.3%) preferred to pay not more than GH¢

5.00 for improved water services, followed by those willing to pay GH¢ 10.00 (22.5%) and GH¢

20.00 (10.8%) respectively. Beyond this only 4.5% were willing to pay for GH¢ 30.00, 3.6% for

GH¢ 40.00 and 6.3% for GH¢ 50.00. The overall willingness of households to pay extra fee for

improved water services in spite of having made initial cash contributions towards the

construction of the utility can be described as very high and remarkable. On the average,

households were willing to pay about GH¢26.00 for improved water supply services to their

Also two groups of people emerged from the survey on the willingness to pay for improve water

services; the settler households and the indigenous households. Whereas the settler households in

22.52

10.81

4.5 3.6

10.00ghc 20.00ghc 30.00ghc 40.00ghc 50.00ghc

Amount of money (GH¢)

In this survey, (Figure 4) the results show that the amount of money respondents were willing to

pay for improved water services ranged from GH¢ 5.00 to GH¢ 50.00. Majority of the

ot more than GH¢

5.00 for improved water services, followed by those willing to pay GH¢ 10.00 (22.5%) and GH¢

20.00 (10.8%) respectively. Beyond this only 4.5% were willing to pay for GH¢ 30.00, 3.6% for

gness of households to pay extra fee for

improved water services in spite of having made initial cash contributions towards the

construction of the utility can be described as very high and remarkable. On the average,

GH¢26.00 for improved water supply services to their

Also two groups of people emerged from the survey on the willingness to pay for improve water

services; the settler households and the indigenous households. Whereas the settler households in

6.31

50.00ghc

University of Ghana http://ugspace.ug.edu.gh

89

the communities show high levels of willingness to pay with an average payment of GH¢30.00,

the indigene households rather show low level of willingness to pay with an average payment of

GH¢5.00. A probe showed that the settler households used to experience irregular water supply

or water scarcity from their previous localities compared to where they are now where water

flows almost every day. This made them more willing to pay to continue to enjoy the facility.

They were therefore willing to pay up to GH¢ 50.00 for improved water service. They also

showed that they were more than willing to pay for connection of the facility to their homes than

to continue fetching from the public pipe stands. On the hand, within the indigene households a

sizable number were willing to pay, but not more than GH¢ 5.00. They still contend that they

made some payments towards construction of the facility. Some were of the view that they

should be made to fetch the water free of charge because they released their lands to pave way

for the construction of the facility.

4.12 WATER AND HEALTH

According to Gleick, (2002), although water-related diseases have largely been eliminated in

wealthier nations, they remain a major concern in much of the developing world. Whereas data

are incomplete, the WHO in the year 2000 in its assessment estimated that there are four billion

cases of diarrhea each year in addition to millions of other cases of illness associated with the

lack of access to clean water. Since many illnesses are undiagnosed and unreported, the true

extent of these diseases is unknown.

Water-related diseases are typically placed in four classes: waterborne, water-washed, water-

based, and water-related insect vectors. The first three are most clearly associated with lack of

improved domestic water supply (Gleick, 2002).

University of Ghana http://ugspace.ug.edu.gh

90

Table 4.18 Estimated Deaths from Water-Related Diseases 2000-2020 in the World Diseases Estimated Morbidity

(episodes per year or people infected)

Estimated Mortality (deaths per year)

Relationship of Disease to Water and Sanitation Conditions

Diarrheal diseases 1,000,000,000 2,200,000 to 5,000,000

Strongly related to unsanitary excreta disposal, poor personal and domestic hygiene, unsafe drinking water

Intestinal helminths 1,500,000,000 (people infected)

100,000 Strongly related to unsanitary excreta disposal, poor personal and domestic hygiene

Schistosomiasis 200,000,000 (people infected)

200,000 Strongly related to unsanitary excreta disposal and absence of nearby sources of safe water

Dracunculiasis 150,000 (in 1996) --- Strongly related to unsafe drinking water

Trachoma 150,000,000 (active cases)

--- Strongly related to lack of face washing, often due to absence of nearby sources of safe water

Poliomyelitis 114,000 --- Related to unsanitary excreta disposal, poor personal and domestic hygiene, unsafe drinking water

Trypanosomiasis 275,000 130,000 Related to the absence of nearby sources of safe water

Source: Gleick, (2002), www.pacinst.org

In the case of this study, whereas the MHMT claim that Abokobi and Pantang zones reports of

no form of water borne diseases in their catchment areas, the Kweiman-Danfa zone confirmed

the existence of bilharzia and typhoid as the most common water related disease in the area in

the past. This is because prior to the provision of the facility, the community members used to

University of Ghana http://ugspace.ug.edu.gh

91

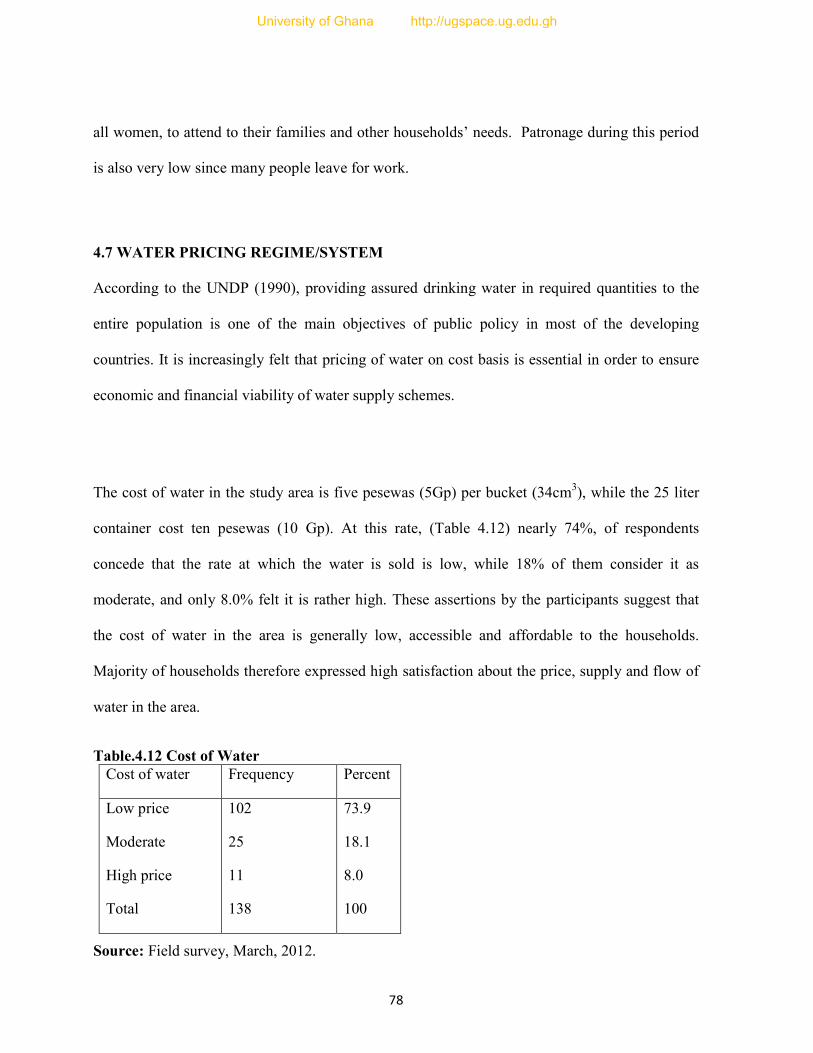
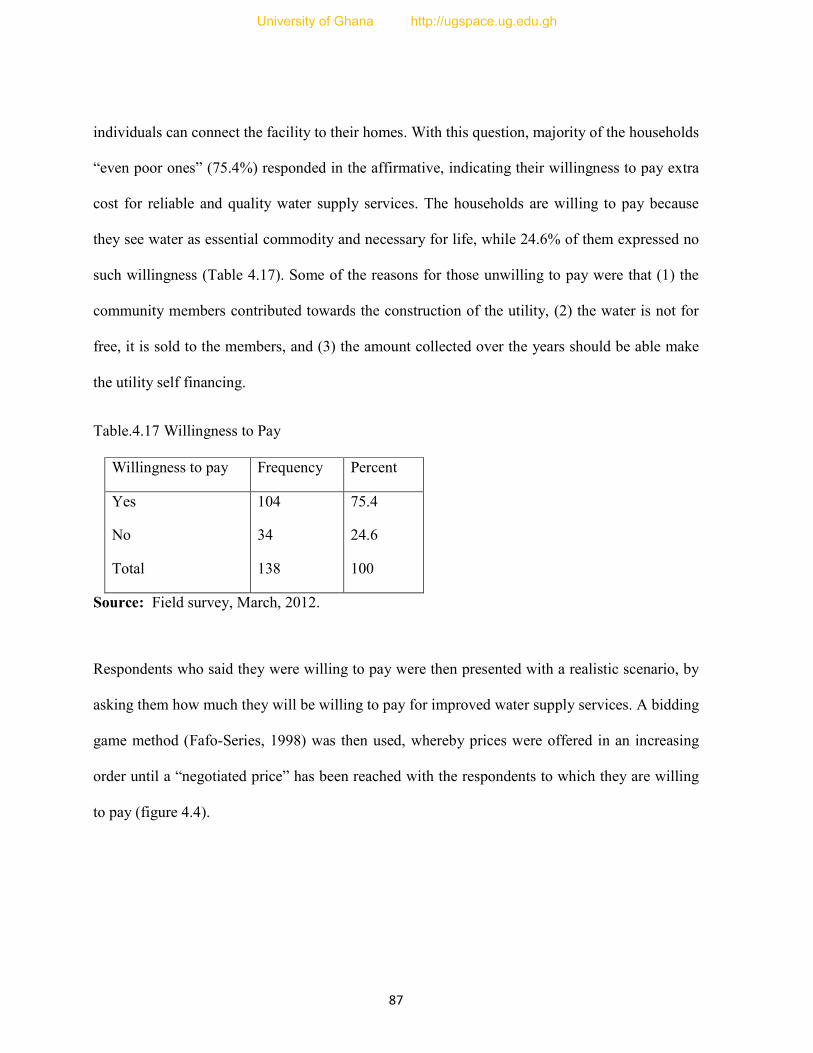
depend on streams and other stagnant sources for use. Interestingly, all the three zones admitted

that in deed the provision of the safe, clean, portable drinking water since 2006 by DANIDA has

seen a remarkable improvement in the general health life of the people.

4.13 THE MANAGEMENT OF THE FACILITY

There are in all 39 public stand pipes in the nine study areas, which are all functioning. Some

households, however, have been able to connect the water to their homes. Both the public pipes

and domestic ones are all metered for effective monitoring. The facilities are managed by

area/zonal managers and their staff and supported by the management boards.

The sale of water is done by vendors who have been recruited from the various operational areas.

They are paid on commission basis at the end of the month. One’s income at the end of the

month is therefore dependent on the sale made for the month at 20% commission rate. There are

revenue collectors who go round to collect daily sales from the vendors and also take meter

readings. This is done for checks and balances and has so far proved to be effective tool for

monitoring the system. The revenue collectors in turn pay the amount collected to the accounts

clerks who then pay into the zonal accounts at the bank.

It was interesting to note that each of the water zones operate their respective bank account into

which all monies are lodged. A discussion with the WATSAN committees revealed that indeed

all monies are saved in the bank, from which monies are also withdrawn for repairs, and payment

of staff salaries among others.

University of Ghana http://ugspace.ug.edu.gh

92

4.13.1 Formation of the Management Board

Each of the operational zones has a functional management board in place to complement the

zonal managers who are solely responsible for the day-to-day administration of the facilities. The

board is formed after town or community meeting has been held in the respective communities

with all stakeholders in attendance - chiefs and elders, assembly men/women, representatives of

the municipal assembly, and the entire community members. Members present nominate people

whom they want to serve on the board after which election/ voting is conducted to select 5 of the

nominees from each community. These 5 people then constitute the WATSAN COMMITTEE. A

second round of voting is then conducted at the WATSAN COMMITTEE level to elect three

members from each community, who together with zonal manager, the accounts officer, a

representative of the municipal assembly and the assembly men/women of the respective

electoral areas as ex-officio members to constitute the board. The formation of both the

WATSAN COMMITTEE and the board is supervised by the regional Community Water and

Sanitation Agency (CWSA). Board members serve for a period of four years subject to re-

nomination and election. Thus each board member can serve a -two -four -year term.

4.13.2 Functions of the Watsan Committees and the Boards

The key responsibilities of the WATSAN committees and the water boards for decentralized

management of water include; operate and manage the facility on behalf of the community, set

and collect tariffs from users, carry out repairs on water facility directly or through the private

sector, and account regularly to the community on the operations and management of the water

facility.

University of Ghana http://ugspace.ug.edu.gh

93

The board which represents the general assembly is the main decision-making body. It exercise

control over the executive committee, responsible for general management, and employment of

staff for the day-to-day management and operations. The board further acts as the mouth piece

and intermediaries between the community and management. Any grievances of community

members can be channeled through the board for consideration and redress. The board is also

responsible for award of contracts and for mobilizing the communities. It also approves the tariff,

connection fees and annual budget as presented by the manager through executive committee.

Other activities carried out by the board are geared towards accountability to the community

such as dissemination of information, as well as rapid attention to repairs.

4.13.3 The Executive Committee

After the formation of the board, there comes the next hierarchy of executive committee.

Another election is held at the board level to elect officers to the positions of chairman, secretary,

treasurer and hygiene educator. These four officers together with the zonal manager then form

the executive committee.

4.13.4 Functions of the Executive Committee

The main function of the executive committee is to see to the general management of the system,

including proposing annual budget, propose new tariffs and recruitment of staff as and when

proposed by the manager. It also considers and takes action on major decisions raised by the

board. However, the day-to-day running of the facility is sole responsibility of the manager. He

may refer cases to the executive committee for consideration. He is also responsible for the

pumping, treatment, distribution, maintenance and customer relations. Although he is

University of Ghana http://ugspace.ug.edu.gh

94

accountable to the board he is also autonomous in the discharge of his duties. Other staffs who

work directly under the manager are the accounts officer, water vendors, revenue collectors,

cashiers, technical operators, security men and other office staff members.

The compositions of the board members in terms of men – women ratio is shown in Table 4. 19

Table 4.19 Representation on the Water Board

Zone Men Women Total

Abokobi 6 3 9

Kweiman-Danfa 14 3 17

Pantang 8 2 10

Source: Field survey, March, 2012.

It is very clear from Table 4.19 that the representation of women compare to their male

counterparts on the board is very low. Apart from the board, each zone has a well functioning

office where they operate from. These are headed by area managers, with accounts clerks to take

charge of their monetary aspects. These two figures are ably supported by other staff members.

Although each of the board is autonomous, they come under the direct supervision of the

Municipal Water and Sanitation Agency (MWSA) of the Assembly. The boards meet quarterly

to deliberate on issues before it such as tariff adjustment, repairs, reading of accounts among

others.

University of Ghana http://ugspace.ug.edu.gh

95

4.13.5 Supporting Agencies

Support agencies play major roles in the construction and initial operation and maintenance of

the water system. These agencies provide technical assistance, community training and financial

support. One of such support agencies is DANIDA, in collaboration with CWAS, was

responsible for the construction and the main financier of the water projects in the study area.

They provide expert advice on technical design, cost estimates, construction management,

financial management, and setting of tariff, expansion planning, and ensuring water quality.

4.14 REVENUE MOBILIZATION

The main source of revenue to the boards for the running and maintenance of the facility is from

the sale of water to the community members. Whereas the Kweiman-Danfa and Pantang zones

collect an average of GH¢ 300.00 daily sales on water, the Abokobi-Teiman zone receives an

average of GH¢ 200.00. These differentials could be attributed to the fact that the Abokobi-

Teiman zone serves only three (3) communities, whereas those of Kweiman-Danfa and Pantang

zones serve ten (10) and eleven (11) communities respectively. These translate into an average

monthly revenue of GH¢ 8000.00 from the sale of water to each board. These monies are mainly

collected on behalf of the board by water vendors employed by the board and paid on

commission basis of 20% on sales made at the end of the month. This means on the average the

board pays about GH¢1600.00 as commission to the vendors.

The study further revealed that the boards have solely relied on these revenues for their

operational and recurrent costs. So far the boards have been self sufficient in solving and meeting

University of Ghana http://ugspace.ug.edu.gh

96

their mandate. They see to supply water to their catchment areas, carry out all repair works, pay

their staff, and other expenditures.

4.15 CAPACITY BUILDING

Capacity building has a broad definition. It is a holistic enterprise, encompassing a multitude of

activities. Its meaning include building abilities, relationships as well as values that will enable

organizations, groups and individuals to improve their performance and achieve their

development objectives. It also includes strengthening the processes, systems and rules that

influence collective and individual behaviour and performance in all development activities. It

also means enhancing people’s technical ability and willingness to play new developmental roles

and adapt to new demands and situations (UNEP, 2002).

According to the findings of this survey, local water management boards receive one form of

training or another to build their capacities. This comes usually in the form seminars and

workshops on record keeping, financial cost analysis, business plan and proposal writing. This

training is often given by the Regional CWSA and other private organizations on yearly basis

and when deemed necessary. The local boards in collaboration with the MWST also run training

for community members and school children in a form of water and sanitation education,

hygiene (hand washing) and environmental education.

4.16 MANAGING THE ENVIRONMENT OF THE FACILITIES

The management of the water sites and the facilities is the sole responsibility of the WATSAN

committees. In the study area the committees see to it that the vendors clean up the sites every

morning before the taps are opened to the public for business. Since all the facilities are cited in

University of Ghana http://ugspace.ug.edu.gh

97

the town centers, the issue of the place being weedy is not a problem to the cleaners and the

community. In all the sampled communities, one by-law that regulates the use and management

of the facilities is that users are not permitted to wear slippers to the pipe stands. More

importantly, washing at the stands is strictly outlawed. It was also noted that the stands have

been cemented and soak away constructed to allow spill over water move away so that the place

does not become wet and muddy. Contrary to Yelbert (1999) assertion, school children in the

study areas were not involved in the site cleaning of the facility. However, they are educated on

personal hygiene like the hand washing project in the schools, and environmental cleanliness.

This simple accountability by the committee to the community has proved to be critical for

sustainability of the facilities. It is therefore essential to promote accountability of these local

level institutions to community members in order to guarantee sustainability of public utilities to

build up the sense of community ownership and management (COM) among beneficiary

community members.

4.17 CHALLENGES FACING THE BOARD IN THE MANAGEMENT OF THE

UTILITY

The study revealed that the first and major challenge facing board in the smooth administration

and management of the facility is the frequent breakdown of the facility. This has been a major

constraint because the repair works of these breakdowns takes over 40% of the total over head

cost of the board. This frequent repair is partly due to ongoing road constructions to give a

facelift in the area. Lack of spare parts poses another constraint to the board in fixing a facility.

University of Ghana http://ugspace.ug.edu.gh

98

This come in a form of faulty and inferior meters, burst pipes and irregular power supply for

water pumping. It was established that it sometimes take quite a number days or weeks to fix a

facility line.

Low patronage of the facility is a border the board. In the perspective of the board it is the

position to supply and meet the daily water requirement of households than it is currently

supplying. This they can only do if demand for water goes high.

University of Ghana http://ugspace.ug.edu.gh

99

CHAPTER FIVE

SUMMARY, CONCLUSION AND RECOMMENDATIONS

5. 0 INTRODUCTION

This chapter provides the summary of the findings of the study, conclusions drawn out of the

study, and the recommendations given for future considerations. It further highlights how the

specific objectives set for the study have been addressed. The study was conducted in nine towns

/ villages in the Ga East Municipal Assembly of the Greater Accra Region.

5.1 SUMMARY

The study generally seeks to investigate how rural people manage their water systems for

sustainable livelihood. It was also intended to examine the extent to which stakeholders

implement sustainable, cost-effective and environmentally friendly management options for their

water systems.

The study is made up of five chapters. Chapter 1 gives the background to the study, and this

comprises the research questions, research objectives and research hypotheses. Also presented

are the justification of the study, and a description of the study area. Chapter 2 presents a review

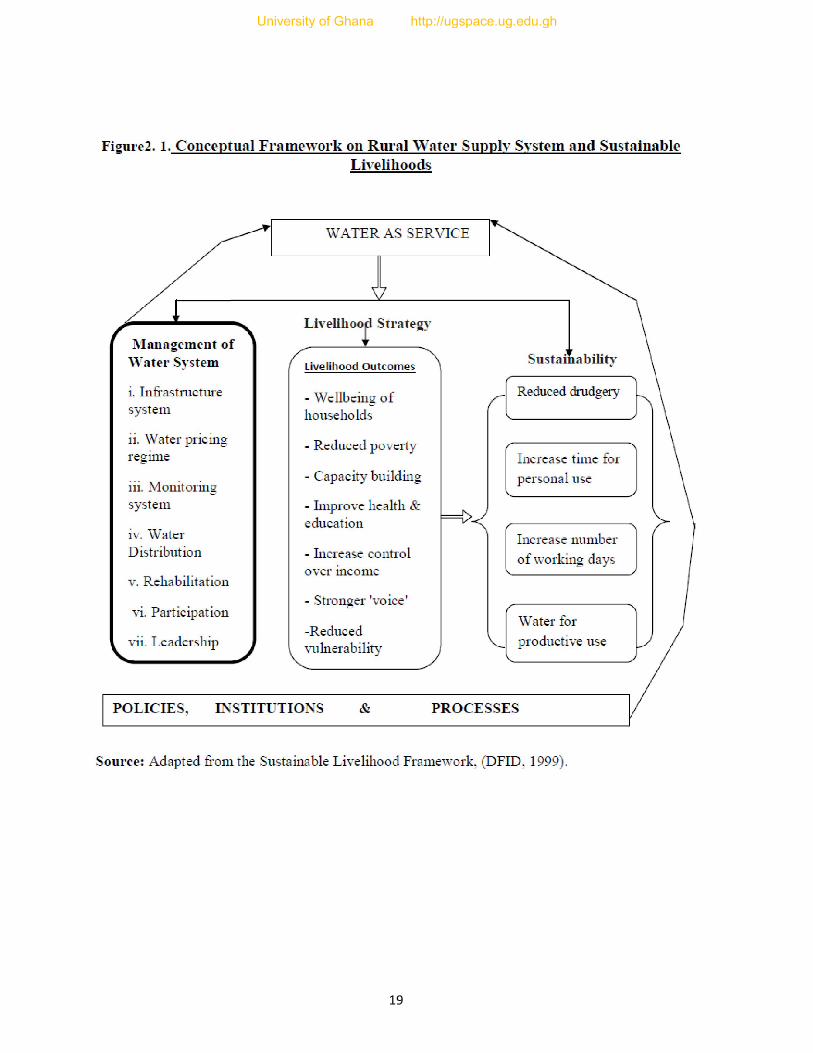
of the literature on understanding the relationship between water and sustainable livelihood.

There is also a presentation of the conceptual framework on which the study was based. Chapter

3 details with the various methodologies for sample selection, data collection and analysis

employed in this research. Chapter 4 deals with the analysis of the research findings. The last

chapter- chapter five gives the general summary of the study as well as the conclusion and the

recommendations made for future considerations.

University of Ghana http://ugspace.ug.edu.gh

100

5.2 FINDINGS OF THE STUDY

Objective 1: Assessing the participation of community members in the provision and

management of the water system.

Participation in the view of Cornwall (2001) cited by Khanal (2003), is an approach meant to

induce increase in performance or produce impact, by providing conditions that enable

beneficiaries to take on new responsibilities and opportunities. He noted that participation has

moved beyond project execution to policy reform and self-governance, and has even been

considered in modern times as the way to operationalize decentralization for democratic

transformation and governance.

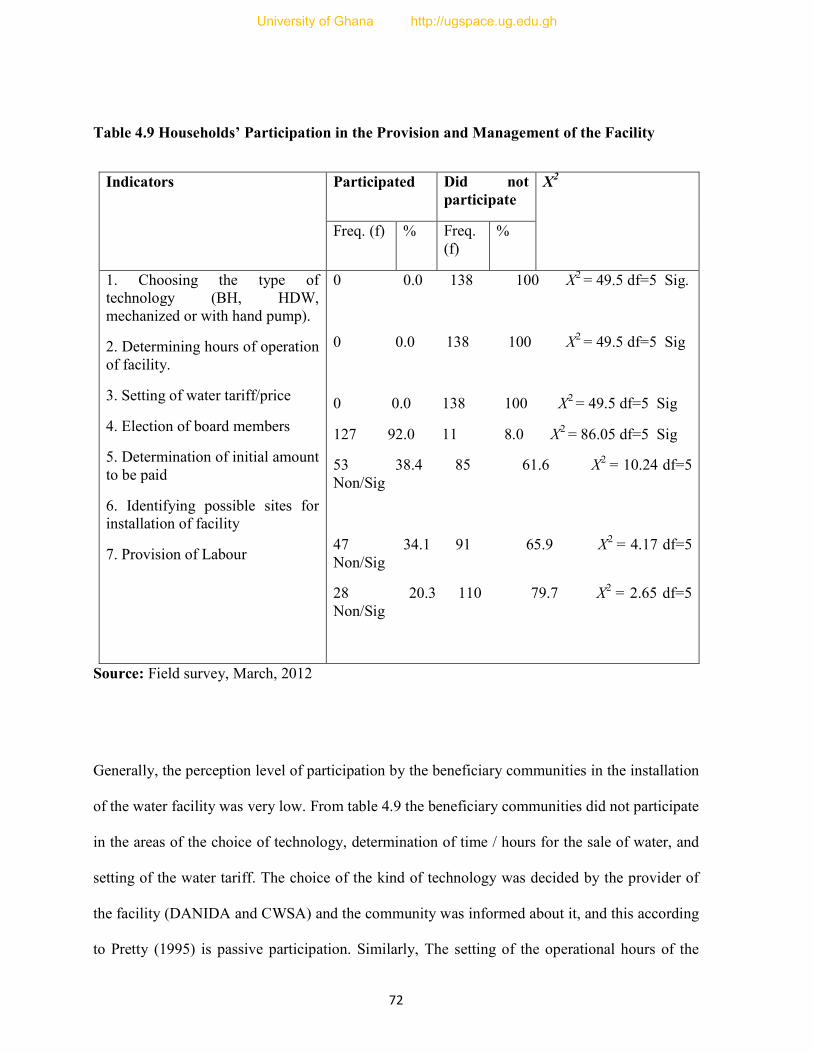
The survey results indicate that the level of participation by the beneficiary communities in the

study area was very low. Beneficiaries of the utility did not actively participate in the choice of

the kind of technology to be used. The choice of the technology was considered as purely

technical, which the rural folks have no or little knowledge of, hence the choice of it was decided

by the provider of the utility (DANIDA), and the community was only informed about it. This

kind of participation by the community according to Pretty (1995) is passive. Informing and

creating awareness is a very important step towards public participation, without it true public

participation cannot take place. It is also important that the public is informed at an early stage

because if they do not know about projects and plans on time, it makes it difficult for

beneficiaries to truly get involved and exercise influence.

University of Ghana http://ugspace.ug.edu.gh

101

Similarly, the choice of site for construction and installation of the facility was considered as

purely technical, hence the limited participation (34.3%) by the community members.

Participation here is basically seen in terms of the land owners or family heads of the respective

proposed sites being contacted for the release of their lands for the project. That is, the

households jointly demarcated the areas within which the facilities could be sited. Participation

in this sense according to Pretty’s typology (1995) is by consultation. Though consultation is a

valid step towards full participation it must be combined with other forms of participation to

make the needed impact. Just by consulting the public does not guarantee that citizens’ concerns

and ideas will be taken into account.

Participation of members regarding the initial cash contribution towards the construction of the

facility was quite substantial (38.7%), and this was also by consultation. Members were made to

understand that before the facility was installed, there was the need for each community to pay

five per cent (5%) fee towards the total cost of the facility. Members had no choice but to pay.

However, the setting of the operational hours of the facility (time of sale of water) and the

pricing of the water are basically within the domain of management and the governing board.

The pricing is determined by the management subject to the approval by the board. The new

price regime (if any) is communicated to the community members through the water vendors,

hence members participation is nil in the hours of operation and the pricing system.

It also emerged from the survey results that in order to let the community owned the facility and

utilize it, some community members have been voted to serve on the water governing board,

which is the decision making body. Not only that all the water vendors are members from the

respective operational areas. This is a semblance to Pretty’s typology (1995) of Self-

University of Ghana http://ugspace.ug.edu.gh

102

mobilization, which is a higher level of participation. By Self-mobilization, people participate by

taking initiatives independent of external institutions to change systems. They develop contacts

with external institutions for resources and technical advice they need, but retain control over

how resources are used. Self-mobilization can spread and strengthened if government and NGOs

provide an enabling framework of support. Such self-initiated mobilization may or may not

challenge existing distributions of wealth and power (Cornwall, 2008).

Objective 2 To investigate the willingness of household to pay for improved water supply services. According to Kim (1998) people’s willingness to pay for a service is an economic concept which

aims to determine the maximum amount of money consumer will pay for the supply of water.

WTP therefore, has a significant role in assessing acceptable water charges to users upon which

water policy can be developed with the confidence of achieving cost recovery.

According to Bin-Seraj (2007) cited by Braimah and Fielmua (2011) in the design of a tariff

structure, it is essential for one to match households’ willingness to pay for the service with their

ability to pay. Ability to pay is purely a financial phenomenon that is derived from income or

expenditure information of households and helps to determine the optimal tariff structure of a

service. That is the ability to pay for a service is a primary function of income and cost of living,

which in turn is a function of employment (Brikke, 2000 in Braimah and Fielmua, 2011).

In this study the results show that majority of the respondents (over 75%) were more than willing

to pay for improved water services in their communities, most importantly, those wishing to have

University of Ghana http://ugspace.ug.edu.gh

103

the facility connected to their homes. This is a healthy and positive development upon which the

respective management boards can capitalize on to expand the facility.

The study further revealed that the willingness and ability of respondents to pay was not

influenced by the presence of alternative sources of water and their income levels. It was noted

that although most of the communities have other alternative sources of water like wells and

streams, their desire for good drinking water have resorted to the subsequent abandonment of the

these sources. The payment for the use of the water from the tap net work was therefore not of

major concern to them, though some community members expressed some reservations about it.

They had wished that they making initial payment towards the construction of the facility would

have enabled them to fetch the water free of charge. But upon installation of the system, they

never fetched water for free. For these people, the water should rather be sold to “new comers”

in the communities since they did not contribute towards the initial construction. This confirms a

similar study by Yelbert (1999) cited by Braimah and Fielmua (2011) that the idea of selling

‘ordinary’ water is generally not culturally acceptable in most rural communities.

Objective 3: To assess how the provision of improved water services has influenced the lives of rural households. In this survey, the households conceded that the provision of the clean and safe drinking water in

their communities has brought a lot of health benefits to them. The problem of water borne

diseases like buruli ulcer, typhoid and bilharzias and cholera, which were the leading causes of

diseases in the area has drastically reduced and almost eradicated in the area. Majority of the

households also reported that they are satisfied with the quality of water supply in the area. They

therefore maintain that the water from the tap is clean and safe for human consumption. Their

University of Ghana http://ugspace.ug.edu.gh

104

only concern was the taste of the water, which they claimed was salty for drinking. It has

however been established that this “saltiness” of the water is due to taste preference of

consumers.

The study further revealed that the provision of the pipe borne water in the area has brought a lot

of reliefs to the households. Unlike previously where people had to walk long distances in search

of water for several hours most especially during the dry seasons, now with a walking distance of

10m to 50m one will come across a pipe stand for water. The public pipe stands are located at

vantage points within the communities where water flows throughout the day and at a moderate

cost. This suggests that the difficulty of households (women and children) having to walk long

distances thereby spending long hours in search water has been curtailed. Residents are now in

position to translate the “time gained” into profitable economic ventures to improve their

livelihoods.

Objective 4: To investigate the environmental site management of the water sources of the beneficiary communities. According to NOVA SCOTIA (2009), a Policy and Corporate Services Division, Environmental

Assessment Branch, environmental assessment is a tool through which the environmental effects

of a proposed undertaking are predicted and evaluated, and a subsequent decision taken on the

acceptability of the undertaking. According to the report the purpose of environmental

assessment is to promote sustainable development by protecting and conserving the environment.

Environmental assessment thus promotes better project planning by identifying and assessing

possible adverse effects on the environment before a new undertaking begins. This can be

University of Ghana http://ugspace.ug.edu.gh

105

accomplished by involving government agencies, NGOs, and the general public throughout the

review of a proposed development.

In this survey an environmental tour was undertaken at the various pipe stands to ascertain the

level of environmental cleanliness of the sites. It was observed, however, that the facility sites

are well maintained in all the nine communities of study. Among the measures put in place to

ensure environmental cleanliness of the sites are; (1) users are not permitted to wear slippers to

the pipe stands, (2) washing at the stands is strictly prohibited, and (3) the stands have been

cemented and gutters constructed to allow spill over water move away. Also the water vendors,

as part of their duties, are expected to clean the immediate surroundings of the pipe stands before

the tap is opened to the public in the mornings.

5.3 CONCLUSION AND LESSONS LEARNT

The issue of development in its true sense of ownership by the community has proved to be the

vehicle for the successful operation and functioning of a water supply scheme. One of the main

reasons why a true sense of ownership may be missing is the lack of legitimate participation by

the community in the planning and decision making stages. Other reasons are lack of

transparency about what financial and technical contributions would be required from the

community, and the failure to develop the skills and resources at the community and local levels

needed for the effective management of the water supply systems.

Again using the decentralized approach of water management has improved governance both at

the municipal assembly and at the community level. However, there is the need to deepen

University of Ghana http://ugspace.ug.edu.gh

106

decentralization process by strengthening the capacities of the municipal assembly in its

infrastructural delivery. Also the sub-structures of the municipal assembly for instance the

MWST and MHMT must be strengthened and integrated into the delivery and management of

water for effective governance.

Government must establish appropriate regulatory institutions and give them the ‘power to bite’

those whose duties it is to harness and protect the country’s resources in general, and water

specifically for sustainable national development but fail to so. That is there must be clear and

definitive national development policies for the country’s natural resource sector backed by

appropriate legal frameworks. It is time Ghana developed and adopted a national resources

charter, which should provide an integrated framework for the holistic management of all

national resources. Such a charter should include guidelines on such important policy issues

dealing with the non-renewable resources, environmental management and revenue mobilization

and disbursement to ensure equitable national development.

Apart from being politically right and socially beneficial, investment and management of water

resources and infrastructure also makes great economic sense. Meeting the MDG targets to

achieving universal water coverage by the year 2015 will not only improves quality of life, but

will also bring about environmental benefits. That is, improving greater access to clean drinking

water will go a long way to contribute considerably to achieving the other MDG targets.

The general lessons learnt were that the water boards’ are making efforts to involve the

communities in the affairs of the water scheme. However, this involvement is usually limited to

University of Ghana http://ugspace.ug.edu.gh

107

the operations and maintenance aspects primarily to reduce costs and increase long-term

functioning of the facilities. Some of the principal actors and stakeholders (assembly men, chiefs

and elders etc.) who were involved from the beginning of the project from the planning and

decision making process to the implementation stage have a stronger feeling of ownership of the

facilities, and are therefore willing to take up management responsibilities. Thus, community

members are more than willing to participate in the management of water scheme if they

perceive the improvements as desirable and belonging to them.

Finally, the study revealed that:

i. The MWSTs receive inadequate budgetary allocation for their operations.

ii. The MWSTs members who play supervisory roles over the managers have low capacity

to handle certain technical issues confronting them.

iii. 3. Low motivation of WATSAN committees and WSDBs members after sometime since

the services they provide are purely on voluntary basis.

iv. Irregular accountability of WATSAN committees and WSDB to the community.

5.4 RECOMMENDATIONS

1. It is hereby recommended that the board should be re-structuring to include a team of skilled

and competent professionals, as well as other relevant disciplines in line with best practices, who

should be assigned with various responsibilities to help manage the water schemes properly.

2. As a short term measure, the board and management should see it as a matter of urgency to

expand the facility to the outskirt of town since the communities are rapidly increasing in

population. This they can do on the interim by installing storage-tanks at vantage point at the

University of Ghana http://ugspace.ug.edu.gh

108

outskirts, from which water will be sold to those living in there. However, the storage tanks will

require regular cleaning and maintenance. They should be cleaned at least once a year or more

often when necessary to remove algae, silt and bacteria that may be harmful to the health of

households. The presence of algae can create bad water odour and taste. To ensure easy cleaning,

the storage tanks should be mounted in easily accessible areas. Tanks should also be kept out of

direct sunlight and, if possible, in an enclosed location specifically designed for the purposes of

tank storage.

For the long term measure, the managers of the scheme should make it their top priority to

provide flexible terms to allow more households connect the facility to their home. This is

because the schemes have what it takes to expand. On a more serious note and as part of the

long term measures, efforts should be made to procure stand-by generators to enhance the

operations of the scheme.

3. Adequate budgetary allocations should be provided from the assembly’s resources to the

MWSTs to enable the unit discharge its duties diligently. More importantly, CWSA and other

water related agencies should organize regular training for the MWSTs to equip them with

relevant skills to help them handle certain technical issues regarding the management of the

water scheme.

4. More samples should be collected to study about willingness to pay by applying the

Econometric Model and study regarding the connection fees and water tariff.

University of Ghana http://ugspace.ug.edu.gh

109

Since most of the recommendations requires investment which were not captured in the study as

to how the necessary resources could be obtained by the stakeholders (mainly the Municipal

Assembly), it is hereby proposed as questions for further research work that; By which strategies

can the municipality invest in the communal portable water system without this falling back as

an additional burden to household income?

University of Ghana http://ugspace.ug.edu.gh

110

REFERENCES Asian Development Bank, (2004). Bringing Water to the Poor: Selected ADB Case Studies, Manila. Belli, G. (2008). Non-experimental Quantitative Research Method. A Manual to Understanding Quantitative Research. Implementation Stage. Bin-Seraj, F.K. (2007). Willingness to Pay for Improved Water and Sanitation Services. BRAC Research and Evaluation Division. BRAC Publication. Bangladesh. Bojö, J. (2000). Natural Resource Management. Effective use of Resources to Reduce Poverty and Sustainable Development. Braimah, I. and Fielmua, N. (2011). Community Ownership and Management of Water and Sanitation Facilities: Issues and Prospects in the Nadowli District of the Upper West Region of Ghana. Journal of Sustainable Development in Africa, Vol. 13, No.2. Butterworth, J. and Soussan, J. (2001). Water Supply and Sanitation & Integrated Water Resources Management: Why seek better Integration? WHIRL Project. Working Paper 2 Preliminary results of research for discussion and comment. Carswell, G. (1997). Agricultural Intensification and Rural Sustainable Livelihoods: IDS Working Paper 64. Chambers, R., (1987). Sustainable Livelihoods, Environment and Development: Putting Poor Rural People First, IDS Discussion Paper 240, Institute of Development Studies Brighton, UK. Chambers, R. and Conway, G. (1992). Sustainable Rural Livelihoods: Practical Concepts for the 21st Century. IDS Discussion Paper 296. Institute of Development Studies, Brighton, UK. Cornwal, A. (2008). Unpacking Participation: Models, Meanings and Practices; Community Development Journal Vol. 43 No 3, July 2008 pp. 269–283. District in Ghana; Retrieved from; http:// www.ghanadistricts.com DFID (1999). Sustainable Livelihoods Guidance Sheets. Ellis, F. (2000). Rural Livelihoods and Diversity in Developing Countries. Oxford University Press, Oxford, UK. Engelman, R. and Le Roy, P. (1993). Sustaining Water Population and the Future of Renewable Water Supplies. Population Action International. Washington, D.C. Entsua-Mensah, M., Essegbey, G., Frempong, G. and Engmann, C. (2007). Assessment of Community Water and Sanitation in Ghana. African Technology Policy Studies Network, Nairobi, Kenya.

University of Ghana http://ugspace.ug.edu.gh

111

Fafo Series (1998). Ability and Willingness to Pay for Water and Sewerage Services in the two Palestinian Cities. Results from a Household survey of Nabulus and Gaza City. FAO (1998). FAOSTAT Statistical Database in CD-ROM. Rome: FAO. FAO (2004). Rural Households and Resources; A Guide for Extension Workers. Federal Highway Administration. (2012). Planning for Transportation in Rural Areas. retrieved 28/08/2012; http://www.fhwa.dot.gov/ Fowler, F. J., (2001). Survey Research Methods. (3rd Ed). Applied Social Research Methods Series, Vol. 1 Henderson, H and Wade, A. (1996). A Research Section Occasional Paper No. 7. Canberra, Australian Institute of Aboriginal and Torres Strait Islander Studies. Holcombe, R. G., (1997). A Theory of the Theory of Public Goods. A Review of Austrian Economics 10, No. 1. Huggins, C. (2003). Rural Water Tenure in Kenya and Tanzania: Changing Tenure Patterns, Legal Regimes and Community Responses. OSSREA Development Research Series, No. 5 Gbadegesin, N. and Olorunfemi, F. (20070). Assessment of Rural Water Supply Management in Selected Rural Areas of Oyo State, Nigeria, ATPS Working Paper Series No. 49 Gerhardt, P. L. (2004). Research Methodology Explained for Everyday People. GSS (2012). 2010 National Housing and Population Census; Population by District and Sex. Gleick, P. H. (1996). Basic Water Requirements for Human Activities: Meeting Basic Needs. Water International 21(2). Gleick, P. H. (2002). Dirty Water: Estimated Deaths from Water-Related Diseases 2000-2020. Godden, B. (2004). Formulas to Estimate Household Sample Size. IFAD (2001). Rural Poverty Report. The Challenge of Ending Rural Poverty. Oxford University Press, Oxford, UK. IFAD, (1988). Report of the Special Programming Mission to Ghana. Report No. 0105-GH. IIASA (2002). European Rural Development; Project Description, 4th Revision (Heilig G. K. Ed.) Laxenburg, Austria. ILO Convention (1973). Minimum Age Convention, No. 138. IPCIG (2009). Costa, J., Hailu, D., Silva, E. and Tsukada, R. (Eds.). Water Supply in Rural Ghana: Do Women Benefit? No. 101.

University of Ghana http://ugspace.ug.edu.gh

112

IRC International (1997). Water Supplies Managed by Rural Communities Country; Reports and Case Studies from Cameroon, Colombia, Guatemala, Kenya, Nepal and Pakistan. Delft, The Netherlands. ISRDS, (2000). A Strategic Approach to Rural Development: An Integrated Sustainable Rural Development Strategy; Cabinet Memorandum, No 18 of 2000. South Africa. James, A. J. (2003). Linking Water Supply and Rural Enterprise: Issues and Illustrations from India. Jennifer, S. and Travis, K., (Eds), (2009): Making Rural Water Supply Sustainable: Report on the Impact of Project Rules EU-Ghana, 2011, water and rural development. UNDP -World Bank Water and Sanitation Program, Karingi S. N., (2001). Fiscal Policy for Poverty Reduction Case Study Revenue Design: The Kenyan Experience. Kenya Institute for Public Policy Research and Analysis. Khanal, P. R. (2003).

Participation and Governance in Local Water Management. Wageningen University, The Netherlands. Kim, L. (1998). Willingness to Pay for Water at the Household Level: Individual Financial Responsibility for Water Consumption. MEWEREW Occasional paper No. 26. Krepelka, J. (2007). Public Goods and Private Preferences: Are they Reconcilable? University of Geneva, Switzerland. Lockwood, H. (2004). Scaling up Community Management of Rural Water Supply. A Thematic Overview Paper. Lockwood, H. (2002). Institutional Support Mechanisms for Community-managed Rural Water Supply & Sanitation Systems in Latin America. Strategic Report 6, Bureau for Latin America and the Caribbean, USAID. Washington, DC. Ludi, E. (2009). Climate Change, Water and Food Security; Overseas Development Institute. Moe, C. L. and Rheingans, R. D. (2006). Global Challenges in Water, Sanitation and Health; A Journal on Water and Health, IWA Publishing, India. NDPC/GoG/UNDP (2010). Ghana Millennium Development Goals Report, 2008. NRC. (2000). Watershed Management for Potable Water Supply: Assessing the New York City Strategy. National Academy Press: Washington, D.C. National Peace Corps Association, (2010). Ways to Manage, Conserve, and Collect Cleaner, Fresher Water in Rural Sub Sahara Africa.

University of Ghana http://ugspace.ug.edu.gh

113

NOVA SCOTIA (2009). A Proponent’s Guide to Environmental Assessment. Orindi, V. and Huggins, C. (2005). The Dynamic Relationship between Property Rights, Water Resource Management and Poverty in the Lake Victoria Basin. International Workshop on African Water Laws: Plural Legislative Frameworks for Rural Water Management in Africa, 26-28 January 2005, Johannesburg, South Africa. Pinsonneault, A. and Kraemer, K. L. (1992). Survey Research Methodology in Management Information Systems: An Assessment Working Paper No. URB-022. Rajendra K. (2006). Does Community Based Forest Management Contribute to the Livelihood of Rural People? Experiences from Nepal. Scoones, I. (1998). Sustainable Rural Livelihoods: A Framework for Analysis. IDS Working Paper 72. SAGE (2009). Estimation of Standard Error of Indices in the Sampling Business Surveys. SEAMLESS (2005). Developing a Conceptual Framework for Integrated Analysis and Assessment of Agricultural Systems. Ewert, F. A., van Ittersum, M. K., Bezlekpina, I., Oude Lansink, A. G. J. M., Brouwer, F. M., Andersen, E., Flichman, G., Heckelei, T., Alkan Olsson, J., Olsson, L., Rizzoli, A. E., van der Wal, T. and Wery, J. (Eds.). No. 010036 Deliverable Number: PD1.2.1. Soussan, J., Blaikie, P., Springate-Baginski, O. and Chadwick, W. (undated). Understanding Livelihood Processes and Dynamics. Livelihood-Policy Relationships in South Asia; Working Paper 1. Talbot, L. and Verrinder, G. (2005). Promoting Health. In Elsevier, Churchill and Livingstone (Eds), The Primary Health Care Approach. Australia. TREND Group, (2003). Water, Sanitation and Service Delivery in Ghana; A Paper Prepared for the WELL Resource Centre Network for Water, Sanitation and Environmental Health. UN, (999). World Population Prospect: 1998 Revision. New York: UN Department of Policy Coordination and Sustainable Development. UN (2005). Public-Private Partnerships for Service Delivery: Water Supply and Sanitation; Third Meeting of the Committee on Human Development and Civil Society; Addis Ababa, Ethiopia. UNEP (2002). Capacity Building for Sustainable Development: An Overview of UNEP Environmental Capacity Development Initiatives. UN-EU (2008). Capacity Development for Managing Land and Natural Resources; Guidance Note for Practitioners. UN-WATER, (2000). Rural Water Supply: retrieved from: http://www.unwater.org

University of Ghana http://ugspace.ug.edu.gh

114

UN-WATER, (2006). Water in a Changing World; The United Nations World Water Development Report 3

UN-WATER (2011). Wter Quality Challenges and Impacts. USAID (2006). Evaluation of USAID Strategy to Increase Potable Water Access and Sanitation

in Rural Areas of Dominican Republic.

Watson, R.T. (1998). Protecting our Planet, Securing our Future: Linkages Among Global Environmental Issues and Human Needs. UNEP, U.S. National Aeronautics and Space Administration, World Bank. Washington, D.C. Whittington, D., Davis, J., Prokopy, L., Komives, K., Thorsten, R., Lukacs, H., Bakalian, A.

and Wakeman, W. (2008). How well is the Demand-Driven, Community Management Model for Rural Rater Supply Systems Doing? Evidence from Bolivia, Peru, and Ghana. BWPI Working Paper 22.

WHO (2005). Water Safety Plans; Managing Drinking-Water Quality from Catchment to

Consumer. WHO/ UNICEF (2006). Meeting the MDG Drinking Water and Sanitation Target: The Urban

and Rural Challenge of the Decade.

World Bank (1992). Development and the Environment. World Development Report 1992, New York: Oxford University Press. World Bank (2000). Entering the 21st century. World Development Report 1999/2000. New

York: Oxford University Press. WSP-AR (2002). Rural Water Sector Reform in Ghana: A Major Change in Policy and

Structure; Field Note 2. Yan, S., Asante, F. and Birner, R. (2010). Opportunities and Challenges of Community-Based

Rural Drinking Water Supplies. An Analysis of Water and Sanitation in Communities in Ghana. IFPRI Discussion Paper 01026

Yelbert, J. E. (1999). Community Management Practices. Integrated Development for Water and Sanitation. WEDC Publications, Addis Ababa, Ethiopia.

University of Ghana http://ugspace.ug.edu.gh

115

APPENDIX 1

UNIVERSITY OF GHANA COLLEGE OF AGRICULTURE AND CONSUMER SCIENCES

DEPARTMENT OF EXTENSION QUESTIONNAIRE TO HOUSEHOLD HEADS ON WATER SUPPLY AND MANAGEMENT IN RURAL AREAS FOR SUSTAINABLE LIVELIHOODS. INTRODUCTION: This Questionnaire seeks to elicit information on the management of rural water systems by households, and how this affects their livelihoods. The information provided is strictly for educational purposes, and it will be used as such. You are therefore assured of confidentiality of any information provided. Thank you for your understanding. 1. Name of Town ………………………………………………………………………………… 2. Sex of Respondent ……………………………………………………………………………… 3. Date……………………………………………………………………………………………… A. SOCIO – ECONOMIC CHARACTERISTCS OF RESPONDENTS 1. Age of respondent ……………………………. 2. Educational Level a. No formal education b. Basic education c. Secondary education d. Tertiary education 3. Marital status. a. Not married b. Married c. Divorced d. Widow e. Widower 4. Size of family / household: No. of Adults ( ) No. of Children ( ) 5. Role in the family a. Head of family b. Adult son not but leader c. Adult daughter but not leader B. LIVELIHOOD / ECONOMIC ACTIVITIES 6. Indicate by ranking the following in order of your primary occupation. 1. Agriculture 2. Petty trading 3. Services 4. Artisan 7. What has been your average monthly income for the past one year? GH¢…………… C. SOURCE OF WATER TO HOUSEHOLDS / COMMUNITY 8. Rank the following sources of water in order of use to your household. 1. Public stand pipe 2. Hand dug well 3. Stream 4. Borehole 5. Tanker services

University of Ghana http://ugspace.ug.edu.gh

116

9. What is the major source of water to your household during the dry season? a. public stand pipe b. well c. tanker services d. stream e. others (specify)……………………. 10. What is the general water situation in your community? a. very easy to come by b. easy to come by c. difficult to come by d. very difficult to come by 11. In your opinion, is the water in your community safe for human consumption? Yes No 12. Which of the following do you consider as a major problem with regards to the water used in your community? a. distance to water source b. colour of water c. taste of water d. others (specify)…............................ 13. How would you describe the state of the water source in your community? a. Clean b. Salty c. Smelly d. coloured e. others (specify)………….. D. COMMUNITY PARTICIPATION 14. Who provided the water used by the community? a. The Community b. District Assembly c. NGO d. Others (specify)…………... 15. Indicate by ranking in each instance where the community participated with 1, 2, or. 3 (1 is ranked as the highest).

15. Was the community consulted on where to site the facility before it was installed?

Indicators Participated Did not participate Cannot tell

Choosing the type of technology (BH, HDW, mechanized or with hand pump).

Identifying possible sites for the facility

Provision of Labour Election of WDB members.

Determining hours of operation of facility

Determining the initial amount to be paid by members.

Setting water tariff/ price

University of Ghana http://ugspace.ug.edu.gh

117

Yes No cannot tell 16. Did the community / households contributed any money towards the provision of the water facility used by the community? Yes No 17. If yes, how much did the community / household contributed? GH¢……………….. E. WATER TARRIF/ PRICING SYSTEM 18. Do you pay for the water used in the community? Yes No 19. If yes, how much do you pay for a bucket (34cm3) of water? Gp………………… 20. How do you find the cost of the water sold to the community? 1. Very low 2. Low 3. Moderate 4. High price 5. Very high 21. Do you agree to the price at which the water is being sold to the community? 1. Strongly Agreed 2. Agreed 3. Disagreed 4. Strongly disagreed 22. Who determine / fix the price of the water? a. District Assembly b. Unit Committee c. Water board d. others (specify)……... 23. On the average, how much do you spend on water per day? GH¢……………… 24. How does this affect your household income?............................................................................ …………………………………………………………………………………………………….. F. WILLINGNESS TO PAY/ CONSUMER SATISFACTION 25. Are you satisfied with the water supply in the community? 1. Very satisfied 2. Satisfied 3. Not satisfied 4. Not very satisfied 26. In your opinion, do feel that the current water supply can be improved? Yes No 27. Are you willing to pay more for improved water delivery services in your community? Yes No G. TIME MANAGEMENT 28. Where is the water facility in the community located from your house? a. center of town b. outskirt of town c. other (specify)…………………….. 29. What will be the distance of the water source from your house?

University of Ghana http://ugspace.ug.edu.gh

118

a. 10.00m b. 20.00m c. 50.00m d. others (specify)………………….. 30. How long does it take a member of your household to fetch water from the water source? … .… (minutes) 31. Do you often experience water scarcity in the community? Yes No 32. If yes, when does this scarcity often occur? …………………………………………………................................................................................ ............................................................................................................................................................ 33. How do you get water in times like this? a. tankers services b. dugout wells c. streams d. others (specify)…………

University of Ghana http://ugspace.ug.edu.gh

119

APPENDIX 2

UNIVERSITY OF GHANA COLLEGE OF AGRICULTURE AND CONSUMER SCIENCES

DEPARTMENT OF EXTENSION QUESTIONNAIRE TO WATER BOARD MEMBERS ON WATER SUPPLY AND MANAGEMENT IN THE GA EAST MUNICIPALTY. INTRODUCTION: This Questionnaire seeks to elicit information on the running and management of rural water systems by Water Boards in the Ga East Municipality. The information provided is strictly for educational purposes, and it will be used as such. You are therefore assured of confidentiality of any information provided. Thank you for your understanding. A. WATER AND HEALTH IMPLICATIONS 1. Does the community experience any form of water borne disease? Yes No 2. If yes, what kind of disease(s) do you normally encounter? a. Bilharzia b. Guinea worm c. Typhoid d. Others (specify)………….. 3. Was this particular disease there before the water facility was provided? Yes No 4. In your opinion how has the provision of water facility affected the life of the people? 1. Better 2. Worse 3. No changed B. WATER MANAGEMENT 5. Is the water facility functioning well? Yes No 6. Who controls or manages the water facility? a. water board b. unit committee c. district assembly d . others (specify)………... 7. What is the representation of male – female ratio on the board / committee? Male (………) , Female (..........) 8. How often does the board meet? a. monthly b. quarterly c. once a while d. no meeting e. others (specify)………………… 9. Who repair the facility when it breaks down? (Tick all that apply) a. the board b. district assembly c. the community d. individuals e. others (specify)………............................... 10. From which source(s) do you maintain / repair the facility? a. revenue from water sale b. district assembly c. household levy

University of Ghana http://ugspace.ug.edu.gh

120

d. MP common fund e. other (specify)…………………………… 11. What is the average daily sale of water? GH ¢………………… 12. Is the board able to meet its operational cost at the current rate at which water is being sold? Yes No 13. If no, how do you offset your operational cost? …………………………………………… ………………………………………………………………………………………………… 14. Whom does the board account / report to?…………………………………………………….. C. CAPACITY BUILDING 15. Has the board been receiving any form of training, regarding its mandate? Yes No 16. If yes, what form of training have you been receiving? (Please list them) ……………………………………………………………………………………………………… ……………………………………………………………………………………………………… 17. Which organization(s) has been providing this kind of training to the board? (Please list them).................................................................................................................................................. ……………………………………………………………………………………………………... 18. How often do you receive this form of training? a. quarterly b. once in six month c. yearly d. once a while e. any other (Specify)…………………….............. 19. Has the board been running any form of training for the community members? Yes No 20. If yes, what kind of training does the board provide to the community? (Please list them)…………………………………………………………………………………………… D. CHALLENGES FACING THE BOARD 21. Rank the following challenges according to their order of importance in the way they affect the operations of the board. 1. Embezzlement of funds 2. Low tariff system 3. Frequent breakdown of facility 4. Lack of transparency 5. Improper accounting system 6. Irregular board meeting 7. Low patronage of the water facility 8. Interference 9. Lack of spare parts (add others)

University of Ghana http://ugspace.ug.edu.gh

GA EAST MUNICIPAL POPULATION MAP

Credit: GEMA

121

APPENDIX 3

GA EAST MUNICIPAL POPULATION MAP

University of Ghana http://ugspace.ug.edu.gh


Recommended