Page 1
ROMANIAN REVIEW OF REGIONAL STUDIES, Volume XI, Number 2, 2015
95
MANAGING THE OCCURRENCE OF NATURAL DISASTERS FOR
IMPROVED PUBLIC HEALTH AND SOCIAL ISSUES
MARIA IOANA VLAD ŞANDRU1, CORNELIU IAŢU
2
ABSTRACT – This paper provides a review of the past extreme weather events encountered in
Romania, threatening the physical and psychological health of millions of people, damaging economy,
infrastructure and communities, rendering different types of vulnerability. The impact of natural
disaster on health is felt globally at different degrees depending on the relief, and particularly on the
specific prone areas in each country. The fundamental objective of this work is to reveal a method for
estimating the existing vulnerabilities of the population, mainly by socio-demographic indicator
analyses, quantified by developing a Public Health Vulnerability Index (PHVI), for a future estimation
of the social susceptibility area to natural hazards. By means of a selected area of interest, which
highlights socio-demographic analysis in the field of public health, it is revealed the composition
followed by the processing method of a partial Public Health Vulnerability Index.
Keywords: natural disaster, Public Health Vulnerability Index, population, public health
INTRODUCTION
Diseases, natural disasters and human-induced hazards, including war and terrorism, are
always threats to human civilization, public health being continually stimulated and amplified by a
changing environment. In order to confront the challenging situation ahead, it is important to have a
clear understanding of the existing vulnerabilities near us, by a strong resistance released by covering
the gaps. A better understanding of disasters’ social impacts can provide a basis for primate prediction
and the development of possibility plans to prevent adverse consequences from happening (Lindell
and Prater, 2003).
A disaster is a result of a vast ecological breakdown in the relation between humans and their
environment, a serious or sudden event on such a scale that the stricken community needs
extraordinary efforts to cope with it, often with outside help or international aid (Noji, 1997).
According to the World Health Organization (WHO), a disaster is a sudden ecological phenomenon of
sufficient magnitude to require external assistance resulting “[...] after a serious disruption of the
functioning of society, causing widespread human, material or environmental losses which exceed the
ability of affected society to cope on its own resources” (United Nations Department of Humanitarian
Affairs, 2001). Disasters affect a community in numerous ways: roads, telephone lines, transportation
and communication lines are often destroyed. Portions of the community’s industrial or economic base
may be destroyed or damaged. Casualties may require medical care and damage to food sources and
utilities may create public health threats. Therefore, the multiple definitions on disaster identify as
common element, the unusual public health events that overwhelm the coping capacity of the affected
community, becoming aware that human health is profoundly affected by weather and climate.
Extreme weather events kill thousands of people every year, threatening the physical and
psychological health of millions. Droughts affect nutrition and the incidence of diseases associated
with malnutrition. Floods can induce outbreaks of infectious diseases and damage medical
infrastructure overrunning health services just when they are needed most.
1 PhD, Alexandru I. Cuza University, Faculty of Geography, Iaşi, Romania.
E-mail: [email protected] 2 Professor, PhD, Alexandru I. Cuza University, Faculty of Geography, 20 A Carol I Blvd., Iaşi, Romania.
E-mail: [email protected]
Page 2
MARIA IOANA VLAD ŞANDRU and CORNELIU IAŢU
96
The impact of natural disaster on health is felt globally at different degrees depending on the
relief, and particularly on the specific prone areas in each country. Public health gathers efforts to
protect and improve the health of communities as a whole, including the promotion of healthy
lifestyles, research into the promotion of injury and disease.
BACKGROUND
History has shown that weather and climate variability are important determinants of health
and well-being, this being sustained by several ancient examples, as the “biblical flood” scenario in
6000 B.C., the vast droughts in the Middle Ages, the severe drought in 1921 in the former Soviet
Union causing millions of deaths, the North Sea floods in 1953 causing thousands of deaths, the heat
wave in 2003 causing approximately 30,000 deaths (Kirch, Menne and Bertollini, 2005).
Natural disasters represent a major factor on the lives of people and communities and can
cause death, injury and significant financial damage. The public health impacts may be described as
direct (death from violence and injury) or indirect (increased rates of infectious diseases or
malnutrition). Direct damage is defined as the material losses measured in physical terms, including
material things that can be counted, such as hospital beds lost, damaged or affected health service
installations, pipes and water plants destroyed. The indirect health impact is related to factors such as
inadequate quantity and quality of water, breakdowns in sanitation, reduced access to health services
and deterioration of food security (Sphere, 2011).
“Health is a state of complete physical, mental and social well-being and not merely the
absence of disease or infirmity” (WHO, 1948). In addition, public health threats are described as: “[...]
new or newly emerging diseases, the accidental release or deliberate use of biological, chemical or
radio-nuclear agents, natural disasters, human-made disasters, complex emergencies, conflicts and
other events with a potentially catastrophic impact on human health” (WHO, 2012).
Following the definition of health, disasters are treated as a health condition or risk, which as
any other “disease” should be the subject of epidemiological analysis, control, prevention and
mitigation, rather than merely as an emergency medical or humanitarian matter.
Generally, a disaster affects a community being part of a social change and being considered a
social crisis that opens new perspectives. Vulnerability to all types of disasters - and to poverty - is
linked to demographic growth, rapid urbanization, settlement in unsafe areas, environmental
degradation, climate change, and unplanned development. Economic vulnerability plays a greater role
in assessing natural disaster occurrence, poverty representing the increase of vulnerability because of
the unequal opportunity for healthy and safe environments, poor education and risk awareness. Social
vulnerability represents the socioeconomic and demographic factors that affect the resilience of human
beings. One of the vulnerability indicators, population factor “[...] is an important indicator of
everything from evacuation compliance during an event to successful long-term recovery after one”
(Juntunen, 2005). Health outcomes are tightly influenced by social and economic factors and the
functioning of the healthcare systems, weak healthcare systems often amplifying disaster health
impacts.
The present article draws an analysis on the social vulnerabilities of the population, quantified
by developing a Public Health Vulnerability Index (PHVI). This research proves its usefulness in
assessing human wellbeing, considering the occurrence and impacts of natural hazards on public
health issues, victims often experiencing a decrease in the quality of life after the disaster stroke.
Located in the Central – East European region, Romania is affected by several natural
disasters, especially floods. In the last 20 years, Romania has been confronted with serious and
intensive natural phenomena, which determined several deaths, damage to economy, infrastructure and
communities, rendering different types of vulnerability, including the psychology and behaviour of
individuals, the environmental and socio-economic conditions of population and the coverage and
effectiveness of health programmer. An overview of the natural disaster occurrence between 1991 and
2010 is presented in Figure 1.
Page 3
MANAGING THE OCCURRENCE OF NATURAL DISASTERS FOR IMPROVED PUBLIC HEALTH
AND SOCIAL ISSUES
97
2 3
17
39
9
0
5
10
15
20
25
30
35
40
Drought
Earthquake
Extreme temperatureFlood
Storm
Figure 1. Natural disasters in Romania (1991-2010) Source: EM-DAT - The OFDA/CRED International Disaster Database
According to The International Disaster Database, between 1980 and 2010, a large scale of
natural hazards such as droughts, earthquakes, extreme temperatures, floods, and storms was reported.
Among all reported natural disasters, the most frequent were floods, manifested locally or only in
limited regions, which affected and killed the highest number of people.
0
20
40
60
80
100
120
140
Floo
d
Floo
d
Floo
d
Floo
d
Floo
d
Floo
d
Floo
d
Floo
d
Floo
d
Floo
d
1997 2000 2005 2006 1991 2005 2004 2004 2010 1998
0
20
40
60
80
100
120
Flood
Ext
rem
e te
mp.
Ext
rem
e te
mp.
Ext
rem
e te
mp.
Ext
rem
e te
mp.
Ext
rem
e te
mp.
Flood
Flood
Flood
Ext
rem
e te
mp.
1991 2006 1998 2010 2009 2007 2005 1998 2006 2007
no
.of
peo
ple
kille
d
Figure 2. No. of people affected by floods Figure 3. No. of people killed during natural
disasters Source: EM-DAT - The OFDA/CRED International Disaster Database
Among all the above-mentioned natural hazards, major floods occurred in 2005, 2006, 2008,
and 2010, the worst ones in more than 40 years, have affected large regions of Romania: e.g. in Timiş
County (April 2005) over 1,300 homes were damaged or destroyed, 3,800 people were evacuated and
about 30,000 hectare of agricultural land flooded; in five counties located in eastern Romania (July
2005), 11,000 homes were flooded, 8,600 people were evacuated, 20 people were killed, 53,000
hectares farmland flooded, 379 bridges damaged or destroyed; in 12 counties along the Danube (April
2006), 3,077 homes were affected (1,049 completely destroyed), 16,000 people evacuated, 5 people
killed, 144,000 hectares of land flooded; in six counties located in north-eastern Romania (July 2008),
3,985 houses were affected (over 300 totally destroyed), 15,834 people evacuated and 35,084 hectares
of agricultural land flooded. At the end of June 2010, heavy rainfalls caused severe floods and flash
floods in the Prut and the Siret catchment areas (East and North-East of Romania). More than 20
people were killed and hundreds were evacuated. Several roads and thousands of hectares of farmland
were flooded (Stăncălie et al., 2012).
Page 4
MARIA IOANA VLAD ŞANDRU and CORNELIU IAŢU
98
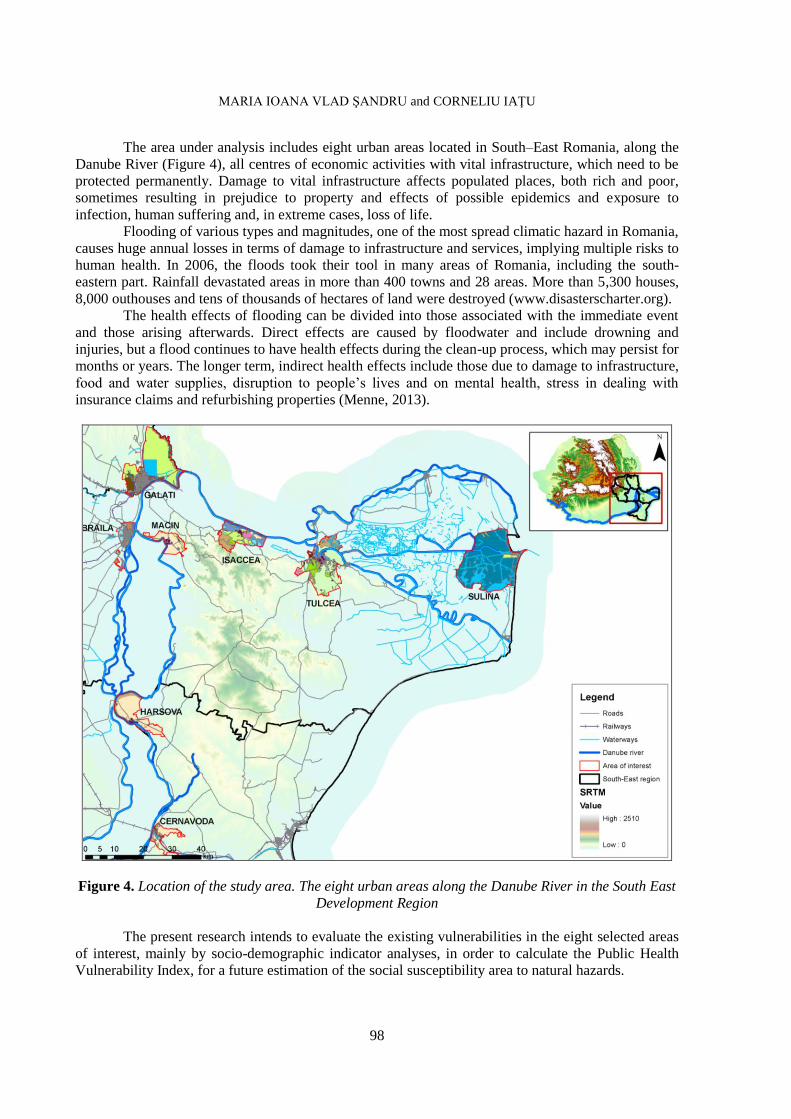
The area under analysis includes eight urban areas located in South–East Romania, along the
Danube River (Figure 4), all centres of economic activities with vital infrastructure, which need to be
protected permanently. Damage to vital infrastructure affects populated places, both rich and poor,
sometimes resulting in prejudice to property and effects of possible epidemics and exposure to
infection, human suffering and, in extreme cases, loss of life.
Flooding of various types and magnitudes, one of the most spread climatic hazard in Romania,
causes huge annual losses in terms of damage to infrastructure and services, implying multiple risks to
human health. In 2006, the floods took their tool in many areas of Romania, including the south-
eastern part. Rainfall devastated areas in more than 400 towns and 28 areas. More than 5,300 houses,
8,000 outhouses and tens of thousands of hectares of land were destroyed (www.disasterscharter.org).
The health effects of flooding can be divided into those associated with the immediate event
and those arising afterwards. Direct effects are caused by floodwater and include drowning and
injuries, but a flood continues to have health effects during the clean-up process, which may persist for
months or years. The longer term, indirect health effects include those due to damage to infrastructure,
food and water supplies, disruption to people’s lives and on mental health, stress in dealing with
insurance claims and refurbishing properties (Menne, 2013).
Figure 4. Location of the study area. The eight urban areas along the Danube River in the South East
Development Region
The present research intends to evaluate the existing vulnerabilities in the eight selected areas
of interest, mainly by socio-demographic indicator analyses, in order to calculate the Public Health
Vulnerability Index, for a future estimation of the social susceptibility area to natural hazards.
Page 5
MANAGING THE OCCURRENCE OF NATURAL DISASTERS FOR IMPROVED PUBLIC HEALTH
AND SOCIAL ISSUES
99
DATA AND METHODS
One of the most important goals when developing tools for measuring vulnerability is to help
bridge the gap (Birkmann, 2007) between the theoretical concepts of vulnerability and day-to-day
decision making considering vulnerability a process. More transparency and more information on the
most public health vulnerable areas are needed for risk and vulnerability reduction and for offering a
global disaster response for the community being aware on whom to target first, before or during a
disaster situation.
Indicators may be aggregates of raw and processed data, but they can be further aggregated to
form complex indices, quantifying and simplifying phenomena to help us understand complex
situations. The synthetic indicators have, as a main function, the concentration of information in just
one variable, allowing for comparison of elements, areas and units at spatial levels. One general
example is the United Nation’s Human Development Index (HDI), created to measure the level of
human development in different countries, using education, income, and life expectancy as indicators
(Confalonieri et al., 2009). As for a particular example, Quality of Urban Life Index, made from six
parameters, was figured out through Quality of Life Urban Audit method, comparing the standard of
living in the Romanian South-East Development Region, based on quantitative data obtained from
statistics (Vlad Şandru, 2013).
The intention is to present a research conducted on this theme, design a model of how the
natural hazard events can be confronted starting from the point of an already existing frame of social
vulnerabilities. The analyses are covered by qualitative research, providing detailed description of
social settings investigated, viewing social life as process rather than static, testing theories and
concepts along with data collection.
The indices that form the basis of the PHVI are partly sub-indices restored by social
vulnerability, health infrastructure, epidemiology, and environmental vulnerability indices.
To examine the public health vulnerability, there were collected demographic, socioeconomic,
and environmental data for eight urban areas located on the banks of the Danube River. Using census
data, specific variables were collected featuring the broader dimensions of social, epidemiologic,
health infrastructure, and environmental vulnerability. Originally, more than 40 variables were
collected, but after the normalization of data (to percentages, per capita, or density functions), 18
independent variables were used in the statistical analyses. An index was developed for each
dimension (social, health infrastructure, epidemiologic, and environmental), analyzed in the present
study. The Social Vulnerability Index was developed for the quantification of a socio-demographic
image of the residential population, using “sensitive” indicators, able to sustain a vulnerability
diagnosis.
Cutter et al. (2003, p. 251) identified children and the elderly as the demographic groups most
affected by environmental disasters. Martin et al. (2006) found that half of emergency medical
programs are adequately prepared to deal with the special needs of children, the research of Madrid et
al. (2006) revealing that following a life-changing event, mental and emotional support is essential for
children. Children cannot protect themselves during a disaster because they do not dispose of the
knowledge or life experiences to cope with the situation. The elderly are prone to have less necessary
physical and economic resources to impact an emergency, considering that they are liable to suffer
more health-related consequences and they are slower to recover physically from their injuries.
Children are typically defined as 14 years of age and younger, adults being defined as 65 years of age
and older.
The Health Infrastructure Index was constructed from hospitals in the area, number of
doctors/100,000 residents, number of hospital beds/100,000 residents. The Epidemiology
Vulnerability Index was developed from mortality and morbidity rates, while the Environmental
Vulnerability Index consists of the distribution of land use classes in each studied area.
Page 6
MARIA IOANA VLAD ŞANDRU and CORNELIU IAŢU
100
APPLICATION
The Dashboard of Sustainability
is a free, non-commercial software
package that illustrates the complex
relationships among different indicators
that can be quantified such as economic,
social, environmental issues (Figure 5).
It was developed in 2002 by the
Consultative Group on Sustainable
Development Indicators, an International
team of measurement experts,
coordinated by the International Institute
for Sustainable Development. The
Dashboard project is part of the
sustainability indicator initiative of the
Bellagio Forum for Sustainable Development, one of the main funders of the work. It can be
considered an online tool designed to be understood by experts, the media, policy-makers, and the
general public. The complexity of decision-making in the 21st century needs more adequate decision
support tools. Using the metaphor of a vehicle instrument panel, it displays country specific
assessments of economic, environmental, social, and institutional performance toward sustainability.
The Dashboard presents sets of indicators based on three principles:
the size of a segment reflects the relative importance of the issue described by the indicator;
a colour code signals performance relative to others: green means “good”, red means “very
bad”;
the PPI (Policy Performance Index) summarizes the information of the component indicators.
In order to highlight the vulnerability to public health by each indicator, it was chosen the
value that contributes to Public Health Vulnerability Index, which consists in the best result: for
example, the minimum value of morbidity rate is considered the best result, while the maximum value
of the indicator, number of hospitals in the city is considered to have the best performance. In the
process of accomplishing this method, not all needed data was available for the entire urban area; in
this case, the program divides the points for the available indicators by their number. Each analyzed
unit indicator is automatically ordered on the range 0 – 1000; 0 points go to the indicator with the
lowest value (e.g. the highest value of morbidity rate), while the maximum goes to the indicator with
the highest value (e.g. the lowest morbidity rate). The accounts made through this method are based on
this formula:
P = 1000*(x-min)/(max-min), where:
P = points awarded;
X = value of the analyzed unit;
Min = the value considered the worst;
Max = the value considered to be the best.
Public Health Vulnerability Index is figured out based on the total score obtained, its colour
resulting from the city position in the database. Given its position in the quality of life rank, the South-
East Danube river cities receive a colour code for each indicator, as follows:
Dark green is an excellent performance of a public health indicator;
Yellow has an average relevance for public health, in terms of development;
Dark red denotes a very bad public health standard;
Purple is the colour which indicates the lack of data.
The dimensions used for aggregating the Public Health Vulnerability Index are the following:
Social Vulnerability Index (SVI), Health Infrastructure Index (HII), Environmental Index (EVI),
Epidemiology Vulnerability Index (EpVI).
Figure 5. Dashboard of Sustainability design
Page 7
MANAGING THE OCCURRENCE OF NATURAL DISASTERS FOR IMPROVED PUBLIC HEALTH
AND SOCIAL ISSUES
101
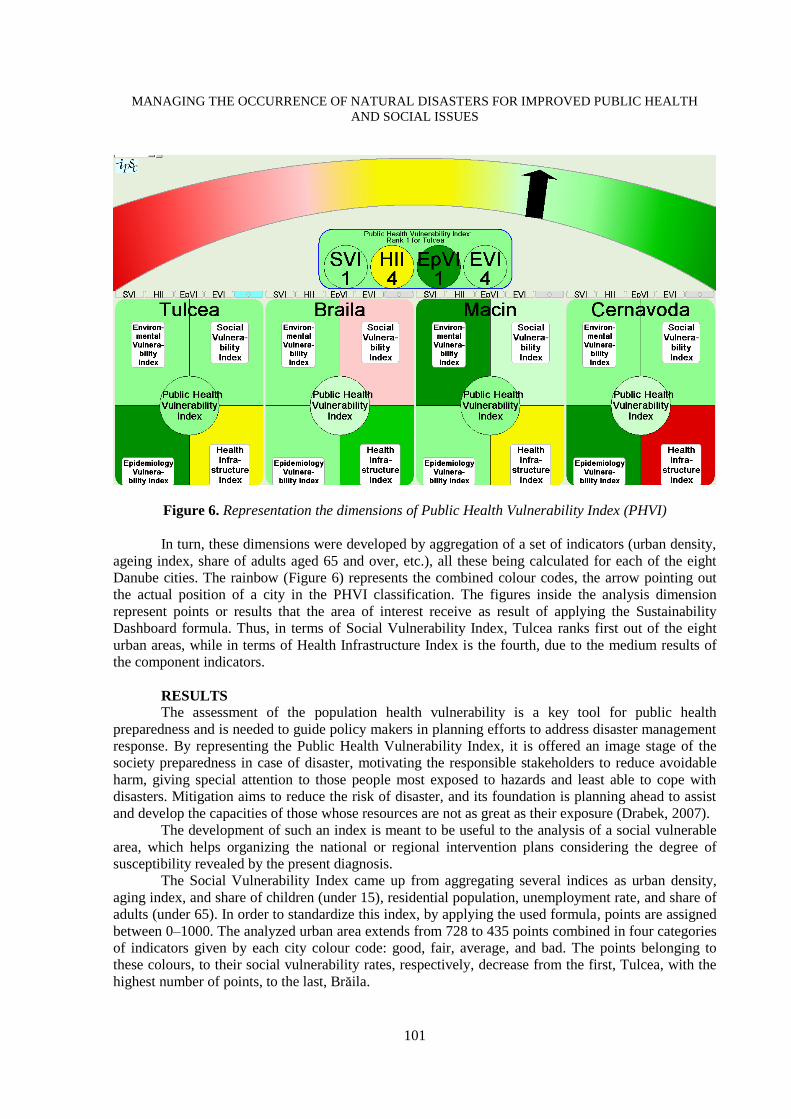
Figure 6. Representation the dimensions of Public Health Vulnerability Index (PHVI)
In turn, these dimensions were developed by aggregation of a set of indicators (urban density,
ageing index, share of adults aged 65 and over, etc.), all these being calculated for each of the eight
Danube cities. The rainbow (Figure 6) represents the combined colour codes, the arrow pointing out
the actual position of a city in the PHVI classification. The figures inside the analysis dimension
represent points or results that the area of interest receive as result of applying the Sustainability
Dashboard formula. Thus, in terms of Social Vulnerability Index, Tulcea ranks first out of the eight
urban areas, while in terms of Health Infrastructure Index is the fourth, due to the medium results of
the component indicators.
RESULTS
The assessment of the population health vulnerability is a key tool for public health
preparedness and is needed to guide policy makers in planning efforts to address disaster management
response. By representing the Public Health Vulnerability Index, it is offered an image stage of the
society preparedness in case of disaster, motivating the responsible stakeholders to reduce avoidable
harm, giving special attention to those people most exposed to hazards and least able to cope with
disasters. Mitigation aims to reduce the risk of disaster, and its foundation is planning ahead to assist
and develop the capacities of those whose resources are not as great as their exposure (Drabek, 2007).
The development of such an index is meant to be useful to the analysis of a social vulnerable
area, which helps organizing the national or regional intervention plans considering the degree of
susceptibility revealed by the present diagnosis.
The Social Vulnerability Index came up from aggregating several indices as urban density,
aging index, and share of children (under 15), residential population, unemployment rate, and share of
adults (under 65). In order to standardize this index, by applying the used formula, points are assigned
between 0–1000. The analyzed urban area extends from 728 to 435 points combined in four categories
of indicators given by each city colour code: good, fair, average, and bad. The points belonging to
these colours, to their social vulnerability rates, respectively, decrease from the first, Tulcea, with the
highest number of points, to the last, Brăila.
Page 8
MARIA IOANA VLAD ŞANDRU and CORNELIU IAŢU
102
0
100
200
300
400
500
600
700
800
Tulcea Cernavodă Galaţi Isaccea Sulina Măcin Hârşova Brăila
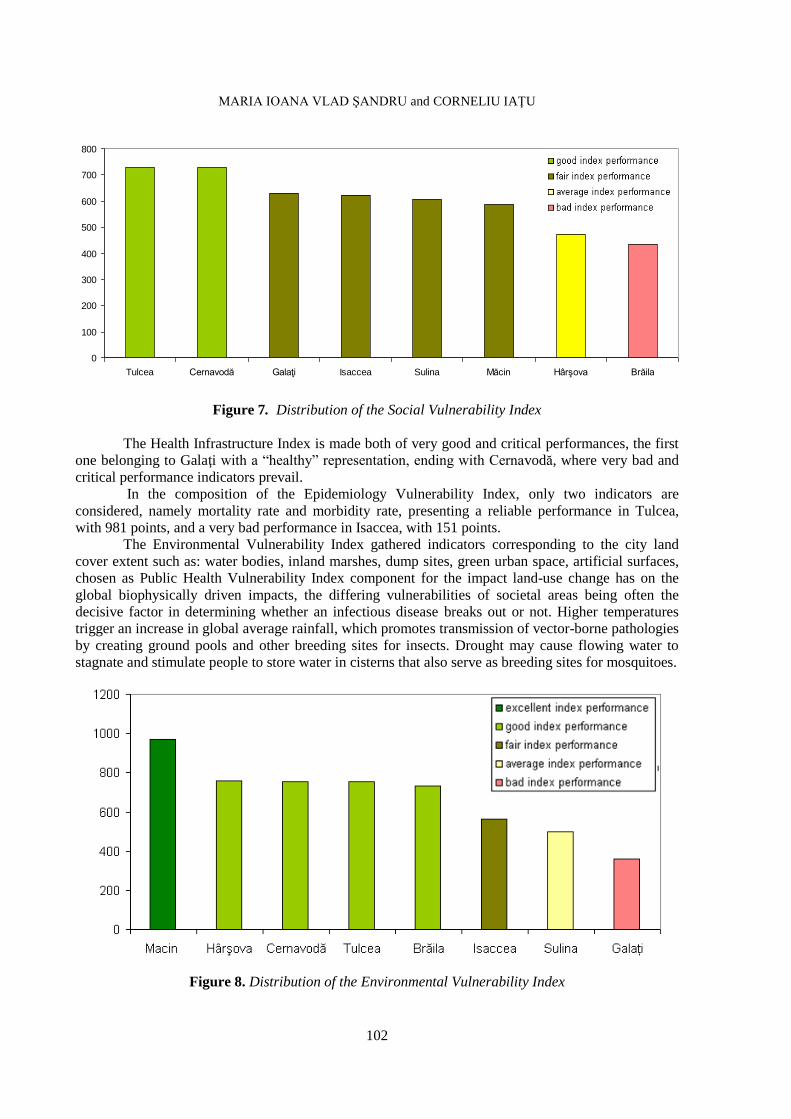
Figure 7. Distribution of the Social Vulnerability Index
The Health Infrastructure Index is made both of very good and critical performances, the first
one belonging to Galaţi with a “healthy” representation, ending with Cernavodă, where very bad and
critical performance indicators prevail.
In the composition of the Epidemiology Vulnerability Index, only two indicators are
considered, namely mortality rate and morbidity rate, presenting a reliable performance in Tulcea,
with 981 points, and a very bad performance in Isaccea, with 151 points.
The Environmental Vulnerability Index gathered indicators corresponding to the city land
cover extent such as: water bodies, inland marshes, dump sites, green urban space, artificial surfaces,
chosen as Public Health Vulnerability Index component for the impact land-use change has on the
global biophysically driven impacts, the differing vulnerabilities of societal areas being often the
decisive factor in determining whether an infectious disease breaks out or not. Higher temperatures
trigger an increase in global average rainfall, which promotes transmission of vector-borne pathologies
by creating ground pools and other breeding sites for insects. Drought may cause flowing water to
stagnate and stimulate people to store water in cisterns that also serve as breeding sites for mosquitoes.
Figure 8. Distribution of the Environmental Vulnerability Index
Page 9
MANAGING THE OCCURRENCE OF NATURAL DISASTERS FOR IMPROVED PUBLIC HEALTH
AND SOCIAL ISSUES
103
In this case, Măcin has a proper environmental vulnerability, corresponding to an excellent
performance index, due to the small distribution of water bodies and the increased surfaces of green
urban space, the last ones considered an advantage in pursuing Public Health Vulnerability Index. On
the other side, Galaţi has a bad performance for the high extension of water bodies and a tolerable
distribution of the green urban space, considering 28 square meters of green urban space per person in
Galaţi; thus, according to the European Union standards regarding the disposition of green urban space
in a city, this area overreaches the value of 26 square meters per person (Vlad and Brătăşanu, 2011).
The Public Health Vulnerability Index resulted from the aggregation of the four detailed
partial indices by multiplying performance points and weighting coefficients following the schema
below (Figure 9). Therefore, the analyzed areas receive between 728 and 368 points compiled in three
categories of performance, decreasing from a good performance to a bad one.
Figure 9. Public Health Vulnerability Index workflow steps
Tulcea, Galaţi, and Măcin obtained a good performance category, leaded by Tulcea with the
highest PHVI among all the analyzed areas, holding 728 points from indices with average
performance regarding the Health Infrastructure Index, a good performance regarding Environmental
Vulnerability Index and Social Vulnerability Index and an excellent performance concerning
Epidemiology Vulnerability Index.
In terms of the aggregated vulnerability index, Isaccea ranks last (Figure 10), with a bad index
performance, generated by two fair partial indices, Environmental Vulnerability Index and Social
Index, the other two being constrained by a very bad performance, considering a high mortality
(12.7‰) and morbidity (21.3‰) rate and the existence of a poor health infrastructure.
For the implementation of the PHVI presented in this research, only demographic and health
statistical data were used, coming from the locality datasheet reports, gathered at local level, based on
a qualitative analysis, which reproduced a partial index, rendering, more or less, a concrete image of
today’s public health vulnerabilities charged by possible natural hazard events.
Page 10
MARIA IOANA VLAD ŞANDRU and CORNELIU IAŢU
104
Figure 10. Distribution of the Public Health Vulnerability Index
CONCLUSIONS
Currently, there are more possible combinations of data integration in performing an aggregate
exposure and risk assessment, which can represent the basis for a future strategy in implementing an
absolute health index. In-situ, ex-situ data and satellite image parameters could be represented
associated with the statistical data aggregation analysis, all amount of data contributing in the process
of making different datasets compatible with each other, so that they can be reasonably displayed on
the same map or in the same profile and so that their relationships can be sensibly analyzed.
The timing of public health responses to natural disasters is critical. Often a very rapid
response can reduce the number of deaths and minimize the number and severity of illness and injury.
Developing and emphasizing a Pre-Disaster Mitigation Health Program as a way of promoting the
recognition of community vulnerabilities before a disaster encounter, could be considered a success
into strategies for public awareness of natural hazard and promotion of economic development
consistent with natural hazard guidelines. Public health preparedness has been defined by Christopher
Nelson as “[...] the capability of the public health and health care systems, communities, and
individuals, to prevent, protect against, quickly respond to, and recover from health emergencies,
particularly those whose scale, timing, or unpredictability threatens to overwhelm routine capabilities”
(Nelson, 2007). The public health assessment planners must work together with those responsible for
disaster management – such as General Inspectorate for Emergency Response – mediating a common
emergency planning and response, which includes protecting life and health, respecting human rights,
promoting social justice, and building civic capacity so that communities will be resilient in their
response and recovery from disasters.
ACKNOWLEDGEMENTS
This work was supported by the strategic grant POSDRU/159/1.5/S/133391, Project
“Doctoral and Post-doctoral programs of excellence for highly qualified human resources training for
research in the field of Life sciences, Environment and Earth Science”, co-financed by the European
Social Fund within the Sectorial Operational Program Human Resources Development 2007 – 2013.
Page 11
MANAGING THE OCCURRENCE OF NATURAL DISASTERS FOR IMPROVED PUBLIC HEALTH
AND SOCIAL ISSUES
105
REFERENCES
ADINHU, A. (2006), Combine Quantitative and Qualitative Methods and Enhance Potency of
Health Research, Journal of Medical and Pharmaceutical Sciences, vol. 2, no. 3, pp. 29-35.
BIRKMANN, J. (2007), Risk and Vulnerability Indicators at Different Scales: Applicability,
Usefulness and Policy Implication, Environmental Hazards, vol. 7, pp. 20-31.
CONFALONIERI, U., MARINHO, D., RODRIGUEZ, R. (2009), Public Health Vulnerability to
Climate Change in Brazil, Climate Research, vol. 40, pp. 175-186.
CUTTER, S., BORUFF, B., SHIRLEY, L. (2003), Social Vulnerability to Environmental Hazards,
Social Science Quarterly, vol. 48, no. 2, Southwestern Social Science Association, pp. 242-
261.
DRABEK, T., HOETMER, G. (2007), Emergency Management: Principles and Practice for Local
Government, Chapter 13. Identifying and Addressing Social Vulnerabilities, ICMA Press,
USA.
LINDELL, M., PRATER, C. (2003), Assessing Community Impacts of Natural Disasters, Natural
Hazards Review, vol. 4, no. 176, pp. 1527-6988.
KIRCH, W., MENNE, B., BERTOLLINI, R., (2005), Extreme Weather Events and Public Health
Responses, World Health Organization Regional Office for Europe.
JUNTUNEN, L. (2005), Addressing Social Vulnerability to Hazards, Disaster Safety Review, vol. 4,
no. 2, pp. 3-10.
MADRID, P. A., GRANT, R., REILLY, M. J., REDLENER, N. B. (2006), Challenges in Meeting
Immediate Emotional Needs: Short-Term Impact of a Major Disaster on Children’s Mental
Health: Building Resiliency in the Aftermath of Hurricane Katrina, Pediatrics, vol. 117, no. 5,
pp. S448–S453.
MARTIN, S. D., BUSH, A. C., LYNCH, D. A. (2006), A National Survey of Terrorism Preparedness
Training among Pediatric, Family Practice, and Emergency Medicine Programs, Pediatrics,
vol. 118, no. 3, pp. 620-626.
MENNE, B., MURRAY, V. (2013), Floods in WHO European Region: Health Effects and their
Prevention, WHO, Denmark.
NELSON, C., LURIE, N., WASSERMANN, J., ZAKOWSKI, S. (2007), Conceptualizing and
Defining Public Health Emergency Preparedness, American Journal of Public Health, 97
(Suppl. 1), April 2007, pp. S9-S11.
NOJI, E. (1997), The Public Health Consequences of Disasters, Oxford University Press.
SPHERE PROJECT (2011), Humanitarian Charter and Minimum Standards in Humanitarian
Response, Hampshire, United Kingdom.
STĂNCĂLIE, G., CRĂCIUNESCU, V., NEDELCU, I., IRIMESCU, A. (2012), Satellite Based
Service for Flood Monitoring in Romania, oral presentation at the Annual Scientific Session,
National Meteorological Administration, 10 – 11 November 2012, Bucharest.
UNITED NATIONS DEPARTMENT OF HUMANITARIAN AFFAIRS (UNDHA) (2001),
Internationally Agreed Glossary of Basic Terms Related to Disaster Management, United
Nations International Strategy for Disaster Reduction. Available from: http://www.unisdr.org/
unisdr/glossaire.htm.
VLAD, MARIA IOANA, BRĂTĂŞANU, D. (2011), Quality of Life Assessment based on Spatial and
Temporal Analysis of the Vegetation Area Derived from Satellite Images, Romanian Review
of Regional Studies, vol. VII, no. 2, pp. 111-120.
VLAD ŞANDRU, MARIA IOANA (2013), Quality of Life Audit in the Urban Areas of the Romanian
South-East Development Region, Studia UBB Geographia, vol. LVIII, no. 2, pp. 121-130.
WORLD HEALTH ORGANIZATION (1946), Preamble to the Constitution of the World Health
Organization, New York, 19 – 22 June.
Page 12
MARIA IOANA VLAD ŞANDRU and CORNELIU IAŢU
106
WORLD HEALTH ORGANIZATION (2012), Toolkit for Assessing Health-System Capacity for
Crisis Management, Part 1, User Manual, European Commission, Directorate General for
Health and Consumers (DG SANCO).