MANAGING WATER RESOURCES IN AGRICULTURE: OPPORTUNITIES FROM EARTH OBSERVATION OPPORTUNITIES FROM EARTH OBSERVATION GIRIRAJ AMARNATH Contributors: Bharat Sharma, Vladimir Smakhtin, Ameer Rajah, Niranga Alahacoon, Paul Pavelic International Water Management Institute (IWMI) India Geospatial Forum, Hyderabad Convention Centre. 6 February 2013 www.iwmi.org Water for a food-secure world
Transcript
MANAGING WATER RESOURCES IN AGRICULTURE: OPPORTUNITIES FROM EARTH OBSERVATIONOPPORTUNITIES FROM EARTH OBSERVATION
GIRIRAJ AMARNATHGIRIRAJ AMARNATH
Contributors: Bharat Sharma, Vladimir Smakhtin, Ameer Rajah, Niranga Alahacoon, Paul Pavelic
International Water Management Institute (IWMI)
India Geospatial Forum, Hyderabad Convention Centre. 6 February 2013
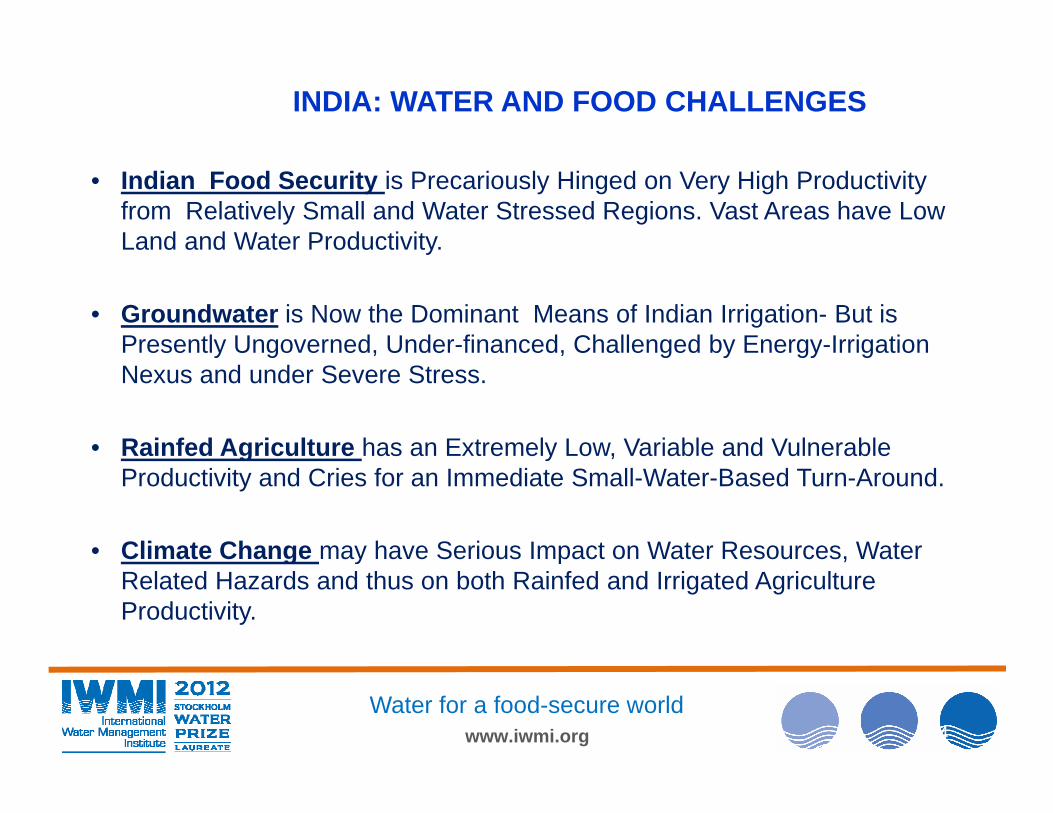
• Indian Food Security is Precariously Hinged on Very High Productivity from Relatively Small and Water Stressed Regions. Vast Areas have Low Land and Water Productivity.Land and Water Productivity.
• Groundwater is Now the Dominant Means of Indian Irrigation- But is Presently Ungoverned, Under-financed, Challenged by Energy-Irrigation Presently Ungoverned, Under-financed, Challenged by Energy-Irrigation Nexus and under Severe Stress.
• Rainfed Agriculture has an Extremely Low, Variable and Vulnerable • Rainfed Agriculture has an Extremely Low, Variable and Vulnerable Productivity and Cries for an Immediate Small-Water-Based Turn-Around.
• Climate Change may have Serious Impact on Water Resources, Water • Climate Change may have Serious Impact on Water Resources, Water Related Hazards and thus on both Rainfed and Irrigated Agriculture Productivity.
VARIABILITY MANAGEMENT MUST RECEIVE MUCH MORE SCIENCE, POLICY AND INVESTMENT ATTENTION
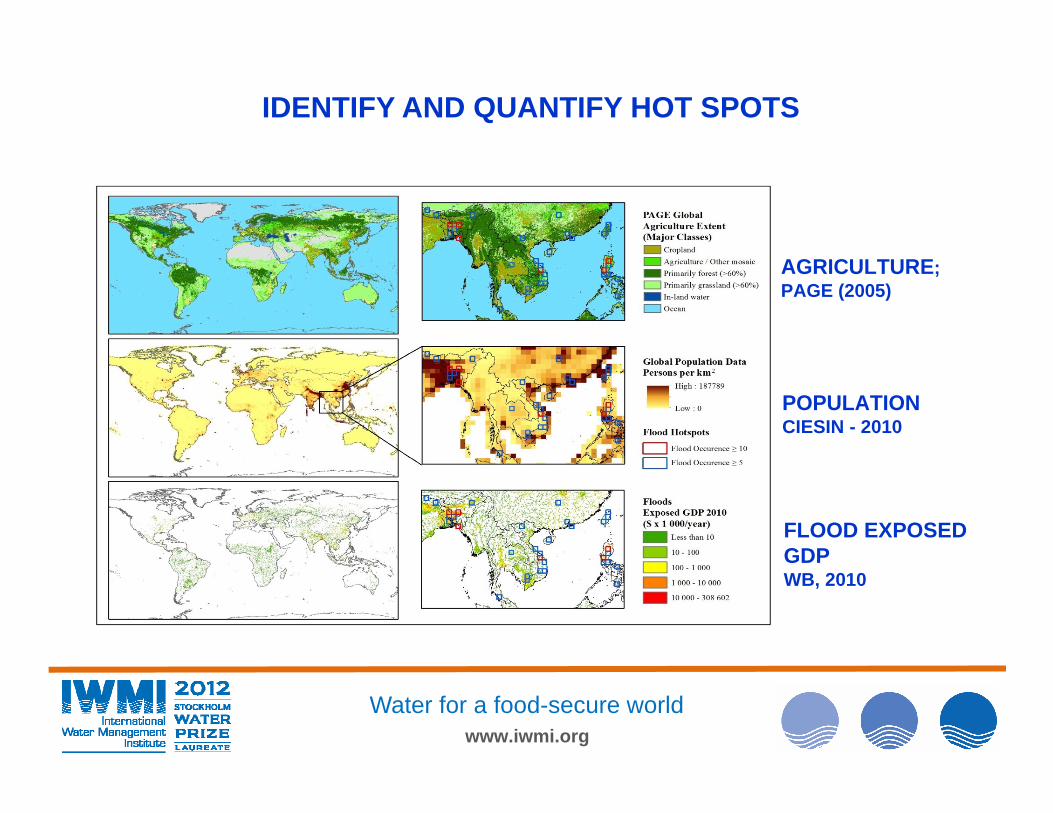
• Better quantification of variability hot spots, risks and extent• Better quantification of variability hot spots, risks and extent
• Harnessing satellite data in managing variability and improving agriculture-water managementimproving agriculture-water management
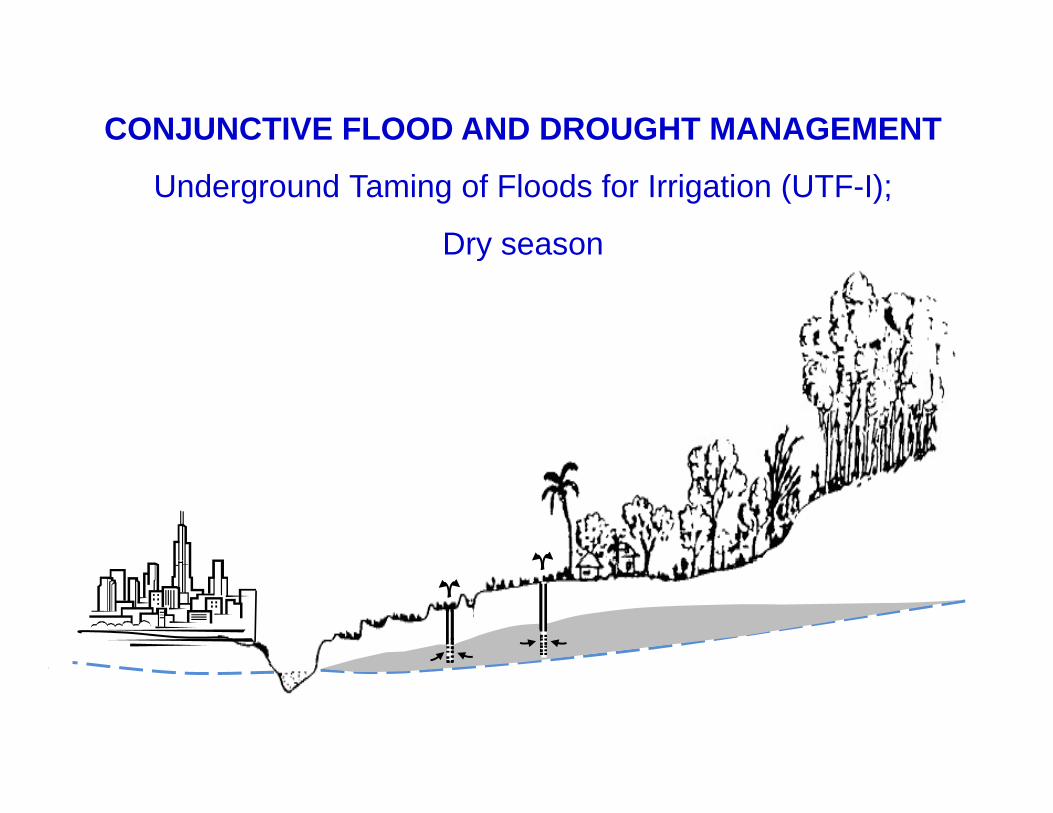
• Conjunctive management of floods and droughts in river • Conjunctive management of floods and droughts in river basins through subsurface solutions (vs. just surface ones)
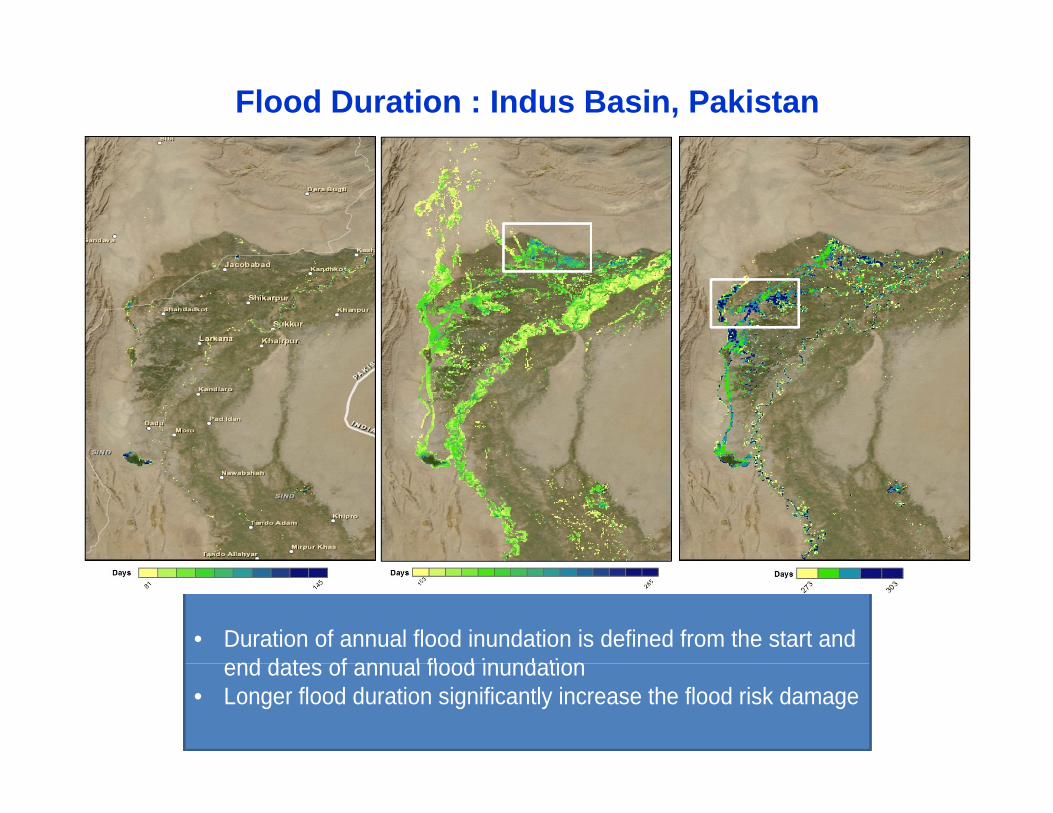
• Duration of annual flood inundation is defined from the start and end dates of annual flood inundationend dates of annual flood inundation
• Longer flood duration significantly increase the flood risk damage
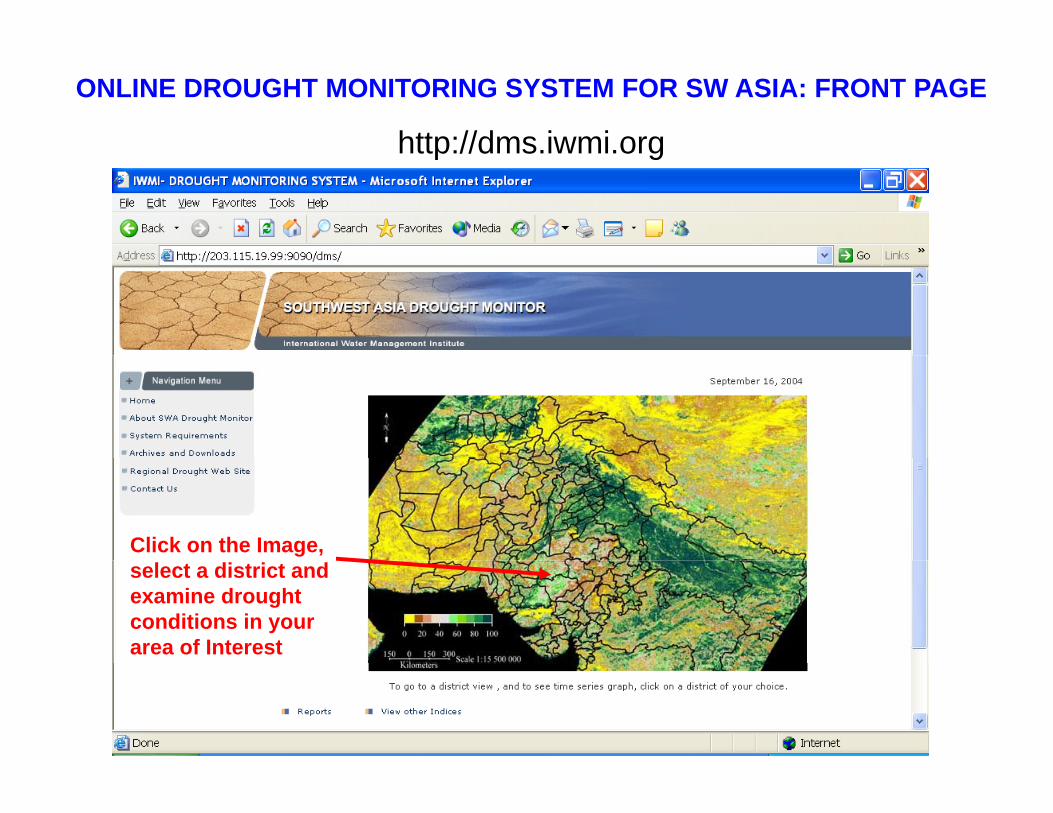
ONLINE DROUGHT MONITORING SYSTEM FOR SW ASIA: FRONT PAGE
http://dms.iwmi.orghttp://dms.iwmi.org
Phot
o: D
avid
Bra
zier
/IW
MI
Phot
o :T
om v
an C
aken
berg
he/I
WM
I
Click on the Image, select a district and
Phot
o: D
avid
Bra
zier
/IW
MI
Phot
o :T
om v
an C
aken
berg
he/I
WM
IPh
oto
: Dav
id B
razi
er/I
WM
IPh
oto:
Dav
id B
razi
er/I
WM
I
select a district and examine drought conditions in your area of Interest
Phot
o : D
avid
Bra
zier
/IW
MI
Phot
o: D
avid
Bra
zier
/IW
MI
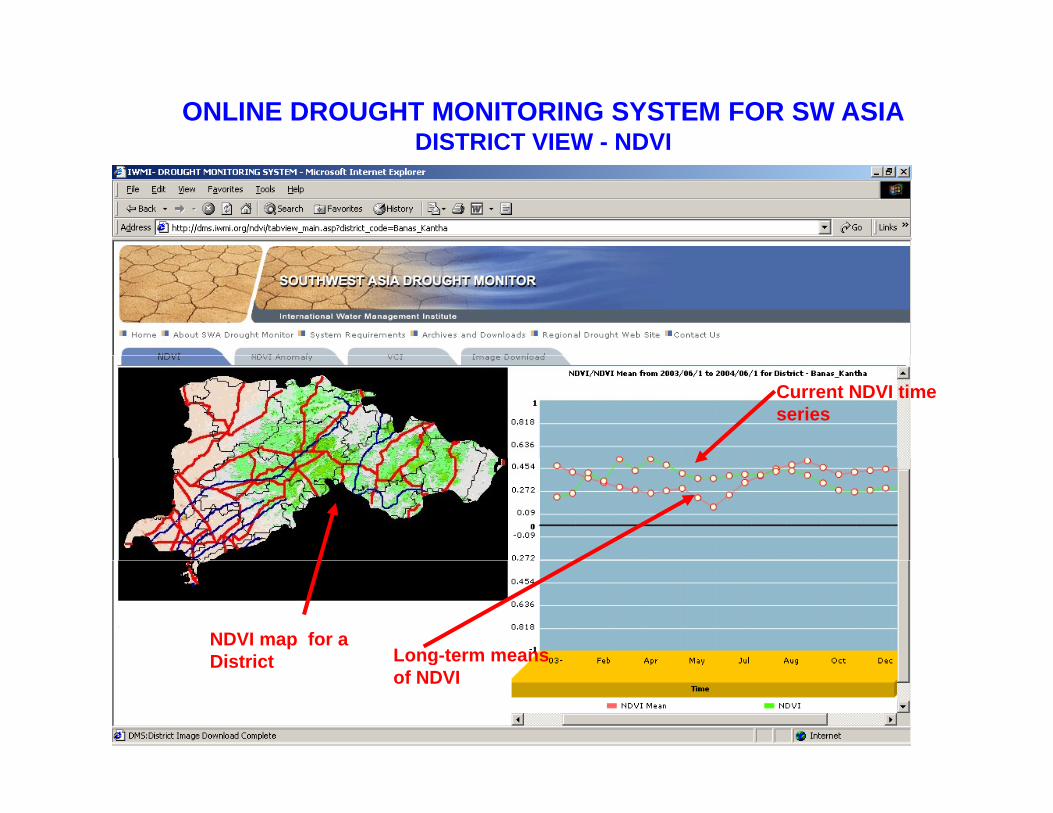
ONLINE DROUGHT MONITORING SYSTEM FOR SW ASIADISTRICT VIEW - NDVIDISTRICT VIEW - NDVI
Current NDVI time series
NDVI map for a District Long-term means District Long-term means
of NDVI
Harnessing the power of satellite data in Flood Harnessing the power of satellite data in Flood Irrigation Mapping & Modeling (Eastern Sudan)Canal Uptake and Sorghum flowering in Gash Delta, Sudan
Raw DMC satellite data for 21-11-2012 (L), and derived daily evapotranspiration (M) and biomass production (R).evapotranspiration (M) and biomass production (R).
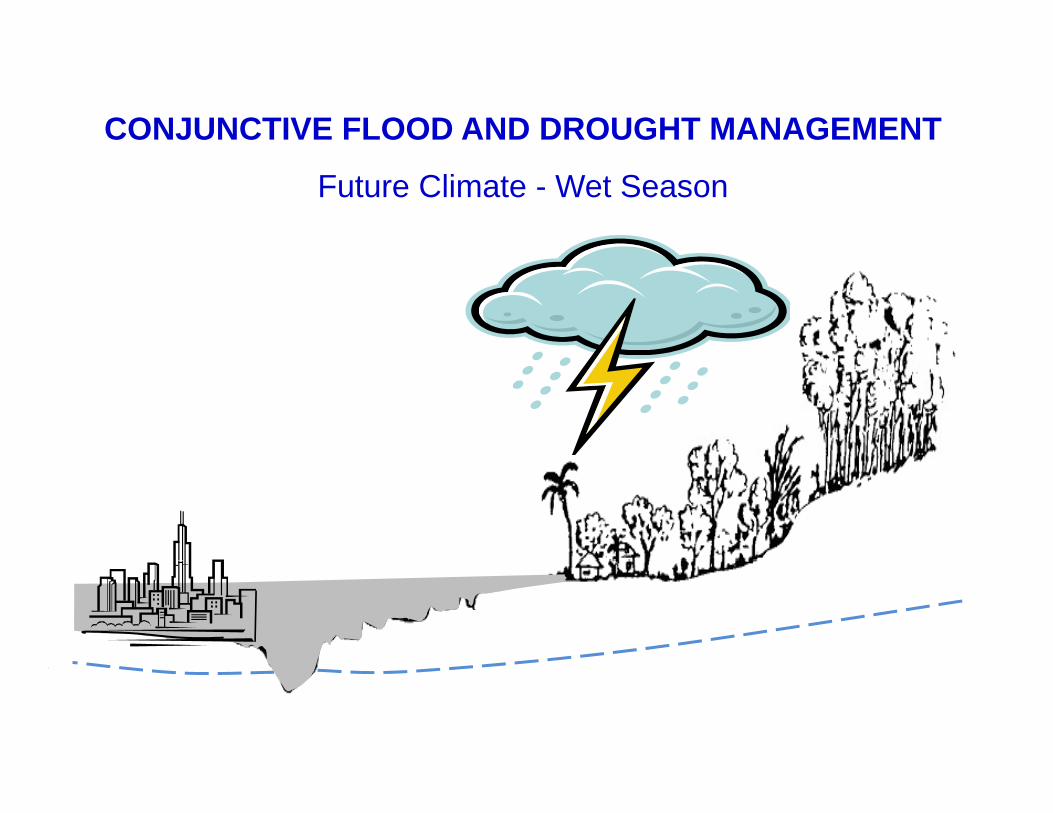
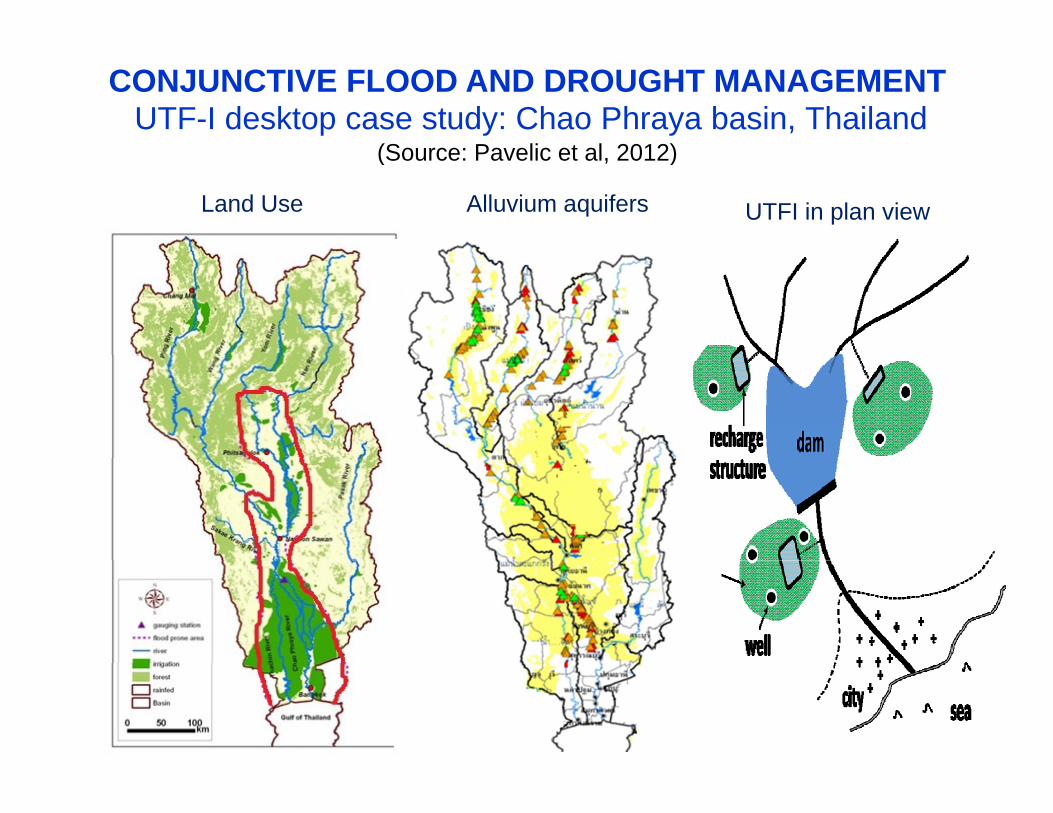
CONJUNCTIVE FLOOD AND DROUGHT MANAGEMENTUTF-I desktop case study: Chao Phraya basin, Thailand
(Source: Pavelic et al, 2012)(Source: Pavelic et al, 2012)
Land Use UTFI in plan viewAlluvium aquifers
KEEPING VARIABILITY ?KEEPING VARIABILITY ?
• Variability has positive effects too, e.g. the range of high • Variability has positive effects too, e.g. the range of high and low flows, their proper timing and frequency is needed to ensure a healthy riverto ensure a healthy river
• The challenge is to alleviate negative aspects of variability, while maintaining its positive sidewhile maintaining its positive side