51
ŌTAKI TO NORTH OF LEVIN PFRs Report 2: Manakau Settlement Project Feasibility Report Prepared for NZ Transport Agency February 2013

ŌTAKI TO NORTH OF LEVIN PFRs
Report 2: Manakau Settlement Project Feasibility Report
Prepared for NZ Transport Agency February 2013

Report 2: Manakau Settlement
Status: Final February 2013 Project number: 80500902 Our ref: PFR02 Manakau Settlement Final.docx

Report 2: Manakau Settlement
This document has been prepared for the benefit of NZ Transport Agency. No liability is accepted by this company or any employee or sub-consultant of this company with respect to its use by any other person.
This disclaimer shall apply notwithstanding that the report may be made available to other persons for an application for permission or approval to fulfil a legal requirement.
QUALITY STATEMENT PROJECT MANAGER PROJECT TECHNICAL LEAD
Tracy Couchman Phil Peet
PREPARED BY
………………………………............... ……/……/…… Ian Robertson
CHECKED BY
………………………………............... ……/……/…… Phil Peet
REVIEWED BY
………………………………............... ……/……/…… Marten Oppenuis
APPROVED FOR ISSUE BY
………………………………............... ……/……/…… Phil Peet
WELLINGTON Level 1, 123 Taranaki Street, Wellington 6011 PO Box 9624, Te Aro, Wellington 6141 TEL +64 4 381 6700, FAX +64 4 381 6739
REVISION SCHEDULE
Rev No Date Description
Signature or Typed Name (documentation on file).
Prepared by Checked by Reviewed by Approved by
A Draft BD & MO PP MO PP
Status: Final February 2013 Project number: 80500902 Our ref: PFR02 Manakau Settlement Final.docx
Report 2: Manakau Settlement
Status: Final February 2013 Project number: 80500902 Our ref: PFR02 Manakau Settlement Final.docx

Report 2: Manakau Settlement
Executive Summary This Project Feasibility Report (PFR) is one of a number of reports being undertaken to determine the package of improvements that should be implemented in the short to medium term to improve the safety and efficiency of the highway between Otaki and north of Levin as part of the Wellington Northern Corridor Road of National Significance (RoNS).
The main purpose of this report is to determine the feasibility of improving road safety and traffic management of State Highway 1 through Manakau settlement.
A variety of road safety and traffic management improvement options were considered, for which benefits and costs were determined. The options considered included;
• reducing the speed limit through Manakau settlement to 80 km/h,
• installing threshold treatments at either end of the settlement,
• widening the highway to install a flush median and wider shoulders,
• removing the southbound passing lane to the north of the settlement,
• closing one intersection, redirecting traffic to one safer, more efficient T junction,
A summary of the economic analysis is shown below.
Table 1-1: Option Summary
Option Description Capital Costs NPV Benefits Benefit Cost Ratio
Option 2-1: All Safety and Traffic
Management Improvements
$1.95M $17.4M 0.9
The rough order cost to achieve all of these improvements is $1.95M. Indicative BCRs were derived from predicted crash cost savings (with travel time and vehicle operating cost deemed neutral at this PFR stage) and calculated to be 0.9 (5 year crash history) or 2.7 (10 year crash history).
Options are such that each can also be considered as standalone, but a BCR for each is not credible to derive at this PFR level of detail. This could be progressed at SAR stage, however.
This report should be read in conjunction with the wider Otaki to north of Levin PFRs, which includes an option in Report No. 12 for a potential re-routing of SH 1 around Manakau settlement to the west, when four laning eventuates. This would have many positive benefits for Manakau (highway traffic essentially removed). Four laning by widening the existing highway is still potentially viable, but is contingent on a protected building on the west side being able to be shifted back or relocated. A war memorial on the eastern side, near Mokena Kohere St, if able to be relocated would open up the possibility of the rail being shifted east and hence some widening of the highway on the eastern side becomes a possibility. This should be investigated further during the scheme assessment report (SAR) stage to establish how viable it is to proceed with short to medium term improvements along the existing highway, and their compatibility with eventual four laning, versus re-routing the highway to the west of the settlement (i.e. identify redundant investment).
The economic result indicates that the All Improvements package of work is viable based on the 10 year underlying crash history; and this is recommended to be taken forward into the SAR phase.
Status: Final February 2013 Project number: 80500902 Our ref: PFR02 Manakau Settlement Final.docx

Report 2: Manakau Settlement
Status: Final February 2013 Project number: 80500902 Our ref: PFR02 Manakau Settlement Final.docx

Report 2: Manakau Settlement
NZ Transport Agency Report 2: Manakau Settlement
CONTENTS Executive Summary .................................................................................................................................. ii 1 Introduction ......................................................................................................................................... 1
2 Projects Currently Being Investigated ................................................................................................ 1
3 Description of Problem ....................................................................................................................... 3
3.1 Ōtaki to North of Levin ................................................................................................................... 3 3.2 Manakau Township ........................................................................................................................ 3
4 Site Description .................................................................................................................................. 3
5 Traffic Statistics .................................................................................................................................. 5
6 Crash History ...................................................................................................................................... 5
6.1 Crash Data..................................................................................................................................... 5 6.2 Crash Risk ..................................................................................................................................... 8
7 Alternatives and Options Considered ................................................................................................. 8 8 Design Statement ............................................................................................................................. 11
9 Cost Estimates ................................................................................................................................. 15
10 Economic Assessment and Risk Assessment .................................................................................. 15
10.1 Crash Benefits ............................................................................................................................. 15 10.2 Benefit Cost Ratio Results ........................................................................................................... 15
10.3 Intangible benefits ....................................................................................................................... 16 10.4 Risk Assessment ......................................................................................................................... 16
11 Assessment Profile ........................................................................................................................... 16
11.1 Strategic Fit ................................................................................................................................. 17 11.2 Effectiveness ............................................................................................................................... 17
11.3 Efficiency ..................................................................................................................................... 17
12 Social and Environmental Assessment ............................................................................................ 17 13 Geotechnical Requirements ............................................................................................................. 18
14 Land Requirements .......................................................................................................................... 18
15 Resource Management Issues ......................................................................................................... 18
15.1 District Plan Provisions ................................................................................................................ 18
15.2 Regional Plan Provisions ............................................................................................................. 19 15.3 Other Provisions .......................................................................................................................... 19
16 Maintenance Issues .......................................................................................................................... 19
17 Conclusions and Recommendations ................................................................................................ 19
Status: Final February 2013 Project number: 80500902 Our ref: PFR02 Manakau Settlement Final.docx

Report 2: Manakau Settlement
LIST OF TABLES Table 1-1: Option Summary ..................................................................................................................... ii
Table 6-1: Annual Distribution of Crashes, 2007-2011 ............................................................................ 6
Table 6-2: CAS Crash Type ..................................................................................................................... 6 Table 6-3: HRRRG Crash Type ................................................................................................................. 6
Table 6-4: Crash Causation Factors of Reported Injury Crashes ............................................................ 7
Table 6-5: Environmental Factors ............................................................................................................ 7
Table 6-6: Annual Distribution of Crashes, 2002-2006 .............................................................................. 8
Table 9-1: Cost Estimate (undiscounted) ................................................................................................. 15
LIST OF FIGURES Figure 2-1: Projects Currently Being Investigated ..................................................................................... 2
Figure 4-1: Study Area Location Plan ........................................................................................................ 4
Figure 8-1: Threshold treatment cross-sections....................................................................................... 12
Figure 8-2: Threshold treatment plan views ............................................................................................ 13
Figure 8-3: Threshold sign concept ......................................................................................................... 14
Figure 8-4: Typical cross sections ........................................................................................................... 14
APPENDICES Appendix A Photographs
Appendix B Traffic Data
Appendix C Crash Data
Appendix D Outline Plans Appendix E Cost Estimates
Appendix F Economic Analysis Worksheets
Appendix G Speed Limit Warrant Survey
Status: Final February 2013 Project number: 80500902 Our ref: PFR02 Manakau Settlement Final.docx
Report 2: Manakau Settlement Introduction
1 Introduction Using the outcomes of the Otaki to north of Levin Scoping Report and Addendum, the NZTA decided that the most appropriate strategy for the highway between Ōtaki and north of Levin is to upgrade the existing highways as the first stage of a long term strategy. This allows the NZTA to realise important safety benefits in the short to medium term whilst deferring the need to construct four lanes for the time being.
This Project Feasibility Report (PFR) is one of a number of reports being undertaken to determine the package of improvements that should be implemented to improve the safety and efficiency of the highway between Otaki to Levin as part of the Wellington Northern Corridor Road of National Significance (RoNS).
The objectives of the Wellington Northern Corridor RoNS, which runs from Wellington Airport to north of Levin, are:
• To enhance inter regional and national economic growth and productivity;
• To improve access to Wellington’s CBD, key industrial and employment centres, port, airport and hospital;
• To provide relief from severe congestion on the state highway and local road networks;
• To improve the journey time reliability of travel on the section of SH1 between Levin and the Wellington Airport; and
• To improve the safety of travel on state highways.
For the Otaki to north of Levin section; the objectives are:
• To provide best value solutions which will progressively meet (via a staged approach) the long term RoNS goals for this corridor of achieving a high quality four lane route;
• To provide better Levels of Service, particularly for journey time and safety, between north of Otaki and north of Levin;
• To remove or improve at grade intersections between north of Otaki and north of Levin;
• To engage effectively with key stakeholders; and
• To lodge Notices of Requirement and resource consents as appropriate with the relevant consent authorities for the first individual project by the 2013/14 financial year.
The projects that are being developed to help meet these objectives are presented in Section 2.
The purpose of this report is to determine the feasibility of undertaking safety improvements on the section of State Highway 1 through the settlement of Manakau.
The geographical extent of this project is for approximately 1 km of State Highway 1 (SH1), from south of Honi Taipua Street to north of Waikawa Beach Road.
The outcome of this PFR will be considered alongside the outcomes of the other PFRs and used to determine the best package of works to progress as the first stage towards the long term strategy.
2 Projects Currently Being Investigated The projects that are currently being investigated to meet the short to medium term objectives of the Otaki to north of Levin RoNS project are presented in the figure below.
Status: Final February 2013 Project number: Z1925700 Page 1 Our ref: PFR02 Manakau Settlement Final.docx

Report 2: Manakau Settlement Projects Currently Being Investigated
Figure 2-1: Projects Currently Being Investigated In addition to the above PFRs, reports are also being undertaken on Route Improvements (i.e. edge treatment, passing lanes, walking and cycling, side friction etc; Report No. 11) and on Four Lane Alignments (Report No. 12).
Foxton
Levin
Ohau
Manakau
Otaki
1. Forest Lakes
2. Manakau Settlement
3. Manakau to Ohau
4. Ohau Settlement
5. SH1 & SH57 Connection
6. Heavy Vehicle Bypass
7. Levin Signals
10.Queen St Intersection
8. Waitarere Beach Road Curves
9. Whirokino Trestle
Status: Final February 2013 Project number: Z1925700 Page 2 Our ref: PFR02 Manakau Settlement Final.docx

Report 2: Manakau Settlement Description of Problem
3 Description of Problem 3.1 Ōtaki to North of Levin State Highway 1 and State Highway 57 through the study area have a number of deficiencies, resulting in a poor crash history and a number of locations where the free flow of vehicles is restricted by the physical characteristics of the highway.
State Highway 1 currently follows the historic route established in the late 19th and early 20th centuries. As a consequence it is constrained by a now substandard alignment, towns and settlements, narrow curved bridges and significant side friction caused by local roads, commercial frontages and property accesses for the entire stretch.
3.2 Manakau Township The section of highway under consideration in this PFR is approximately 1km in length, from south of Honi Taipua Street railway underpass link to north of Waikawa Beach Road, running through Manakau.
The key issues to be addressed by improvement works relate mostly to the safety and comfort of the community of Manakau and local area traffic. The key factors and constraints considered in this PFR are:
• Posted speed limit, 100 km/h limit through the township, and the incompatibility of the end of the southbound passing lane with the north end of the settlement.
• Vehicle speed problems exacerbated by the southbound passing lane terminating shortly before the settlement.
• Pedestrians and cyclists – no facilities at present.
• Side roads.
• Side friction.
• Nature of commercial development (separated from township, see following point) and off road parking availability.
• Movements across the highway from the settlement to the shops, particularly the dairy.
• Increasing heavy vehicle volumes.
• Deficient level crossing separation - railway to limit line distance on Mokena Kohere Street (currently 16 m).
• No storage for vehicles turning left onto Mokena Kohere Street when rail crossing barriers are down, leaving them exposed to traffic having just merged at the end of the passing lane. Also HCVs exiting will overhang the railway line.
• Cross Section (turning movements and ped/cycle provision).
• Waikawa Beach Rd intersection 125 m before the end of the passing lane.
• Steep shoulder to the south of and opposite Honi Taipua Street.
• Power poles close to the road, particularly opposite Honi Taipua Street on steep shoulder.
4 Site Description The project area consists of a 1 km length of SH 1 from south of the Honi Taipua Street railway underpass link to north of Waikawa Beach Road (RP 985/8.00-9.00 approx.).
• Of the approximately 1 km project length, approx. 600 m is within the more built up part of Manakau.
• The speed limit through the entire project area is 100 km/h. Status: Final February 2013 Project number: Z1925700 Page 3 Our ref: PFR02 Manakau Settlement Final.docx

Report 2: Manakau Settlement Site Description
• The road is a two way undivided carriageway with 3.4 m lanes and generally a varying 0.6 to 1.7 m LH shoulder and a varying 0.6 to 1.7 m RH shoulder; with further variation at the passing lane merge taper.
• The road widens for a right turn bay into Mokena Kohere Street, and the southbound passing lane extends into the project area 125 m beyond Waikawa Beach Road.
Figure 4-1, following, shows the study area.
Figure 4-1: Study Area Location Plan
There are three side roads within the study area (south to north):
N
Rail Alignment
To Ōtaki
North Extent
South Extent
Dairy
School
Former Methodist Church
War Memorial Garden
Fruit & Vege Shop
To Levin
Status: Final February 2013 Project number: Z1925700 Page 4 Our ref: PFR02 Manakau Settlement Final.docx

Report 2: Manakau Settlement Traffic Statistics
• Honi Taipua Street link (RP 985/8.98), serving Manakau Settlement, with access via a deficient one way rail underpass (height and width restricted). RHS.
• Mokena Kohere Street (RP 985/8.49), serving Manakau Settlement (the majority of the residential property is on the east side), including a school and some industry, with access via a barrier-protected level crossing immediately adjacent to the highway. RHS.
• Waikawa Beach Road (RP 985/8.12), serving the Waikawa Beach settlement and rural farmland. LHS.
State Highway 1 is bounded by the railway reserve to the east, beyond which are the main residential streets of Manakau along with the school and some retail/commercial. The settlement road network accesses the highway at two locations; the bells and barrier protected level crossing at Mokena Kohere Street at the north end and the short railway underpass connection to Honi Taipua Street at the south end. On the eastern side of the railway is a siding and fertiliser depot, but it appears that the siding is no longer used to offload and onload from the depot. To the west is a mixture of farm land, with a number of residential dwellings and several retail/commercial businesses.
There are no horizontal curves in the project area and the vertical geometry is relatively flat.
There are no dedicated cycling or walking facilities provided along or across State Highway 1.
It is noted that the Waiauti Stream Realignment has been recently completed just south of the settlement. The new alignment, whilst of a reasonable standard, does not meet RoNS guidelines and hence when four laning proceeds, redundancy of this recent investment (including a stream bridge) will potentially result.
5 Traffic Statistics The Annual Average Daily Traffic (AADT) flow at the NZTA telemetry count site at Ohau (Count Site ID: 01N00988) was 14,600 vehicles per day (vpd), 2011, with the proportion of Heavy Commercial Vehicles (HCVs) at 10%. The traffic volume within the Manakau settlement will likely be slightly higher than this on account of the school, residential dwellings and retail/commercial businesses; however further traffic counts would be required to determine the actual volumes.
The traffic growth rate at the count site is calculated to be 1.3%, using data from 1992 to 2011. Volumes typically increased from 1992 to 2005; however since then volumes have remained generally stable.
Annual average daily side road traffic volumes, as far as the data from Horowhenua DC reveals, are as follows (south to north);
• Honi Taipua Street link (RHS): Unknown, considered to be significantly less than Mohena Kohere Street.
• Mohena Kohere Street (RHS): 580 vpd
• Waikawa Beach Road (LHS): 1000 vpd
6 Crash History 6.1 Crash Data A review of NZTA’s CAS database over the five year period from 2007 to 2011 revealed a total of 16 crashes along the approx.1 km section of highway (SH1 RP 985/9.00 – RP 985/8.00). The extended 1 km length was chosen to include crashes which would be influenced by the intersections and at either end of the site.
The following tables provide a summary of the CAS output data.
Status: Final February 2013 Project number: Z1925700 Page 5 Our ref: PFR02 Manakau Settlement Final.docx

Report 2: Manakau Settlement Crash History
Table 6-1: Annual Distribution of Crashes, 2007-2011
Year Fatal Serious Minor Non-Injury Total DSi*
2007 - - 4 2 6 -
2008 - - - 2 2 -
2009 - - - 3 3 -
2010 - - - 4 4 -
2011 - - 1 - 1 -
Total - - 5 11 16 - * Death and serious injury casualties
Table 6-2: CAS Crash Type
Crash Type Number of Reported Crashes
Percentage of Reported Crashes
Overtaking Crashes 1 6%
Straight Road Lost Control/Head On 2 13%
Bend – Lost Control/Head On 1 6%
Rear End / Obstruction 7 44%
Crossing / Turning 4 25%
Pedestrian Crashes - 0%
Miscellaneous Crashes 1 6%
Total 16 100%
Table 6-3: HRRRG1 Crash Type
Crash Type Number of Reported Crashes
DSi Percentage of Reported Crashes
Head on 1 - 6
Run off Road 3 - 19
Intersection Crashes 5 - 31
Other 7 - 44
Total 16 - 100%
1 High Risk Rural Roads Guide (HRRRG), NZTA, September 2011 Status: Final February 2013 Project number: Z1925700 Page 6 Our ref: PFR02 Manakau Settlement Final.docx

Report 2: Manakau Settlement Crash History
Table 6-4: Crash Causation Factors of Reported Injury Crashes
Causation Number of Reported Injury Crash Causation Factors
Alcohol 2
Too fast 1
Failed give way/stop 2
Overtaking 1
Incorrect lane/position 3
Poor handling 2
Poor observation 9
Poor judgement 2
Fatigue 2
Disabled/old/ill 1
Vehicle factors 4
Other 3
Table 6-5: Environmental Factors
Wet Dry Night Day Weekend (Fri 6:00PM to Monday 5:59AM) Weekday
No. 3 13 4 12 8 8
% 19 81 25 75 50 50
• Of the 16 reported crashes over the five year period analysed, five were minor injury and 11 were non-injury.
• Poor observation was the single highest crash causation factor towards injury crashes, being attributed to nine of the 32 crash causation factors.
• Three crashes involved hitting a post or pole.
A further five year period between 2002 and 2006 was also analysed. During this period there were three serious injury crashes: A car U-turning just north of Waikawa Beach Road was hit by a vehicle travelling in the same direction in 2002. A motorcyclist was hit in 2004 when overtaking a vehicle that was turning right into the fruit and vegetable shop. A car lost control and went off the road, hitting a car parked near the dairy in 2004.
There was a fatality involving a right turn across opposing traffic into the fruit and vegetable shop in 2000, and a further serious injury following loss of control and hitting a pole near Mokena Kohere Street in 2012, which though neither are included in the analysis periods, reinforces the ongoing high risk of this site. The crashes from the 5 year period from 2002-2006 are summarised in Table 6-6:
Status: Final February 2013 Project number: Z1925700 Page 7 Our ref: PFR02 Manakau Settlement Final.docx

Report 2: Manakau Settlement Alternatives and Options Considered
Table 6-6: Annual Distribution of Crashes, 2002-2006
Year Fatal Serious Minor Non-Injury Total DSi*
2002 - 1 - 3 4 1
2003 - - - 3 3 -
2004 - 2 - - 2 2
2005 - - 2 1 3 -
2006 - - - - - -
Total - 3 2 7 12 3 * Death and serious injury casualties
6.2 Crash Risk The section of SH1 was analysed according to the High-Risk Rural Roads Guide (HRRRG) which identifies that crash risk can be generally defined in two ways:
• Actual Crash Risk; which is based on crashes reported in the last 5 years. This is separated into collective risk, which is also known as crash density, and personal risk, which is also known as crash rate.
• Predicted Crash Risk; which is based on KiwiRAP road protection score (RPS) and the KiwiRAP star rating.
In terms of crash risk this 1 km section of SH 1 has:
• A collective and personal risk of zero as there has been no fatal or serious injury crashes within the last 5 year period.
• An average KiwiRAP star rating of 2.5, giving a published KiwiRAP rating of 2 stars, together with an RPS of 19.4.
Based purely on the KiwiRAP star rating and the RPS, this length of SH1 is classified as a high risk rural road.
Therefore, in Order to better measure the collective and personal crash risk, crashes were analysed over the past 10 years. Following this;
• A personal risk value of 5.61 equates to the highway having a medium risk, and
• A collective risk value of 0.30 equates to a high risk,
Therefore from the past 10 years’ crash data this length of SH 1 is classified as a high risk rural road.
Further crash data can be found in Appendix C.
7 Alternatives and Options Considered The alternatives and options available should be seen as all individually and collectively contributing to road safety and traffic management improvement. They are such that a number can be standalone or they can be considered in clusters or as a total package. There is also overlap with other PFRs, so decision-making on how to proceed can be influenced by their outcomes.
The above needs to be considered when assessing the alternatives and options, particularly from a short/medium term versus long term investment perspective.
Report No. 12 includes a potential re-routing of SH 1 around Manakau Settlement to the west, when four laning eventuates. This would have many positive benefits for Manakau Settlement (highway traffic essentially removed). Four laning by widening the existing highway is also still potentially viable, but is contingent on a protected building on the west side being able to be shifted back or relocated. A war memorial on the eastern side, near Mokena Kohere Street, if able to be relocated would open up the
Status: Final February 2013 Project number: Z1925700 Page 8 Our ref: PFR02 Manakau Settlement Final.docx
Report 2: Manakau Settlement Alternatives and Options Considered
possibility of the rail being shifted east and hence some widening of the highway on the eastern side becomes a possibility. This should be investigated further during the SAR stage to establish how viable it is to proceed with short to medium term improvements along the existing highway, and their compatibility with eventual four laning, versus re-routing the highway to the west of the settlement (i.e. identify redundant investment). See Appendix D for an options layout.
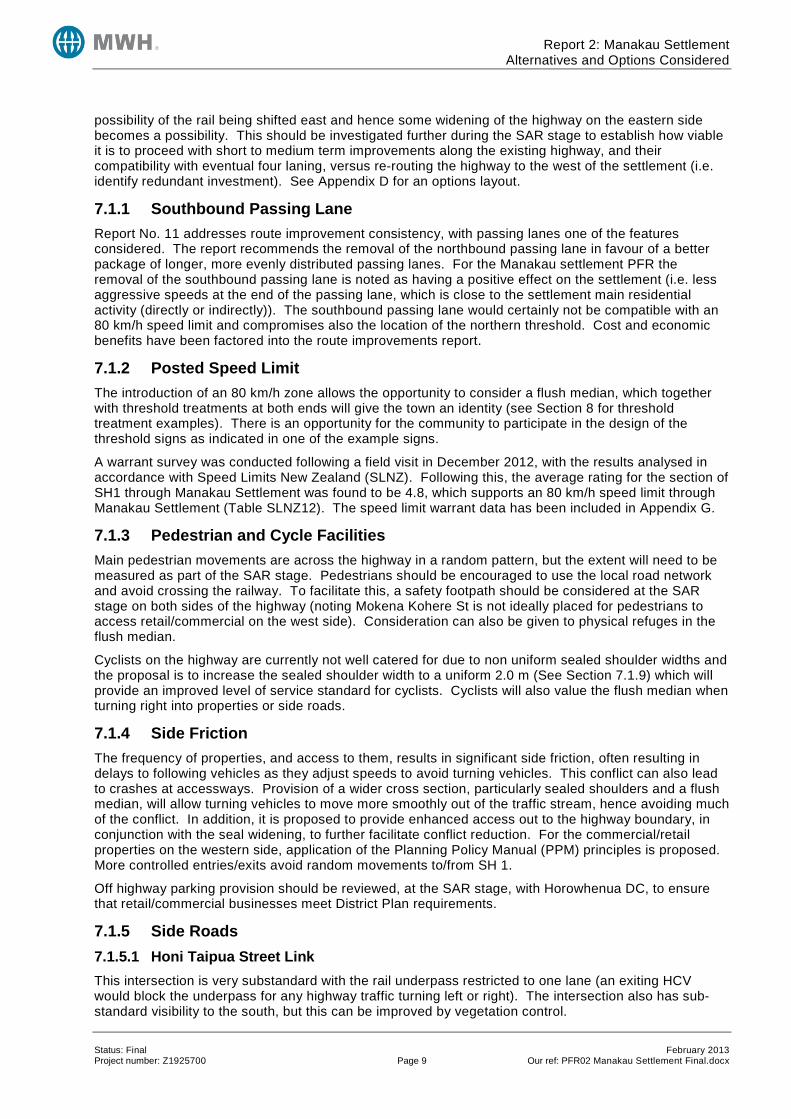
7.1.1 Southbound Passing Lane Report No. 11 addresses route improvement consistency, with passing lanes one of the features considered. The report recommends the removal of the northbound passing lane in favour of a better package of longer, more evenly distributed passing lanes. For the Manakau settlement PFR the removal of the southbound passing lane is noted as having a positive effect on the settlement (i.e. less aggressive speeds at the end of the passing lane, which is close to the settlement main residential activity (directly or indirectly)). The southbound passing lane would certainly not be compatible with an 80 km/h speed limit and compromises also the location of the northern threshold. Cost and economic benefits have been factored into the route improvements report.
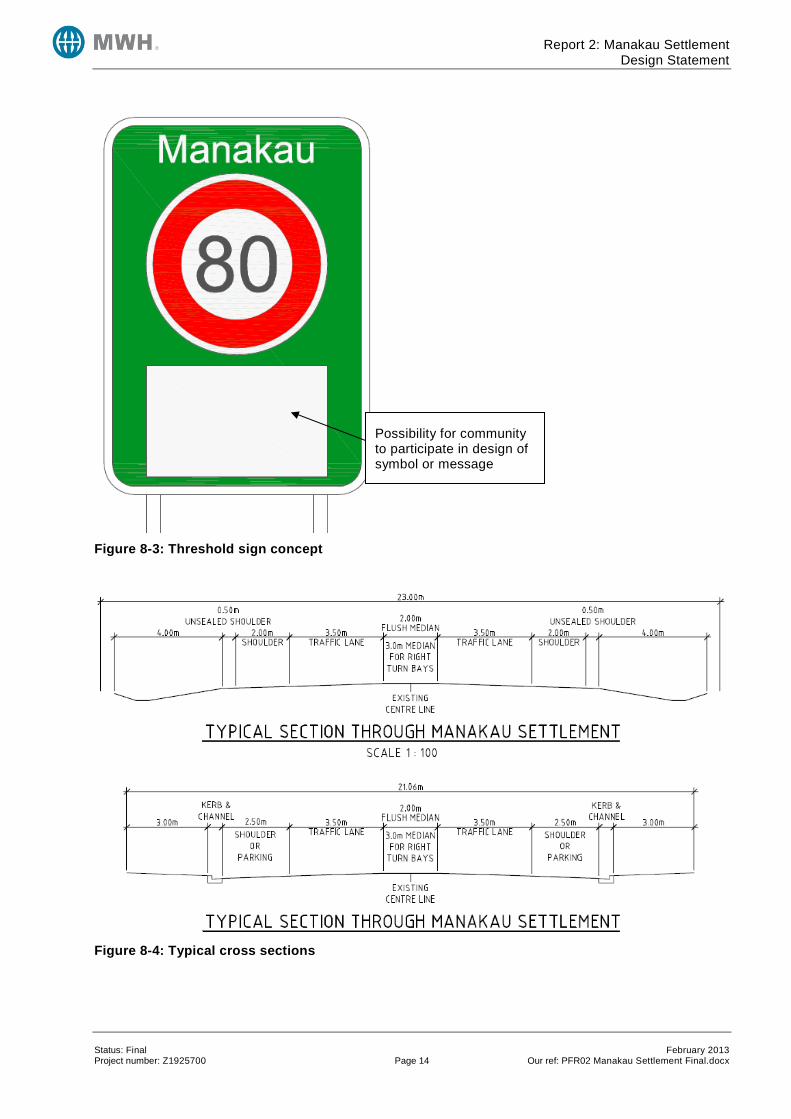
7.1.2 Posted Speed Limit The introduction of an 80 km/h zone allows the opportunity to consider a flush median, which together with threshold treatments at both ends will give the town an identity (see Section 8 for threshold treatment examples). There is an opportunity for the community to participate in the design of the threshold signs as indicated in one of the example signs.
A warrant survey was conducted following a field visit in December 2012, with the results analysed in accordance with Speed Limits New Zealand (SLNZ). Following this, the average rating for the section of SH1 through Manakau Settlement was found to be 4.8, which supports an 80 km/h speed limit through Manakau Settlement (Table SLNZ12). The speed limit warrant data has been included in Appendix G.
7.1.3 Pedestrian and Cycle Facilities Main pedestrian movements are across the highway in a random pattern, but the extent will need to be measured as part of the SAR stage. Pedestrians should be encouraged to use the local road network and avoid crossing the railway. To facilitate this, a safety footpath should be considered at the SAR stage on both sides of the highway (noting Mokena Kohere St is not ideally placed for pedestrians to access retail/commercial on the west side). Consideration can also be given to physical refuges in the flush median.
Cyclists on the highway are currently not well catered for due to non uniform sealed shoulder widths and the proposal is to increase the sealed shoulder width to a uniform 2.0 m (See Section 7.1.9) which will provide an improved level of service standard for cyclists. Cyclists will also value the flush median when turning right into properties or side roads.
7.1.4 Side Friction The frequency of properties, and access to them, results in significant side friction, often resulting in delays to following vehicles as they adjust speeds to avoid turning vehicles. This conflict can also lead to crashes at accessways. Provision of a wider cross section, particularly sealed shoulders and a flush median, will allow turning vehicles to move more smoothly out of the traffic stream, hence avoiding much of the conflict. In addition, it is proposed to provide enhanced access out to the highway boundary, in conjunction with the seal widening, to further facilitate conflict reduction. For the commercial/retail properties on the western side, application of the Planning Policy Manual (PPM) principles is proposed. More controlled entries/exits avoid random movements to/from SH 1.
Off highway parking provision should be reviewed, at the SAR stage, with Horowhenua DC, to ensure that retail/commercial businesses meet District Plan requirements.
7.1.5 Side Roads 7.1.5.1 Honi Taipua Street Link This intersection is very substandard with the rail underpass restricted to one lane (an exiting HCV would block the underpass for any highway traffic turning left or right). The intersection also has sub-standard visibility to the south, but this can be improved by vegetation control.
Status: Final February 2013 Project number: Z1925700 Page 9 Our ref: PFR02 Manakau Settlement Final.docx

Report 2: Manakau Settlement Alternatives and Options Considered
Given the sub-standard nature of the rail underpass and low volumes which use the intersection it is recommended that the intersection be closed.
In concluding ii) above it is assumed that KiwiRail have no plans or interest in upgrading the rail underpass, but this needs to be confirmed with them at the SAR stage. On the very small possibility that the underpass was upgraded, a review of side road connections to the highway on the east side should be revisited.
7.1.5.2 Mokena Kohere Street The existing layout is functional and would be improved further by removal of the southbound passing lane and increasing the rail limit line offset to 23 m. If the shift west to provide this separation is pursued headlight conflict will need to be carefully considered.
7.1.5.3 Waikawa Beach Road This intersection services the beach community and a number of rural properties. Layout is also functional and would benefit from the removal of the southbound passing lane.
At the SAR stage review the intersection layout as part of the package of work.
7.1.6 Cross Movements See Section 7.1.3 above, particularly noting the likely random pedestrian crossing pattern and the need to better control this behaviour. There will also be vehicle cross movements as residents on the east side make use of the retail/commercial facilities on the west side of the highway. A small number of cyclist cross movements is also likely. No information has been gathered to quantify the local cross movements and this should be further investigated at the next stage.
There are also those cross movements which result from southbound drivers parking on the east side of the highway and vehicle occupants walking across the highway to the retail/commercial businesses. With the traffic volume in the order of 15,000 vpd (2013) this is very dangerous and some of those crossing may get caught on the centreline. A number of the alternatives/options will assist to make this much safer (80 km/h zone, flush median, etc) also see Section 7.1.3 above. Whilst considered dangerous, it is noted that there are no recorded pedestrian crashes in the 10 year crash history.
7.1.7 Heavy Vehicle Volumes The predicted increase in on road freight movement will inevitably result in more, heavier and potentially longer HCVs in the future. This puts more strain on other road users. Hence this adds weight to the argument to widen the cross section and install a flush median as safeguards against a reducing road safety and traffic management performance.
7.1.8 Rail Seperation on Mokena Kohere Street The NIMT railway has a separation from the limit line on SH1 of 16 m. See Section 7.1.5.2 above for possible treatment to increase the rail and limit line separation to at least 23 m. The HCV number exiting the intersection will be largely those associated with the fertiliser depot and those who have a range of business on the eastern side. It is anticipated that turns out of Mokena Kohere St will be both left and right, with no dominant movement (to be substantiated at the SAR stage). If shifting the highway to the west proves difficult, a back-up part option is to provide sufficient width beyond the left hand radius to allow a HCV driver to pull off onto a sealed area along the highway (not an acceleration lane, but a protection width).
7.1.9 Cross Section and Shoulder Width There is reference in the sections above to a consistent cross section. The current cross section nominally consists of two 3.4 m wide lanes and sealed shoulders which vary from 0.6 m to 1.7 m. The proposal is to provide a consistent cross section - 2 x 3.5 m lanes, 2 x 2.0 m sealed shoulders and a 2.0 m flush median between the threshold treatments. If road reserve width is tight, kerb and channel can be introduced to ensure widening stays as close to current road reserve width as possible (to be investigated). At intersections, particularly Mokena Kohere St and Waikawa Beach Rd, the seal width is determined by turning lanes, both left and right or by the requirements of the PPM. The cross section finally provided should be consistent with ultimate four laning (if it is constructed within the settlement) which will likely see widening occur on the western side (noting the constraints).
Status: Final February 2013 Project number: Z1925700 Page 10 Our ref: PFR02 Manakau Settlement Final.docx

Report 2: Manakau Settlement Design Statement
7.1.10 Proximity of Lighting and Power Poles to Carraigeway The lighting through Manakau is provided almost entirely by lighting arms retro-fitted to the power poles on the northbound side of the road, whilst there are also several frangible lighting poles on the southbound side around the Mokena Kohere Street intersection. All are within the road reserve. Consideration should be given to undergrounding the overhead power as a preference, hence eliminating power poles. Or as a minimum, relocating poles out to the road reserve boundary. Lighting may then be provided by frangible light poles, which can also be located as far back as practicable as part of the seal widening proposal. This reduces hazards which figure prominently in objects hit in the crash history. Alternatively, crash cushions are available that will reduce the severity of impacts, however models that will provide the appropriate level of protection for this level of road are generally of a size that would constrict access to any nearby properties.
7.1.11 North Island Main Trunk Railway The railway runs parallel with the highway on its eastern side for the entire approx. 1 km length, with an offset of approximately 16 m. It does deviate away at the southern end just after the underpass. Consideration was given to the possibility of shifting the railway to the east (to increase current intersection separation and to allow ultimate 4 laning), but this is compromised by the war memorial and related garden (between the fertiliser depot and Mokena Kohere St). Relocation would be required and this should be considered at the SAR stage. For this PFR and PFR 12, four laning Solution, it has been assumed that relocation of the war memorial and garden is most unlikely. Any rail/ highway improvements have been covered in the items above.
KiwiRail will need to be consulted at the SAR stage for any Alternatives/Options which impact their asset. It is noted that Kiwirail’s railway corridor will be planning for double track, which in turn may impact highway Alternatives/Options.
8 Design Statement This project is at a feasibility stage, and therefore several assumptions have been made in the design, particularly in relation to the seal widening aspects.
The design assumptions include the following: • The cost estimate has been based on the judgement of an engineer who has knowledge of the site. • The cost estimate has been based on the assumption that the project can be built using proven
technology. • No adverse ground conditions are encountered (e.g. contaminated material or large areas of peat). • Regrading the carriageway would not be required but new surfacing would be laid across the entire
width and length of the project. • Earthwork batter slopes are assumed to be 6H:1V for fills and 3H:1V for cuts. Earthwork extents
have been estimated as no topographical survey data is available. Whilst the overall project length studied is 1.0 km, the section over which the general improvements such as seal widening would take place is 0.86km, between Waikawa Beach Road (RP 8.12) and Honi Taipua Street (RP 8.98). Therefore, while the economics of the option are considered only for this 0.86 km length, the full 1 km has been considered in the crash analysis in order to ensure that all crashes influenced by the Waikawa Beach and Honi Taipua Street intersections have been included in the analysis.
It has been assumed that the existing carriageway will largely be retained, with a seal widening formed on the railway reserve to the east of the existing formation to achieve the design road width. In lieu of geotechnical testing the depth of pavement construction has been based on local knowledge and typical sections provided for RoNS projects to the south. This allows for 350 mm of sub-base and 150 mm of M4 base course with a chip seal surface.
The 80 km/h speed restriction is recommended because of the clear safety gains and the appropriateness of an 80 km/h speed limit through a rural township. A threshold treatment at either end of the township is a relatively inexpensive way of reinforcing this.
Status: Final February 2013 Project number: Z1925700 Page 11 Our ref: PFR02 Manakau Settlement Final.docx

Report 2: Manakau Settlement Design Statement
Thresholds can be installed in accordance with Guidelines for Urban-Rural Speed Thresholds RTS 15 (LTSA, 2002), such as the examples in Figure 8-1 and Figure 8-2, below. The threshold signs may include a symbol or message designed by the local community (Figure 8-3).
A flush median and widened shoulders will address some of the safety issues caused by turning traffic, and improve the safety of pedestrians. The flush median, along with kerb and channel in parts of the settlement, will create a road environment that reflects the 80 km/h speed limit. A typical cross section is shown in Figure 8-4. As part of the widening, the private property accesses can be improved to a safer standard.
The passing lane north of Manakau will be removed in accordance with PFR 11 Route Improvements (Passing Lanes), and to reduce vehicle speeds entering the township and improve the safety at Waikawa Beach Road.
SH 1 N will be realigned and the intersection improved at Mokena Kohere Street, to allow for the storage of a 23 m design vehicle between the railway tracks and the limit line at SH 1. The railway underpass on Honi Taipua Street may also be closed as there is insufficient room to provide a safe intersection layout for right-turning traffic.
Retail/commercial development along the highway through Manakau Settlement needs to be considered, as it is currently creating issues with cross movements from the residential centre to some commercial properties, i.e. the dairy. The dairy could be relocated to the same side of SH 1 as the township to alleviate this problem.
Where the existing roadside environment restricts road widening and the batter slopes are non-traversable, safety barriers will be installed. Infrangible objects such as lighting and power poles may be placed underground, relocated or protected by safety barriers or crash cushions. This is particularyly relivant around Honi Taipua Street.
Figure 8-1: Threshold treatment cross-sections
Status: Final February 2013 Project number: Z1925700 Page 12 Our ref: PFR02 Manakau Settlement Final.docx

Report 2: Manakau Settlement Design Statement
Figure 8-2: Threshold treatment plan views
Status: Final February 2013 Project number: Z1925700 Page 13 Our ref: PFR02 Manakau Settlement Final.docx
Report 2: Manakau Settlement Design Statement
Figure 8-3: Threshold sign concept
Figure 8-4: Typical cross sections
Possibility for community to participate in design of symbol or message
Status: Final February 2013 Project number: Z1925700 Page 14 Our ref: PFR02 Manakau Settlement Final.docx

Report 2: Manakau Settlement Cost Estimates
9 Cost Estimates Feasibilty estimates have been prepared and should be seen as very rough order costs, noting the level of data and information available at this PFR stage.
Table 9-1: Cost Estimate (undiscounted)
Option Description Expected Estimate 95th Percentile Estimate
All improvements $1,950,150 $2,486,550
More detail of the cost estimates for the options are given in Appendix E.
10 Economic Assessment and Risk Assessment Speed limit warrants tend to be a balanced consideration of the comfort/relieved anxiety of a community and a level of service for highway users which they will see as satisfactory (and hence will generally observe the speed limit). The introduction of a changed speed limit does therefore not go through an economic evaluation. With that in mind the introduction of an 80 km/h zone has not been economically tested for travel time and vehicle operating cost disbenefits. The economics is purely based on the crash reduction predicted as a result of the package of improvements identified – hence this sways in the direction of the balance being in favour of the community and that is considered a defendable position. Therefore; the main economic comparison for this PFR is to assess the level of safety benefit that can be derived from the package of improvements outlined. The Do Minimum is deemed to be maintenance of the existing asset.
10.1 Crash Benefits Both 5 year and 10 year crash histories have been extracted (to understand the underlying risk) and a crash by crash analysis undertaken to derive the annual crash cost. Given the diverse nature of the improvements proposed, an experienced Principal Safety Engineer/Economic Analyst has judged the likely crash saving for the two BCRs.
Only those crashes which the improvement work is deemed to have a positive influence on have been counted towards the crash savings of the improvements. These, as a percentage of all crashes over the study periods, form the expected crash reductions used in the economic analysis. These have been noted as such in the crash list report in Appendix C.
Benefits have then been calculated based on the most optimistic, pessimistic and median crash reductions expected. The optimistic scenario is that all of the crashes theoretically preventable by the improvements will in fact be achieved. The pessimistic scenario is that only half of them will be achieved. The median crash reduction, that 75% of the theoretical reductions will be achieved, has taken forward for economic analysis. These are shown in Appendix F.
10.2 Benefit Cost Ratio Results Table 10-1: Benefits - crash costs annual and discounted (30 years @ 8%)
Option Description Annual Benefits Discounted Benefits
All improvements (5 yr. crash history) $165,000 $1,810,000 All improvements (10 yr. crash history) $477,000 $5,240,000
Table 10-2: BCRs
Option Description 5 Year Crash History 10 Year Crash History
All improvements 0.9 2.7
Status: Final February 2013 Project number: Z1925700 Page 15 Our ref: PFR02 Manakau Settlement Final.docx

Report 2: Manakau Settlement Assessment Profile
A comparison of BCRs for the range of crash reductions between the pessimistic and optimistic scenarios has been included as a sensitivity analysis.
Table 10-3: Sensitivity Analysis of BCRs
Option Description 5 Year Crash History 10 Year Crash History
All improvements 0.7 – 1.2 1.9 – 3.6
10.3 Intangible benefits Community comfort (or discomfort) is often under-estimated. For now this can be viewed as an intangible benefit, but in the SAR will be quantified. Communities will definitely respond in a positive manner to initiatives that make their environment safer. It remains to be seen if road closures will be endorsed by the community as a safer solution. Research does back this up as factual with two similar side roads having some 60% greater crash risk compared to one consolidated side road.
10.4 Risk Assessment The risks to the project have been assessed using the General Approach as determined in the NZTA Risk Management Process Manual (AC/Man/1).
The major potential risks associated with the Manakau Township improvement project are considered to be:
• Project unable to get funded due to constrained funding environment.
• Local opposition to the project primarily due to the closure of Honi Taipua Street and the relocation of businesses and their accesses.
• Inaccurate cost estimate due to level of available data at this feasibility state, including utility information and assumptions in regards to passing lanes, turn around areas and seal type.
• Traffic delays during construction.
• Environmental effects during construction.
• Impacts on existing services
• Land acquisition difficulties
• Difficulties in obtaining resource consents and/or alteration to designation
• Opposition from local iwi
• Additional landowner accommodation works required
• Railway land is unable to be used for the widening, necessitating the purchase of private land on the western side
11 Assessment Profile The Government Policy Statement on Land Transport Funding (GPS) requires the NZTA to consider a number of matters when evaluating projects. To assist in understanding how projects perform against these matters and hence what investment decisions to make, the NZTA utilises an assessment profile process.
The assessment profile is a three-part rating for an activity, rated as high, medium or low e.g. HMM, and representing the assessment for Strategic Fit, Effectiveness and Efficiency respectively. It is considered that the assessment profile2 for Manakau Township is HHM. The following paragraphs outline how this profile has been created.
2 NZTA Planning and Investment Knowledge Base, www.pikb.co.nz/assessment-framework Status: Final February 2013 Project number: Z1925700 Page 16 Our ref: PFR02 Manakau Settlement Final.docx

Report 2: Manakau Settlement Social and Environmental Assessment
It should be noted that if this project in its entirety is not deemed economic or efficient, all or several of the improvements can be considered in isolation for the minor improvement programme.
11.1 Strategic Fit The strategic fit factor is a measure of how an identified problem, issue or opportunity that is addressed by a proposed activity or combination of activities, aligns with the NZTA’s strategic investment direction.
As this project is part of a Road of National Significance and is classified as a High Risk Rural Road, the Strategic Fit is High.
11.2 Effectiveness The effectiveness factor considers the contribution that the proposed solution makes to achieving the potential identified in the strategic fit assessment and to the purpose of the Land Transport Management Act (LTMA).
A wide range of assessment factors are available for use in this effectiveness rating and these draw from the five LTMA areas of:
• Economic Development
• Safety and Personal Security
• Access and Mobility
• Public Health
• Environmental Sustainability
A number of other key criteria need to be considered including integration, consideration of options and responsiveness.
As this project is part of the Roads of National Significance programme, it is recommended that the effectiveness factor for RoNS projects of High is adopted.
This is considered appropriate as the project will contribute positively to safety and is consistent with NZTA’s strategies and plans.
11.3 Efficiency The economic efficiency assessment considers how well the proposed solution maximises the value of what is produced from the resources used. This is primarily undertaken by the Benefit Cost Ratio.
As this project has a BCR of 0.9 for the 5 year crash history and 2.7 for the 10 year crash history, the efficiency rating is Medium.
12 Social and Environmental Assessment The Scoping Report phase of the Otaki to Levin RoNS identified a number of social and environmental factors relating to the Manakau PFR which will need to be assessed during the scheme assessment phase. The main issues relate to:
• historic building in the proximity of SH1 (Former Methodist Church)
• proposed deviation of the highway opposite the War Memorial Garden to achieve separation between the railway crossing and the highway (intersection of SH1 and Mokena Kohere Street)
Consultation has been carried out on a high level under the scoping phase of the Otaki to north of Levin RoNS and on-going consultation will continue with stakeholders throughout the planning and design process. The area is identified as being of cultural importance to the iwi of Rangitane o te Whanganui a Tara, Ngati Raukawa ki te Tonga and Ngati Toa Rangitira.
A Consultation Plan for the project area and consultation will be undertaken in accordance with the plan. The purpose of the plan is to:
Status: Final February 2013 Project number: Z1925700 Page 17 Our ref: PFR02 Manakau Settlement Final.docx

Report 2: Manakau Settlement Geotechnical Requirements
• Provide a documented process for intended engagement with the community, including the project context, the parties involved, and desired outcomes;
• Maximise effective and efficient engagement of community within generally tight time constraints;
• Provide the specifics of consultation to be undertaken, including timeframes;
• Help the project team to proactively manage risks to the project/project future from inappropriate or inadequate community engagement; and
• Help the project team to constructively manage community expectations.
13 Geotechnical Requirements A preliminary geotechnical appraisal report was prepared by MWH in 2011. This report outlined that the majority of the stretch of the highway is underlain by beach deposits (Otaki Sandstone). To investigate the subsurface conditions along the alignment which includes the Manakau Township study area, MWH recommended field investigations consisting of hand-auger bores, boreholes and test pits.
The preliminary geotechnical appraisal report for the Otaki to Levin RoNS noted the following aspects in regards to the subject study area:
• It has moderate settlement potential;
• It has a seismic potential due to the proximity of the active Northern Ohariu Fault;
• It has moderate susceptibility to liquefaction; and
• It is not located within a tsunami influence zone.
14 Land Requirements The realignment of the Mokena Kohere St / SH 1 intersection will require approx. 1000 m2 of land. These land requirements may require the relocation of the War Memorial Park and dairy.
Generally the widening, with flush median, will increase the existing road reserve width from just over 20 m, to 23 m, or 21 m if kerb and channel is used (in constrained locations). As discussed in the risk assessment, it is assumed that the road widening can be accommodated within the rail reserve, thus not requiring the purchase of any land. The SAR investigation will determine the extent of any land required. Land to provide off road parking for retail/commercial businesses will need to be discussed with Horowhenua DC during the SAR stage.
15 Resource Management Issues The project must meet all statutory requirements. There are a number of documents (both statutory and non-statutory) that must be considered when planning for the state highway improvements. In particular, the requirements of the Resource Management Act, the operative Horowhenua District Plan and the Horizons Regional Plan (proposed One Plan) will be assessed to ensure that the proposed project meets the plan provisions and follows the statutory process.
15.1 District Plan Provisions 15.1.1 Designations SH1 is designated under the operative Horowhenua District Plan for “state highway purposes” (D2) (Map 27). The existing designation is narrow in places and may need to be altered to accommodate the road improvements. The proposed deviation of the highway to accommodate an acceptable separation from the railway crossing will require an alteration to the designation. Accordingly, it is recommended that the Status: Final February 2013 Project number: Z1925700 Page 18 Our ref: PFR02 Manakau Settlement Final.docx

Report 2: Manakau Settlement Maintenance Issues
designation boundaries be altered to accommodate these works under s181 RMA. NZTA will be required to give notice to the Council of its requirement to alter the designation (NOR). An outline plan will also be required to indicate the scale of the prosed works within the designation.
Sections of SH1 run alongside the railway line. The railway corridor is designated as D1 under the District Plan.
15.1.2 Heritage Issues Schedule 2 – Heritage Features of the District Plan identifies the Former Methodist Church (H25) (Map 29) located on SH1 in the vicinity of the proposed works.
The War Memorial Sarcophagus is identified as H20 (Map 29) located in Honi Taipua Street. This heritage site is close to the improvements proposed at the intersection of SH1 and Mokena Kohere Street.
15.2 Regional Plan Provisions The final designs and construction plans will determine what regional consents are required. But given that there are no water courses or substantial earthworks in the immediate vicinity of the proposed works, it is unlikely that any consents will be required.
15.3 Other Provisions Given that the proposed works may involve minor earthworks around the proposed deviation, there is the potential to unearth Maori artefacts. Current information does not identify any known sites but an archaeological authority may be required should a site be discovered.
16 Maintenance Issues Routine maintenance costs can be considered to be neutral. A full-width reseal will be carried out as part of the improvements. This has been included in the comparison in costs between the improvements and the Do Minimum.
The current proposals would result in two specific changes to the maintenance regime:
• maintenance and repair of the w-section road safety barriers; and
• maintenance of a wider seal width.
Both these aspects have been included in the economic evaluations of the options.
17 Conclusions and Recommendations A variety of road safety and traffic management improvement options were considered, for which benefits and costs were determined. The expected cost estimate to achieve all of the improvements considered is $1.95M.
Indicative BCRs were derived from predicted crash cost savings alone. For all improvements being carried out, the BCR is 0.9 (5 year crash history) or 2.7 (10 year crash history). The options are such that many can also be considered as standalone, but a BCR for each is not credible to derive.
The economic result indicates that all improvements are viable as a package, underpinned by an 80 km/h speed limit, and this is recommended to be taken forward into the SAR phase.
This report should be read in conjunction with the wider Otaki to North of Levin PFRs, which includes an option in Report No. 12, Four Lane Alignments, for a potential re-routing of SH 1 around Manakau settlement to the west, as well as keeping widening the existing highway to the west, if a historic building can be relocated, as an option to be further considered.
Status: Final February 2013 Project number: Z1925700 Page 19 Our ref: PFR02 Manakau Settlement Final.docx

Report 2: Manakau Settlement Conclusions and Recommendations
Status: Final February 2013 Project number: Z1925700 Page 20 Our ref: PFR02 Manakau Settlement Final.docx

Report 2: Manakau Settlement
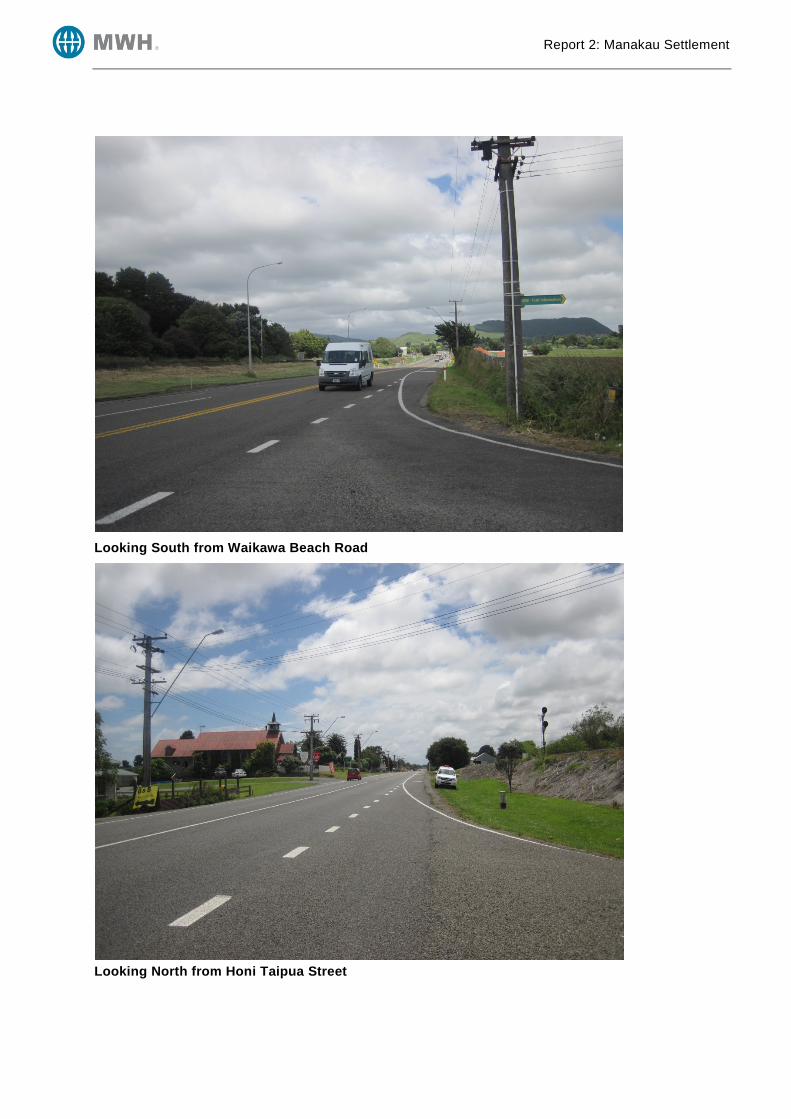
Appendix A Photographs
Report 2: Manakau Settlement
Looking South from Waikawa Beach Road
Looking North from Honi Taipua Street

Report 2: Manakau Settlement
Appendix B Traffic Data

y = 204.96x - 396838
1000
3000
5000
7000
9000
11000
13000
15000
17000
19000
1990 1995 2000 2005 2010 2015
An
nu
al A
ve
rag
e D
ail
y T
raff
ic (
vp
d)
Calendar Year
TRAFFIC GROWTH along SH 1N
OHAU - Telemetry Site
56 - Ohau Overbridge
Otaki, North Waitohu
Stream Bridge
Otaki, North of
Waerenga Rd
Linear (Otaki, North
Waitohu Stream
Bridge
)
-0.4%
1.2%
'01 to '11
'92 to '11
0.4%
1.3%

Report 2: Manakau Settlement
Appendix C Crash Data

CRASH LIST DETAIL REPORT
Run on: 22Nov2012
Oash List Manakau Tow nship 2007 lo 2011 (16 crashes)
Total lnjury Gashes:Total Non-lnjury Crashes
Grash Type
5
11
16
Number /o Grash factors (') Nunùer
Overtaking Gashes:Straight Road Lost Control/Fþad On:
Bend - Lost Control/Head On:
Rear End/Obstruction:
Oossing/Turning:
Fedestrian Crashes:
Miscellaneous Crashes :
TOTAL:
1
2
1
7
4
0
1
16
13
6
13
6
19
13
5613
13
6
2519
6
13
6
44
25
0
6
AlcoholToo fastFailed Givew aylStopOvertakinglncorrect Lane/posnFoor handlingFoor ObservationFoor judgenentFatigueDisabled/old/illVehicle factorsOther
2
1
21
J2o
2
21
43
100%
Location Local road % St.Highway % Total %
Urban
Open road
TOTAL:
0
0
0
0
1615 94
16'15 S4
TOTAL: 32 202%
Crashes w ith a:
Driver factor 25 158 %
EnvironnBntal factor 0 0
(*) factors are counted once against a crash - ie tw ofatigued drivers count as one fatigue crash factor.
Note: Driver/vehicle factors are not available for non-injurycrashes for Northland, Auckiand, Waikato and Bay of Hentybef ore 2007 . This w ill inf luence numbers and percentages.
Gashes w ith objects(s) struck 5 31%
Object Struck Number %
Oiff BankFenceKerblàrked VehicleFost Or tuleRoadw orksTraffic Sign
62%
00 16 100 16100%
lnte rsection/M id block Number %
lntersection:
MidBlock:
TOTAL:
Environmental Factors
4
12
25
75
l6
Nunber
100%
LighVOvercast Oashes:DartdTw ilight Gashes:
TOTAL:
WeUlce:
Dry:
TOTAL:
Day/Period
12
4
75
25
50
50
I8
1
2
1
'l
31
1
6
13
b
o
19o
6
16
3
l3
100%
19
B1
16
Number
100% TOTAL:
Crash NumbersYear
10
Fatal Serious Minor I'lon-lnj%
WeekdayWeekend
TOTAL:
Vehicles
100%
20072008200920102011t6
Number
00000
000
00
2
2
3
40
40
0
0
1
% TOTAL 0 0 5 11
CarVan/UteïruckBusl/otorcycleBicycle
2023
0
1
0
88131306
0
TOTAL: 26 12Oo/.
Note: Percentages represent the 7o of crashes in which the vehicle,cause or object appears,

SH 1N
HONI TAIPUA ST
WI TAKO ST
SH 1N
SH 1N
SH 1N IHAKA HAKUENE ST
WI PERE STWI PERE ST
WAIKAWA BEACH ROAD
KETEMARINGI WAY
TAME PORATI ST
MOKENA KOHERE ST
N
2750867
2953875
2953284
2712706
2712650
2711969
2753755
201112144
2856293
2010516542952904
201056722
2851946
201050628
2713513
201056927
0.25 0 0.250.5Km 0.75Km
KEYFatalDarkWetIcyPedsCyclist
Manakau Settlement
Collision Diagram
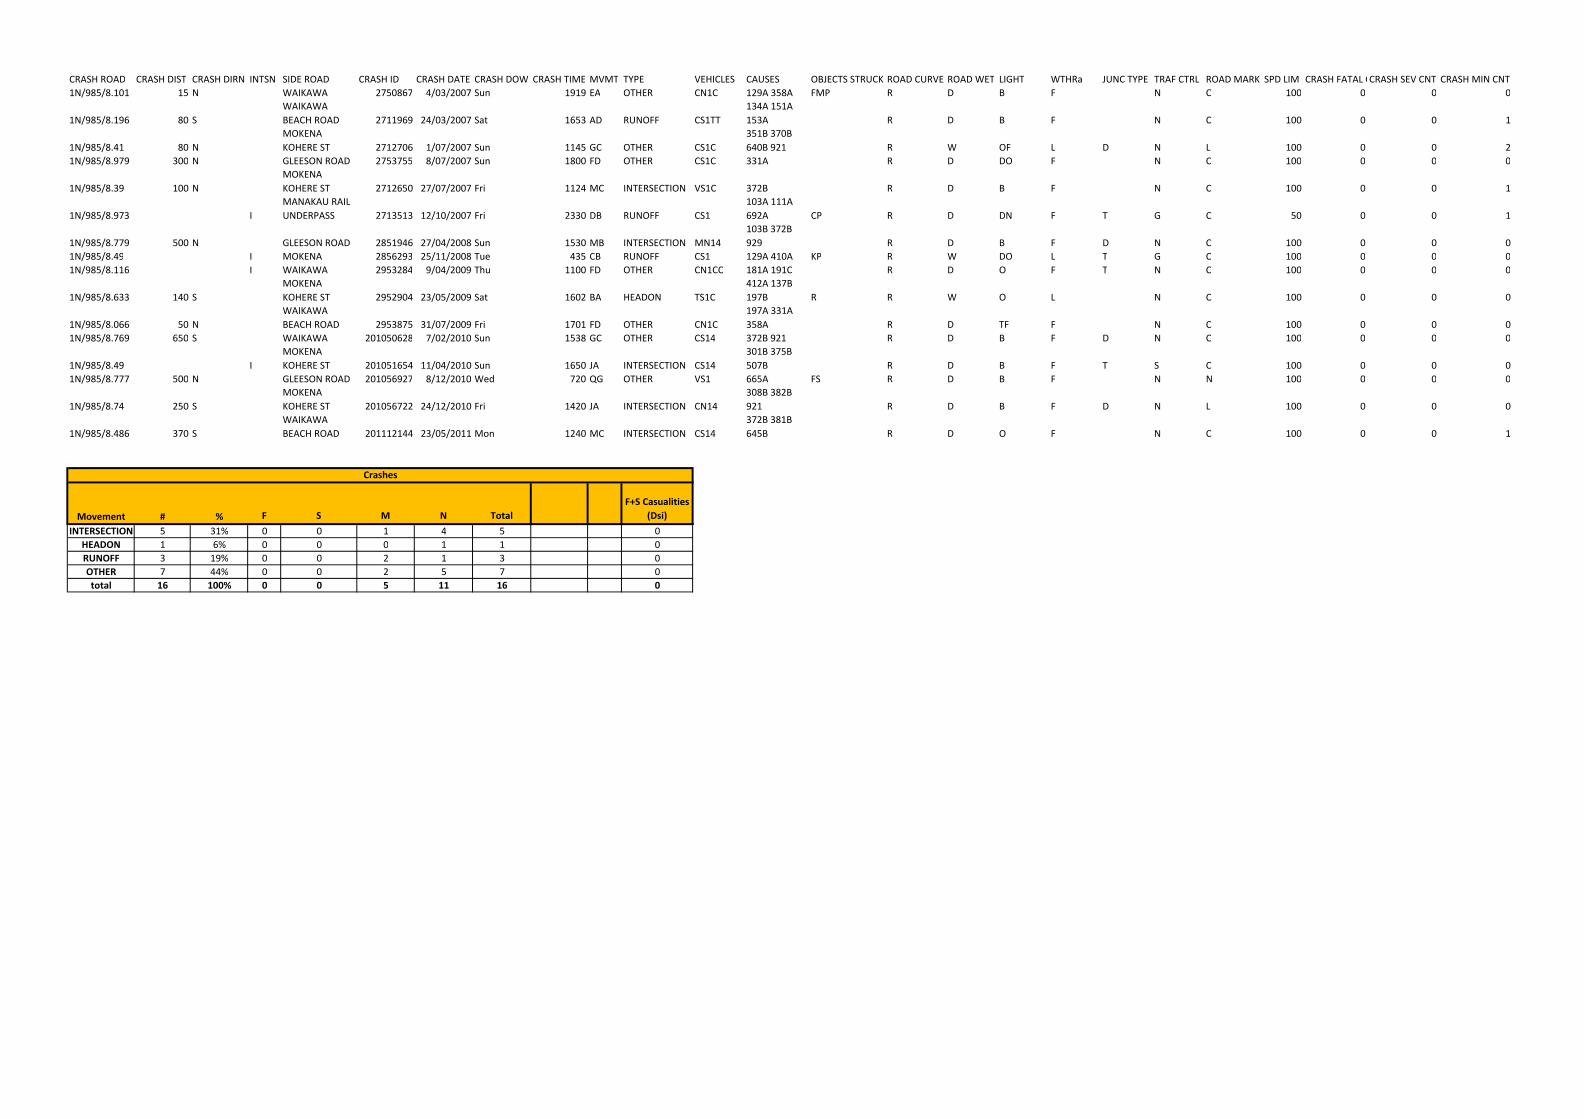
CRASH ROAD CRASH DIST CRASH DIRN INTSN SIDE ROAD CRASH ID CRASH DATE CRASH DOW CRASH TIME MVMT TYPE VEHICLES CAUSES OBJECTS STRUCK ROAD CURVE ROAD WET LIGHT WTHRa JUNC TYPE TRAF CTRL ROAD MARK SPD LIM CRASH FATAL CNTCRASH SEV CNT CRASH MIN CNT
1N/985/8.101 15 N WAIKAWA 2750867 4/03/2007 Sun 1919 EA OTHER CN1C 129A 358A FMP R D B F N C 100 0 0 0
1N/985/8.196 80 S
WAIKAWA
BEACH ROAD 2711969 24/03/2007 Sat 1653 AD RUNOFF CS1TT
134A 151A
153A R D B F N C 100 0 0 1
1N/985/8.41 80 N
MOKENA
KOHERE ST 2712706 1/07/2007 Sun 1145 GC OTHER CS1C
351B 370B
640B 921 R W OF L D N L 100 0 0 2
1N/985/8.979 300 N GLEESON ROAD 2753755 8/07/2007 Sun 1800 FD OTHER CS1C 331A R D DO F N C 100 0 0 0
1N/985/8.39 100 N
MOKENA
KOHERE ST 2712650 27/07/2007 Fri 1124 MC INTERSECTION VS1C 372B R D B F N C 100 0 0 1
1N/985/8.973 I
MANAKAU RAIL
UNDERPASS 2713513 12/10/2007 Fri 2330 DB RUNOFF CS1
103A 111A
692A CP R D DN F T G C 50 0 0 1
1N/985/8.779 500 N GLEESON ROAD 2851946 27/04/2008 Sun 1530 MB INTERSECTION MN14
103B 372B
929 R D B F D N C 100 0 0 0
1N/985/8.49 I MOKENA 2856293 25/11/2008 Tue 435 CB RUNOFF CS1 129A 410A KP R W DO L T G C 100 0 0 0
1N/985/8.116 I WAIKAWA 2953284 9/04/2009 Thu 1100 FD OTHER CN1CC 181A 191C R D O F T N C 100 0 0 0
1N/985/8.633 140 S
MOKENA
KOHERE ST 2952904 23/05/2009 Sat 1602 BA HEADON TS1C
412A 137B
197B R R W O L N C 100 0 0 0
1N/985/8.066 50 N
WAIKAWA
BEACH ROAD 2953875 31/07/2009 Fri 1701 FD OTHER CN1C
197A 331A
358A R D TF F N C 100 0 0 0
1N/985/8.769 650 S WAIKAWA 201050628 7/02/2010 Sun 1538 GC OTHER CS14 372B 921 R D B F D N C 100 0 0 0
1N/985/8.49 I
MOKENA
KOHERE ST 201051654 11/04/2010 Sun 1650 JA INTERSECTION CS14
301B 375B
507B R D B F T S C 100 0 0 0
1N/985/8.777 500 N GLEESON ROAD 201056927 8/12/2010 Wed 720 QG OTHER VS1 665A FS R D B F N N 100 0 0 0
1N/985/8.74 250 S
MOKENA
KOHERE ST 201056722 24/12/2010 Fri 1420 JA INTERSECTION CN14
308B 382B
921 R D B F D N L 100 0 0 0
1N/985/8.486 370 S
WAIKAWA
BEACH ROAD 201112144 23/05/2011 Mon 1240 MC INTERSECTION CS14
372B 381B
645B R D O F N C 100 0 0 1
Movement # % F S M N Total
F+S Casualities
(Dsi)
INTERSECTION 5 31% 0 0 1 4 5 0
HEADON 1 6% 0 0 0 1 1 0
RUNOFF 3 19% 0 0 2 1 3 0
OTHER 7 44% 0 0 2 5 7 0
total 16 100% 0 0 5 11 16 0
Crashes

Report 2: Manakau Settlement
Appendix D Outline Plans


Report 2: Manakau Settlement
Appendix E Cost Estimates
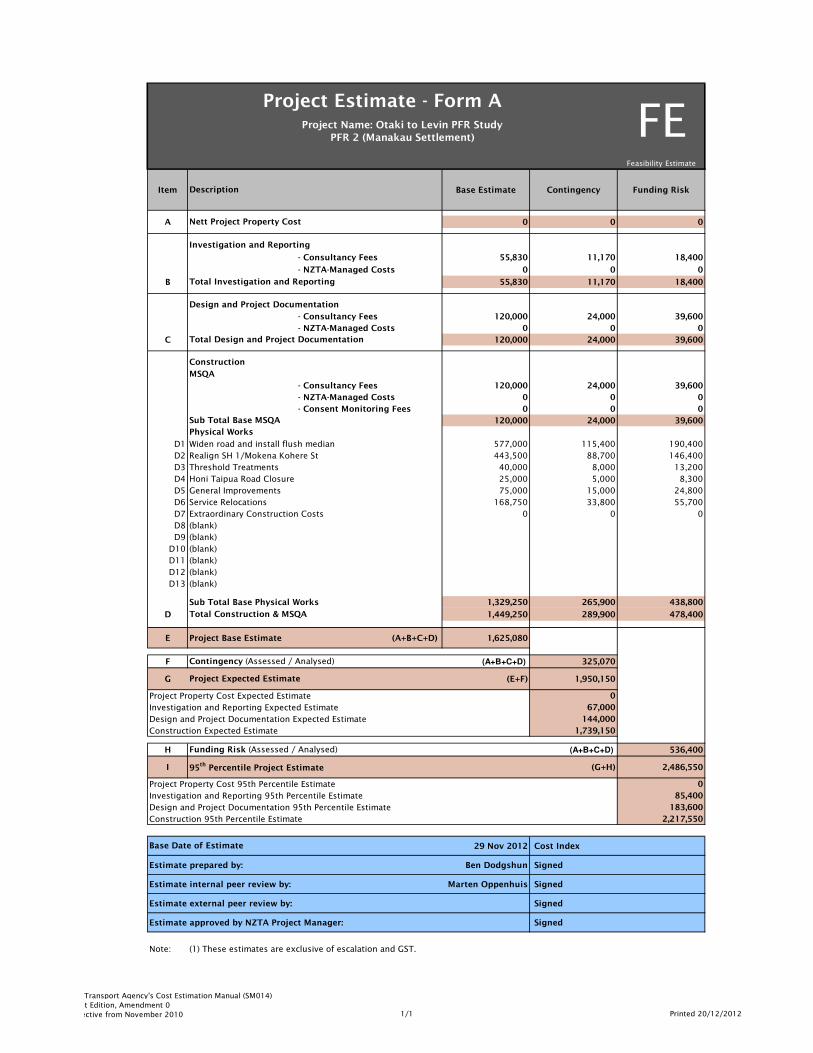
Feasibility Estimate
Item Base Estimate Contingency Funding Risk
A 0 0 0
- Consultancy Fees 55,830 11,170 18,400
- NZTA-Managed Costs 0 0 0
B 55,830 11,170 18,400
- Consultancy Fees 120,000 24,000 39,600
- NZTA-Managed Costs 0 0 0
C 120,000 24,000 39,600
MSQA
- Consultancy Fees 120,000 24,000 39,600
- NZTA-Managed Costs 0 0 0
- Consent Monitoring Fees 0 0 0
120,000 24,000 39,600
D1 Widen road and install flush median 577,000 115,400 190,400
D2 Realign SH 1/Mokena Kohere St 443,500 88,700 146,400
D3 Threshold Treatments 40,000 8,000 13,200
D4 Honi Taipua Road Closure 25,000 5,000 8,300
D5 General Improvements 75,000 15,000 24,800
D6 Service Relocations 168,750 33,800 55,700
D7 Extraordinary Construction Costs 0 0 0
D8 (blank)
D9 (blank)
D10 (blank)
D11 (blank)
D12 (blank)
D13 (blank)
Sub Total Base Physical Works 1,329,250 265,900 438,800
D 1,449,250 289,900 478,400
E Project Base Estimate (A+B+C+D) 1,625,080
F (A+B+C+D) 325,070
G (E+F) 1,950,150
Project Property Cost Expected Estimate 0
Investigation and Reporting Expected Estimate 67,000
Design and Project Documentation Expected Estimate 144,000
Construction Expected Estimate 1,739,150
H (A+B+C+D) 536,400
I (G+H) 2,486,550
Project Property Cost 95th Percentile Estimate 0
Investigation and Reporting 95th Percentile Estimate 85,400
Design and Project Documentation 95th Percentile Estimate 183,600
Construction 95th Percentile Estimate 2,217,550
29 Nov 2012 Cost Index
Estimate prepared by: Ben Dodgshun Signed
Estimate internal peer review by: Marten Oppenhuis Signed
Estimate external peer review by: Signed
Estimate approved by NZTA Project Manager: Signed
Note: (1) These estimates are exclusive of escalation and GST.
Contingency (Assessed / Analysed)
Project Expected Estimate
Project Estimate - Form AProject Name: Otaki to Levin PFR Study
PFR 2 (Manakau Settlement)
Physical Works
Nett Project Property Cost
Investigation and Reporting
FE
Base Date of Estimate
Total Design and Project Documentation
Total Construction & MSQA
Total Investigation and Reporting
Design and Project Documentation
Construction
Description
Sub Total Base MSQA
95th Percentile Project Estimate
Funding Risk (Assessed / Analysed)
NZ Transport Agency's Cost Estimation Manual (SM014)
First Edition, Amendment 0
Effective from November 2010 1/1 Printed 20/12/2012

Report 2: Manakau Settlement
Appendix F Economic Analysis Worksheets

Simplified Procedure 3 - General Road Improvements
GENERAL ROADING IMPROVEMENT WORKS: 5 year crash historyEVALUATION SUMMARY WORKSHEET 1
1 Evaluator(s) Ben DodgshunReviewer(s) David Wanty
2 Project / Package Details
Approved Organisation NameProject / Package NameYour ReferenceProject DescriptionDescribe the problem to be addressed
3 Location
Brief description of location
4 Alternatives and Options
Describe the Do Minimum
Summarise the options assessed
5 TimingTime Zero (assumed construction start date)Expected duration of construction (Months)
6 Economic EfficiencyDate economic evaluation completed (mm/yyyy)Base date for costsAADT at Time Zero
Traffic Growth Rate at Time Zero (%)
Existing Roughness IRI or NAASRA Existing Traffic Speed km/hrPredicted Roughness IRI or NAASRA Predicted Traffic Speed km/hrLength of Job Before Improvements km Posted Speed Limit km/hrLength of Job After Improvements km Road TypeLength of new highway km Gradient Before Improvements
Length of existing highway used km Gradient After Improvements
7 A
8 B
9 Benefit values from Worksheet 4, 5 or 6
PV Travel Time Cost savings: $ C x Update FactorTT= $ W
PV VOC & CO2 savings: x Update FactorVOC
PV Accident Cost savings: x Update FactorAC
PV Passing Lane savings: x Update FactorAC
10 =
11
2.70 800.86
1%0.86
0.86
0 -
B/C Ratio =
$
BENEFITS
$0
Z
Y= $ NIL
$1,812,741
1.04D
X
2019168 - 94162FYRR = 1st Year BENEFITS
COSTS==
PV Cost of Do Minimum Cost $ $94,162
$0 1.33 NIL
PV Cost of the preferred Option Cost $ $2,019,168
(est)
Rural Strategic1%
100
100
0 -
0.08[(0+0)/12.09+1812741/10.97] x 0.9259
0.9
= $E
=
COSTS
= $ NIL
B - A
W + Y + Z 0 + 0 + 1812741 + 0
$ $1,549,351
2019168 - 94162
1.17
=
$ $0 F 1.00
1 July 20136
Shoulder widening and flush median installation; intersection closure and re-routing; intersection realignment; roadside hazard mitigation
NZTAOtaki to Levin: Manakau Township PFR80500802Safety ImprovementsReduce crashes & improve community comfort
Scheduled maintenance
State Highway 1, north of Waikawa Beach Road to south of Honi Taipua Road, SH 1N-985/8.12 to 985/8.98
2.70
30 November 20121 July 2012
150001.2%
File SP3_Manakau_Township_ver2.xlsx, Worksheet WS 1 - 5yr crash
17/12/2012 3:25 p.m. Page 1 of 1
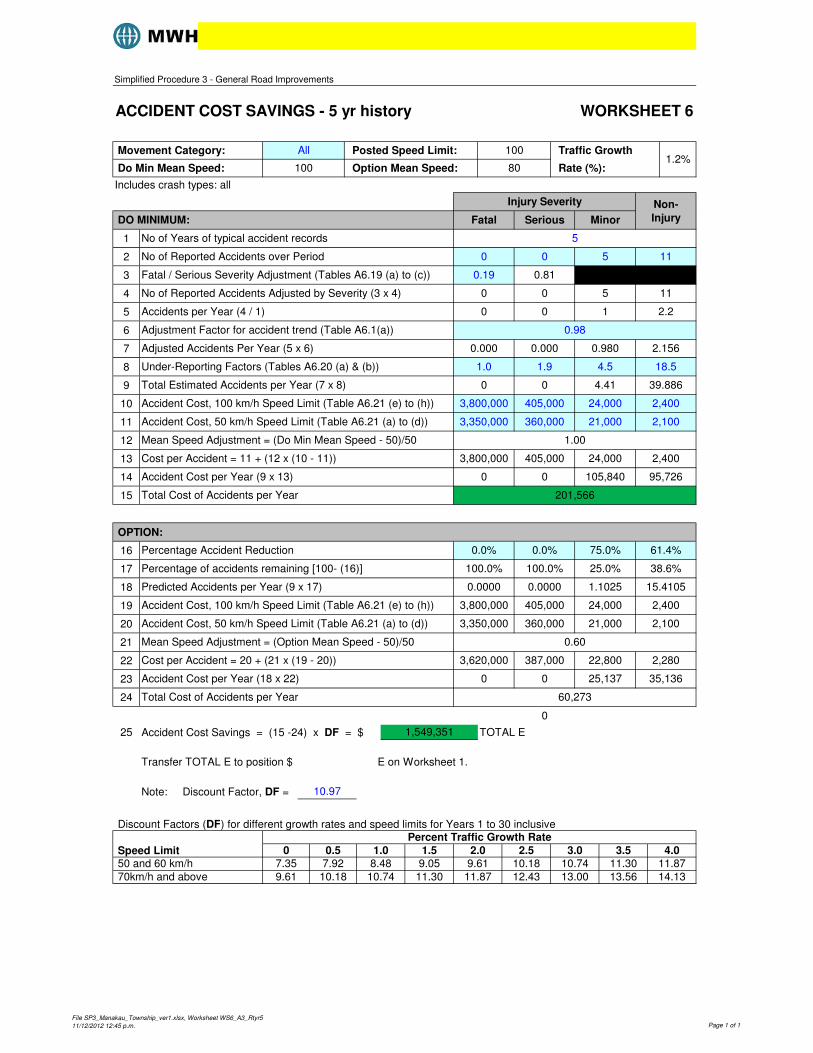
Simplified Procedure 3 - General Road Improvements
ACCIDENT COST SAVINGS - 5 yr history WORKSHEET 6
Includes crash types: all
1
2
3
4
5
6
7
8
9
10
11
12
13
14
15
OPTION:
16
17
18
19
20
21
22
23
24
0
25 Accident Cost Savings = (15 -24) x DF = $ TOTAL E
Transfer TOTAL E to position $ E on Worksheet 1.
Note: Discount Factor, DF =
Discount Factors (DF) for different growth rates and speed limits for Years 1 to 30 inclusive
70km/h and above 9.61 10.18 10.74 11.30 50 and 60 km/h 7.35 7.92 8.48 9.05
11.87 12.43 13.00 13.56
4.0
14.139.61 10.18 10.74 11.30 11.87
1,549,351
10.97
Speed Limit
Percent Traffic Growth Rate0 0.5 1.0 1.5 2.0 2.5 3.0 3.5
Accident Cost per Year (18 x 22) 0 0 25,137 35,136
Total Cost of Accidents per Year 60,273
Mean Speed Adjustment = (Option Mean Speed - 50)/50 0.60
Cost per Accident = 20 + (21 x (19 - 20)) 3,620,000 387,000 22,800 2,280
Accident Cost, 100 km/h Speed Limit (Table A6.21 (e) to (h)) 3,800,000 405,000 24,000 2,400
Accident Cost, 50 km/h Speed Limit (Table A6.21 (a) to (d)) 3,350,000 360,000 21,000 2,100
Percentage of accidents remaining [100- (16)] 100.0% 100.0% 25.0% 38.6%
Predicted Accidents per Year (9 x 17) 0.0000 0.0000 1.1025 15.4105
Total Cost of Accidents per Year 201,566
Percentage Accident Reduction 0.0% 0.0% 75.0% 61.4%
Cost per Accident = 11 + (12 x (10 - 11)) 3,800,000 405,000 24,000 2,400
Accident Cost per Year (9 x 13) 0 0 105,840 95,726
Accident Cost, 50 km/h Speed Limit (Table A6.21 (a) to (d)) 3,350,000 360,000 21,000 2,100
Mean Speed Adjustment = (Do Min Mean Speed - 50)/50 1.00
Total Estimated Accidents per Year (7 x 8) 0 0 4.41 39.886
Accident Cost, 100 km/h Speed Limit (Table A6.21 (e) to (h)) 3,800,000 405,000 24,000 2,400
Adjusted Accidents Per Year (5 x 6) 0.000 0.000 0.980 2.156
Under-Reporting Factors (Tables A6.20 (a) & (b)) 1.0 1.9 4.5 18.5
Accidents per Year (4 / 1) 0 0 1 2.2
Adjustment Factor for accident trend (Table A6.1(a)) 0.98
Fatal / Serious Severity Adjustment (Tables A6.19 (a) to (c)) 0.19 0.81
No of Reported Accidents Adjusted by Severity (3 x 4) 0 0 5 11
No of Years of typical accident records 5
No of Reported Accidents over Period 0 0 5 11
Rate (%):
Injury Severity Non-
DO MINIMUM: Fatal Serious Minor Injury
Movement Category: All Posted Speed Limit: 100 Traffic Growth1.2%
Do Min Mean Speed: 100 Option Mean Speed: 80
File SP3_Manakau_Township_ver1.xlsx, Worksheet WS6_A3_Rtyr5
11/12/2012 12:45 p.m. Page 1 of 1

Simplified Procedure 3 - General Road Improvements
GENERAL ROADING IMPROVEMENT WORKS: 10 year crash historyEVALUATION SUMMARY WORKSHEET 1
1 Evaluator(s) Ben DodgshunReviewer(s) David Wanty
2 Project / Package Details
Approved Organisation NameProject / Package NameYour ReferenceProject DescriptionDescribe the problem to be addressed
3 Location
Brief description of location
4 Alternatives and Options
Describe the Do Minimum
Summarise the options assessed
5 TimingTime Zero (assumed construction start date)Expected duration of construction (Months)
6 Economic EfficiencyDate economic evaluation completed (mm/yyyy)Base date for costsAADT at Time ZeroTraffic Growth Rate at Time Zero (%)
Existing Roughness IRI or NAASRA Existing Traffic Speed km/hrPredicted Roughness IRI or NAASRA Predicted Traffic Speed km/hrLength of Job Before Improvements km Posted Speed Limit km/hrLength of Job After Improvements km Road TypeLength of new highway km Gradient Before Improvements
Length of existing highway used km Gradient After Improvements
7 A
8 B
9 Benefit values from Worksheet 4, 5 or 6
PV Travel Time Cost savings: $ C x Update FactorTT= $ W
PV VOC & CO2 savings: x Update FactorVOC
PV Accident Cost savings: x Update FactorAC
PV Passing Lane savings: x Update FactorAC
10 =
11z
State Highway 1, north of Waikawa Beach Road to south of Honi Taipua Road, SH 1N-985/8.12 to 985/8.98
NZTAOtaki to Levin: Manakau Township PFR80500802Safety ImprovementsReduce crashes & improve community comfort
2.70 80
Scheduled maintenance
Shoulder widening and flush median installation; intersection closure and re-routing; intersection realignment; roadside hazard mitigation
1 July 20136
30 November 20121 July 2012
150001.2%
2.70 100 (est)
0.86 1000.86 Rural Strategic
0 - 1%0.86 0 - 1%
PV Cost of Do Minimum Cost $ $94,162
PV Cost of the preferred Option Cost $ $2,019,168
$0 1.33 NIL
Y
$ $4,475,003 E 1.17 = $ $5,235,753 Z
$ $0 D 1.04 = $ NIL
X
B/C Ratio = W + Y + Z = BENEFITS 0 + 0 + 5235753 + 0 =2.7
B - A COSTS
$ $0 F 1.00 = $ NIL
0.23COSTS 2019168 - 94162
2019168 - 94162
FYRR = 1st Year BENEFITS = [(0+0)/12.09+5235753/10.97] x 0.9259 =
File SP3_Manakau_Township_ver2.xlsx, Worksheet WS 1 - 10yr crash
17/12/2012 3:45 p.m. Page 1 of 1

Simplified Procedure 3 - General Road Improvements
ACCIDENT COST SAVINGS - 10 yr history WORKSHEET 6
Includes crash types: all
1
2
3
4
5
6
7
8
9
10
11
12
13
14
15
OPTION:
16
17
18
19
20
21
22
23
24
0
25 Accident Cost Savings = (15 -24) x DF = $ TOTAL E
Transfer TOTAL E to position $ E on Worksheet 1.
Note: Discount Factor, DF =
Discount Factors (DF) for different growth rates and speed limits for Years 1 to 30 inclusive
Movement Category: All Posted Speed Limit: 80 Traffic Growth1.2%
Do Min Mean Speed: 100 Option Mean Speed: 80
No of Years of typical accident records 10
No of Reported Accidents over Period 0 3 7 18
Rate (%):
Injury Severity Non-
DO MINIMUM: Fatal Serious Minor Injury
Accidents per Year (4 / 1) 0.057 0.243 0.7 1.8
Adjustment Factor for accident trend (Table A6.1(a)) 0.98
Fatal / Serious Severity Adjustment (Tables A6.19 (a) to (c)) 0.19 0.81
No of Reported Accidents Adjusted by Severity (3 x 4) 0.57 2.43 7 18
Adjusted Accidents Per Year (5 x 6) 0.056 0.238 0.686 1.764
Under-Reporting Factors (Tables A6.20 (a) & (b)) 1.0 1.9 4.5 18.5
Accident Cost, 50 km/h Speed Limit (Table A6.21 (a) to (d)) 3,350,000 360,000 21,000 2,100
Mean Speed Adjustment = (Do Min Mean Speed - 50)/50 1.00
Total Estimated Accidents per Year (7 x 8) 0.05586 0.452466 3.087 32.634
Accident Cost, 100 km/h Speed Limit (Table A6.21 (e) to (h)) 3,800,000 405,000 24,000 2,400
Total Cost of Accidents per Year 547,926
Percentage Accident Reduction 75.0% 75.0% 75.0% 62.5%
Cost per Accident = 11 + (12 x (10 - 11)) 3,800,000 405,000 24,000 2,400
Accident Cost per Year (9 x 13) 212,268 183,249 74,088 78,322
Percentage of accidents remaining [100- (16)] 25.0% 25.0% 25.0% 37.5%
Predicted Accidents per Year (9 x 17) 0.0140 0.1131 0.7718 12.2378
Accident Cost, 100 km/h Speed Limit (Table A6.21 (e) to (h)) 3,800,000 405,000 24,000 2,400
Accident Cost, 50 km/h Speed Limit (Table A6.21 (a) to (d)) 3,350,000 360,000 21,000 2,100
Accident Cost per Year (18 x 22) 50,553 43,776 17,596 27,902
Total Cost of Accidents per Year 139,827
Mean Speed Adjustment = (Option Mean Speed - 50)/50 0.60
Cost per Accident = 20 + (21 x (19 - 20)) 3,620,000 387,000 22,800 2,280
4,475,003
10.97
Speed Limit
Percent Traffic Growth Rate0 0.5 1.0 1.5 2.0 2.5 3.0 3.5
11.87 12.43 13.00 13.56
4.0
14.139.61 10.18 10.74 11.30 11.87
70km/h and above 9.61 10.18 10.74 11.30 50 and 60 km/h 7.35 7.92 8.48 9.05
File SP3_Manakau_Township_ver1.xlsx, Worksheet WS6_A4_Rtyr10
11/12/2012 12:46 p.m. Page 1 of 1

Report 2: Manakau Settlement
Appendix G Speed Limit Warrant Survey

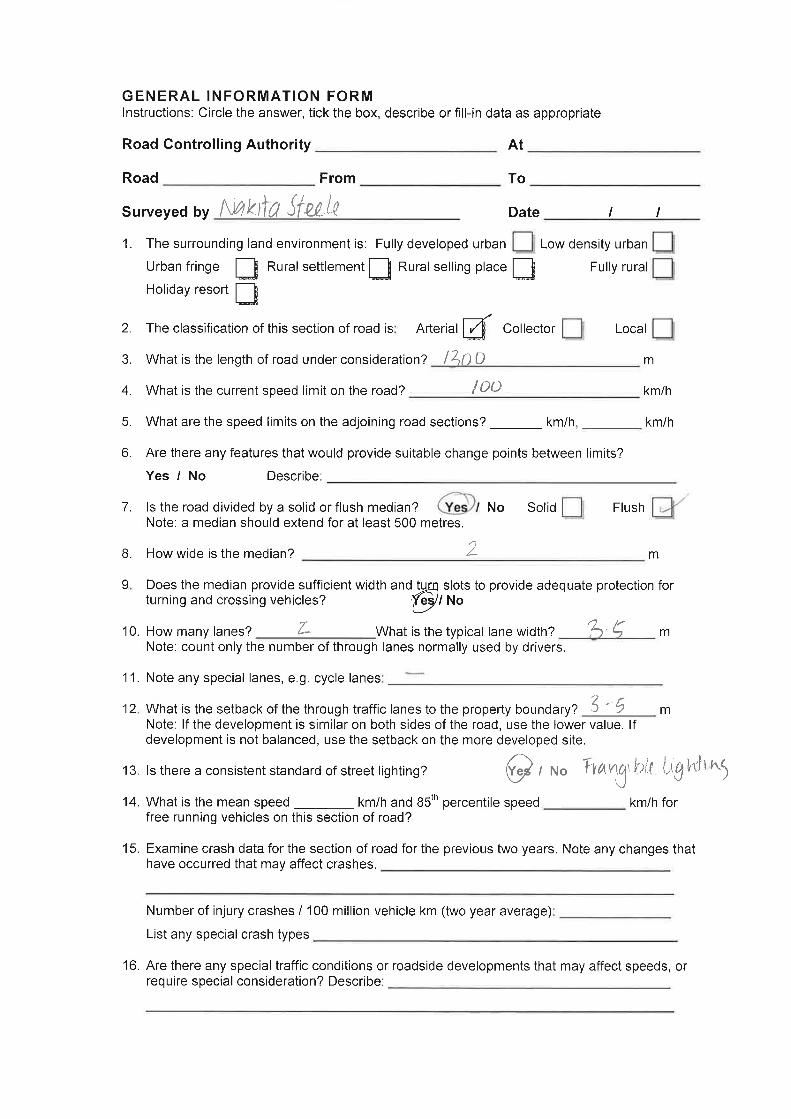


thh' - L<*¿ PFß't
@Ð MWH l/^rt/ ,o*rn-, I
ef'//uine AEEtrEEwoatD VOHEOKED BY nÀïF
SHEET IOF
t{ q z ?ar ? q e 'l sl I
I a¿'à,t F,
.G {. t È I ¿s
Jh I (q a1
.ê A 2 J 7 4 7 I
".1o? ^J:J â. J ?2 \¡ 6
It,,< r s e-a
Li
trL ?. I ¡É ot l- s, É,¡ aj
A.^ L<_ +a.R (, n rE-t tt
-)a e
'a2 tafu J?'l t7 ,l ta T , ^c tr ê R fIâa0t l¡ ( ) L, tr r 2C s
ú


