Manchester Computing Supercomputing, Visualization & e-Science OntoGrid GridPrimer Training University of Manchester 18 th to 22 nd October 2004 ConvertGrid: Cross-Referencing Data held in Different Geographies National Centre for eSocial Science (NCeSS)
Transcript
Man
ch
este
r C
om
pu
tin
gSup
erc
om
puti
ng,
Vis
ualiz
ati
on &
e-S
cien
ce
OntoGrid GridPrimer TrainingUniversity of Manchester18th to 22nd October 2004
ConvertGrid:Cross-Referencing Data held
in Different Geographies
National Centre for eSocial Science (NCeSS)
Supercomputing, Visualization & e-Science2
Acknowledgements
Who’s doing the work?– Pascal Ekin– Linda Mason
Who’s paying?– ESRC Grant Reference RES-149-25-0008
Who’s helping?– Keith Cole– Justin Hayes– Jon MacLaren– Stephen Pickles
Supercomputing, Visualization & e-Science3
What’s it all about?
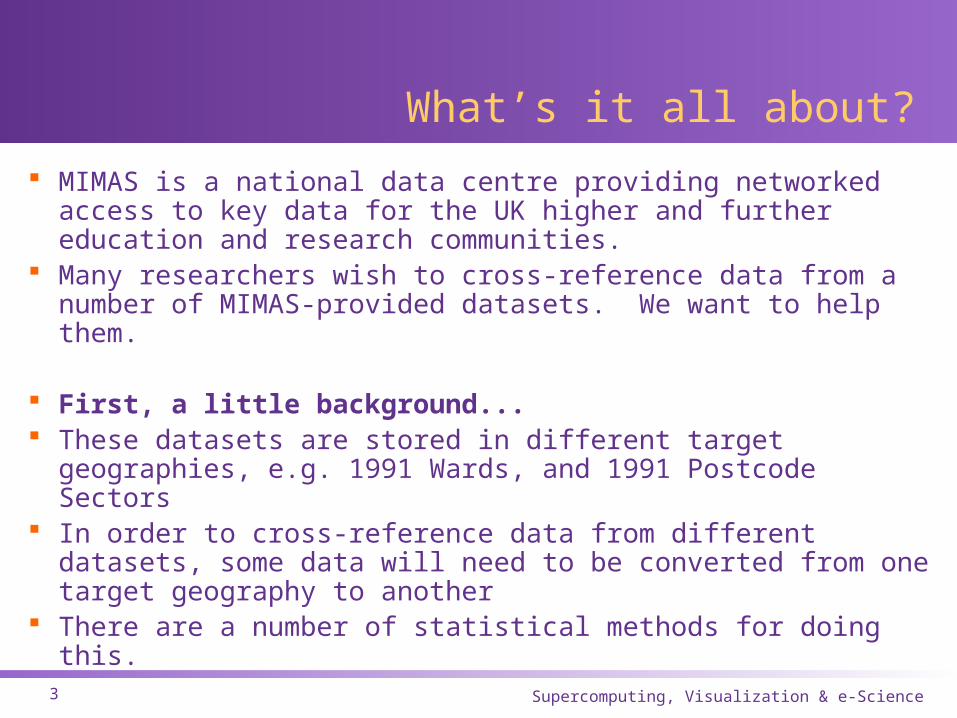
MIMAS is a national data centre providing networked access to key data for the UK higher and further education and research communities.
Many researchers wish to cross-reference data from a number of MIMAS-provided datasets. We want to help them.
First, a little background... These datasets are stored in different target geographies,
e.g. 1991 Wards, and 1991 Postcode Sectors In order to cross-reference data from different datasets,
some data will need to be converted from one target geography to another
There are a number of statistical methods for doing this.
Supercomputing, Visualization & e-Science4
1991 Postcode Sectors
Different Geographies
1991 Wards
Source: Office for National Statistics
Supercomputing, Visualization & e-Science5
The “Convert” Project
The MIMAS helpdesk used to get many queries from people trying to do this themselves, identifying this as a common problem facing many researchers
These researchers would need to prepare their own conversion tables, leading to many people replicating the same, labour-intensive work
So, 225 UK-wide Geography conversion tables were developed as part of the “Updated UK Area Masterfiles” project (ESRC award H507255164)
See also: http://www.ccsr.ac.uk/research/lookup.htm
Supercomputing, Visualization & e-Science6
Creating the Convert Tables
Postcodes were used as an intermediary to construct geography conversion tables as indicated in the diagram. Where the All Fields Postcode Directory (AFPD) indicates that all the postcodes in a source geography unit lie within one target geography unit (A), the conversion table has a single record for that source unit, with weight one. Where the source unit contains residential postcodes allocated to different target units (B), the AFPD provides a weight based on the number of residential addresses in the overlap of the source unit and target geography units.
Source:
“Summary of Research Results: Updated UK Area Masterfiles”
ESRC award H507255164
Completed March 2001
Supercomputing, Visualization & e-Science7
What next?
These conversion tables form the basis for the Convert system, available at: http://convert.mimas.ac.uk/, where data supplied in one target geography can be converted to another.
Since its inception, the Convert service has been very popular (this year: 400 web page hits per month)
But...many researchers using this service are performing a common set of steps, namely:1. Extract data from a number of datasets2. Convert each set of data to the desired geography3. Combine the converted sets into a single set of data
Makes sense to provide a service to automate this labour-intensive process. That’s what ConvertGrid will do.
Supercomputing, Visualization & e-Science8
Why use the “Grid” to do this?
Grid computing has been defined as “distributed computing across organizational boundaries” – why is this useful?
Grid technologies provide real Single Sign-On, similar to ATHENS authentication, but more general.
By Grid-enabling the datasets we encourage others to do the same – this is vital to the development of a real Grid.
Grid has good solutions for remote database access, e.g. OGSA-DAI which allows for encrypted transfer.
Also have distributed query processing (DQP) technology not currently available in commercial products
Supercomputing, Visualization & e-Science10
What the researcher is using...
DA
ISG
R
(DA
I Service
Group R
egistry)
Com
monG
IS A
pplet
Grid S
ecurity Infrastructure
Globus T
oolkit Core
Axis
Apache T
omcat
ConvertG
rid Web
Service
Axis
Apache T
omcat
https https
SS
L
SS
L
SS
L
SS
L
Athens
authentication
2001 C
ensus O
NS
E
xperian P
ostcode C
onvert T
ables
OG
SA
-DA
I
Client to W
S n°2
Com
mand L
ine Client
Client to W
S n° 1
Website
X509
Supercomputing, Visualization & e-Science11
What the researcher sees...
Households with 2 or more cars in Greater London and Greater Manchester, from the 1991 Census, displayed by Ward
Supercomputing, Visualization & e-Science13
Scenario 1 – Education Theme University administrator wishing to profile
newly enrolled students in line with new ‘Widening Participation’ legislation
Target geography – 1998 ward Datasets required:
– User’s own dataset of postcode of student’s home residence.
– Neighbourhood Statistics 1998 data• Population estimates (1998 ward)
• University admissions by place of residence(1998 ward)
– 1991 Census• Total population (1991 ward)
• Social class (1991 ward)
• Educational attainment (1991 ward)
– Experian 1999 supply• Total population (1999 PCS)
• Population in MOSAIC Group A (1999 PCS)
Supercomputing, Visualization & e-Science14
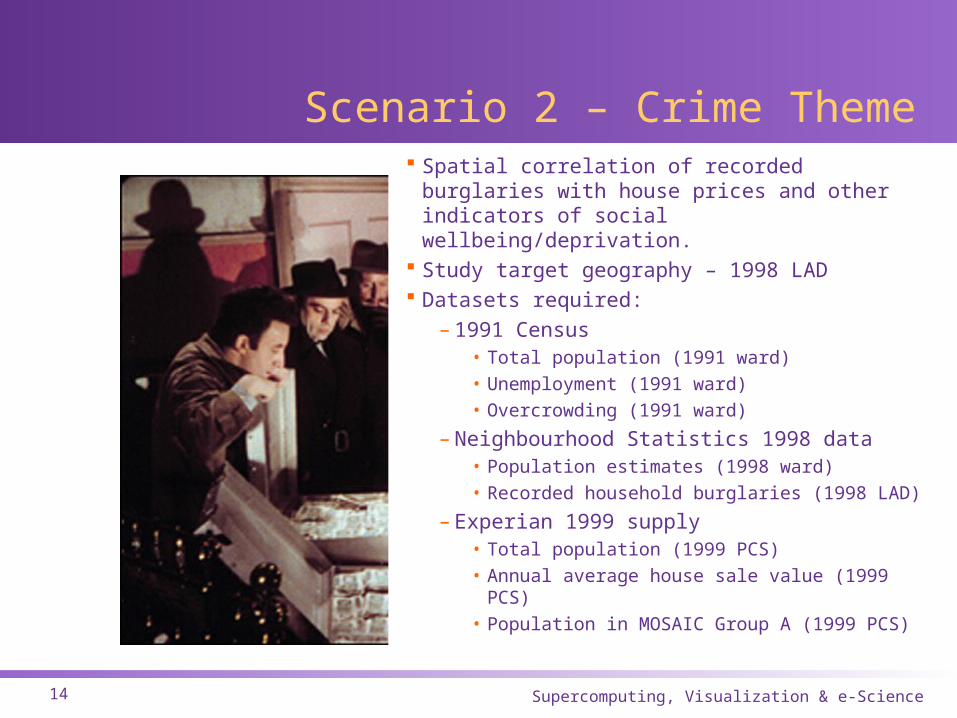
Scenario 2 – Crime Theme Spatial correlation of recorded burglaries with
house prices and other indicators of social wellbeing/deprivation.
Study target geography – 1998 LAD Datasets required:
– 1991 Census• Total population (1991 ward)• Unemployment (1991 ward)• Overcrowding (1991 ward)
– Neighbourhood Statistics 1998 data• Population estimates (1998 ward)• Recorded household burglaries (1998 LAD)
– Experian 1999 supply• Total population (1999 PCS)• Annual average house sale value (1999 PCS)• Population in MOSAIC Group A (1999 PCS)
Supercomputing, Visualization & e-Science15
Scenario 3 – Health Theme Health researcher wishing to look for relations
between incidence of coronary heart disease and other demographic factors.
Study target geography – 1998 Primary Care Group Datasets required:
– 1991 Census• Total population (1991 ward)• Limiting Long Term Illness (1991 ward)• Unemployment (1991 ward)• Ethnicity (1991 ward)