26
Manipulating Spatio-temporal Environmental Data in R Using the ncdf package Jon Hobbs UseR! 2007 August 9 http://www.public.iastate.edu/ ∼ jonhobbs/user 1 / 26
| Date post: | 03-May-2018 |
| Category: |
Documents |
| Upload: | vuongduong |
| View: | 214 times |
| Download: | 1 times |

Manipulating Spatio-temporalEnvironmental Data in R
Using the ncdf package
Jon Hobbs
UseR! 2007August 9
http://www.public.iastate.edu/∼jonhobbs/user
1 / 26

Outline
Environmental Datasets
NetCDF
The ncdf Package
Discussion
2 / 26

Outline
Environmental Datasets
NetCDF
The ncdf Package
Discussion
3 / 26

Environmental Data
• Characteristics of environmental datasets,especially in meteorology and oceanography
• Spatial fields - regular or irregular, possibly 3D• Observations across time• Multivariate - e.g., temperature, wind, pressure
• Bookkeeping is important• Observation Locations• Observation Times• Measurement Units
• Large datasets
4 / 26

Data Storage/Access
• A “standard” data format could be useful
• Some desirable qualities• Self-describing data files• Handle space and time in a reasonable way• Efficient storage
• Data access should be• Fast (relatively)• Piecewise, if desired
5 / 26

Example - Data Expo
• 2006 Data Exposition used data derived fromNASA satellite observations
• Monthly observations from January, 1995 -December 2000
• Spatial domain is a regular grid of 24× 24locations
• Seven variables• Ozone• Surface pressure• Two temperature measurements• Cloud cover at three vertical levels
6 / 26
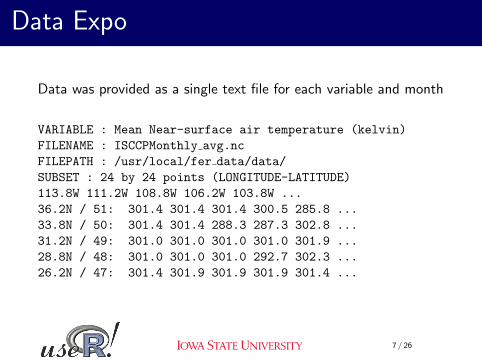
Data Expo
Data was provided as a single text file for each variable and month
VARIABLE : Mean Near-surface air temperature (kelvin)FILENAME : ISCCPMonthly avg.ncFILEPATH : /usr/local/fer data/data/SUBSET : 24 by 24 points (LONGITUDE-LATITUDE)113.8W 111.2W 108.8W 106.2W 103.8W ...36.2N / 51: 301.4 301.4 301.4 300.5 285.8 ...33.8N / 50: 301.4 301.4 288.3 287.3 302.8 ...31.2N / 49: 301.0 301.0 301.0 301.0 301.9 ...28.8N / 48: 301.0 301.0 301.0 292.7 302.3 ...26.2N / 47: 301.4 301.9 301.9 301.9 301.4 ...
7 / 26

Data Expo
• The data format is nice for looking at spatialfields of individual variables.
• Other combinations take some work• Time Series at individual locations• Relationships between variables
• A little programming can get the data intodifferent desirable formats.
• Can we get around this?
8 / 26

Outline
Environmental Datasets
NetCDF
The ncdf Package
Discussion
9 / 26

NetCDF
• The Network Common Data Form, managed byUnidata, provides an approach to organizing andstoring multivariate space-time data.http://www.unidata.ucar.edu/software/netcdf
• From Unidata:NetCDF is a set of software libraries andmachine-independent data formats thatsupport the creation, access, and sharingof array-oriented scientific data.
10 / 26

NetCDF Fundamentals
• The NetCDF core is a set of C and Fortranlibraries, which are prerequisites for higher-levelinterfaces.
• NetCDF data files are platform-independentbinary files.
• A data file contains a header, or metadata, thatdescribes the file contents.
• Extension is usually “.nc”
11 / 26

NetCDF Fundamentals
• A NetCDF file has some key components
• Dimensions• Reference spatial dimensions and time• Each dimension has a specified length• One dimension can have “unlimited” length• Data Expo dimensions are X (east-west), Y (north-south) and
time
• Attributes• Strings describing measurement units, long names, or
observation times• Numerical values giving valid variable minima and maxima
12 / 26

NetCDF Components
• Variables• Each variable has a specific ordering of dimensions defining
how data is stored and accessed• Each variable has a data type (float, integer, character, etc.)• Data Expo NetCDF file has 10 variables - satellite variables
plus elevation, latitude, longitude• Elevation is a float (single precision) with dimensions (X,Y)
13 / 26

Outline
Environmental Datasets
NetCDF
The ncdf Package
Discussion
14 / 26

The ncdf Package
• At last check, three contributed R packagesutilize NetCDF
• ncdf• ncvar• RNetCDF
• All three require installation of the UnidataNetCDF libraries first.
• ncvar requires RNetCDF
15 / 26

The ncdf Package
• The ncdf provides high-level read/writecapability for NetCDF files in R.
• Written by David Piercehttp://cirrus.ucsd.edu/∼pierce/ncdf
• Installation• Mac/Linux: Define path to NetCDF libraries/includes• Windows: Copy NetCDF dlls to ncdf library directory
• ncdf objects are returned with calls toopen.ncdf or create.ncdf
16 / 26

Working with ncdf
> library(ncdf)> nc1 = open.ncdf("expo.nc")> print(nc1)"file expo.nc has 3 dimensions:""X Size: 24""Y Size: 24""Month Size: 72""------------------------""file expo.nc has 10 variables:""float cloudhigh[X,Y,Month]"..."float temperature[X,Y,Month]""float elevation[X,Y]""float latitude[Y]"
"float longitude[X]"
17 / 26

Working with ncdf
• Functions in ncdf are combinations of NetCDFcomponents and actions
• Components• Dimensions - dim• Attributes - att• Variables - var
• Actions• Define - def• Read - get• Write - put
• dim.def.ncdf creates a new dimension• get.var.ncdf reads a variable into an R array
18 / 26

Data Expo
> oz = get.var.ncdf(nc1,"ozone")> dim(oz)[1] 24 24 72> lat = get.var.ncdf(nc1,"latitude")> dim(lat)[1] 24> lon = get.var.ncdf(nc1,"longitude")> dim(lon)[1] 24
> tmpset =get.var.ncdf(nc1,"temperature",start=c(1,1,1),count=c(1,1,72))> dim(tmpset)[1] 72
19 / 26
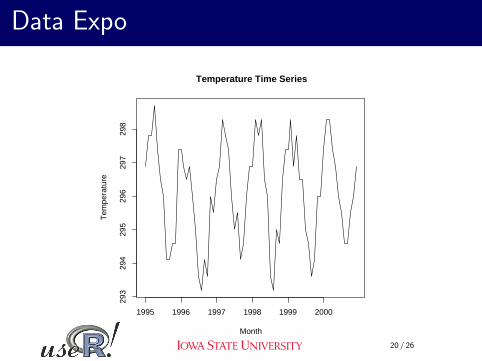
Data Expo
Temperature Time Series
Month
Tem
pera
ture
1995 1996 1997 1998 1999 2000
293
294
295
296
297
298
20 / 26

Data Expo
Some code to plot spatio-temporal ozone data
library(RColorBrewer)brk = seq(220,400,by=20)lvec = c(1:72,rep(73,12))layout(matrix(lvec,nrow=7,byrow=TRUE),
heights=c(rep(1,6),0.5),widths=c(rep(1,12)))par(mai=c(0.05,0.05,0.05,0.05))for (i in 1:72) {
image(lon,lat,z=oz[,,i], col=brewer.pal(9,"YlOrRd"),axes=F,pty="s",ylab="",xlab="",breaks=brk)
map("world",add=TRUE)abline(h=0)
}
21 / 26

Data Expo
Adding a legend
par(mai=c(0,1,0,1))plot(20,1,xlim=c(0,20),ylim=c(0,1),axes=FALSE,type="n",
xaxt="n",yaxt="n",xlab="",ylab="",frame.plot=FALSE)xl = seq(7.75,11.75,by=0.5)yb = rep(0.5,9)xr = seq(8.25,12.25,by=0.5)yt = rep(0.8,9)rect(xl,yb,xr,yt,col=brewer.pal(9,"YlOrRd"))text(seq(7.75,12.25,by=0.5),rep(0.3,10),labels=paste(brk),cex=0.75)
22 / 26
Clean Up
• Close a NetCDF file with close.ncdf(nc1)
• The data arrays can be saved in the R workspace
• Watch out for large arrays that may have beencreated
23 / 26

Outline
Environmental Datasets
NetCDF
The ncdf Package
Discussion
24 / 26

Discussion
• Irregular spatial data can be handled byNetCDF, likely just one spatial dimension.
• Another data format, Gridded Binary (GRIB), isoften used in meteorology, but no R package yet.
• NetCDF and GRIB work well when the datacollection scheme remains consistent
• Ideal for computer model output• What to do when observation locations are added or removed,
i.e. ragged data?
25 / 26

Questions
• Questions?
26 / 26


