Manitoba First Manitoba First Nations: Nations: Health & Health Care Health & Health Care in an Aboriginal in an Aboriginal Population Population Patricia J. Martens & Ruth-Ann Soodeen MANITOBA CENTRE FOR HEALTH POLICY Winnipeg, Manitoba, Canada
Transcript
Manitoba First Nations:Manitoba First Nations:Health & Health Care in an Health & Health Care in an
Aboriginal PopulationAboriginal Population
Patricia J. Martens & Ruth-Ann Soodeen
MANITOBA CENTRE FOR HEALTH POLICY
Winnipeg, Manitoba, Canada
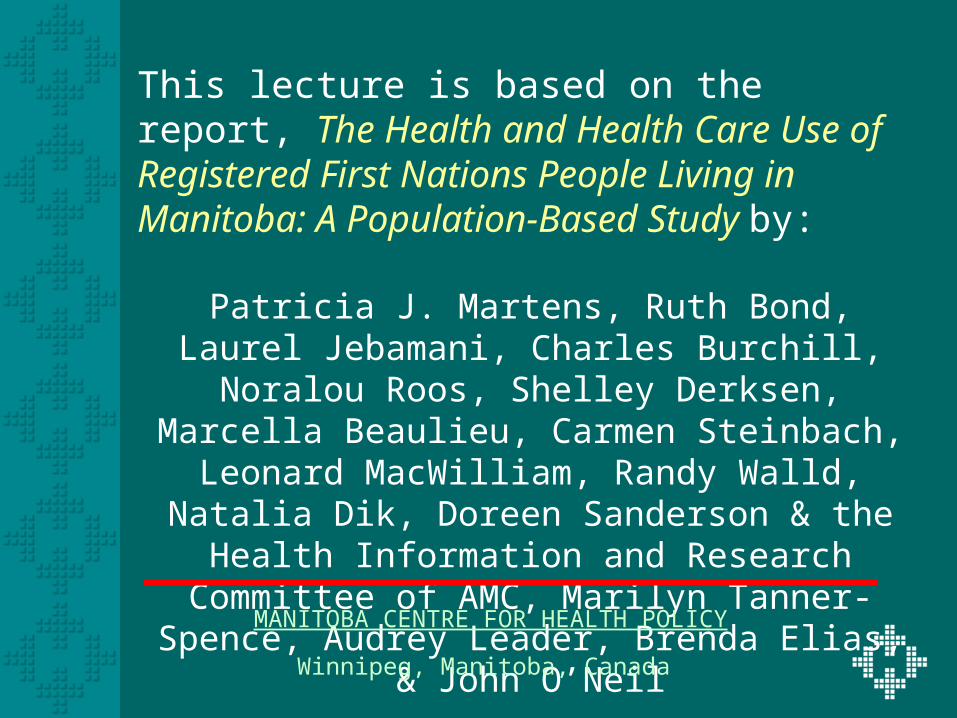
This lecture is based on the report, The Health and Health Care Use of Registered First Nations People Living in Manitoba: A Population-Based Study by:
Patricia J. Martens, Ruth Bond, Laurel Jebamani, Charles Burchill, Noralou Roos, Shelley Derksen, Marcella Beaulieu, Carmen Steinbach, Leonard MacWilliam, Randy Walld, Natalia Dik, Doreen
Sanderson & the Health Information and Research Committee of AMC, Marilyn Tanner-Spence, Audrey
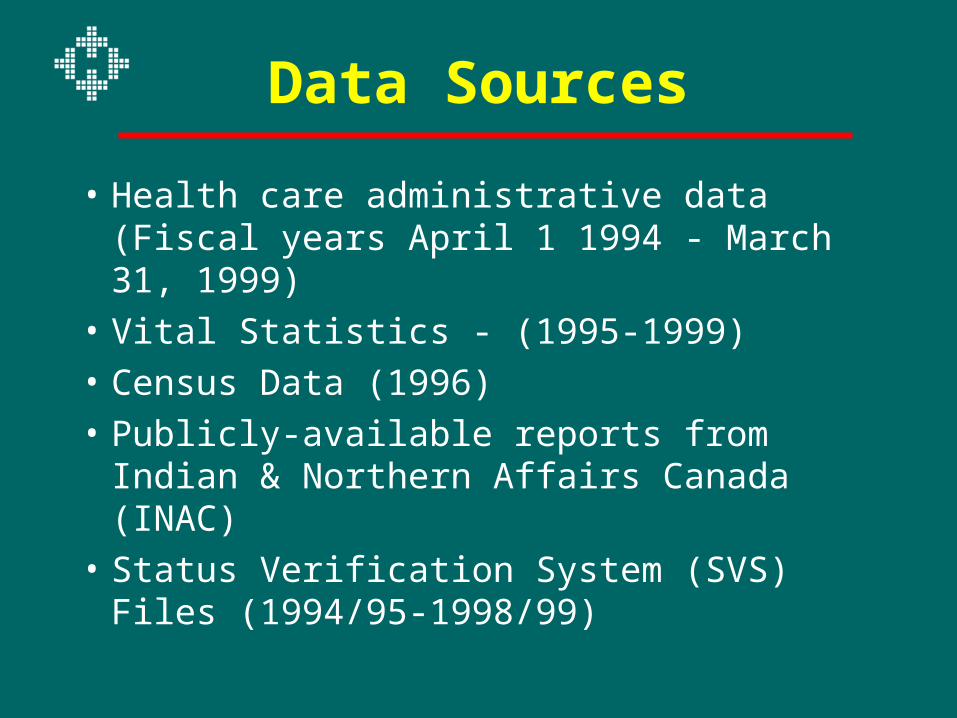
• Health care administrative data (Fiscal years April 1 1994 - March 31, 1999)
• Vital Statistics - (1995-1999)
• Census Data (1996)
• Publicly-available reports from Indian & Northern Affairs Canada (INAC)
• Status Verification System (SVS) Files (1994/95-1998/99)
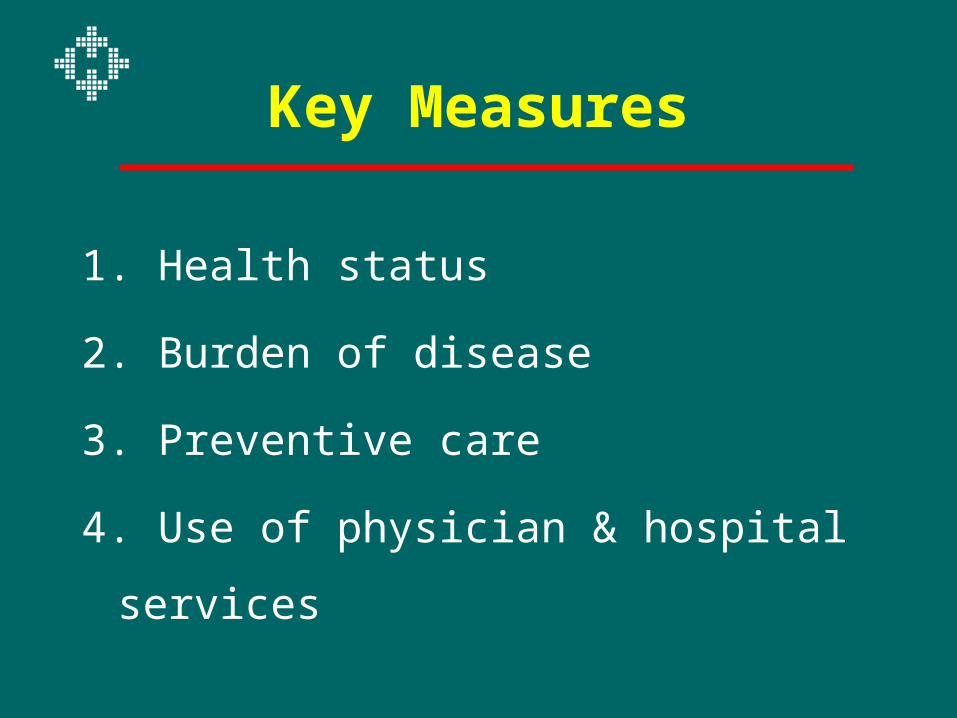
Key Measures
1. Health status
2. Burden of disease
3. Preventive care
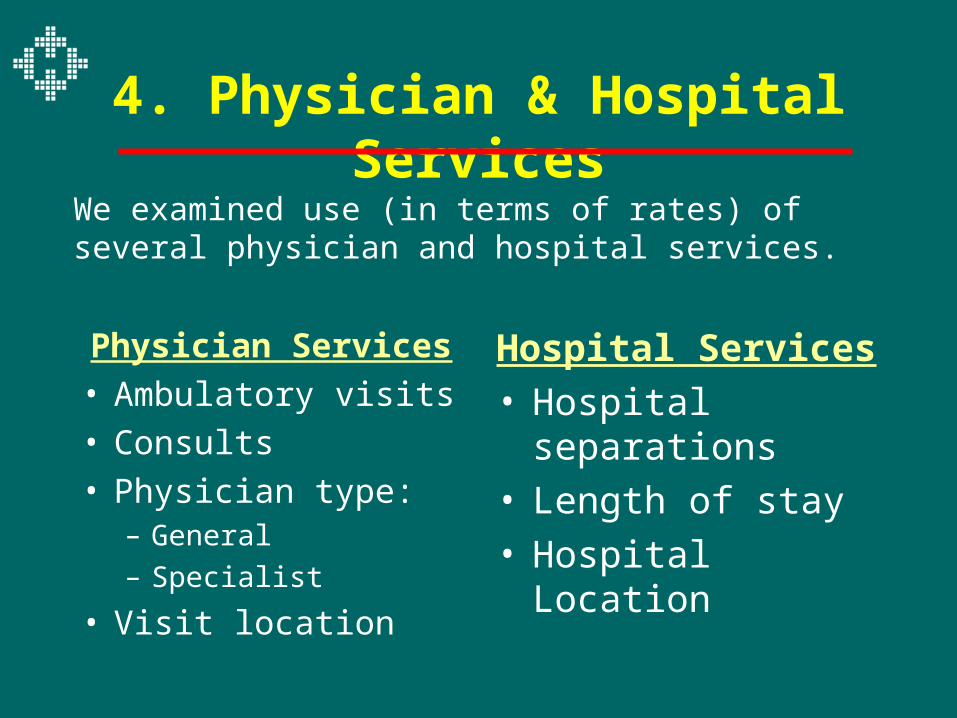
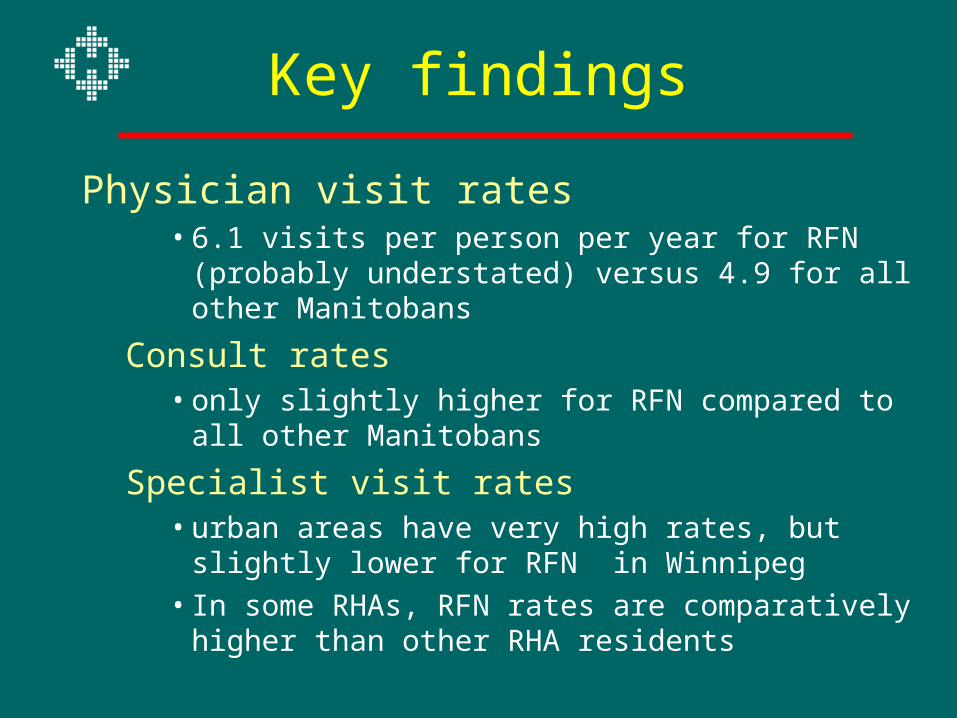
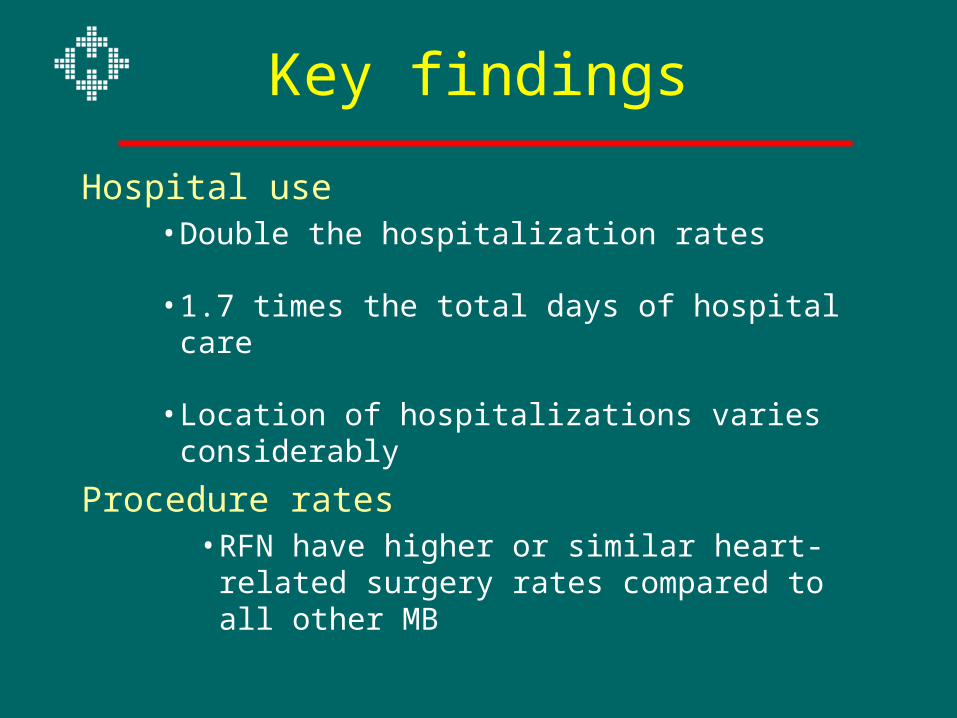
4. Use of physician & hospital services
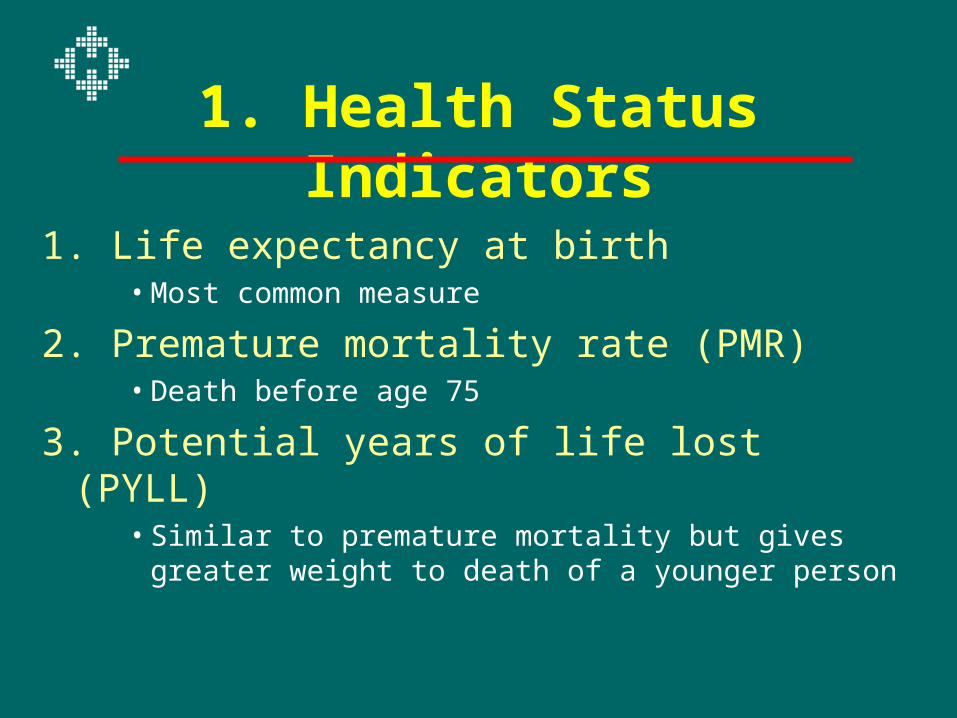
1. Health Status Indicators
1. Life expectancy at birth • Most common measure
2. Premature mortality rate (PMR) • Death before age 75
3. Potential years of life lost (PYLL) • Similar to premature mortality but gives greater weight
to death of a younger person
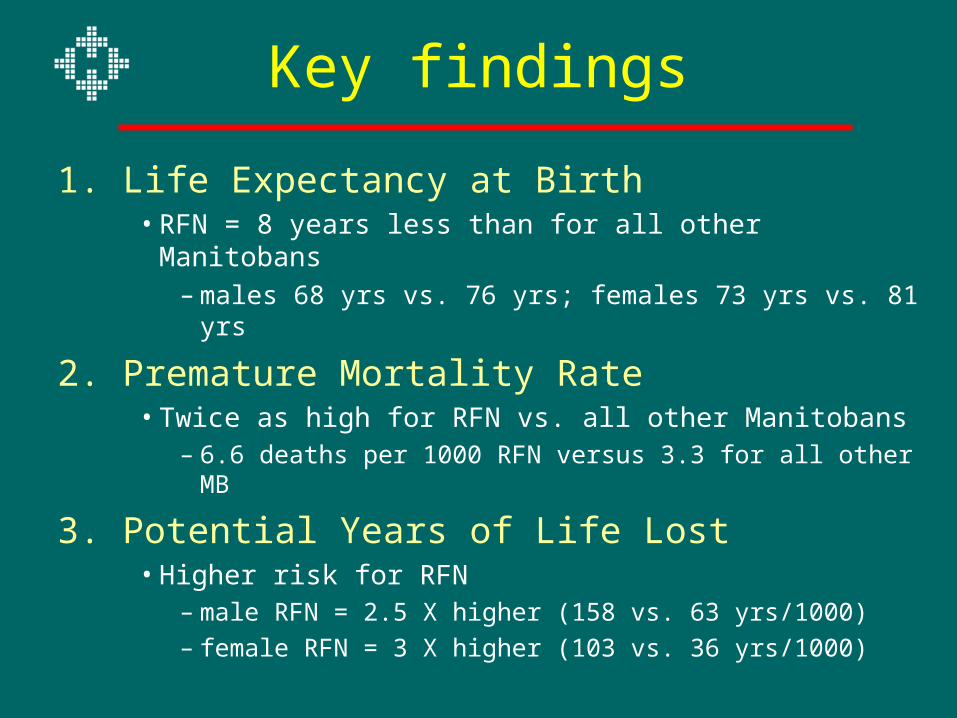
Key findings
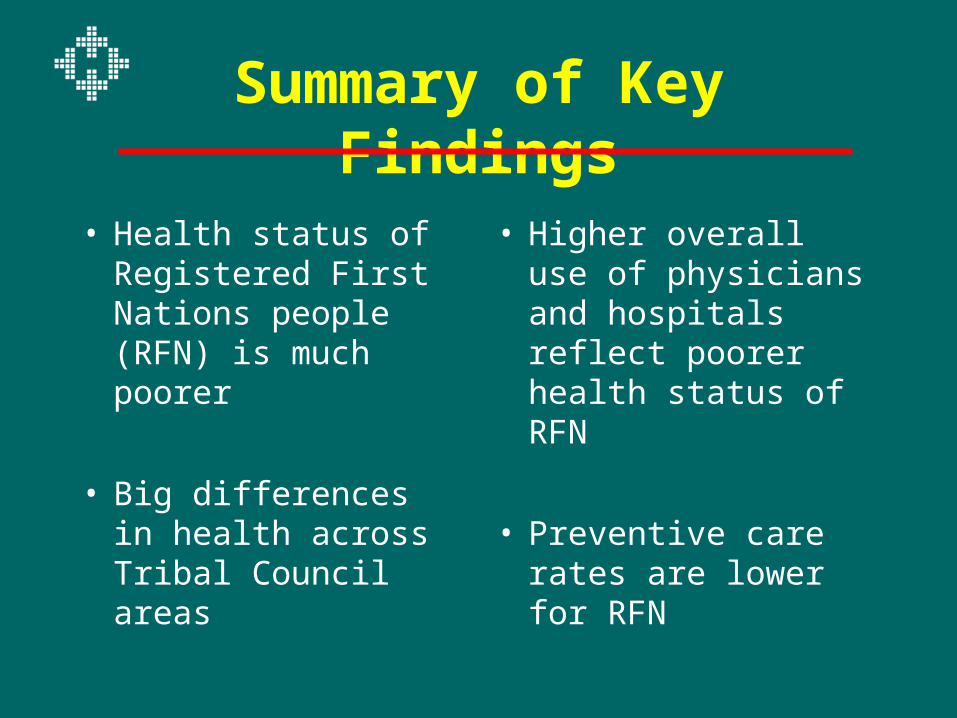
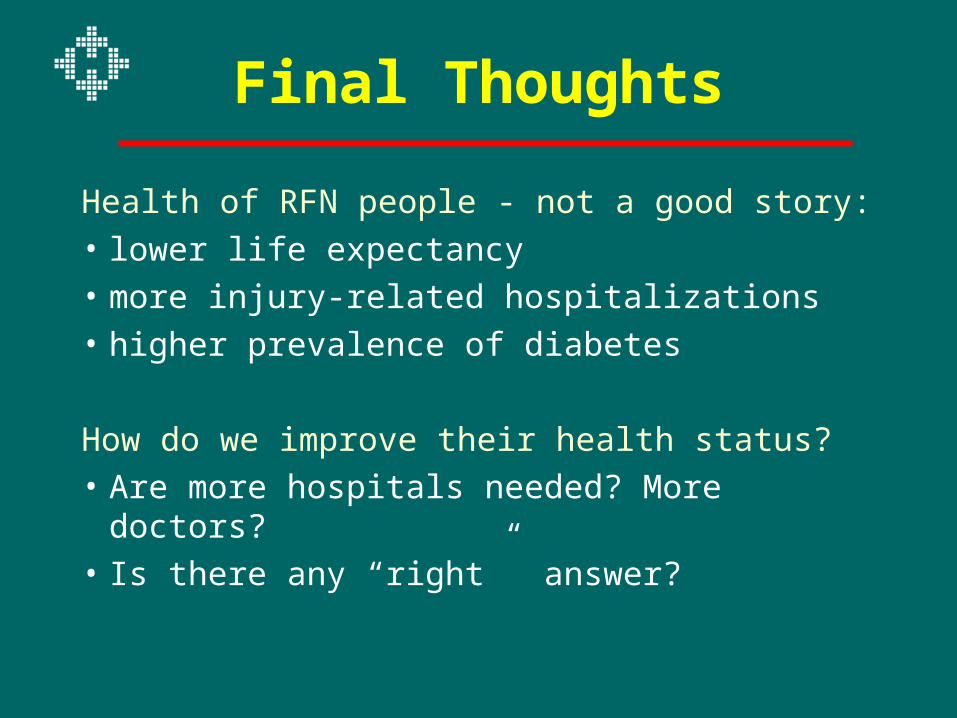
1. Life Expectancy at Birth• RFN = 8 years less than for all other Manitobans
– males 68 yrs vs. 76 yrs; females 73 yrs vs. 81 yrs
2. Premature Mortality Rate• Twice as high for RFN vs. all other Manitobans
– 6.6 deaths per 1000 RFN versus 3.3 for all other MB
3. Potential Years of Life Lost• Higher risk for RFN
– male RFN = 2.5 X higher (158 vs. 63 yrs/1000)
– female RFN = 3 X higher (103 vs. 36 yrs/1000)
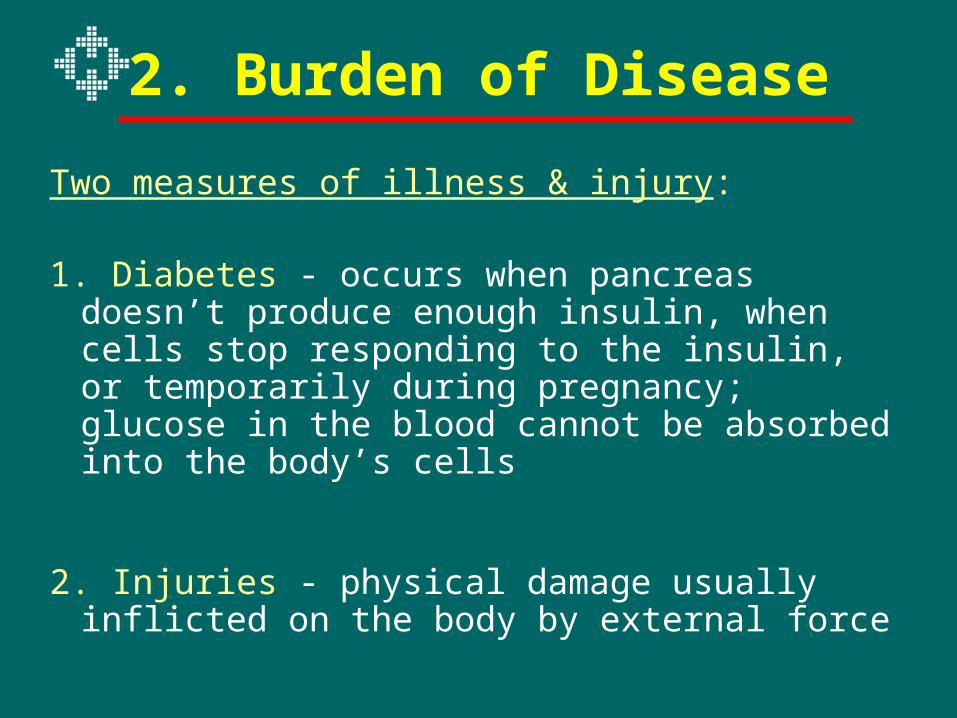
2. Burden of Disease
Two measures of illness & injury:
1. Diabetes - occurs when pancreas doesn’t produce enough insulin, when cells stop responding to the insulin, or temporarily during pregnancy; glucose in the blood cannot be absorbed into the body’s cells
2. Injuries - physical damage usually inflicted on the body by external force
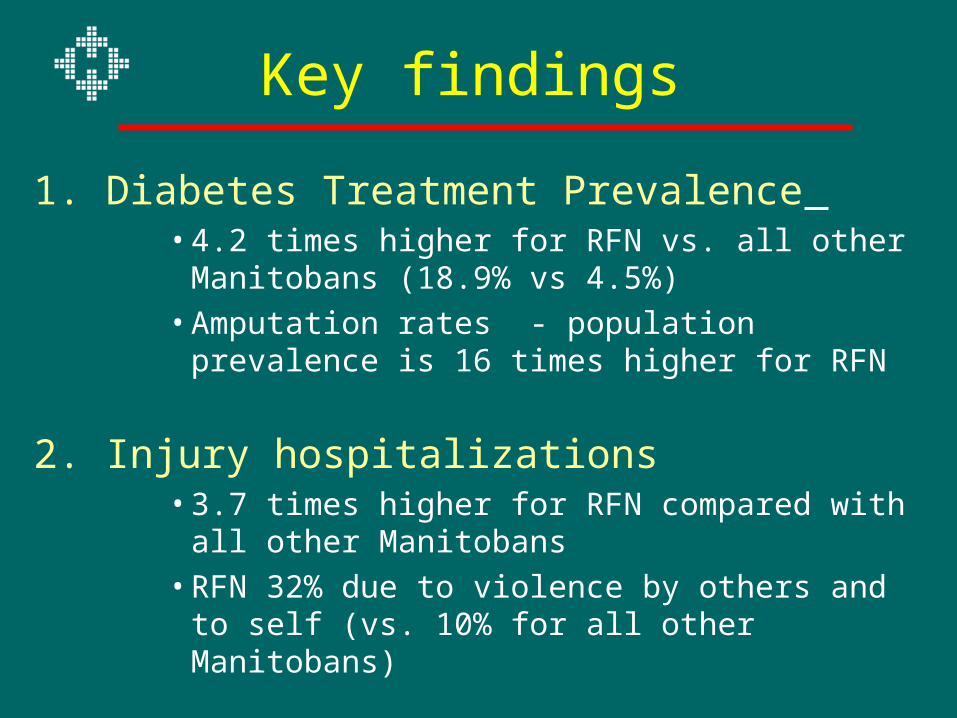
Key findings
1. Diabetes Treatment Prevalence • 4.2 times higher for RFN vs. all other Manitobans
(18.9% vs 4.5%)• Amputation rates - population prevalence is 16 times
higher for RFN
2. Injury hospitalizations• 3.7 times higher for RFN compared with all other
Manitobans• RFN 32% due to violence by others and to self (vs.
10% for all other Manitobans)
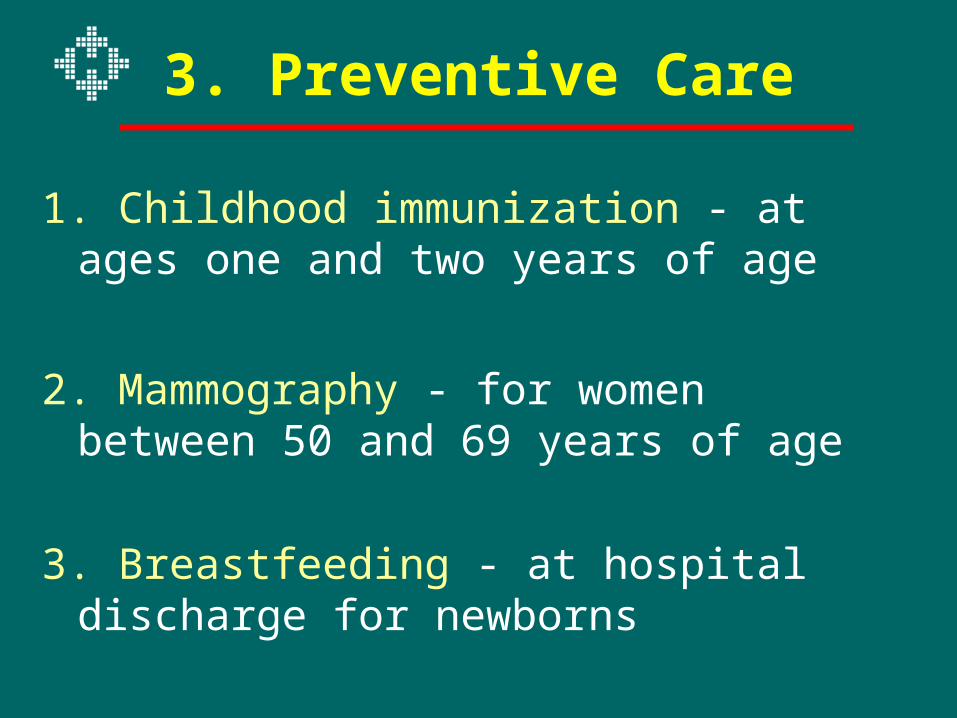
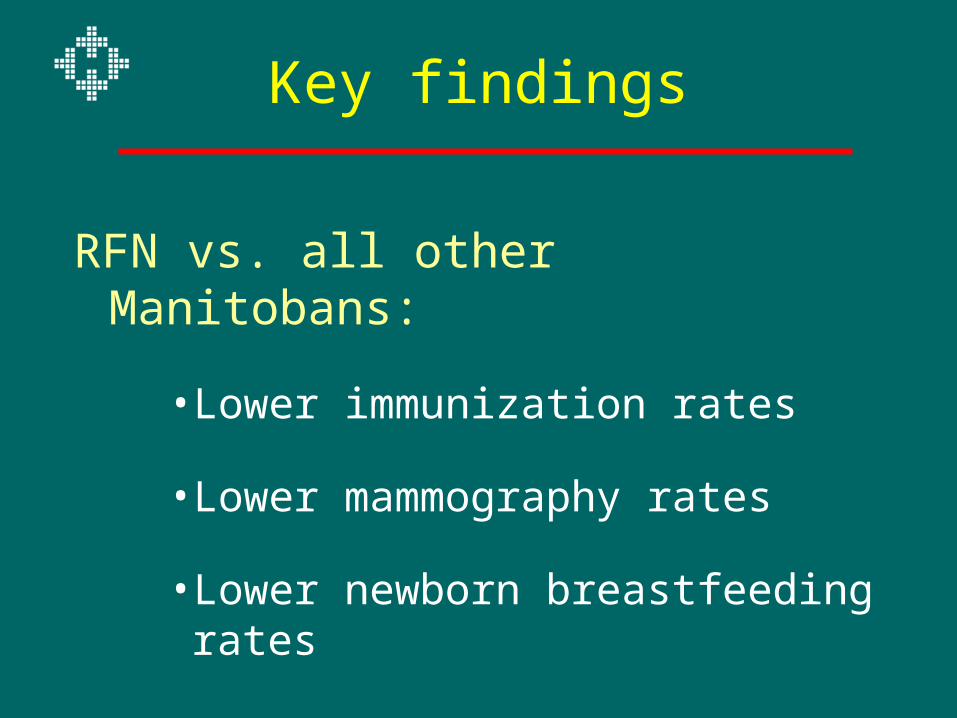
3. Preventive Care
1. Childhood immunization - at ages one and two years of age
2. Mammography - for women between 50 and 69 years of age
3. Breastfeeding - at hospital discharge for newborns