16
Manpreet Kaur Juneja, M.Des in Strategic Foresight and Innovation, OCAD University, Toronto
Manpreet Kaur Juneja, M.Des in Strategic Foresight and Innovation, OCAD University, Toronto
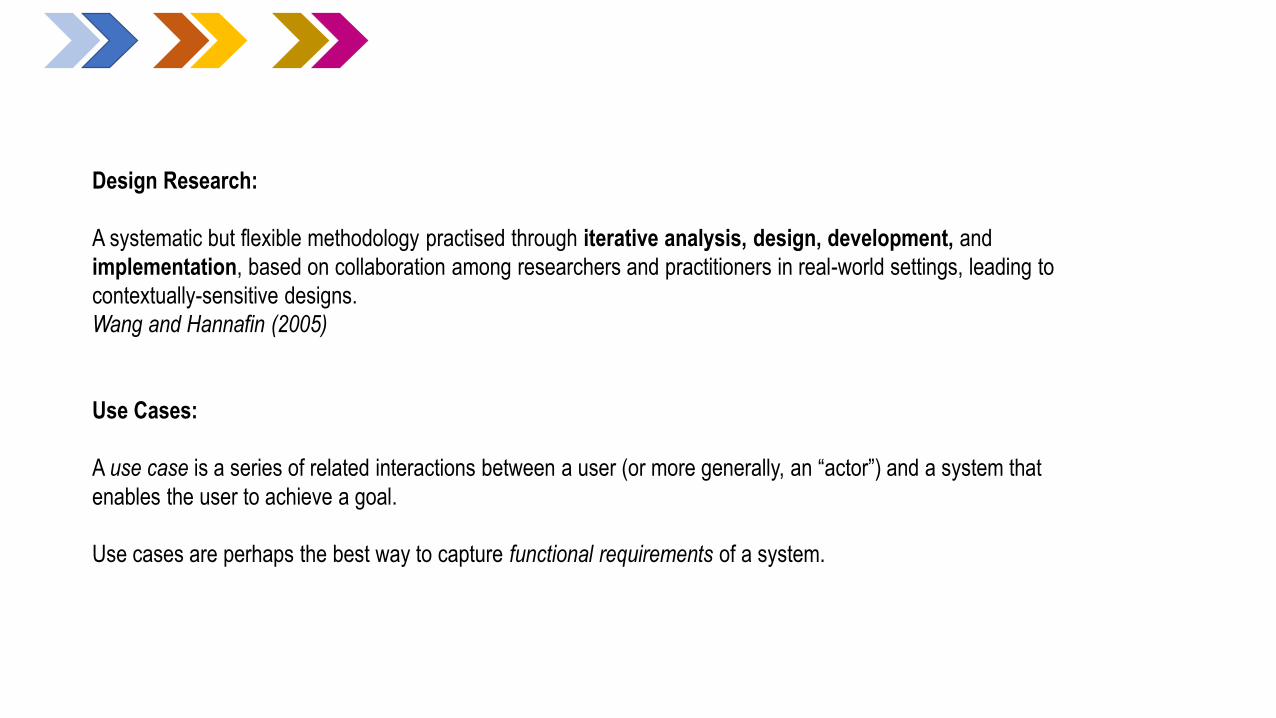
Design Research:
A systematic but flexible methodology practised through iterative analysis, design, development, and
implementation, based on collaboration among researchers and practitioners in real-world settings, leading to
contextually-sensitive designs.
Wang and Hannafin (2005)
Use Cases:
A use case is a series of related interactions between a user (or more generally, an “actor”) and a system that
enables the user to achieve a goal.
Use cases are perhaps the best way to capture functional requirements of a system.

•
•
•
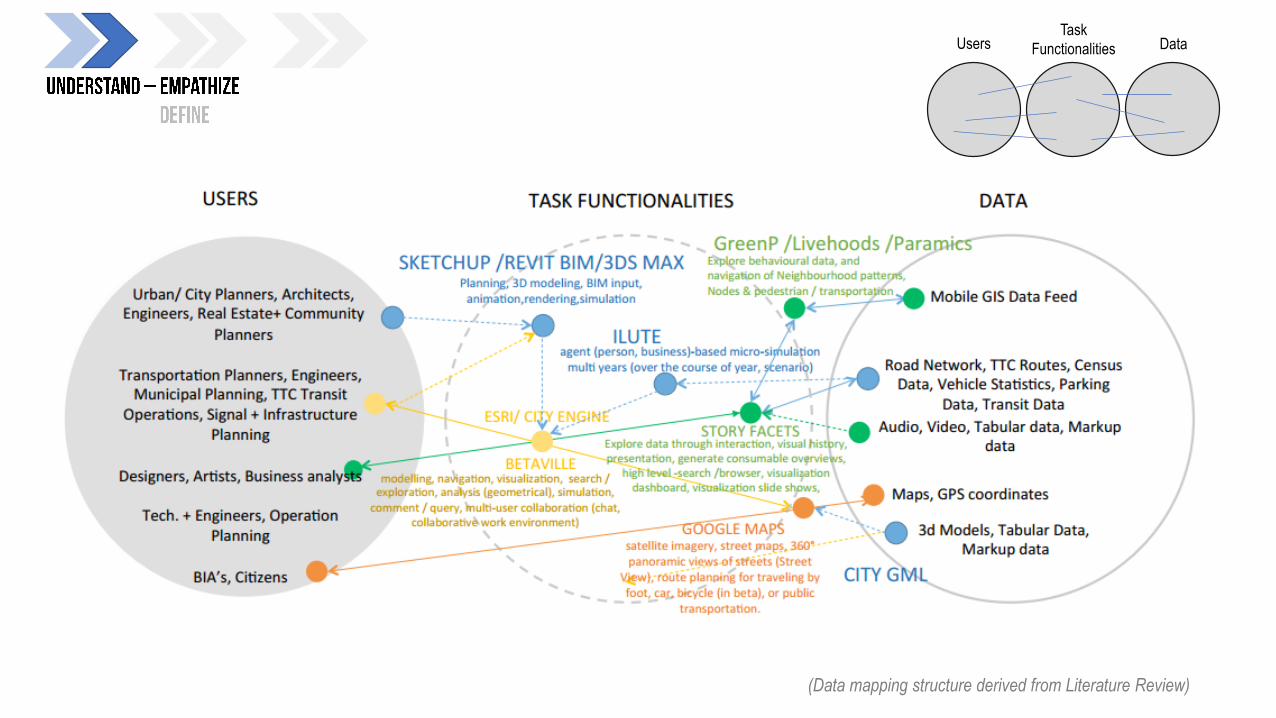
DataTask
FunctionalitiesUsers
(Data mapping structure derived from Literature Review)
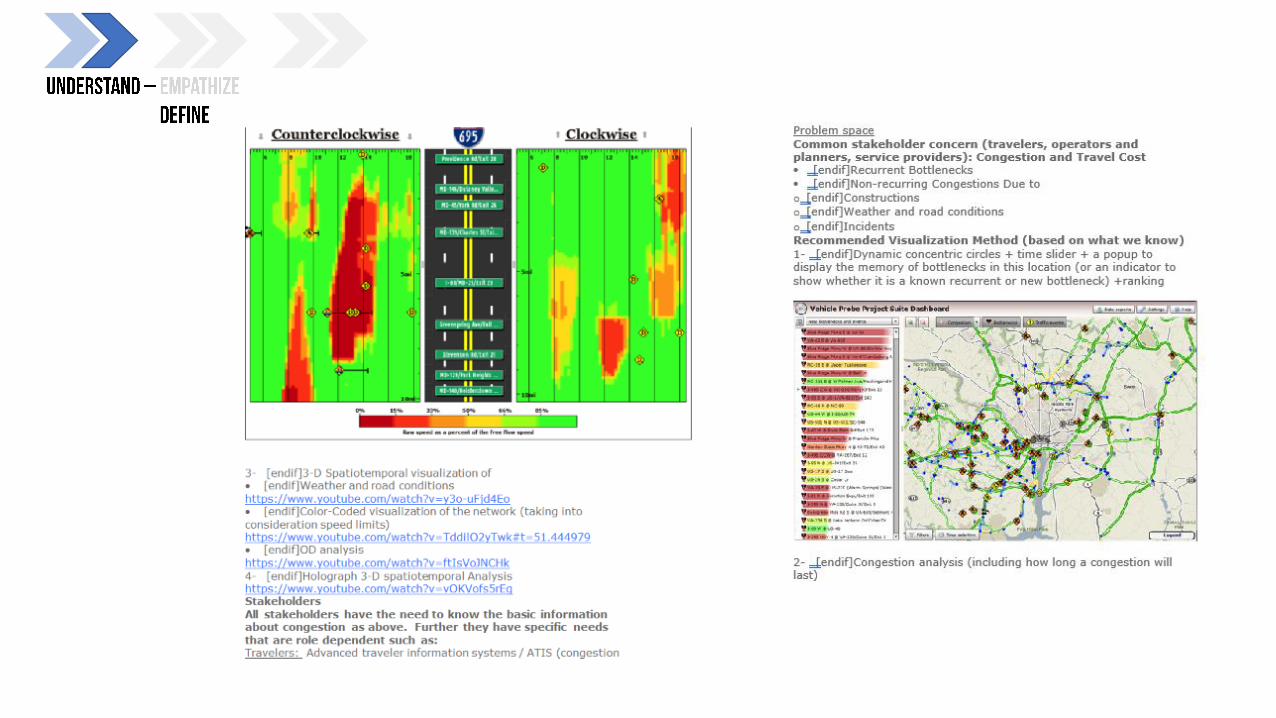
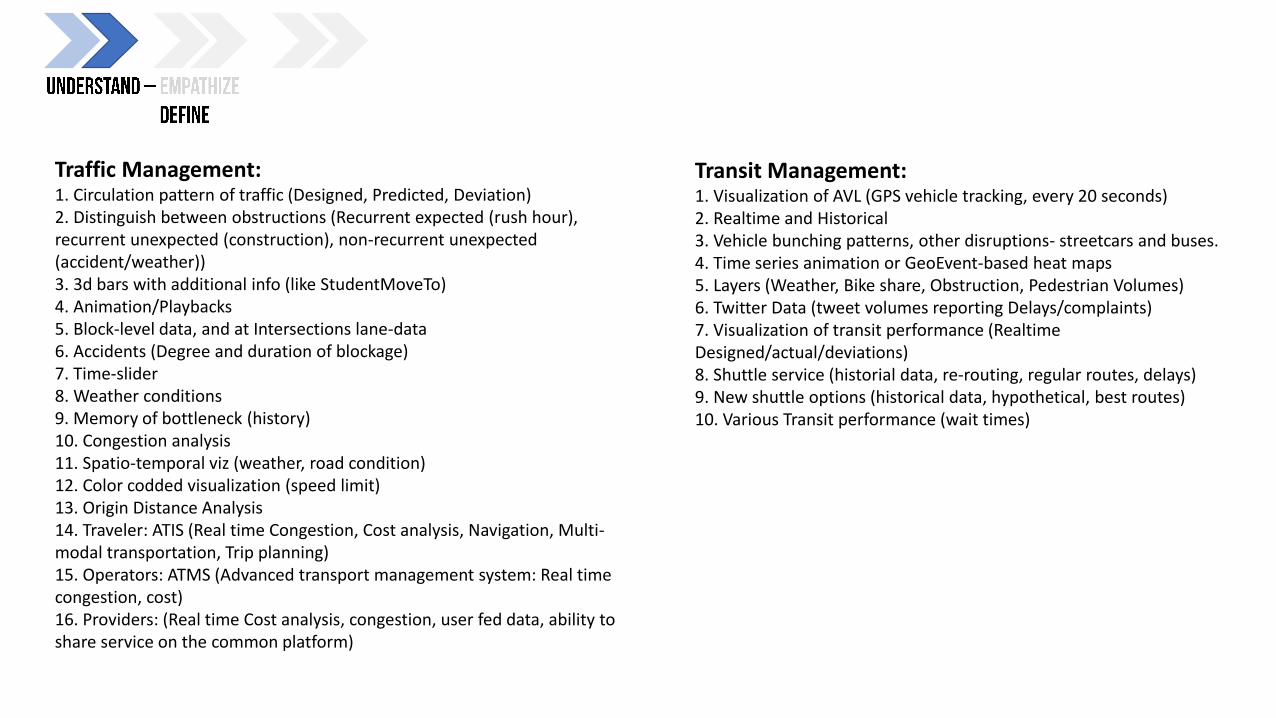
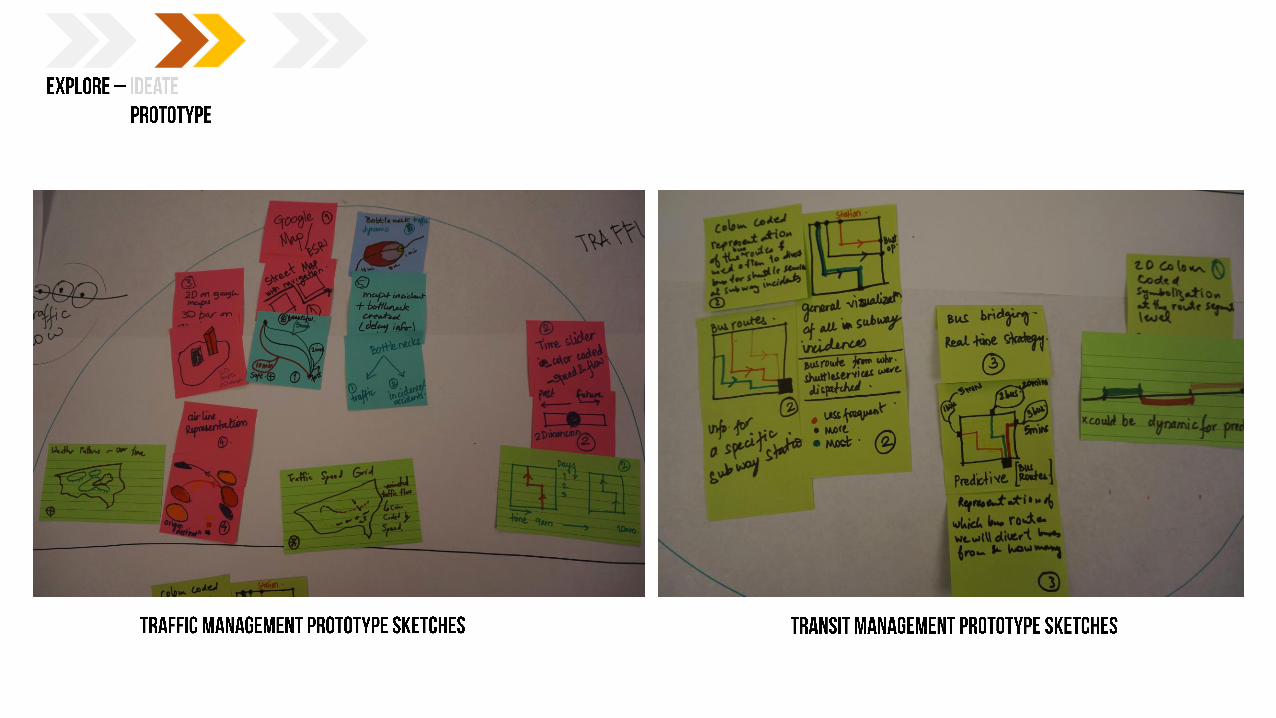
Traffic Management:1. Circulation pattern of traffic (Designed, Predicted, Deviation)2. Distinguish between obstructions (Recurrent expected (rush hour), recurrent unexpected (construction), non-recurrent unexpected (accident/weather))3. 3d bars with additional info (like StudentMoveTo)4. Animation/Playbacks5. Block-level data, and at Intersections lane-data6. Accidents (Degree and duration of blockage)7. Time-slider8. Weather conditions9. Memory of bottleneck (history)10. Congestion analysis11. Spatio-temporal viz (weather, road condition)12. Color codded visualization (speed limit)13. Origin Distance Analysis14. Traveler: ATIS (Real time Congestion, Cost analysis, Navigation, Multi-modal transportation, Trip planning)15. Operators: ATMS (Advanced transport management system: Real time congestion, cost)16. Providers: (Real time Cost analysis, congestion, user fed data, ability to share service on the common platform)
Transit Management:1. Visualization of AVL (GPS vehicle tracking, every 20 seconds)2. Realtime and Historical3. Vehicle bunching patterns, other disruptions- streetcars and buses.4. Time series animation or GeoEvent-based heat maps5. Layers (Weather, Bike share, Obstruction, Pedestrian Volumes)6. Twitter Data (tweet volumes reporting Delays/complaints)7. Visualization of transit performance (Realtime Designed/actual/deviations)8. Shuttle service (historial data, re-routing, regular routes, delays)9. New shuttle options (historical data, hypothetical, best routes)10. Various Transit performance (wait times)
•
•
•
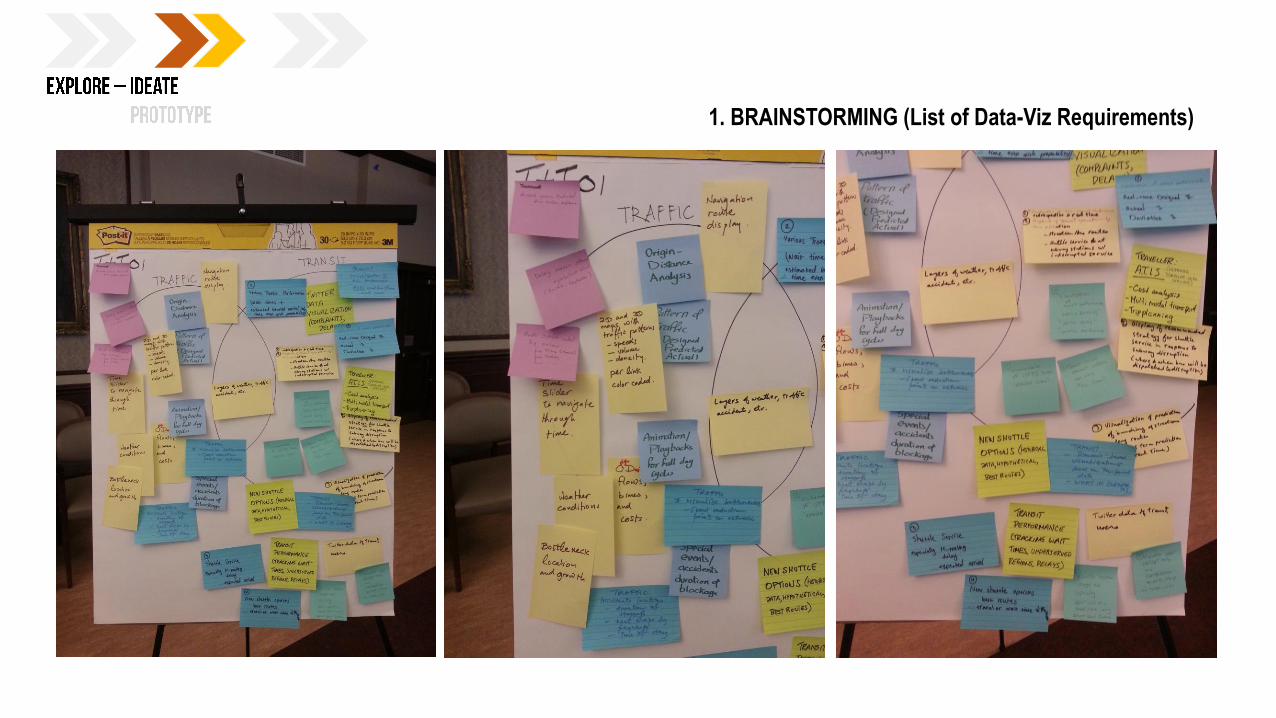
1. BRAINSTORMING (List of Data-Viz Requirements)
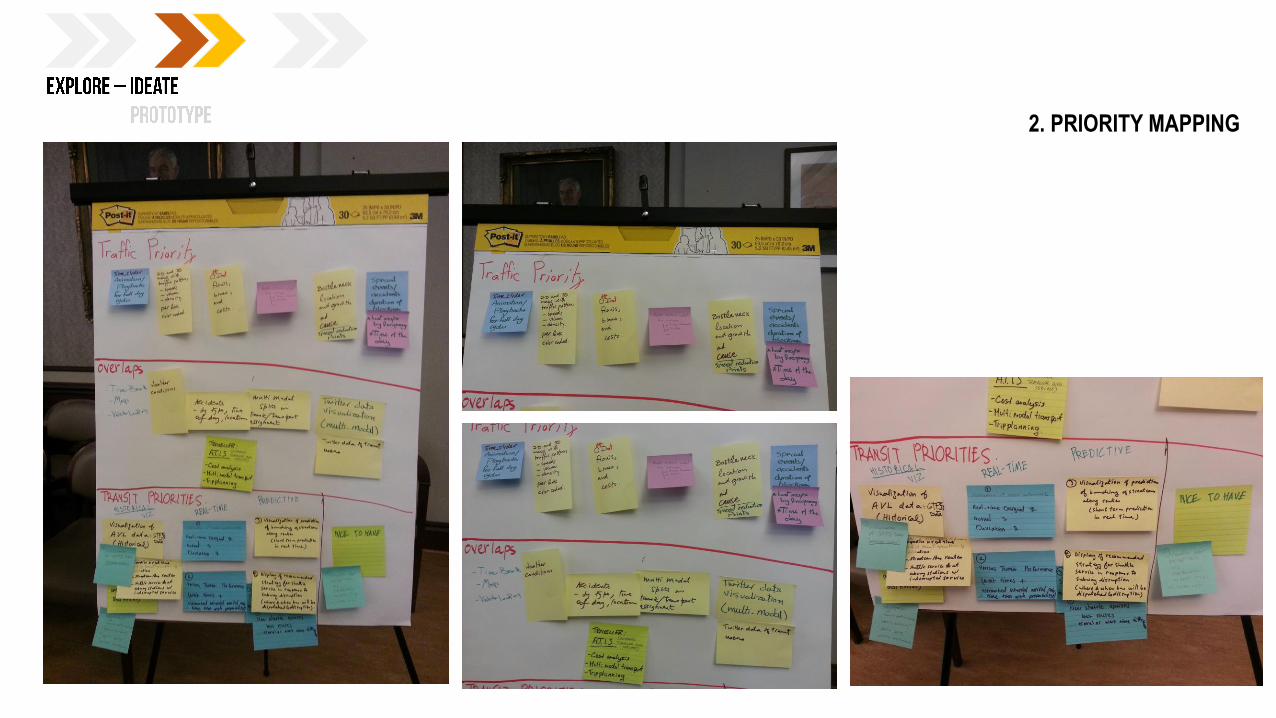
2. PRIORITY MAPPING
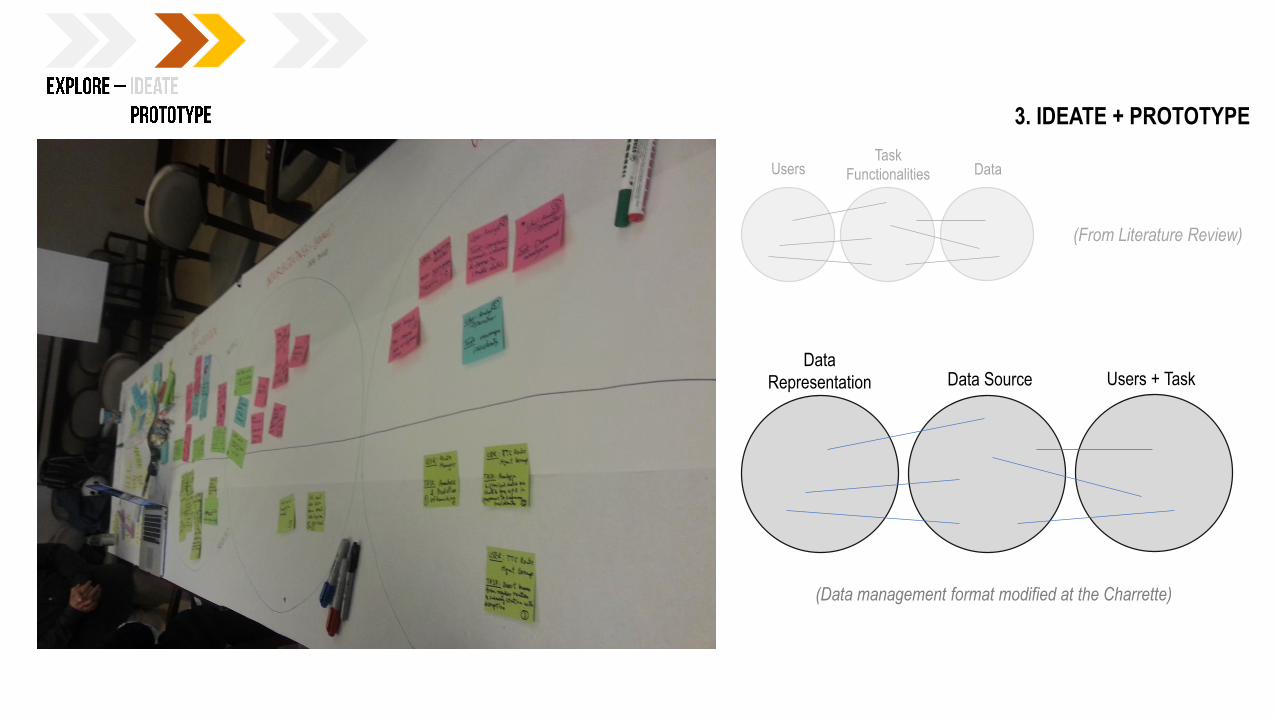
Users + TaskData SourceData
Representation
DataTask
FunctionalitiesUsers
3. IDEATE + PROTOTYPE
(From Literature Review)
(Data management format modified at the Charrette)
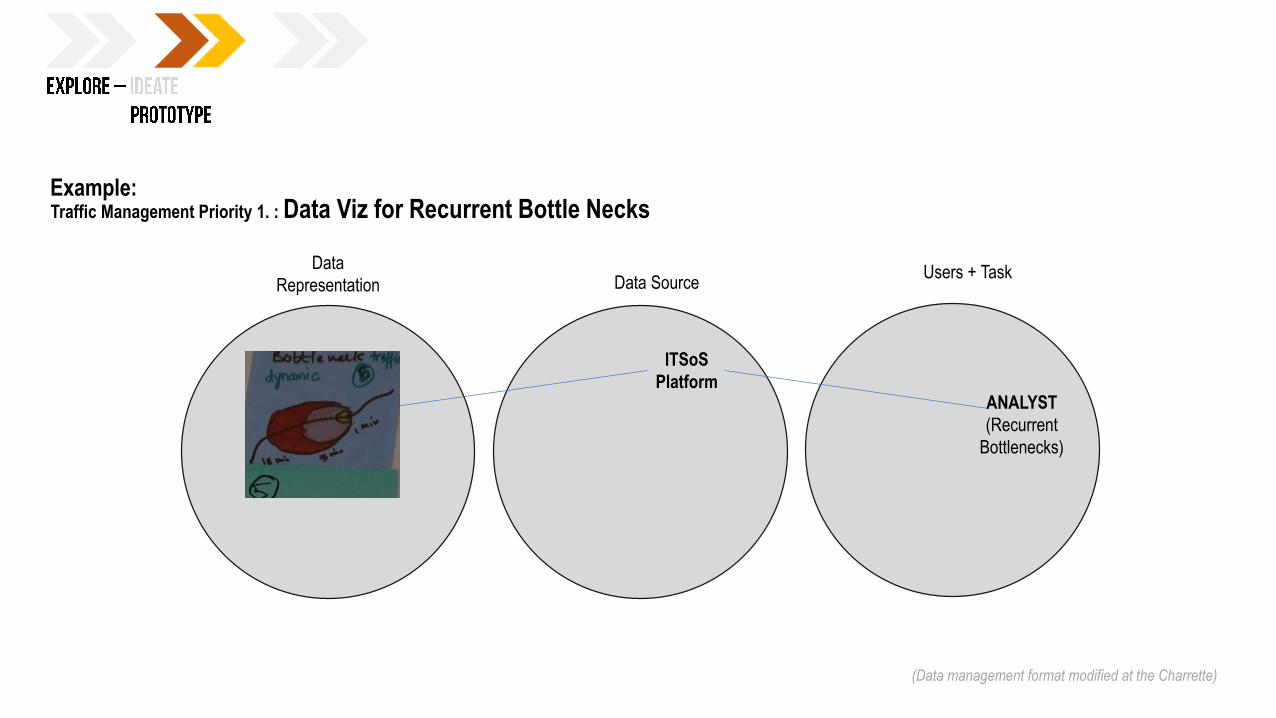
Data
RepresentationUsers + Task
Data Source
Example:
(Data management format modified at the Charrette)
ANALYST
(Recurrent
Bottlenecks)
Traffic Management Priority 1. : Data Viz for Recurrent Bottle Necks
ITSoS
Platform
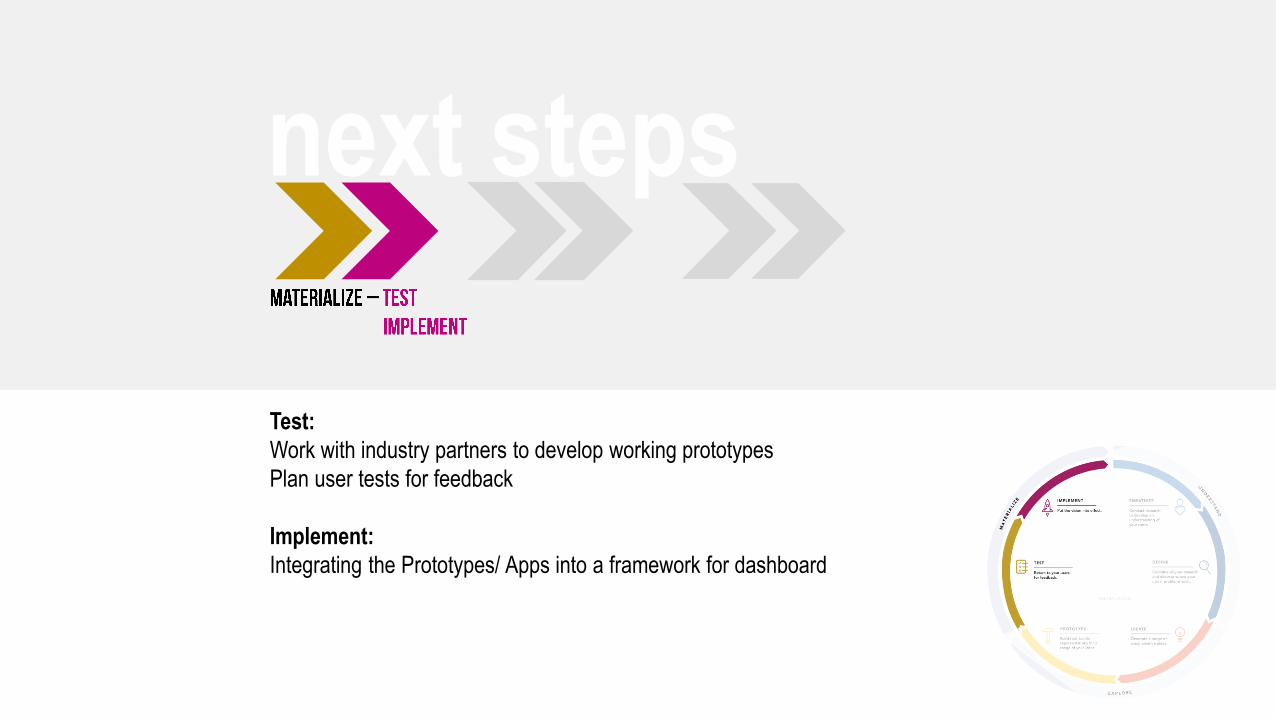
Test:
Work with industry partners to develop working prototypes
Plan user tests for feedback
Implement:
Integrating the Prototypes/ Apps into a framework for dashboard
next steps