The solid-state convection in the Earth mantle is a complicated phenomenon that causes various tectonicactivities, especially magmatism and plate tectonics, and makes the mantle evolve on geologic time(billions of years). When looked at from the viewpoint of fluid dynamics, however, mantle convection is
380 M. Ogawa / Fluid Dynamics Research 40 (2008) 379–398
a simple phenomenon. A typical velocity of this convective flow is only a few centimeters per year andits kinetic energy is comparable to the kinetic energy of a car running on a freeway. The kinetic energy isnegligibly small compared with the rate of total potential energy release due to the convective flow, andthe convective flow is well approximated as a Stokes flow. Furthermore, the only force that drives theconvective flow is buoyancy force. Coriolis force and Lorentz force, which are important in understandingthe convective flow in the atmosphere, ocean and the outer core of the Earth, do not play any significantrole in the mantle. The complicated behavior of mantle convection all comes from the complicated natureof the convecting mantle materials. The rheology of mantle materials is not simple Newtonian, and mantlematerials are a multi-component system that differentiates when magmatism occurs. Here in this review,I discuss how (a) the plate tectonics and (b) the thermal and chemical structure of mantle, two of themost important features of the Earth mantle convection, arise from this complicated nature of convectingmantle materials; for more general reviews of the studies on mantle convection, see Bercovici et al. (2000),Tackley (2000), and Schubert et al. (2001).
2. The origin of plate tectonics
The Earth surface is covered by several rigid plates, thousands of kilometers across and about a hundredkilometer in thickness, that move along the surface. The plate motion induces such tectonic activities asmountain building, earthquakes and magmatism mostly at plate margins, and the plate interiors aretectonically rather stable. (See standard text books of solid earth science (e.g., Moores et al., 1995) forthe detail of plate tectonics.) This plate tectonics is a striking feature of the Earth mantle convection,not observed on other terrestrial planets (e.g., Schubert et al., 2001), and both numerical and laboratorymodeling of plate tectonics has been carried out to understand why plate tectonics occurs on the Earth(Bercovici et al., 2000; Tackley, 2000). This issue on the origin of plate tectonics consists of three sub-issues; (a) why the lithosphere, a layer characterized by its high mechanical strength, develops in theuppermost coldest part of the mantle; (b) why the lithosphere is fragmented into several pieces or platesin spite of its high mechanical strength; and (c) why the plates rigidly move and the deformation ofthe lithosphere due to plate motion concentrates to narrow plate margins. I will discuss these sub-issuesbelow:
2.1. The origin of the lithosphere
When the rheology of mantle materials is modeled by a Newtonian rheology, the effective viscosityrapidly increases with decreasing temperature, and this strong temperature-dependence of viscosity hasbeen believed to be the cause of the high mechanical strength of the lithosphere (see Karato and Wu,1993; Kohlstedt et al., 1995 and the references therein). To confirm this belief, numerical experimentsand scaling analyses have been extensively carried out for thermal convection of Newtonian fluid withstrongly temperature-dependent viscosity in a vessel with fixed temperature at the bottom and the surfaceboundaries (Christensen, 1984, 1985; Christensen and Harder, 1991; Ogawa et al., 1991; Solomatov,1995; Kameyama and Ogawa, 2000). It is commonly assumed for simplicity in these studies that theviscosity exponentially depends on temperature as
! = !0 exp[−E(T − Tb)], (1)
M. Ogawa / Fluid Dynamics Research 40 (2008) 379–398 381
log10 (Rb)
log 1
0 (r
)
2 4 6 80
2
4
6
8
no convectionstagnant lid regime
sluggish lid regime
small viscosity contrast regime
b
c c
d
e
aa
Fig. 1. (a) The regime diagram for thermal convection of a Newtonian fluid with temperature-dependent viscosity in atwo-dimensional rectangular box heated from the bottom boundary. Rb is the Rayleigh number based on the viscosity onthe bottom boundary and r is the viscosity contrast between the top and the bottom boundaries. The regime boundaries areredrawn from Kameyama and Ogawa (2000) (solid lines). Also shown are the regime boundaries suggested in Solomatov (1995)(dashed lines). (b)–(d) Typical convective flow patterns for each of the regimes, all taken from Kameyama and Ogawa (2000)with modification; the contour lines show the temperature distribution, while the color indicates the regions where strong viscousdissipation occurs owing to the convective flow.
where E is a constant, T is temperature, Tb is the temperature at the bottom boundary, and !0 is theviscosity at T = Tb.
Fig. 1 taken from Kameyama and Ogawa (2000) summarizes the outcome of these numerical experi-ments. The regime diagram in Fig. 1a classifies the numerically obtained convective flow patterns into threeregimes on the plane of viscosity contrast between the surface and bottom boundaries r=exp[E(Tb−Tsrfc)]versus Rayleigh number based on the viscosity at the bottom boundary Rb = "0#g(Tb − Tsrfc)d
3/!0$,while Figs. 1b–d show examples of convective flow patterns for each of the three regimes. (Here, Tsrfc isthe temperature at the surface boundary, "0 is reference density, # is thermal expansivity, g is gravitationalacceleration, d is depth of the mantle, and $ is thermal diffusivity.) In the small viscosity contrast regimeat low viscosity contrast r (Fig. 1d), the cold plumes growing from the surface boundary (see the arrowsa in the figure) always cause significant deformations along the surface boundary as can be seen fromthe distribution of regions with strong viscous dissipation. There is no lithosphere that behaves as a rigidlid on the top of convecting mantle on this regime. On the stagnant lid regime at high r (Fig. 1b), incontrast, a stagnant lid of highly viscous fluid develops along the surface boundary (the arrow b) and coldplumes grow only at the base of the lid (the arrows c). It is reasonable to call the lid the “lithosphere”.We can define the lithosphere on thesluggish lid regime at intermediate r (Fig. 1c), too. There are cold
382 M. Ogawa / Fluid Dynamics Research 40 (2008) 379–398
plumes that grow at the base of the lithosphere (the arrow d). In contrast to the stagnant lid regime,however, the lithosphere is involved in the convective flow. The lithosphere moves by its own thermallyinduced negative buoyancy and induces another kind of cold plumes whose roots penetrate upward intothe lithosphere (the arrow e). These regimes are separated by bifurcations at the location shown by thesolid lines in Fig. 1a (Ogawa et al., 1991; Kameyama and Ogawa, 2000).
Among the three regimes, the sluggish lid regime is the most relevant to the Earth plate tectonics. Thelithosphere develops and moves by its own negative buoyancy on this regime, as is the case for the Earthplates; the Earth plates are mostly driven by slab-pull force and ridge-push force, both occur as a result ofthe negative buoyancy of the plates themselves, and the main resistance to the plate motion occurs at platemargins (Forsyth and Uyeda, 1975; Conrad and Hager, 2001; Conrad and Lithgow-Bertelloni, 2002).I will show in Section 2.2 below that the sluggish lid regime is indeed the roots of the plate tectonicsobserved on the Earth.
A comment on the convective regimes is necessary here, because there is some confusion on thedefinition of the three regimes shown in Fig. 1. Solomatov (1995) also classified the convective flowpatterns into the three regimes, but the locations of his regime boundaries are different from the ones inKameyama and Ogawa (2000) as illustrated by the dashed lines in Fig. 1a. The discrepancy arises becausethe regime diagram of Solomatov (1995) is drawn to derive a semi-empirical relationship between theefficiency of convective heat transport and the Rayleigh number and hence is not based on detailedobservations of convective flow patterns. The “regime boundaries” shown by the dashed lines do notnecessarily correspond to bifurcations of the convection and I will not use his regime diagram in thefollowing discussion.
2.2. The plate like regime
Though the numerically modeled lithosphere shows some similarity to the lithosphere of the Earthon the sluggish lid regime as discussed above, there is one important difference between them. Thedeformation of the lithosphere spreads over the entire lithosphere on the sluggish lid regime of numericalmodels, while plate interiors are almost rigid and the deformation of the lithosphere strongly concentratesto narrow and mechanically weak plate margins on the Earth. The absence of plate margins in the modelsof Section 2.1 is a natural consequence of the simple Newtonian rheology assumed in Eq. (1). In asimple Newtonian lithosphere, ruptures cannot take place, and hence narrow and mechanically weakplate margins, to which the lithospheric deformation concentrates, cannot arise. It is necessary to morecarefully model the rheology of mantle materials in numerical simulation of plate tectonics.
On the Earth, plate margins are suggested to be newly developing within the Indian plates owing to thehigh stress induced by the collision of the Eurasian continent and the Indian continent (Coblentz et al.,1998). Plate margins also developed across the supercontinent Pangea 180–50 million years ago whenhot uprising mantle plumes caused unusually vigorous magmatism called Large Igneous Provinces andinduced high lithospheric stress (Burke and Dewey, 1973; Richards et al., 1989; Eldholm and Coffin,2000). Once formed, the lithosphere “remembers” the mechanically weak plate margins, even after thehigh stress induced by these agents dies away and the stress level in the lithosphere returns back to thenormal. Namely, when considered as a function of stress, the effective viscosity of lithospheric materialsis two-valued; the higher value occurs in the rigid plate interior, while the lower value occurs in the highlydeforming plate margins. Which value the lithospheric materials choose is determined by whether or not
M. Ogawa / Fluid Dynamics Research 40 (2008) 379–398 383
the materials have experienced a stress higher than their rupture strength in the past. The importanceof this multi-valued nature of effective viscosity and the dependence of effective viscosity on the stresshistory has been emphasized in Zhong and Gurnis (1995) and Zhong et al. (1998).
One way to realize the multi-valued nature of viscosity in numerical models is to introduce a “damageparameter” %, which indicates how severely the convecting mantle materials are damaged, and to letviscosity depend on % as well as T as
! = !0(P ) exp[−E(T − T0) − F%/(1 + %)], (2)
where T0 is a reference temperature, taken to be a typical temperature in the asthenosphere 1300 ◦Chere, and F is a constant (Ogawa, 2003a). (In Ogawa (2003a), viscosity is also assumed to exponentiallydepend on pressure or depth and this dependence is included in !0(P ).) The effective viscosity of severelydamaged materials with % = ∞ is exp(−F) times lower than that of undamaged materials with % = 0.The damage parameter % is assumed to evolve with time as
d%
dt= &'ij (̇ij − %/), (3)
where the time derivative is Lagrangean, & is constant, ) is decay time, 'ij is stress, and (̇ij is strainrate (Bercovici, 1996; Auth et al., 2003). Namely, % increases in strongly deforming regions but decayswith the decay time of ). When the decay time is much shorter than the turnover time of convection, thesolution to Eq. (3) is well approximated by its steady solution. It can be easily shown that the viscositycalculated from the steady value of % depends on stress as illustrated in Fig. 2 (Ogawa, 2003a). (Here, thestress on the abscissa means ' ≡ √
'ij'ij .) When F =0, the rheology is simple Newtonian. As F becomeslarger, the stress-dependence of viscosity becomes stronger. When F > 4, the viscosity is three-valued inthe stress range of ('D, 'I) illustrated in the figure; 'I and 'D correspond to the rupture strength of plateinterior and plate margins, respectively, and are calculated from &, ), !0, and F (see Ogawa, 2003a). Onlythe solid parts of the curve “F > 4” are stable and physically realizable.
The regime diagram in Fig. 2b and the convective flow patterns in Fig. 2c show how the convectiveregimes are modified from the ones shown in Fig. 1 as F in Eq. (2) increases (Ogawa, 2003a). (The rin Fig. 2b is defined as exp[E(T0 − Tsrfc)] and the Rayleigh number based on the viscosity at T = T0and % = 0 is fixed.) As F increases, the sluggish lid regime shrinks and disappears at F = 4. Instead,a new regime called the plate like regime appears at F > 4. On the plate like regime, the lithosphere isfragmented into pieces or plates separated by ridges, and the plates rigidly move by their own thermallyinduced negative buoyancy (see the plates a and b and the curve of surface velocity in Fig. 2c). The heatflow at the surface boundary decreases with increasing distance from the ridge L as 1/
√L when the
plates are young as is the case for the Earth (Parker and Oldenberg, 1973). The secondary plumes grow atthe base of the lithosphere as indicated in Fig. 2c (see also Richter and Parsons, 1975). Such a convectivemotion of plates never occurs on the stagnant lid regime at higher r , while the moving plates are not rigidat all and significantly deform by their own weight on the weak plate regime at lower r (Figs. 2b and c).
As illustrated in Fig. 2b, the plate like regime occurs when
'D < 'plate (4)
384 M. Ogawa / Fluid Dynamics Research 40 (2008) 379–398
stressσIσD
ln (v
isco
sity
)
F
0 2 4 6 8103
104
105
106
107
108
109
Sluggish Lidregime
visc
osity
con
tras
t (r)
F
σD = σplate
σI = σplate
0.00
0-1
1
3
heat flow1/(heat flow)2
3×10⁻⁵
-3×10⁻⁵surface velocity
F > 4
F = 0
0 < F < 4
Stagnant Lid regime
Weak Plate regime
plate aplate b
ridge
secondary plume
Plate Like regime
surface velocity
surface velocity
0
Fig. 2. The assumed stress-dependence of viscosity (a), the regime diagram (b), and typical convective flow patterns in each ofthe regimes (c) for the numerical models of thermal convection with moving plates in Ogawa (2003a). The abscissa F in (b)indicates how strongly the viscosity depends on stress as illustrated in (a). In (c), the color shows temperature distribution in theconvecting vessel, while the curves of “surface velocity”, “heat flow”, and “1/(heat flow)2” show the plots of these quantitieson the surface boundary against horizontal coordinate. The unit of surface velocity is cm/yr. The figures (b) and (c) are takenfrom Ogawa (2003a) with modification.
and
'plate < 'I, (5)
where 'plate is the stress induced within the plates owing to their own weight. This stress 'plate is wellapproximated as "0#g(T0 − Tsrfc)!/2, where ! is the thickness of plates, and is about 60 MPa for oldoceanic plates with ! ≈ 100 km. 'plate is certainly higher than the rupture strength at plate margins, onthe order of 1 MPa, estimated from the stress drop of shallow earthquakes, and inequality (4) is almostcertainly satisfied in the Earth. Inequality (5) is also likely satisfied in the Earth according to the earlierestimates (Cloetingh et al., 1984; Mueller and Phillips, 1991; Erickson and Arkani-Hamed, 1993). It ismost likely, therefore, that the Earth lithosphere is indeed on the plate like regime. Since the roots of theplate like regime is the sluggish lid regime (see Fig. 2b), it is safe to say that the sluggish lid regime isthe roots of the plate tectonics observed on the Earth.
M. Ogawa / Fluid Dynamics Research 40 (2008) 379–398 385
2.3. Implications for mantle dynamics and evolution
Inequality (5) has a profound implication for the dynamics and evolution of the Earth mantle. Thisinequality implies that the plates are mechanically so strong that new plate boundaries would neverspontaneously develop by the weight of the plates themselves. Subduction of oceanic plates would neverbe spontaneously initiated, for example, at the passive margins beneath the Atlantic Ocean regardless ofhow old and how heavy the oceanic plates become. (Notice that the thickness of plates and hence 'platecannot indefinitely increase with the age of the plates because of the secondary plumes beneath the platesobserved in Fig. 2 (Parsons and McKenzie, 1978).) As a result, the non-subducting Atlantic-type oceanicplates and buoyant continental plates would cover the entire surface of the Earth, and plate tectonics wouldstop working within a few hundred million years, unless some agents that reside outside the frameworkof plate tectonics induce new plate margins beneath the Atlantic Ocean. Namely, inequality (5) suggeststhat plate tectonics is not an autonomous activity and has continued for billions of years on the Earth bythe help of some agents that break the lithosphere from the outside.
Two suggested examples of such agents are, as discussed above, continental collision (Coblentz et al.,1998) and hot mantle plumes (Burke and Dewey, 1973; Richards et al., 1989). Continental collision is,however, a stochastic process whose frequency may have much fluctuated in the Earth history. The activityof hot mantle plumes has also been suggested to have much fluctuated in the Earth history (Prokoph et al.,2004). It is, therefore, reasonable to expect that the configuration of plates and, more generally the activityof plate tectonics, have fluctuated much in the Earth history. The Wilson cycle of continental drifts maybe understood as a part of this fluctuation. Since moving plates are the most important agents that extractheat from the Earth interior and the efficiency of heat extraction by plates critically depends on plateconfiguration (Grigne et al., 2005), the thermal state of the mantle may have fluctuated much with time,too. The thermal history of the Earth mantle may be more stochastic than assumed in a class of models,called parameterized convection models, that are based on an empirical and deterministic relationshipbetween the efficiency of convective heat transport and the parameters that characterize the rheology ofmantle materials (see, e.g. Schubert et al., 2001 for a review). I will return back to these issues in Sections4 and 5 below.
Inequality (4) is also important to understand why, first of all, plate tectonics takes place on the Earthbut does not on other terrestrial planets, especially on Venus which is similar to the Earth in both sizeand bulk composition (Kaula, 1995). On the Earth, inequality (4) holds probably because the water onthe Earth surface softens the materials in plate margins and makes 'D < 'plate; in the absence of water,as is the case for Venus, this inequality would be violated (Kaula, 1995; Schubert et al., 2001).
3. The origin of mantle heterogeneity and superplumes
The Earth mantle is chemically heterogeneous as has been revealed from geochemical studies ofcrustal materials (see a review by Hofmann, 1997). The materials in oceanic crusts generated by ridgemagmatism (called Mid-Oceanic Ridge Basalts or MORB) are depleted in heat producing elements U, Thand other incompatible elements compared with the crustal materials in ocean islands generated by hotspot magmatism (called Oceanic Island Basalts or OIB). (Here, “incompatible elements” are the elementsthat are excluded from minerals and preferentially enter magma in partially molten rocks.) This impliesthat the source regions of MORB, probably the uppermost mantle, are more depleted in the incompatible
386 M. Ogawa / Fluid Dynamics Research 40 (2008) 379–398
elements than the source regions of OIB, suggested to be somewhere in deep mantle, and hence that thereare at least two chemical reservoirs in the mantle. The presence of a chemical reservoir undepleted inheat producing elements is also inferred from the studies of thermal history of the mantle (Kellogg et al.,1999). If the entire mantle were depleted in heat producing elements, as is the case for the uppermostmantle, the cooling rate of the mantle would have been much higher than observed for the Earth mantle.Here in this section, I discuss how the chemical heterogeneity has developed in the convecting mantle ofthe Earth and how the configuration of the heterogeneity is controlled by mantle convection.
3.1. Seismic observations
One obstacle to the study of mantle heterogeneity has been the difficulty in constraining the configu-ration of the chemical heterogeneity from the geochemical observations. The geochemical observations,though do show that the mantle is chemically heterogeneous, do not strongly constrain the configurationof the heterogeneity. This obstacle has been, however, overcome by the recent development of seismictomography.
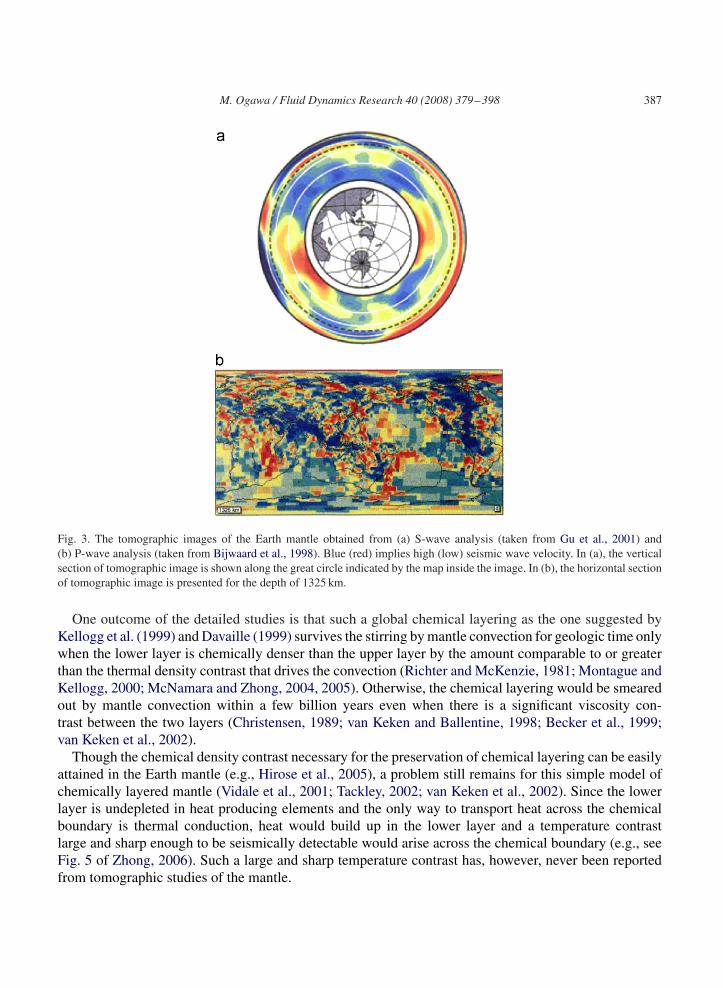
The tomographic images show that there are broad regions, called superplumes, characterized by lowseismic wave velocity in the lowermost mantle beneath Africa and south Pacific (e.g., Kennett et al., 1998;Bijwaard et al., 1998; Megnin and Romanowicz, 2000; Gu et al., 2001; Grand, 2002) (see Fig. 3a). The lowseismic wave velocity suggests that the superplumes are hotter than the surrounding mantle. Furthermore,there are discrepancies between the images of superplumes obtained from bulk sound velocity and thosefrom S-wave velocity, suggesting that the superplumes are both thermal and chemical origin (Kennettet al., 1998).
Kellogg et al. (1999) and Davaille (1999) compared the superplumes chemically distinct from thesurrounding mantle to the undepleted reservoir of OIB source and proposed a mantle heterogeneitymodel. According to the model, (a) the mantle is chemically layered with a global chemical bound-ary at depth in the lower mantle; (b) the chemical boundary is undulating and the elevated parts of theboundary are recognized as the superplumes; (c) the upper (lower) layer, which is the source of MORB(OIB), is depleted (undepleted) in the incompatible elements; and (d) hot plumes are rising up from thesuperplumes to induce hot spot magmatism. (See Fig. 4a, reprinted with permission from Kellogg et al.,1999; Copyright (1999) AAAS.) Davaille (1999) emphasizes that the model can explain the cluster-ing of hot spots over the topographic highs, called superswells, which develop above the superplumes(e.g., Richards et al., 1988).
3.2. Convective stirring and mantle heterogeneity
In spite of the model proposed by Kellogg et al. (1999) and Davaille (1999), the nature of the su-perplumes is still an open problem. It is not clear at all how such chemically distinct superplumes havedeveloped and survived in a convecting mantle stirred by moving plates (Gurnis and Davies, 1986). In theEarth mantle, subducted oceanic plates penetrate deep into the lower mantle and induce a mantle-wideconvective circulation (Grand, 1994; van der Hilst et al., 1997). (See the images of subducted slabs inthe lower mantle indicated by blue bands beneath American continents and the Alps–Himalayan regionsin Fig. 3b.) The mantle-wide circulation may have efficiently smeared out any chemical heterogeneityin the mantle on geologic time (Gurnis and Davies, 1986). This problem has spurred detailed studies onhow efficiently mantle convection stirs the chemically heterogeneous mantle.
M. Ogawa / Fluid Dynamics Research 40 (2008) 379–398 387
Fig. 3. The tomographic images of the Earth mantle obtained from (a) S-wave analysis (taken from Gu et al., 2001) and(b) P-wave analysis (taken from Bijwaard et al., 1998). Blue (red) implies high (low) seismic wave velocity. In (a), the verticalsection of tomographic image is shown along the great circle indicated by the map inside the image. In (b), the horizontal sectionof tomographic image is presented for the depth of 1325 km.
One outcome of the detailed studies is that such a global chemical layering as the one suggested byKellogg et al. (1999) and Davaille (1999) survives the stirring by mantle convection for geologic time onlywhen the lower layer is chemically denser than the upper layer by the amount comparable to or greaterthan the thermal density contrast that drives the convection (Richter and McKenzie, 1981; Montague andKellogg, 2000; McNamara and Zhong, 2004, 2005). Otherwise, the chemical layering would be smearedout by mantle convection within a few billion years even when there is a significant viscosity con-trast between the two layers (Christensen, 1989; van Keken and Ballentine, 1998; Becker et al., 1999;van Keken et al., 2002).
Though the chemical density contrast necessary for the preservation of chemical layering can be easilyattained in the Earth mantle (e.g., Hirose et al., 2005), a problem still remains for this simple model ofchemically layered mantle (Vidale et al., 2001; Tackley, 2002; van Keken et al., 2002). Since the lowerlayer is undepleted in heat producing elements and the only way to transport heat across the chemicalboundary is thermal conduction, heat would build up in the lower layer and a temperature contrastlarge and sharp enough to be seismically detectable would arise across the chemical boundary (e.g., seeFig. 5 of Zhong, 2006). Such a large and sharp temperature contrast has, however, never been reportedfrom tomographic studies of the mantle.
388 M. Ogawa / Fluid Dynamics Research 40 (2008) 379–398
Fig. 4. (a) An illustration of mantle heterogeneity model taken from Kellogg et al. (1999). The mantle is chemically layered witha chemical boundary in the lower mantle. The upper (lower) layer is depleted (enriched) in heat producing elements and otherincompatible elements. (b) An illustration of mantle heterogeneity model proposed by Hofmann and White (1982) and Davies(1990). The subducted oceanic crusts are drawn by dots and short segments of lines. The figure is taken from Davies (1990).
3.3. Magmatism and mantle heterogeneity
The absence of global chemical boundary with a large temperature contrast discussed above suggeststhat the observed superplumes (Fig. 3) are not statically maintained by their chemical buoyancy. Instead,the superplumes are likely to be maintained by a dynamic balance between (a) some agents that generatethe superplumes by chemically differentiating the mantle and (b) convective stirring that smears outthe chemically distinct superplumes; such a balance allows mass exchange and the resulting convectiveheat exchange between the superplumes and the surrounding mantle. The only possible agent that canchemically differentiate the mantle on the global scale is magmatism and ridge magmatism is the mostactive among the magmatism observed on the present Earth. Hofmann and White (1982) and Davies(1990) speculate that the subducted oceanic crusts formed by ridge magmatism are chemically denser
M. Ogawa / Fluid Dynamics Research 40 (2008) 379–398 389
1200
1400
1600
1800
4 8 12average internal heating rate H [pW/kg]
aver
age
tem
pera
ture
[K]
16 20
upper mantlewhole mantle
Chemically Stratified regime
Thermal Convection regime
PLs8
PL10 PL14
273 2373harzburgitebasalt
1.1 Gyr
1.7 Gyr
2.5 Gyrsuperplume
ridge magmatismbasaltic crustresidual layer
temperature & magmacomposition
Case PL10; H = 10 pW/kg
[K]
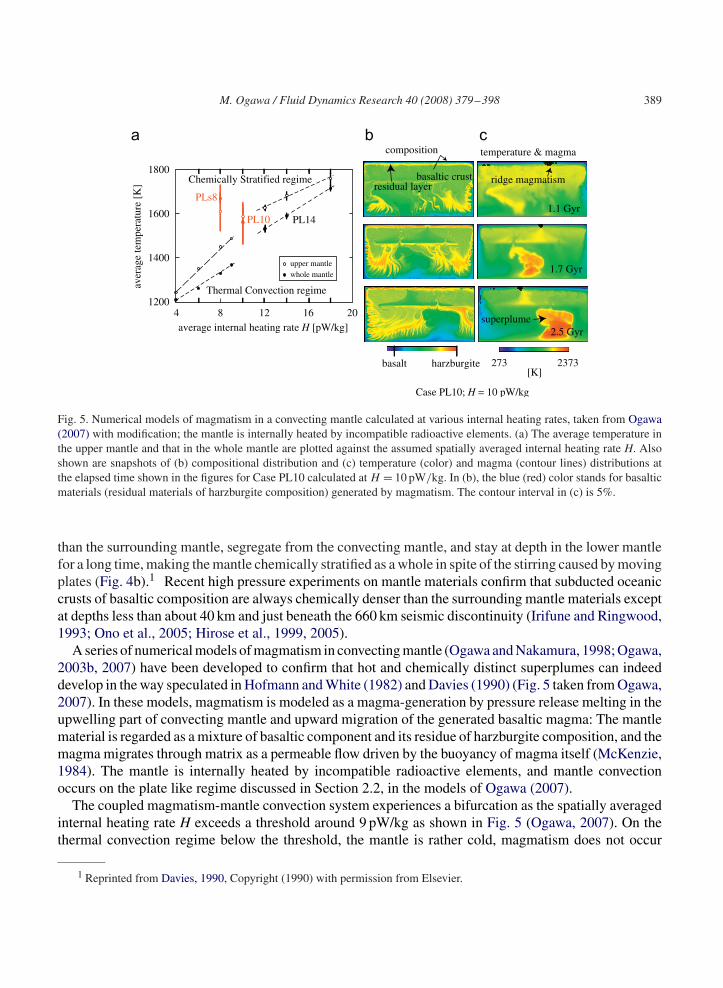
Fig. 5. Numerical models of magmatism in a convecting mantle calculated at various internal heating rates, taken from Ogawa(2007) with modification; the mantle is internally heated by incompatible radioactive elements. (a) The average temperature inthe upper mantle and that in the whole mantle are plotted against the assumed spatially averaged internal heating rate H. Alsoshown are snapshots of (b) compositional distribution and (c) temperature (color) and magma (contour lines) distributions atthe elapsed time shown in the figures for Case PL10 calculated at H = 10 pW/kg. In (b), the blue (red) color stands for basalticmaterials (residual materials of harzburgite composition) generated by magmatism. The contour interval in (c) is 5%.
than the surrounding mantle, segregate from the convecting mantle, and stay at depth in the lower mantlefor a long time, making the mantle chemically stratified as a whole in spite of the stirring caused by movingplates (Fig. 4b).1 Recent high pressure experiments on mantle materials confirm that subducted oceaniccrusts of basaltic composition are always chemically denser than the surrounding mantle materials exceptat depths less than about 40 km and just beneath the 660 km seismic discontinuity (Irifune and Ringwood,1993; Ono et al., 2005; Hirose et al., 1999, 2005).
A series of numerical models of magmatism in convecting mantle (Ogawa and Nakamura, 1998; Ogawa,2003b, 2007) have been developed to confirm that hot and chemically distinct superplumes can indeeddevelop in the way speculated in Hofmann and White (1982) and Davies (1990) (Fig. 5 taken from Ogawa,2007). In these models, magmatism is modeled as a magma-generation by pressure release melting in theupwelling part of convecting mantle and upward migration of the generated basaltic magma: The mantlematerial is regarded as a mixture of basaltic component and its residue of harzburgite composition, and themagma migrates through matrix as a permeable flow driven by the buoyancy of magma itself (McKenzie,1984). The mantle is internally heated by incompatible radioactive elements, and mantle convectionoccurs on the plate like regime discussed in Section 2.2, in the models of Ogawa (2007).
The coupled magmatism-mantle convection system experiences a bifurcation as the spatially averagedinternal heating rate H exceeds a threshold around 9 pW/kg as shown in Fig. 5 (Ogawa, 2007). On thethermal convection regime below the threshold, the mantle is rather cold, magmatism does not occur
1 Reprinted from Davies, 1990, Copyright (1990) with permission from Elsevier.
390 M. Ogawa / Fluid Dynamics Research 40 (2008) 379–398
at all or is negligible, and a convective flow pattern of the plate like regime similar to the one shownin Fig. 2c takes place. On the chemically stratified regime above the threshold, in contrast, the mantlebecomes hot enough to induce active ridge magmatism (Fig. 5c). The ridge magmatism chemicallydifferentiate the mantle and induces a superplume at depth in the lower mantle: The ridge magmatisminduces a thin basaltic crust and a layer of residual harzburgite indicated by blue and red, respectively,in Fig. 5b. After subduction, the basaltic crusts sediment on the bottom boundary of mantle owing totheir chemically induced high density. Since the subducted basaltic crusts are enriched in incompatibleradioactive elements, heat builds up in the pile of basaltic materials (Fig. 5c), and the pile becomes asuperplume characterized by high temperature and high content of basaltic component. Such superplumeswell develop in all of the cases with H higher than the threshold (Fig. 5a).
A striking feature of the coupled magmatism-mantle convection system is that the chemically stratifiedregime can take place, i.e. superplumes can well develop, even below the threshold; I started a calculationfrom a thermo-chemical state above the threshold and reduced H to 8 pW/kg, the value at the pointslabeled as “PLs8” in Fig. 5a. This can happen because the rate of heat extraction from the mantle bymoving plates strongly depends on the size and configuration of plates, which are not uniquely determinedfrom such parameters as H and the Rayleigh number that characterize the mantle as discussed in Section2.3 above. I will return to this issue in Section 4 below.
Further numerical experiments in Ogawa (2007) show that superplumes well develop only on the platelike regime and do not develop well on the weak plate regime identified in Fig. 2b. This occurs becausethe plate motion on the weak plate regime is more chaotic than that on the plate like regime and stirsthe mantle more efficiently. The strong influence of the dynamic behavior of the lithosphere may beone reason that superplumes similar to the one observed in Figs. 5b and c do not occur in some of theearlier models of magmatism in convecting mantle (e.g., Gurnis, 1986; Christensen and Hofmann, 1994;Davies, 2002; Nakagawa and Tackley, 2005): The efficiency of convective stirring in these models maybe higher than that in the models shown in Fig. 5. (Notice, however, that the way mantle magmatism ismodeled is also different in these earlier models. The bifurcation observed in Fig. 5a takes place onlywhen magmatism becomes more vigorous as the mantle becomes hotter. This feature is not well capturedin some of the earlier models.)
4. Superplumes in the Earth history
The numerical experiments on the plate like regime also show that the dynamics of superplumessignificantly depends on the internal heating rate and hence on the age of the Earth (Ogawa, 2007), and Ipresent Fig. 6 to discuss this dependence.
In the early Earth where the spatially averaged internal heating rate H is high (Case PL14), a partof the superplume is frequently detached and rises up to the surface as a hot plume (Fig. 6f). The hot−−−−−−−−−−−−−−−−−−−−−−−−−−−−−−−−−−−−−−−−−−−−−−−−−−−−−−−−−−−−−−−−−−−−−−−−−→
Fig. 6. The numerical models of Case PL14 (a–f) and Case PLs8 (g–l), both indicated in Fig. 5, taken from Ogawa (2007) withmodification. The average temperatures in the upper mantle TUM and whole mantle TWM (a and g), surface heat flow (b and h),plate velocity (c and i), and horizontally averaged magma-eruption rate (d and j) are plotted against time. The snapshots in (e),(f), (k), and (l) are the same as Figs. 5b and c but for the indicated cases. The horizontal bars above (a) and (g) indicate the periodduring which plates move; the single (double) bars imply that there is one (are two) moving plate(s). The red marks beneath(b)–(d) show the period when the plume shown in (f) for 4.8 and 4.83 Gyr induces hot spot magmatism.
M. Ogawa / Fluid Dynamics Research 40 (2008) 379–398 391
1000
2000
TWM
TUM
T [
K]
0
200
h [
mW
/m2 ]
0
5
Usr
fc [
cm/y
r]
0.0
0.2
0 5 10 15 20
m [
cm/y
r]
time [Gyr]
7.83 Gyr
8.18 Gyr
8.51 Gyr
10.3 Gyr
11.5 Gyr
superplume
hot spot magmatism
ridge magmatism
plate aplate b
1000
2000
0
200
0
5
0
0.2
0 1 2 3 4 5 6 7time [Gyr]
T [
K]
h [
mW
/m2 ]
Usr
fc [
cm/y
r]m
[cm
/yr]
TUM
TWM
4.77 Gyr
4.80 Gyr
4.83 Gyr
5.20 Gyr
hot spot magmatism
basaltic harzburgite 273 2373
[K]
basaltic crust
residual layer
hot plume
plate
ridge magmatism
Case PL14; H = 14pW/kg Case PLs8; H = 8pW/kg
superplume
plate c
392 M. Ogawa / Fluid Dynamics Research 40 (2008) 379–398
plume induces magma at depths as great as the top of the lower mantle (Fig. 6f) and also induces vigorousmagma-eruption (Fig. 6d). The plume shown in Fig. 6f for 4.8 Gyr, for example, induces the spikes inFig. 6d during the period indicated by the red bar in the figure. The “hot spot magmatism” inducesnew ridges just above the superplume. Since the hot spot magmatism is so frequent (see the spikes inFigs. 6b–d), there is always a ridge above the superplume (Fig. 6f). As a consequence, plate tectonicscontinuously occurs throughout the calculated period of time (see the horizontal bar above Figs. 6aand c). The rather steady plate tectonics keeps the thermal and chemical state of the mantle statisticallysteady (Figs. 6a, e, and f).
When I reduced the average internal heating rate H to the value appropriate for the present Earth(Schubert et al., 2001) from H for Case PL14, I reached a thermo-chemical state of the mantle qualitativelyidentical to that of Case PLs8 shown in Figs. 6g–l; the mantle is still on the chemically stratified regime,though both superplume activity and plate tectonics become more intermittent. (See Ogawa (2007) forthe detail of initial condition of Case PLs8.) Heat builds up in the mantle including the superplume whenthe lithosphere is stagnant (Figs. 6g and i). The mantle materials just above the superplume are basallyheated by the superplume and eventually rise up to the surface as plumes (Fig. 6l for 7.83–8.51 Gyr).The plumes are not so hot as the ones observed in Case PL14 and hence does not induce deep magmageneration. The plumes, however, do induce hot spot magmatism and let plate tectonics start (Fig. 6lfor 8.18 Gyr). The resulting ridge magmatism chemically differentiates the mantle and lets a superplumegrow (Fig. 6k for 8.51 and 10.3 Gyr). The moving plates, however, efficiently cools the mantle andsuperplume (Figs. 6g and l for 8.51 and 10.3 Gyr), and both hot spot magmatism and ridge magmatismdecline (Fig. 6j). Eventually, plate tectonics stops when the ridge is swallowed by a subduction zoneand annihilates. (See Fig. 6l for 10.3 Gyr. The ridge in the figure is moving to the right because the“plate c” is stagnant. Eventually, the ridge is swallowed by the subduction zone at the top right cornerof the figure.) Heat builds up in the mantle again during the subsequent time when the lithosphere isstagnant (Fig. 6g).
Plate tectonics does not continue long in Case PLs8, because the activity of superplume is so low thathot spot magmatism does not induce new ridges before the existing ones annihilate. The intermittencyof plate tectonics and superplume activity is the reason why the mantle stays on the chemically stratifiedregime in Case PLs8, despite that the assumed H is lower than the threshold discussed in Section 3.4.
5. Toward the integrated model of mantle evolution
The progress in the studies of mantle dynamics reviewed above has made it within reach of numer-ical efforts to construct an integrated model of tectonic evolution and mantle evolution for the Earth.Plate tectonics that shapes the overall features of tectonic activity on the present Earth has been alreadywell modeled as discussed in Section 2. The similarity between the tomographic images of the mantle(Fig. 3) and the mantle heterogeneity patterns obtained in numerical models (Figs. 5 and 6) suggests thatthe major agents that shape the mantle structure have been already captured in the model, too. It makessense now to ask, on one hand, how the thermal and chemical state of the mantle has evolved underthe influence of tectonic activities of the Earth and to ask, on another hand, how the mantle evolutionhas influenced the tectonic evolution of the Earth based on such numerical models as the ones shown inFigs. 5 and 6.
Figs. 6a–f drop hints on how the Earth looked like on the early stage of its evolutionary history, whenthe mantle was strongly heated by radioactive elements (Ogawa, 2007). In the mantle of early Earth, hot
M. Ogawa / Fluid Dynamics Research 40 (2008) 379–398 393
plumes are likely to have frequently risen up from superplumes to cause active hot spot magmatism. Theactive hot spot magmatism would have split the lithosphere more frequently than the plumes do in thepresent mantle (Burke and Dewey, 1973; Richards et al., 1989). The early Earth is, therefore, likely tohave been covered with a large number of small plates in contrast to the present Earth that is covered bya limited number of large plates, thousands of kilometers across.
The speculated small size and large number of plates in the early Earth are exactly what are suggestedfrom the detailed studies of the structure of continental crusts formed in the Archean (an era from 3.8to 2.5 Gyrs ago) and the Proterozoic (2.5–0.56 Gyrs ago). There were only fragments of continents, afew hundred kilometers in size, till middle Archean, but these fragments were assembled to form largeand stable continents, thousands kilometers in size, during a period from the late Archean to the earlyProterozoic (e.g., Hoffman, 1988; de Wit et al., 1992; Myers, 1993). It has been suggested from theseobservations that, in the Archean, (a) the entire Earth has been covered by a large number of smalloceanic plates as is the case for the present west Pacific region, and (b) the island arc volcanism due to thesubduction of small oceanic plates formed the fragments of continental crusts (e.g., Myers, 1993). Thesuggested small size and large number of plates in the Archean is consistent with the high superplumeactivity in a strongly heated mantle shown in Figs. 6a–f (Ogawa, 2007). The deep magma-generationobserved in Fig. 6, another striking feature of plumes in a strongly heated mantle, is also consistent withthe frequent komatiite magma-generation in the Archean (Arndt, 2003).
The episodic superplume activity at low internal heating rate (Figs. 6g–l) is, in contrast, importantin understanding the nature of tectonic activity of the Earth since the Proterozoic (Ogawa, 2007).A striking feature of the tectonic activity during that period is the occasional formation of supercon-tinents by continental collision and their splitting, i.e. Wilson cycle (e.g., Windley, 1995). A simplekinetic model of continental drift suggests that Wilson cycle can occur on the Earth, only when theactivity of plumes that split supercontinents largely fluctuates with time (Duncan and Turcotte, 1994).Indeed, superplume activity has been suggested to be episodic (e.g., Ernst and Buchan, 2002), and theepisodic nature of superplume has been suggested to be the cause of the fluctuation in tectonic activityin the Earth history (e.g., Stein and Hofmann, 1994; Davies, 1995; Condie, 1995; Yale and Carpenter,1998). The episodic superplume activity suggested from the Wilson cycle can be well understood from theepisodic superplume activity at low internal heating rate shown in Figs. 6g–l. A corollary to the episodicsuperplume activity is a large fluctuation in the thermal and chemical state of the Earth mantle: Figs. 6g,k, and l suggest that the thermochemical evolution of the Earth mantle has been more fluctuating than thatexpected from classical deterministic models of thermal history of the Earth based on the parameterizedconvection technique (e.g., Schubert et al., 2001) as has been already discussed in Section 2.3.
A comment is necessary here on the cause of episodic activity of superplumes. The flushing event causedby the high pressure induced phase transition at the depth around 660 km (Christensen and Yuen, 1985;Machetel and Weber, 1991; Tackley et al., 1994) has been invoked as the cause of the episodic activityof superplumes (e.g., Stein and Hofmann, 1994; Davies, 1995; Condie, 1995). The phase boundary hasa negative Clausius–Clapeyron slope (Ito and Takahashi, 1989), and the phase boundary is at a depthslightly greater than the average depth of the 660 km seismic boundary in cold subducting slabs. Thecold subducting slabs are, therefore, less dense than the surrounding mantle just beneath the average660 km boundary. The resulting positive buoyancy impedes slab penetration into the lower mantle. Whenthe impedance to slab penetration is moderate, subducting slabs intermittently penetrate or “flush” intothe lower mantle. This flushing event has been suggested to episodically activate superplumes in theEarth. It is, however, hard to cause flushing of mechanically strong slabs (Christensen, 1996) at the
394 M. Ogawa / Fluid Dynamics Research 40 (2008) 379–398
given Clausius–Clapeyron slope of the phase boundary (e.g., Fei et al., 2004). The tomographic imagesof subducting slabs indicate that the slabs do stagnate beneath several subduction zones, but that thestagnation takes place at various depths ranging from 550 to 800 km (Fukao et al., 2001), often awayfrom the 660 km seismic discontinuity. It is unlikely that the 660 km phase boundary is relevant to theepisodic activation of superplumes.
It is easy to extend the mantle evolution model developed for the Earth to other terrestrial planetswhere the lithosphere is stagnant and plate tectonics does not take place (Venus, Mars, the moon, etc.,see the review by Schubert et al., 2001). We can make the lithosphere stagnant by raising the rupturestrength at plate margins 'D in Fig. 2 above the stress level induced by the weight of the lithosphereitself. The resulting model may be useful in understanding the tectonic and volcanic activities of Venus:'D is expected to be high because of the lack of water on Venus (Kaula, 1995) (see Section 2.3 above).We may also obtain mantle evolution models for Mars and the moon, whose mantles are shallower andgravitational acceleration is smaller, by making the Rayleigh number smaller. Following the pioneeringmodeling of mantle convection in Venus and Mars (see the reviews of Schubert et al., 2001 for Venusand Nimmo and Tanaka, 2005 for Mars), such a systematic study may shed light on the cause of, say,the resufacing of Venus (e.g., Phillips and Hansen, 1998; Stofan et al., 2005) and the localized volcanicactivity that has continued for billions of years at Tharsis and Elysium on Mars (Solomon et al., 2005)(but see the reservation below).
To further proceed in the study of mantle evolution, however, the models must be extended in threedirections:
(a) First, more attention must be paid to the influence of planetary formation processes on mantle evo-lution, especially in the study of small planets like Mars and the moon where a large portion of thesurfaces are formed as early as 4 billion years ago or more (e.g., Parmentier et al., 2002; Elkins-Tantonet al., 2005). Magma-ocean that most likely develops at the time of planetary formation (e.g., Kaula,1979; Abe and Matsui, 1986; Benz and Cameron, 1990) strongly influences the thermal and chemicalstate of the mantle on the earliest stage of the history of terrestrial planets.
(b) Second, the formation of continental crusts, a major component of the Earth tectonic activities, mustbe modeled and must be implemented in the above discussed models of the Earth mantle evolution.This extension is crucial to understand the history of continental growth (e.g., Condie, 1989; Windley,1995; Rino et al., 2004). This extension is also important to understand the Wilson cycle of continentaldrift, which is known to have occurred at least since Proterozoic (Windley, 1995), within the contextof mantle evolution. In modeling the formation of continental crusts, much attention must be paid tothe role that water plays; water strongly affects the properties of mantle and crustal materials, andthis effect is crucial in the formation of continental crusts (Campbell and Taylor, 1983).
(c) Third, the models must be extended to the mantle in a three-dimensional spherical shell. As discussedin Section 2.3, plate behavior is expected to be rather stochastic and fluctuating because of inequality(5), especially when the internal heating is mild (see Figs. 6g–l). Such stochastic behavior wouldstrongly depend on the geometry of convecting vessel. The issue of the Wilson cycle discussed above,for example, can be ultimately resolved only by calculations in a three-dimensional spherical shell(see, e.g., Phillips and Bunge, 2005). The influence of plate motion on the configuration of thermo-chemical heterogeneity in deep mantle, including superplumes, also strongly depends on the geometry(Bunge et al., 1996; Van Keken and Zhong, 1999; Xie and Tackley, 2004; McNamara and Zhong,2004, 2005; Huang and Davies, 2007). In spite of the enormous computational load, the pioneering
M. Ogawa / Fluid Dynamics Research 40 (2008) 379–398 395
three-dimensional calculations (e.g., Baumgardner, 1985; Bercovici et al., 1989; Tackley et al., 1994)encourage us to extend the models in this direction.
These three extensions are all challenging and are highly rewarding.
Acknowledgment
This work is financially supported by KAKENHI 16540379 by MEXT of Japan.
References
Abe, Y., Matsui, F., 1986. Early evolution of the Earth: accretion, atmosphere formation, and thermal history. J. Geophys. Res.91, E291–E302.
Arndt, N., 2003. Komatiites, kimberutes, and boninites. J. Geophys. Res. 108, 2293.Auth, C., Bercovici, D., Christensen, U.R., 2003. Two-dimensional convection with a self-lubricating, simple-damage rheology.
Geophys. J. Int. 154, 783–800.Baumgardner, J.R., 1985. Three dimensional treatment of convective flow in the Earth’s mantle. J. Stat. Phys. 39 (5/6), 501–511.Becker, T.W., Kellogg, J.B., O’Connell, R.J., 1999. Thermal constraints on the survival of primitive blobs in the lower mantle.
Earth Planet. Sci. Lett. 171, 351–365.Benz, W., Cameron, A.G.W., 1990. Terrestrial effects of the giant impact. In: Newsome, H.E., Jones, J.H. (Eds.), Origin of the
Earth. Oxford University Press, Oxford, pp. 61–67.Bercovici, D., 1996. Plate generation in a simple model of lithosphere–mantle flow with dynamic self-lubrication. Earth Planet.
Sci. Lett. 144, 41–51.Bercovici, D., Schubert, G., Glatzmaier, G.A., 1989. Three-dimensional spherical models of convection in the Earth’s mantle.
Science 244, 950–955.Bercovici, D., Ricard, Y., Richards, M.A., 2000. The relation between dynamics and plate tectonics: a primer. in: Richards,
M.A., Gordon, R.G., van der Hilst, R.D. (Eds.), The History and Dynamics of Global Plate Motions. American GeophysicalUnion, Washington. Geophys. Monogr. 121, 5–46.
Bijwaard, H., Spakman, W., Engdahl, E.R., 1998. Closing the gap between regional and global travel time tomography.J. Geophys. Res. 103, 30055–30078.
Bunge, H-.P., Richards, M.A., Baumgardner, J.R., 1996. Effect of depth-dependent viscosity on the planform of mantleconvection. Nature 379, 436–438.
Burke, K., Dewey, J.F., 1973. Plume-generated triple junctions: key indicators in applying plate tectonics to old rocks. J. Geol.81, 406–433.
Campbell, I.H., Taylor, S.R., 1983. No water, no granites—no ocean, no continents. Geophys. Res. Lett. 10, 1061–1064.Christensen, U.R., 1984. Heat transport by variable viscosity convection and implications for the Earth’s thermal evolution.
Phys. Earth Planet. Int. 35, 264–282.Christensen, U.R., 1985. Heat transport by variable viscosity convection II: pressure influence, non-Newtonian rheology and
decaying heat sources. Phys. Earth Planet. Int. 37, 183–205.Christensen, U., 1989. Mixing by time-dependent convection. Earth Planet. Sci. Lett. 95, 382–394.Christensen, U., 1996. The influence of trench migration on slab penetration into the lower mantle. Earth Planet. Sci. Lett. 140,
27–39.Christensen, U., Harder, H., 1991. Three-dimensional convection with variable viscosity. Geophys. J. Int. 104, 213–226.Christensen, U., Yuen, D.A., 1985. Layered convection induced by phase transition. J. Geophys. Res. 90, 10291–10300.Christensen, U.R., Hofmann, A.W., 1994. Hofmann, Segregation of subducted oceanic crust in the convecting mantle. J. Geophys.
Res. 99, 19867–19884.Cloetingh, S.A.P.L., Wortel, M.J.R., Vlaar, N.J., 1984. Passive margin evolution, initiation of subduction and the Wilson Cycle.
Tectonophysics 109, 147–163.
396 M. Ogawa / Fluid Dynamics Research 40 (2008) 379–398
Coblentz, D.D., Zhou, S., Hillis, R.R., Richardson, R.M., Sandiford, M., 1998. Topography, boundary forces, and the Indo-Australian intraplate stress field. J. Geophys. Res. 103, 919–931.
Condie, K.C., 1989. Plate Tectonics and Crustal Evolution, third ed. Pergamon Press, Oxford, 476pp.Condie, K.C., 1995. Episodic ages of greenstones: a key to mantle dynamics? Geophys. Res. Lett. 22, 2215–2218.Conrad, C.P., Hager, B.H., 2001. Mantle convection with strong subduction zones. Geophys. J. Int. 144, 271–288.Conrad, C.P., Lithgow-Bertelloni, C., 2002. How mantle slabs drive plate tectonics. Science 298, 207–209.Davaille, A., 1999. Simultaneous generation of hotspots and superswells by convection in a heterogeneous planetary mantle.
Nature 402, 756–760.Davies, G.F., 1990. Mantle plumes, mantle stirring and hotspot chemistry. Earth Planet. Sci. Lett. 99, 94–109.Davies, G.F., 1995. Punctuated tectonic evolution of the earth. Earth Planet. Sci. Lett. 1336, 363–379.Davies, G.F., 2002. Stirring geochemistry in mantle convection models with stiff plates and slabs. Geochim. Cosmochim. Acta
66, 3125–3142.de Wit, M.S., Roering, C., Hart, R.J., Armstrong, R.A., de Ronde, C.E.J., Green, R.W.E., Tredoux, M., Peberdy, E., Hart, R.A.,
1992. Formation of an Archean continent. Nature 357, 553–562.Duncan, C.C., Turcotte, D.L., 1994. On the breakup and coalescence of continents. Geology 22, 103–106.Eldholm, O., Coffin, M.F., 2000. Large igneous provinces and plate tectonics. in: Richards, M.A., Gordon, R.G., van der Hilst,
R.D. (Eds.), The History and Dynamics of Global Plate Motions. American Geophysical Union, Washington, Geophys.Monogr. 121, 309–326.
Elkins-Tanton, L.T., Zaranek, S.E., Parmentier, E.M., Hess, P.C., 2005. Early magnetic filed and magmatic activity on Mars frommagma ocean cumulate overturn. Earth Planet. Sci. Lett. 236, 1–12.
Erickson, S.G., Arkani-Hamed, J., 1993. Subduction initiation at passive margins: the Scotian basin, eastern Canada as a potentialexample. Tectonics 12, 678–687.
Ernst, R.E., Buchan, K.L., 2002. Maximum size and distribution in time and space of mantle plumes: evidence from large igneousprovinces. J. Geodyn. 34, 309–342.
Fei, Y., Van Orman, J., Li, J., van Westrenen, W., Sanloup, C., Minarik, W., Hirose, K., Komabayashi, T., Walter, M., Funakoshi,K., 2004. Experimentally determined postspinel transformation boundary in Mg2SiO4 using MgO as an internal pressurestandard and its geophysical implication. J. Geophys. Res. 109, B02305.
Forsyth, D., Uyeda, S., 1975. On the relative importance of the driving forces of plate motion. Geophys. J. R. Astron. Soc. 43,163–200.
Fukao, Y., Widiyantoro, S., Obayashi, M., 2001. Stagnant slabs in the upper and lower mantle transition region. Rev. Geophys.39, 291–323.
Grand, S., 1994. Mantle shear structure beneath the Americans and surrounding oceans. J. Geophys. Res. 99, 11591–11621.Grand, S., 2002. Mantle shear-wave tomography and the fate of subducted slabs. Philos. Trans. R. Soc. London A 360,
2475–2491.Grigne, C., Labrosse, S., Tackley, P.J., 2005. Convective heat transfer as a function of wavelength: implications for the cooling
of the Earth. J. Geophys. Res. 110, B03409.Gurnis, M., 1986. The effects of chemical density differences on convective mixing in the Earth’s mantle. J. Geophys. Res. 91,
11407–11419.Gurnis, M., Davies, G.F., 1986. Mixing in numerical models of mantle convection incorporating plate kinematics. J. Geophys.
Res. 91, 6375–6395.Gu, Y.J., Dziewonski, A.M., Su, W., Ekstrom, G., 2001. Models of the mantle shear velocity and discontinuities in the pattern
of lateral heterogeneities. J. Geophys. Res. 106, 11169–11199.Hirose, K., Fei, Y., Ma, Y., MAO, H.-K., 1999. The fate of subducted basaltic crust in the Earth’s lower mantle. Nature 397,
53–56.Hirose, K., Takafuji, N., Sata, N., Ohishi, Y., 2005. Phase transition and density of subducted MORB crust in the lower mantle.
Earth Planet. Sci. Lett. 237, 239–251.Hofmann, A.W., 1997. Mantle geochemistry: the message from oceanic volcanism. Nature 385, 219–229.Hoffman, P.F., 1988. United plates of America, the birth of a craton: early Proterozoic assembly and growth of Laurentia. Annu.
Rev. Earth Planet. Sci. 16, 543–603.Hofmann, A.W., White, W.M., 1982. Mantle plumes from ancient oceanic crust. Earth Planet. Sci. Lett. 57, 421–436.Huang, J., Davies, G.F., 2007. Stirring in three-dimensional mantle convection models and implications of geochemistry: passive
tracers. Geochem. Geophys. Geosyst. 8, Q03017.
M. Ogawa / Fluid Dynamics Research 40 (2008) 379–398 397
Irifune, T., Ringwood, A.E., 1993. Phase transitions in subducted oceanic crust and buoyancy relationships at depths of600–800 km in the mantle. Earth Planet. Sci. Lett. 117, 101–110.
Ito, E., Takahashi, E., 1989. Postspinel transformation in the system Mg2SiO4–Fe2SiO4 and some geophysical implications.J. Geophys. Res. 94, 10637–10646.
Kameyama, M., Ogawa, M., 2000. Transitions in thermal convection with strongly temperature-dependent viscosity in a widebox. Earth Planet. Sci. Lett. 180, 355–367.
Karato, S., Wu, P., 1993. Rheology of the upper mantle: a synthesis. Science 260, 771–778.Kaula, W.M., 1979. Thermal evolution of Earth and moon growing by planetesimal impacts. J. Geophys. Res. 84, 999–1008.Kaula, W.M., 1995. Venus reconsidered. Science 270, 1460–1464.Kellogg, L.H., Hager, B.H., van der Hilst, R.D., 1999. Compositional stratification in the deep mantle. Science 283, 1881–1884.Kennett, B.L.N., Widiyantoro, S., van der Hilst, R.D., 1998. Joint seismic tomography for bulk sound and shear wave speed in
the Earth’s mantle. J. Geophys. Res. 103, 12469–12493.Kohlstedt, D.L., Evans, B., Mackwell, S.J., 1995. Strength of the lithosphere: constraints imposed by laboratory experiments.
J. Geophys. Res. 100, 17587–17602.Machetel, P., Weber, P., 1991. Intermittent layered convection in a model mantle with endothermic phase change at 670 km.
Nature 350, 55–57.McKenzie, D., 1984. The generation and compaction of partially molten rock. J. Pet. 25, 713–765.McNamara, A.K., Zhong, S., 2004. Thermochemical structures within a spherical mantle; superplumes or piles? J. Geophys.
Res. 109, B07402.McNamara, A.K., Zhong, S., 2005. Thermochemical structures beneath Africa and the Pacific Ocean. Nature 437, 1136–1139.Megnin, C., Romanowicz, B., 2000. The three-dimensional shear velocity structure of the mantle from the inversion of body,
surface and higher-mode waveforms. Geophys. J. Int. 143, 709–728.Montague, N.L., Kellogg, L.H., 2000. Numerical models of a dense layer at the base of the mantle and implications for the
geodynamics of D. J. Geophys. Res. 105, 11101–11114.Moores, E.M., Twiss, R.J., 1995. Tectonics, W.H. Freeman and Company, New York, 415pp.Mueller, S., Phillips, R.J., 1991. On the initiation of subduction. J. Geophys. Res. 96, 651–665.Myers, J.S., 1993. Precambrian history of the west Australian craton and adjacent orogens. Annu. Rev. Earth Planet. Sci. 21,
453–485.Nakagawa, T., Tackley, P.J., 2005. Deep mantle heat flow and thermal evolution of the Earth’s core in thermochemical multiphase
models of mantle convection. Geochem. Geophys. Geosyst. 6, Q08003.Nimmo, F., Tanaka, K., 2005. Early crustal evolution of Mars. Annu. Rev. Earth Planet. Sci. 33, 113–161.Ogawa, M., 2003a. Plate-like regime of a numerically modeled thermal convection in a fluid with temperature-, pressure-, and
stress-history-dependent viscosity. J. Geophys. Res. 108, 2067.Ogawa, M., 2003b. Chemical stratification in a two-dimensional convecting mantle with magmatism and moving plates.
J. Geophys. Res. 108, 2561.Ogawa, M., 2007. Superplumes, plates, and mantle magmatism in two-dimensional numerical models. J. Geophys. Res. 112,
B06404.Ogawa, M., Nakamura, H., 1998. Thermochemical regime of the early mantle inferred from numerical models of the coupled
magmatism-mantle convection system with the solid–solid phase transitions at depths around 660 km. J. Geophys. Res. 103,12161–12180.
Ogawa, M., Schubert, G., Zebib, A., 1991. Numerical simulations of three-dimensional thermal convection in a fluid withstrongly temperature-dependent viscosity. J. Fluid Mech. 233, 299–328.
Ono, S., Ohbayashi, Y., Isshiki, M., Watanuki, T., 2005. In situ X-ray observations of phase assemblages in peridotite and basaltcompositions at lower mantle conditions: implications for density of subducted oceanic plate. J. Geophys. Res. 110, B02208.
Parker, R.L., Oldenberg, D.W., 1973. Thermal model of oceanic ridges. Nature 242, 137–139.Parmentier, E.M., Zhong, S., Zuber, M.T., 2002. Gravitational differentiation due to initial chemical stratification: origin of lunar
asymmetry by the creep of dense KREEP? Earth Planet. Sci. Lett. 201, 473–480.Parsons, B., McKenzie, D.P., 1978. Mantle convection and the thermal structure of plates. J. Geophys. Res. 83, 4485–4496.Phillips, B.R., Bunge, H.-P., 2005. Heterogeneity and time dependence in 3D spherical mantle convection models with continental
drift. Earth Planet. Sci. Lett. 233, 121–135.Phillips, R.J., Hansen, V.L., 1998. Geologic evolution of Venus: rises, plains, plumes, and plateaus. Science 279, 1492–1497.Prokoph, A., Ernst, R.E., Buchan, K.L., 2004. Analysis of large igneous provinces: 3500 Ma to present. J. Geol. 112, 1–22.
398 M. Ogawa / Fluid Dynamics Research 40 (2008) 379–398
Richards, M.A.R., Hager, B.H., Sleep, N.H., 1988. Dynamically supported geoid highs over hot spots: observation and theory.J. Geophys. Res. 93, 7690–7708.
Richards, M.A., Duncan, R.A., Courtillot, V.E., 1989. Flood basalts and hot-spot tracks: plume heads and tails. Science 246,103–107.
Richter, F.M., McKenzie, D.P., 1981. On some consequences and possible causes of layered mantle convection. J. Geophys. Res.86, 6133–6142.
Richter, F.M., Parsons, B., 1975. On the interaction of two scales of convection in the mantle. J. Geophys. Res. 80, 2529–2541.Rino, S., Komiya, T., Windley, B.F., Katayama, I., Motoki, A., Hirata, T., 2004. Major episodic increases of continental crustal
growth determined from zircon ages of river sands; implications for mantle overturns in the early Precambrian. Phys. EarthPlanet. Int. 146, 369–394.
Schubert, G., Turcotte, D.L., Olson, P., 2001. Mantle Convection in the Earth and Planets. Cambridge University Press,Cambridge, 940pp.
Solomatov, V.S., 1995. Scaling of temperature- and pressure-dependent viscosity convection. Phys. Fluid 7 (2), 266–274.Solomon, S.C., et al., 2005. New perspectives on ancient Mars. Science 307, 1214–1220.Stein, M., Hofmann, A.W., 1994. Mantle plumes and episodic crustal growth. Nature 372, 63–68.Stofan, E.R., Brian, A.W., Guest, J.E., 2005. Resurfacing styles and rates on Venus: assessment of 18 Venusian quadrangles.
Icarus 173, 312–321.Tackley, P.J., 2000. Mantle convection and plate tectonics: toward an integrated physical and chemical theory. Science 288,
2002–2007.Tackley, P.J., 2002. The strong heterogeneity caused by deep mantle layering. Geochem. Geophys. Geosyst. 3 2001GC000167.Tackley, P.J., Stevenson, D.J., Glatzmaier, G.A., Schubert, G., 1994. Effects of multiple phase transitions in a 3-D spherical
model of convection in the Earth’s mantle. J. Geophys. Res. 99, 15877–15901.van der Hilst, R.D., Widiyantoro, S., Engdahl, E.R., 1997. Evidence for deep mantle circulation from global tomography. Nature
386, 578–584.van Keken, P.E., Ballentine, C.J., 1998. Whole-mantle versus layered mantle convection and the role of a high-viscosity lower
mantle in terrestrial volatile evolution. Earth Planet. Sci. Lett. 156, 19–32.Van Keken, P.E., Zhong, S., 1999. Mixing in a 3D spherical model of present-day mantle convection. Earth Planet. Sci. Lett.
171, 533–547.van Keken, P.E., Hauri, E.H., Ballentine, C.J., 2002. Mantle mixing: the generation, preservation, and destruction of chemical
heterogeneity. Annu. Rev. Earth Planet. Sci. 30, 493–525.Vidale, J.E., Schubert, G., Earle, P.S., 2001. Unsuccessful initial search for a midmantle chemical boundary with seismic arrays.
Geophys. Res. Lett. 28, 859–862.Windley, B.F., 1995. The Evolving Continents. third ed., Wiley, Chichester, 526pp.Xie, S., Tackley, P.J., 2004. Evolution of U–Pb and Sm–Nd systems in numerical models of mantle convection and plate tectonics.
J. Geophys. Res. 109, B11204.Yale, L.B., Carpenter, S.J., 1998. Large igneous provinces and giant dike swarms: proxies for supercontinent cyclicity and mantle
convection. Earth Planet. Sci. Lett. 163, 109–122.Zhong, S., 2006. Constraints on thermochemical convection of the mantle from plume heat flux, plume excess temperature, and
upper mantle temperature. J. Geophys. Res. 111, B04409.Zhong, S., Gurnis, M., 1995. Mantle convection with plates and mobile faulted plate margins. Science 267, 838–843.Zhong, S., Gurnis, M., Moresi, L., 1998. Role of faults, nonlinear rheology, and viscosity structure in generating plates from
instantaneous mantle flow models. J. Geophys. Res. 103, 15255–15268.