116
UNITED NATIONS INDUSTRIAL DEVELOPMENT ORGANIZATION INDUSTRIAL MOTOR SYSTEMS ASSESSMENT AND OPTIMIZATION MANUAL FOR

UNITED NATIONS INDUSTRIAL DEVELOPMENT ORGANIZATION
INDUSTRIAL MOTOR SYSTEMS ASSESSMENT AND OPTIMIZATION
MANUAL FOR

Manual for Industrial Motor Systems Assessment and Optimization
2
Copyright © United Nations Industrial Development Organization, 2018
This publication and any part thereof may be freely quoted and reprinted in any form for educational or non-profit
purposes without special permission from the copyright holder, but acknowledgement of the source is requested.
UNIDO would appreciate receiving a copy of any publication containing quotation or reprint.
No use of this publication may be made for resale or for any other commercial purpose whatsoever without prior
permission in writing from the United Nations Industrial Development Organization.
Although great care has been taken to maintain the accuracy of information within this Manual, neither UNIDO
nor the authors or contributors assume any legal liability or responsibility for consequences which may arise from
the use of the Manual.
Reference herein to any specific commercial product, process, or service by trade name, trademark, manufacturer,
or otherwise, does not necessarily constitute or imply its endorsement or recommendation by UNIDO. The views
and opinions of authors expressed herein do not necessarily state or reflect those of UNIDO.

3
Foreword
Energy is a fundamental prerequisite for development and economic activity. It is evident, however, that current energy supply and con-sumption patterns are environmentally unsustainable and must be improved. UNIDO’s mandate to promote Inclusive and Sustainable Industrial Development (ISID) aims, inter alia, at decoupling indus-trial development from unsustainable resource usage and negative environmental impacts. Through ISID, UNIDO is also aligned with the Sustainable Development Goals (SDGs) – including SDG 9 (“Build resilient infrastructure, promote inclusive and sustainable industrial-ization, and foster innovation”) and SDG 7 (“Ensure access to affordable, reliable, sustaina-ble and modern energy for all”).
As the developing world gradually embarks on industrial growth and participation in global trade, rising energy costs and the foreseen sizeable increase in energy demand make energy efficiency a definite priority. On the one hand, energy efficiency makes good business sense, as it entails cost savings and improvements by optimizing the use of resources and reducing waste. On the other hand, energy efficiency contributes to mitigating the negative impact of energy use and consumption on the environment, both at local and global level; a more resource-conscious approach allows more to be done with less. Among further benefits, energy efficiency leads to improved energy performance, increased operational reliability, strengthened security of supply, and reduced energy price volatility.
Industry is responsible for about a third of global CO2 emissions. If the world is to meet the climate change mitigation goals set by the international community, industry needs to sub-stantially increase its energy efficiency, and progressively switch to low-carbon and low-emis-sion technologies, including renewable sources of energy.
UNIDO provides a variety of tools to address the immediate challenge of implementing the best available policies, technologies and practices for industrial energy efficiency through knowledge sharing, capacity building, demonstrations, investments and partnerships. UNIDO helps raise the business potential of industry by introducing and enhancing energy management practices and accounting methods. The present Manual for Industrial Motor Systems Assessment and Optimization seeks to provide direction and support to companies seeking to optimize their existing motor systems and an additional knowledge resource for industrial energy efficiency service providers.
LI Yongdirector General

Manual for Industrial Motor Systems Assessment and Optimization
4
AcknowLedGments
This publication was prepared by the UNIDO Industrial Energy Efficiency Division with the financial contribution of the State Secretariat for Economic Affairs of the Swiss Confederation (SECO), the Department for International Development (DFID) of the Government of the United Kingdom, the Department of Energy and the Department of Trade and Industry of the Republic of South Africa and the Global Environment Facility (GEF).
Marco Matteini was the project lead and had the overall responsibility for the design and development of this publication. Pradeep Monga, Director of UNIDO Energy Department, provided essential leadership and inspiration during the whole project.
This Manual for Industrial Motor Systems Assessment and Optimization was authored by Anibal de Almeida and Joao Fong, University of Coimbra; and Hugh Falkner, Atkins.
It has been peer reviewed by Conrad Brunner and Rita Werle, Energy Impact; and Konstantin Kulturer, Austrian Energy Agency.
Bettina Schreck and Rana Ghoneim from the UNIDO Industrial Energy Efficiency Division provided valuable contribution and support during the entire development process. The authors and project lead would finally like to thank Oksana Pavliska and Iakovos Bazinas for editing the manuscript and providing constant support during its preparation.
This manual was designed by Mauricio Mondragon and Maria Grineva, at Athenea International/Omnilang.

5
About unIdo
The United Nations Industrial Development Organization (UNIDO) is a specialized agency of the United Nations. Its mandate is to promote and accelerate sustainable industrial develop-ment in developing countries and economies in transition and work towards improving living conditions in the world’s poorest countries by drawing on its combined global resources and expertise. Since the 2013 Lima Declaration, UNIDO has embarked on a new vision towards Inclusive and Sustainable Industrial Development (ISID) with the purpose of creating shared prosperity for all as well as safeguarding the environment. Furthermore, through ISID, UNIDO addresses all three dimensions of sustainable development: social equality, economic growth and environmental protection. As a result, UNIDO has assumed an enhanced role in the global development agenda by focusing its activities on poverty reduction, inclusive globalization and environmental sustainability.
UNIDO services are based on two core functions: as a global forum, it generates and dissem-inates industry-related knowledge; as a technical co-operation agency, it provides technical support and implements projects.
UNIDO focuses on three main programmatic areas in which it seeks to achieve long-term impact:
• Advancing economic competitiveness• Creating shared prosperity• Safeguarding the environment
About unIdo Industrial energy efficiency ProgrammeThe UNIDO Industrial Energy Efficiency (IEE) Programme builds on more than three decades of experience and unique expertise in the field of industrial development and technology transfer. It represents a pillar of the Green Industry model that UNIDO promotes. Combining the provision of policy and normative development support services and capacity building for all market players, UNIDO aims at removing the key barriers to energy efficiency improvement in industries and ultimately transforming the market for industrial energy efficiency.
The UNIDO IEE Programme is structured around the following thematic areas:
• Policies and standards – strengthening policy and regulatory frameworks for more sustainable and efficient energy performance in industry.
• Energy management and efficient operation – integrating energy efficiency in day-to-day operations to save energy and reduce GHG emissions.
• Energy efficiency design and manufacturing – accelerating the adoption of new technologies and best practices.

Manual for Industrial Motor Systems Assessment and Optimization
6
About the unIdo motor systems optimization (mso) ProgrammeThe UNIDO Motor Systems Optimization (MSO) Capacity Building and Implementation Programme consists of three elements: a USER Training, an EXPERT Training and a VENDOR Workshop.
The mso user training is targeted at facility engineers, operators and maintenance staff of enterprises, equipment vendors and service providers. It is designed to teach how to assess industrial motor systems, identify opportunities for performance improvements and achieve energy/cost savings through proper operation and control, system maintenance, and the appropriate use and selection of motors.
The mso eXPert training is an intensive training delivered by leading international Motor Systems Optimization experts to national energy efficiency experts, service providers, equip-ment vendors and industry engineers. This training provides more in-depth technical infor-mation on assessing performance, troubleshooting and making improvements to industrial motor systems. This training also introduces basic principles for energy efficient design of motor systems and how to successfully sell motor systems improvement projects to man-agement. National energy efficiency experts are trained through classroom, on-the-job and coaching by international MSO experts and equipped with expertise, skills and tools (includ-ing measuring equipment) required for providing the following services:
• Technical assistance to enterprises on motor systems energy assessment and identifica-tion, development and implementation of optimization projects;
• Conducting MSO USER training and coaching facility personnel for motor systems energy assessment and optimization.
The mso Vendor workshop is targeted to local motor and related equipment vendors, suppliers and manufacturers. The workshop is designed to introduce these key market players to MSO techniques and service offerings. The objectives are to:
• Enable manufacturers, vendors and suppliers to participate in reinforcing the system opti-mization message of the UNIDO project with their industrial customers;
• Assist manufacturers, vendors and suppliers in identifying what would be required to reshape their market offerings to include or reflect a system services approach.
The articulated process, built and managed by UNIDO within its MSO Capacity Building and Implementation Programme, is a joint effort and partnership of international leading specialists, national energy efficiency service providers and forward-looking industrial enterprises coming together to deliver tangible energy, environmental and economic results, while creating business and market opportunities for sustainable motor systems optimization in industry and climate change mitigation. Figure A shows structure and standard schedule of the UNIDO MSO EXPERT training programme.
The present manual is one of the knowledge and training resources used during the UNIDO MSO programme and is made available to participants of the USER and EXPERT training.

7
Fig. A. Structure of UNIDO Motor Systems Optimization EXPERT training programme
Module 1 Module 2 Module 3
3-4 weeks 2-3 months 1-2 weeks
EXAM
Time
Day
1
Day
2
Day
3
Day
4
Day
5
Day
6Periodic communication between trainer and trainees
MSO TEAM
National MSO EXPERT trainees
LEGEND
Partner Enterprise
Classroom training taught by international MSO expert
Motor systems energy assessment & measurements on-site (at one facility) taught by international MSO experts
Periodic communication between trainer and trainees through webinars, emails and phone calls
EXPERT Trainees prepare individual assessment report based on measurements carried out and worked done during the training. International MSO expert reviews and provides feedback
DeliverableMSO assessment report prepared by each EXPERT trainee
MSO Teams carry out motor systems energy assessment in project partner enterprises with remote technical support & supervision by International MSO experts. MSO Team = 1 Ent. + 1-2 Consultants
DeliverableMSO assessment report preparedby enterprise MSO teams and cleared by International MSO experts © UNIDO 2017

Manual for Industrial Motor Systems Assessment and Optimization
8
tAbLe oF contents
Foreword ...................................................................................................................3AcknowLedGments ....................................................................................................4About unIdo ............................................................................................................... 5
About UNIDO Industrial Energy Efficiency Programme ...................................................5About the UNIDO Motor Systems Optimization (MSO) Programme ................................6
tAbLe oF contents .....................................................................................................8motor sYstems oPtImIsAtIon (mso) trAInInG .......................................................11LIst oF AcronYms .................................................................................................... 121. IntroductIon ...................................................................................................... 132. HIGH enerGY eFFIcIent motor tecHnoLoGIes .................................................... 15
2.1. Induction Motor Basics ....................................................................................... 152.2. Energy Efficient Induction Motors ....................................................................... 172.3. Permanent Magnet Motors .................................................................................222.4. Line Start Permanent Magnet Motors ..................................................................242.5. Switched Reluctance Motors ...............................................................................24
3. enerGY eFFIcIent motor sYstems ...................................................................... 273.1. Power Supply Quality ..........................................................................................283.2. Distribution Network ..........................................................................................293.3. Motor Oversizing ................................................................................................303.4. Transmission System ..........................................................................................343.5. Operation and Maintenance Practices .................................................................373.6. Load Management and Cycling ...........................................................................383.7. Benefits of Motor Systems Optimisation ..............................................................38
4. VArIAbLe sPeed drIVes (Vsds) ............................................................................ 414.1. Pumps ................................................................................................................464.2. Fans ...................................................................................................................484.3. Compressors ......................................................................................................504.4. Lifts ...................................................................................................................524.5. Centrifugal Machines and Machine-Tools ............................................................ 534.6. Conveyors ..........................................................................................................54
5. enerGY eFFIcIencY stAndArds ............................................................................ 555.1. Existing Energy Efficiency Regulation ...................................................................585.2. Incentive Policies and Programmes ....................................................................63
6. motor sYstems enerGY Assessments .............................................................. 676.1. Motor Systems Energy Assessment .....................................................................67
7. tAkInG meAsurements ........................................................................................ 737.1. Voltage Unbalance .............................................................................................. 757.2. Harmonics .......................................................................................................... 757.3. Load Estimation Techniques ................................................................................ 757.4. Safety Considerations ......................................................................................... 777.5. Sensitivity of Motor Load to Operating Speed ...................................................... 77

9
8. enerGY And mAIntenAnce ................................................................................... 798.1. Benefits of Better Maintenance ...........................................................................798.2. Motor Maintenance Techniques ..........................................................................798.3. Maintenance Decisions Matter: An Alternative Approach to Stimulating Energy Savings . 81
9. motor rePAIr ......................................................................................................899.1. Best Practice Motor Repair ..................................................................................899.2. A Motor Procurement Policy Template ................................................................ 90
10. seLLInG It – How to wIn APProVAL For Your IdeA ...........................................9311. enerGY mAnAGement sYstem ........................................................................... 97
11.1. Energy Management is not a single project, it is an ongoing programme and way of doing things. ................................................................................................... 98
12. cAse studIes .....................................................................................................10112.1. Case Study #1 Beshay Steel Company .............................................................. 10112.2. Case Study #2 Sidpec Company ...................................................................... 10312.3. Case Study #3 Ezz Flat Steel Company ............................................................. 10412.4. Case Study #4 Novacero ................................................................................. 105
13. FurtHer reAdInG .............................................................................................. 10913.1. Text Books....................................................................................................... 10913.2. Standards ....................................................................................................... 10913.3. Other Useful Documents ................................................................................. 110
14. reFerences ........................................................................................................ 111


11
motor sYstems oPtImIsAtIon (mso) trAInInG
The two-day MSO End Users Training is targeted at the facility engineers, operators and main-tenance staff of enterprises, equipment vendors and service providers and it is designed to teach how to assess motor systems, identify potential improvement opportunities and achieve cost savings through proper operation and controls, system maintenance, and appropriate uses of motor systems.
This two-day MSO End User Training is primarily designed to build or consolidate enterprise personnel’s understanding of MSO and technical capacity for MSO oriented actions and to enable them to initiate the development and implementation of MSO measures and projects. The training is also intended to raise further interest in the UNIDO training and technical assistance offers.

12
LIst oF AcronYms
Ac alternating current IGbt insulated gate bipolar transistor
beP best efficiency point Im induction motor
bHP brake horsepower IP ingress protection
bLdc brushless DC (motor) Iso International Organization for Standardization
cdA Copper Development Association kw kilowatt
cemeP European Committee of Manufacturers of Electrical Machines and Power Electronics
kwh kilowatt-hour
csA Canadian Standards Association LF load factor
dc direct current LcI load-commutated inverter
doe U.S. Department of Energy mm millimetres
eAsA Electronically Commutated (motor) mw megawatt
eem Energy Efficient Motor nemA National Electrical Manufacturers Association
eere Office of Energy Efficiency and Renewable Energy
oem original equipment manufacturer
emI electromagnetic interference P power
enPI energy performance indicator PF power factor
eIsA Energy Indepen dence and Security Act of 2007
Pmsm permanent magnet synchronous motor
ePAct Energy Policy Act of 1992 Pwm pulse-width modulated
f frequency in Hertz rms root-mean-square
Hem High Efficiency Motor rpm rotations per minute
Hz hertz V volt
hp horsepower VsI voltage source inverter
I amperage or current Vsd variable speed drive
Iec International Electrotechnical Commission
w watt
Ieee Institute of Electrical and Electronics Engineers

1313
1. IntroductIon
This manual gives a brief description of state-of-the-art technologies used to develop high efficiency motors, including premium efficiency induction motors, permanent magnet motors, and switched reluctance motors.
It also analyses issues that affect motor system efficiency and provides guidelines on how to deal with those issues, namely by:
• Selecting the energy‐efficient motors;• Proper sizing of motors;• Using Variable Speed Drives (VSDs), where appropriate. The use of VSDs can lead to better
process control, less wear in the mechanical equipment, less acoustical noise, and signif-icant energy savings;
• Optimising the complete motor system, including the distribution network, power quality and efficient transmissions; and
• Applying best maintenance practices.
Finally, an overview of worldwide energy performance standards and programmes to pro-mote high efficiency electric motors is presented.
1

14

1515
2. HIGH enerGY eFFIcIent motor tecHnoLoGIes
Energy efficiency of electric motors has been a growing concern for both manufacturers and end-users in the last couple of decades. Some effort has been put into developing new ways to increase three-phase induction motor efficiency while other technological solutions are emerging which could lead to even higher efficiency levels. A brief description of these very efficient technological solutions is given in this section.
2.1. Induction motor basicsThe vast majority of the motors used in the industry are squirrel cage induction motors (Figure 1 and Figure 3) due to their low cost, high reliability and fairly high efficiency. There are no electrical connections to the rotor, which means that there are no brushes, commuta-tors or slip rings to maintain and replace.
The speed of an induction motor is essentially determined by the frequency of the power supply and by the number of poles in the motor.
synchronous speed [rpm] =frequency of the applied voltage [Hz] x 60
number of pole pairs
synchronous speed [rad/s] =2π x frequency of the applied voltage [Hz]
number of pole pairs
slip [%] =synchronous speed – running speed [Hz]
x 100synchronous speed
However, the speed decreases by a few percent when the motor goes from no-load to full load operation (Figure 2).
2

Manual for Industrial Motor Systems Assessment and Optimization
16
Fig. 1.
Stator
Rotor
End ring
Rotor bar(conductor)
To 3-phase AC supply
Diagram of a Squirrel Cage Induction Motor
Fig. 2. Rotor Speed (% of Full Speed)
Curr
ent (
% o
f Mot
or F
ull-L
oad
Curr
ent)
1 X FLC
1 X FLT
2 X FLC
2 X FLT
3 X FLC
4 X FLC
5 X FLC
6 X FLC
7 X FLCLRC
LRT
10% 20% 30% 40% 50% 60% 70% 80% 90% 100%
Sample Load Torque Curve
Pull-up Torque
Pull-out Torque
Full Voltage Stator Current
Full Voltage Start Torque
Torq
ue (%
of M
otor
Ful
l-Loa
d To
rque
)
Typical Torque-Speed Curve of a 3-phase AC Induction Motor
Fig. 3.
X1
Xm Rm
R2
I2I1
VS
X21
Squirrel Cage Induction Motor Equivalent Circuit

17
where:
Lrc - Locked Rotor Current (Starting Current),
Lrt - Locked Rotor Torque (Starting Torque)
FLc - Full Load Current,
FLt - Full Load Torque
and
R1, R2 = Stator and Rotor Resistance;
X1, X2 = Stator and Rotor Leakage Reactance;
Xm = Magnetising Reactance;
Rm = Magnetising Resistance;
ωs = Synchronous Speed;
S = Slip = (ωs - ωrotor ) / ωs
The main characteristics of the induction motors are:
• Low construction complexity; • High reliability (no brush wear), even at very high speeds;• Medium efficiency at low power (typically below 2.2. kW) and high efficiency at high power;• Driven directly by the grid or by multi-phase inverter controllers;• Low Electromagnetic Interference (EMI);• Sensorless speed control is possible;• Lowest cost per kW among different motor technologies.
2.2. energy efficient Induction motorsMotor efficiency is generally defined as:
Efficiency =Output mechanical power
Input electrical power
The difference between the output mechanical power and the input electrical power is due to five different kinds of losses occurring in a machine: electrical, magnetic, mechanical and stray load losses, and in the case of brushed motors, brush contact losses.
• electrical losses (also called Joule losses) are expressed by I2R, and consequently increase rapidly with the motor load. Electrical losses appear as heat generated by electric resist-ance to current flowing in the stator windings and in the rotor conductor bars and end rings.

Manual for Industrial Motor Systems Assessment and Optimization
18
• magnetic losses occur in the steel laminations of the stator and rotor. They are due to hysteresis and eddy currents, increasing approximately with the square of the flux-density.
• mechanical losses are due to friction in the bearings, ventilation and windage losses.
• stray load losses are due to leakage flux, harmonics of the air gap flux density, non-uni-form and inter-bar current distribution, mechanical imperfections in the air gap, and irreg-ularities in the air gap flux density.
• brush contact losses are due to voltage drops in brushes and commutator/slip rings, as well as due to friction between the moving contacts.
As an example, Figure 4 shows the distribution of the induction motor losses.
The most efficient induction motors available in the world market today have efficiency levels above the IE3 minimum requirements. This represents a decrease in losses of about 15% in relation to the high efficiency motors (IE2) available in the EU market.
High efficiency motors are typically constructed with superior magnetic materials, larger mag-netic circuits with thinner laminations, a larger copper/aluminium cross-section in the stator and rotor windings, tighter tolerances, better quality control and optimised design. These motors, therefore, have lower losses and improved efficiency. Because of the lower losses, the operating temperature can be lower, thus leading to improved reliability.
Fig. 4.
Windage and Friction Losses
Core Losses
Stray Load Losses
Rotor I2R Losses
Stator I2R Losses
Motor-Rated Power (kW)
Loss
Fra
ctio
n (%
)
100
90
80
70
60
50
40
30
20
10
0
Typical fraction of losses in 50Hz, four-pole IMs [1]

19
Some of the options to increase induction motor efficiency are presented in Figure 5.
Stator losses can be reduced by increasing the cross-section of stator windings which lowers their electrical resistance reducing I²R losses. This modification is where the largest gains in efficiency are achieved. High efficiency motors typically contain about 20% more copper than standard efficiency models of equivalent size and rating.
Rotor losses can be reduced by increasing the cross-section of the rotor conductors (con-ductor bars and end-plates) and/or increasing their conductivity (e.g. using copper instead of aluminium), as well as – to a lesser extent – by increasing the total flux across the air gap between the rotor and stator.
Magnetic core losses occur in the steel laminations of the stator and rotor and are mainly due to hysteresis effects and induced eddy currents. Both types of losses approximately increase with the square of the magnetic flux density. Lengthening the lamination stack, which reduces the flux density within the stack, therefore reduces core losses. These losses can be further reduced through the use of magnetic steel with better magnetic properties (e.g. higher permeability and higher resistivity) in the laminations. Another means to reduce the eddy currents’ magnetic core losses is to reduce the laminations’ thickness. Eddy current losses can also be reduced by ensuring adequate insulation between laminations, thus min-imising the flow of current (and I²R losses) through the stack.
The additional materials used in order to improve efficiency can present themselves as a problem as it may be difficult to meet the standard frame sizes especially in the low power range. Of course, this is not always the case since, in many instances, only the stator and rotor laminations are a little longer and this can be compensated in part by using a smaller fan as the thermal losses to be dissipated are lower.
Fig. 5. IE3 (also called NEMA Premium in North America) motor features
Longer stator lowers magnetic density and increase cooling capacity. Premium grade magnetic steel reduces hysteresis losses; thinner laminations reduce eddy current losses.
Efficient cooling fan design improves air-flow and reduces power required to derive the fan.
Large conductive bars and endrings or conductors of lower resistivity (Copper instead of Aluminium) reduce rotor resistance
Reduced friction bearings
More copper wire of large diameter in the stator saves energy by reducing the resistance of the stator winding.
Modified stator slot design helps to decrease magnetic losses and makes room for larger diameter wire.

Manual for Industrial Motor Systems Assessment and Optimization
20
Figure 6 shows the relationship between power and shaft-height considering the different European and North American standard frame sizes for 4-pole motors.
The increase in materials also leads to higher rotor inertia in high-efficiency motors which will contribute to extending the starting and reversing times in DOL motors or will limit the dynamic performance of the motor when it is controlled by a VSD.
Regarding the intermittent operation of high-efficiency motors, there are some limits, after which they lose their extra efficiency advantage because the extra starting losses/energy over the typical duty cycle exceeds the reduction of losses/energy in steady-state [2], as depicted in Figure 7.
Fig. 6.
EN50347NEMA MG1 calculated to 50 Hz
Shaft-Height (mm)
50 H
z Pow
er (k
W)
0,1
1
10
100
1000
56 63 71 80 90 100 112 132 160 180 200 225 250 280 315
4-Pole Output Power per Shaft-Height
Fig. 7.
t
(III)(II)(I)
t
(III)(II)(I)
Energy saving because ofhigher degree of efficiency
PP
Additional powerbecause of highermoment of inertia
Power consumptionPa acceleration (I)Pc constant speed (II)Pb deceleration (III)
Additional lossesbecause of highermoment of inertia
Losses in intermittent operation of induction motors [3]

21
One way to reduce I2R losses is to substitute the aluminium conductor bars with copper (Figure 8). Due to the excellent electrical con-ductivity of copper (57 MS/m compared to 37 MS/m), replacing the aluminium in a rotor’s conductor bars with die-cast copper can pro-duce a significant improvement in the effi-ciency of an electrical motor. If this replace-ment is accompanied by a redesign of the motor that takes into account the higher conductivity of copper, an even greater effi-ciency improvement is achieved.
Because of the higher efficiency of the cop-per rotor as well as its length, the motor can be smaller than in an aluminium motor for the same power and efficiency rating. This can make it possible to meet standard frame sizes with high efficiency motors, which would otherwise be extremely difficult.
The higher melting point of copper (1083°C versus 660°C for aluminium) was initially a barrier in the large-scale production of cop-per die-cast rotors, due to the short lifetime of the dies. This problem has been success-fully overcome and several manufacturers are now producing cost-effective copper rotor induction motors.
Fig. 8. Copper rotor motor and a cut-away view (source: Copper Development
Association)
Fig. 9.
CopperAluminium
Output power72%
74%
76%
78%
80%
82%
84%
86%
88%
0kW 1kW 2kW 3kW 4kW 5kW 6kW 7kW 8kW 9kW
Comparison of the efficiency of an aluminium and copper rotor in an otherwise identical 5.5 kW motor [4]
Fig. 10.
CopperAluminium
Output power
0kW 1kW 2kW 3kW 4kW 5kW 6kW 7kW 8kW 9kW72%
74%
76%
78%
80%
82%
84%
86%
88%
Comparison of the efficiency of an aluminium rotor motor and a copper rotor
efficiency optimised 5.5 kW motor [4]

Manual for Industrial Motor Systems Assessment and Optimization
22
2.3. Permanent magnet motorsA Permanent Magnet Motor is a rotating electric machine with a classic three-phase stator as in the case of an induction motor while the rotor has permanent magnets which create the rotor magnetic field without incurring excitation losses. Unlike a brushed DC motor, the com-mutation of a motor without brushes is controlled electronically. These motors can be called:
• Permanent Magnet Synchronous Motors (PMSM);• Electronically Commutated Motors (EC Motors); and• Brushless DC Motors (BLDC Motors).
These motors typically require a frequency converter and a rotor position sensor (encoder) for proper operation. In some designs, the encoder can be replaced by a control algorithm in the converter. The AC supply is converted to a DC supply, which feeds a Pulse-Width Modulation (PWM) inverter, which generates an almost sinusoidal waveform that is supplied to the stator windings. To rotate, the stator windings should be energised in a sequence. It is important to know the rotor position in order to understand which winding will be energised following the energising sequence. Rotor position is sensed using Hall effect sensors embedded into either the stator or the rotor, but new sensorless designs are becoming increasingly available.
Based on the required magnetic field density in the rotor, the proper magnetic material and geometry are chosen to make the rotor.
Fig. 11.
BHm
ax --
MGO
e
BHm
ax --
kJ/
m3
YEAR1900 1920 1940 1960 1980 20000
10
40
80
120
160
200
240
280
320
360
400
440
480
KS STEELMK STEEL ALNICO 5
30
20
40
50
60
COLUMNAR ALNICO
SINTERED FERRITE
BONDED ISOTROPIC NdFeB
SmCo 1-5 and 2-17
Nd-Fe-B
0
OTHER IMPORTANT CHARACTERISTICSREQUIRED MAGNETIZING FIELD
THERMAL STABILITYMECHANICAL PROPERTIESCORROSION RESISTANCE
MANUFACTURABILITYCOST
Advances in magnet energy product

23
Fig. 12.
Effic
ienc
y (Z
)
Shaft power (kW)
Refe
renc
e: D
ata
acco
rdin
g to
IEC
6003
4-30
, 50
Hz
75
70
65
80
85
90
95
IE1: 4 poleIE1: 6 pole
IE3: 4 poleIE3: 2 poleIE2: 4 poleIE3: 6 poleIE2: 2 pole
IE2: 6 pole/IE1: 2 poleEC: «2 pole»
EC: «4 pole»EC: «6 pole»
Efficiency of PMSM/EC/BLDC motors, compared with induction motors (source EBM-Papst)
Ferrite magnets have traditionally been used to make permanent magnets in low cost appli-cations. As the technology advances and with decreasing costs, rare earth alloy magnets are gaining popularity. The ferrite magnets are less expensive, but they have the disadvantage of lower flux density for a given volume. In contrast, the alloy material has high magnetic density improving the size-to-weight ratio and gives higher torque for the same size motor using fer-rite magnets. Samarium Cobalt (SmCo) and the alloy of Neodymium, Iron and Boron (NdFeB) are some examples of rare earth alloy magnets used in high performance motors. Continuous research is going on to improve the flux density to compress the motor volume even further.
This means the magnetic field generated by the stator and the magnetic field generated by the rotor rotate at the same frequency. Permanent Magnet Motors do not experience the “slip” that is normally seen in induction motors.
Motors using permanent magnets are significantly more efficient than induction motors because they do not have the secondary windings in their rotors and because of synchronous operation, almost completely eliminating the rotor electric and magnetic losses.
In the low power range, and in applications requiring variable speed control, Permanent Mag-net Motors can lead to efficiency improvements of up to 10-15%, when compared with varia-ble speed induction motors, as shown in Figure 12.
They are also much more efficient than brushed DC motors since they eliminate the excita-tion circuit losses.
Permanent Magnet Motors present a large savings potential and have been gaining market importance in some particular applications such as high performance motion control, in some types of variable speed fans and also in some high efficiency appliances (e.g. air conditioners).
Based on an innovative geometry for the motor rotor and stator, some motor manufacturers use much less costly ferrite magnets to deliver the performance level typically found in much more expensive rare earth-based Permanent Magnet Motors. (Figure 13.)

Manual for Industrial Motor Systems Assessment and Optimization
24
2.4. Line start Permanent magnet motors
Another very high efficiency technology that has recently been introduced in the mar-ket by some manufacturers is the line start permanent magnet motor (LSPM). As the name implies, the motor does not need an electronic controller, being able to start by direct connection to the mains supply. These motors have permanent magnets fitted in the induction motor squirrel cage rotor giv-ing them the ability to start by direct cou-pling to an AC power source – and, therefore, avoiding the use of a Variable Speed Drive – whilst having very high efficiency during syn-chronous running.
To achieve very high efficiency levels (IE4 – Super Premium) high energy magnetic mate-rials such as NeFeB are used for the perma-nent magnets. (Figure 14.)
Since the motor operates as a synchro-nous machine, the induced currents in the
rotor are much smaller than in an induction machine and, therefore, rotor joule losses are significantly reduced. In addition, it is possible to achieve unity-power-factor per-formance, thereby reducing the stator cur-rents and the corresponding losses [5].
One of the main advantages of these “hybrid” motors is their interchangeability with induction motors. Their design enables them to keep the same output/frame ratio as standard induction motors in spite of having very high efficiency, and they do not require electronic motion control as do EC or PM machines since they are able to start from a standstill with a fixed-frequency supply.
2.5. switched reluctance motors
Switched Reluctance Motors are very sim-ple, robust and very reliable. They have a salient pole stator with concentrated excita-tion windings and a salient pole rotor with
Fig. 13. Motor Speed (rpm)
600 900 1200 1500 1800
Syst
em (m
otor
+ V
SD) E
ffici
ency
(%)
40.0%
45.0%
50.0%
55.0%
60.0%
65.0%
70.0%
75.0%
80.0%
85.0%
90.0%
IE4 Ferrite PMSM
IE3 Induction motor
IE2 Induction motor
System efficiency of ferrite magnet IE4 Super-Premium motor (NovaTorque) vs. IE3/NEMA Premium and IE2 standard induction motors driven by a VSD

25
Fig. 14.
80
80
78
82
84
86
88
90
92
94
80 L90S 90L 100L 100L 112M 132S 132M
Effic
ienc
y (%
)
Effic
ienc
y
Frame
Rated output (kW)
WQuatroIEC IE4*IEC IE3IEC IE2
84,2 87,5 87,6 88,3 90,2 90,4 91,7 92,4 92,885,6 87,4 88,1
85,382,8 84,3
86,789,7 90,3 90,9 92,1
89,687,7
92,690,488,7
88,686,6
87,785,5
84,181,4
82,579,6
Efficiency of commercially available materials for IE4 Super-Premium motor LSPM motor (source: WEG)
Fig. 15. Switched Reluctance Motor salient pole rotor and stator (source: Emerson)
no conductors or permanent magnets. A coil is wound around each stator pole and is con-nected, usually in series, with the coil on the diametrically opposite stator pole to form a phase winding.
The stator features a straightforward lam-inated iron construction with simple coil windings: the absence of phase overlaps significantly reduces the risk of inter-phase shorts. The compact and short coil over-hangs make efficient use of the active coil area (lower copper costs) [6].
Their operation is based on the principle that a salient pole rotor will move to a posi-tion of minimum reluctance to the flow of flux in a magnetic circuit. Since inductance is inversely proportional to reluctance, the inductance of a phase winding is at a max-imum when the rotor is in the aligned posi-tion, and at a minimum when the rotor is in the non-aligned position. Therefore, ener-gisation of a phase will cause the rotor to move into alignment with the stator poles, minimising the reluctance of the magnetic path. (Figure 15.)

26
Fig. 16.
Effic
ienc
y (%
) due
to lo
ss re
duct
ion
84
86
88
90
92
94
96
98
Rated power (kW)11 0 100 1000
SynRM
IM
Potential efficiency increase due to rotor loss reduction in SynR Motors (source: ABB)
Unlike induction motors, Switched Reluc-tance Motors require a power converter cir-cuit, controlling the phase currents to pro-duce continuous motion and torque. Rotor position feedback is used to control phase energisation in an optimal way. Speed can be varied by changing the frequency of the phase current pulses while retaining syn-chronism with the rotor position.
The non-uniform nature of torque produc-tion leads to torque ripple and contributes to acoustic noise.
Switched Reluctance Motors typically have efficiencies of over 90%, including all motor and controller losses and efficiency is main-tained over a wide speed and load range.

2727
3. enerGY eFFIcIent motor sYstems
The efficiency of a motor-driven process depends upon several factors which may include:
• Motor efficiency;• Motor speed controls;• Power supply quality;• System oversizing;• Distribution network;• Mechanical transmission;• Maintenance practices;• Load management and cycling; and• Efficiency of the end-use device (e.g. fan, pump, etc.).
Fig. 17.
MOTOR SYSTEM
Power supply
Motion Flow
Power Equipment
• Transformer• Switchgear• Cables
• Contactor• Soft-starter• Variable
speed drive
• Coupling• Gear• Belt+pulley• Chain• Clutch• Brake
• Pump, fan, compressor
• Conveyor• Production
Machinery
• Throttles• Valves• Dampers• Pipes
Controls MotorCoupling/
Mechanical Transmission
Driven Equipment
Mechanical controls
& Process components
Motor system
3

Manual for Industrial Motor Systems Assessment and Optimization
28
It must be emphasised that the design of the process itself can also influence global efficiency (units produced/kWh) to a large extent.
A number of important but often overlooked factors which may affect the overall m otor system efficiency include: power supply quality (high-quality power supply), careful attention to harmonics, system oversizing (proper equipment sizing), the distribution network that feeds the motor (attention to power factor and distribution losses), the transmission and mechanical components (optimised transmission systems), maintenance practices (careful maintenance of the entire motor system) and the match between the load and the motor (good load management practice), are discussed below.
In the design of motor systems it is essen-tial to identify the mechanical load require-ments (torque-speed characteristics) under a variety of operating conditions (e.g. start-ing, steady-state, variable load, etc.). With some loads (e.g. cranes, electric vehicles)
it is possible to recover the stored energy (kinetic or potential energy) in the load.
3.1. Power supply QualityElectric motors, and in particular induction motors, are designed to operate with opti-mal performance when fed by symmetrical 3-phase sinusoidal waveforms with the nom-inal voltage value. Deviations from these ideal conditions may cause significant dete-rioration of the motor efficiency and lifetime. The main deviations are listed below.
Voltage unbalance
Voltage unbalance wastes energy, and thus leads to high current unbalance which in turn leads to high losses. A phase unbalance of just 2% can increase losses by 25%. Additionally, a long operation under unbalanced voltage can damage or destroy a motor (that is why many designers include phase unbalance and phase failure protection in motor starters). Another negative consequence of unbalance is the reduction of the motor torque. (Figure 19.)
Fig. 18.
END-USEDEVICE/PROCESS
POWER DRIVE SYSTEM
better technology and system design
How to reduce energy consumption without
affecting provided useful energy?
torque & speed control
betterpower quality
Energyregeneration
Ploss
Penergy
POUT
ηPDS
INPUT POWER INPUT POWER
PQ
losses
Mechanical power
Stored energy
Impact Impact
Strategies to reduce energy consumption in Electric Motor Systems [7]

29
undervoltage or overvoltage
When the motor is running at or close to full load, voltage fluctuations exceeding 10% can decrease motor efficiency, power factor and lifetime.
Harmonics
Under ideal operating conditions, utilities supply pure sinusoidal waveforms (50Hz frequency in Europe). However, there are some loads, namely VSDs and other power electronic devices, arc furnaces, saturated magnetic cores (transformers, reactors), TVs and computers that cause voltage distortion. The resulting distorted waveform contains a series of sine waves with frequencies that are multiples of the fundamental 50Hz fre-quency, the so-called harmonics.
Harmonics increase the motor losses and noise, reduce torque, and cause torque pul-sation and overheating. Vibration and heat can shorten the motor life, by damaging the bearings and insulation. Harmonics can cause malfunctions in electronic equipment (including computers), induce errors in elec-tric meters (one study sponsored by the Elec-
tric Power Research Institute (EPRI) found measurement errors ranging from +5.9% to -0.8% in meters subjected to harmonics from VSDs), produce radio frequency static and destroy power system components.
3.2. distribution networkThere are substantial losses through the distribution network from the substation to the loads. These losses can be reduced by proper selection and operation of efficient transformers, by correctly sizing the distri-bution cables and by correcting the power factor. In large industries it is also common to use a high distribution voltage to reduce the losses.
transformers
Distribution transformers normally operate above 95% efficiency, unless they are old or are operating at very light load. Old, ineffi-cient transformers should be replaced by new models that are more efficient. It is more effi-cient to run only one transformer at full load than to run two transformers at light load.
Fig. 19. Voltage Unbalance (%)
Dera
ting
(%)
0
5
10
15
20
25
30
35
Effect of voltage unbalance on motor rating

Manual for Industrial Motor Systems Assessment and Optimization
30
cable sizing
The currents supplied to the motors in any given installation will produce losses (of the I2R type) in the distribution cables and transformers of consumers. Correct sizing of the cables will not only allow a cost-effective minimisation of those losses, but will also help to decrease the voltage drop between the transformer and the motor. The use of the standard national codes for sizing conductors leads to cable sizes that prevent overheating and allow adequate starting current to the motors, but can be far from being an energy efficient design. Ideally the cables should be sized by not only taking into consideration the national codes, but also considering the life-cycle cost.
In general, in new installations it is cost-effective to install a larger cable than that required by the code provided that the larger cable can be installed without increasing the size of the conduit, the motors operate at or near full load, and the system operates a large num-ber of hours per year.
Power Factor compensation
A poor power factor means higher losses in the cables and transformers, reduced available capacity of transformers, circuit breakers, and cables, and higher voltage drops.
In the case of motors, the power factor is at a maximum under full load, and it decreases with the load.
As discussed in section 3.3, an oversized motor will significantly lower the power factor. Thus, a properly sized motor will improve the power factor. A low power factor can be corrected by using capacitors connected to the motor or at the distribution transformer. Reactive power compensation not only reduces the losses in the network but also allows for full use of the power capacity of the power system components. Additionally, the voltage fluctuations are reduced, thus helping the motor to operate closer to the voltage for which it was designed.
3.3. motor oversizingStudies on the use of electric motors in European countries highlighted that the average motor’s working load is far below the rated motor power. The average load factor among all surveyed sectors (foods, paper, chemicals, ceramics, foundries and steel, tertiary sector) was estimated to range from 41% for small size motors (below 4 kW) to 51% for motors above 500 kW. In some sectors (e.g. foods and tertiary), the average working load is even lower, with a minimum of 24% for smaller motors.
The reasons why designers tend to oversize the motors are usually due to the aim of improving:
• the system reliability;• the starting torque;• the ability to accommodate increasing power requirements;• the allowance for higher load fluctuations;• the operation under adverse conditions (like voltage unbalance or undervoltage); and• the inventory of spare motors.

31
3.3.1. the effects of oversizing
The general practice of motor oversizing is confirmation that the energy performances (mini-mum losses in motors and supply lines) are often overlooked in the industry. The machinery manufacturers who are responsible for choosing the motor in the first place, as well as the users who should influence the buying phase or the replacement of broken down motors, should consider that the design criteria leading to oversizing may have strong consequences for the energy bill.
Whenever a motor has a working point far below 100% of the rated power, its efficiency and power factor decrease and the capital cost increases.
In most motors the efficiency is almost constant from 75% to full load, but it drops signifi-cantly at 50% of the full load or less. This effect is more evident for small motors. Figure 20 shows the efficiency vs. load factor of different power electric motors.
The comparison of the efficiency characteristics between standard and energy-efficient motors (EEM) shows that even the benefits of using EEMs may be wasted if the load factor is abnormally low.
The adverse effect of the reduction of the power factor due to oversizing is often neglected. Figure 21 shows the power factor vs. load factor of electric motors.
Unless the reactive power is compensated for each motor, the additional line losses due to oversizing may, in some cases, be a key factor for the proper motor selection.
Fig. 20.
150kW15kW1.1kW
P/PN
Effic
ency
(%)
100
95
90
85
80
75
70
Motor Efficiency vs. Load [9] Fig. 21.
150kW15kW1.1kW
Pow
er F
acto
r
1
0,9
0,8
0,7
0,6
0,5
0,4
0,3
P/PNPower Factor vs. Load [8]

Manual for Industrial Motor Systems Assessment and Optimization
32
3.3.2. recommended Procedure for motor selection
Technical fundamentals and practical rules for accurate motor sizing are available to electrical engineers. A detailed procedure, taking into account all the major parameters influencing the optimisation of the motor selection, is outlined below.
The application of the procedure shows that the available alternatives (different motor types and sizes) for an application may pro-duce significantly different consequences in terms of energy consumption and economic profitability. The selection of a motor work-ing with a high load factor is usually recom-mended, but a general statement in that sense cannot be made. Firstly, the reasons for oversizing the motor systems, as listed above, are sound, and must be taken into account to some extent. Secondly, the losses and costs associated with a specific applica-tion vary widely depending on the size and make of the motor, as related to the load and motor mechanical characteristics. In a number of cases, the improved efficiency of bigger motors may override the additional losses due to a lower load factor.
That is why the design of the new motor applications or motor substitution should always be based on specific calculations. The adoption of rule-of-thumb decisions should be avoided, as they may unexpect-edly lead to excessive energy waste.
The expected potential savings of electric energy that might be obtained free of charge just by careful motor sizing are not less than 2% of the motor consumption.
One particularly useful motor selection soft-ware is the motor systems tool1, developed by the Electric Motor Systems Annex of the IEA Technology Collaboration Programme on Energy Efficient End-Use Equipment (4E). It enables the user to simulate a full motor sys-tem from power supply to application. From one known duty point all partials are calcu-lated as well as the total system efficiency. Any change in speed, load or components is calculated dynamically and the results are presented instantly.
Figure 22 summarises the motor selection process flow, which is detailed below.
1 The tool can be freely downloaded at: <https://www.motorsystems.org/motor-systems-tool>
Fig. 22.
• Type of load• Torque-speed characteristics• Load inertia• Starting characteristics
• Account for transmission losses and speed ratio
• The characteristics of the motor shall be preliminarily evaluated to meet the required specifications.
• Select the most appropriate motor model to meet the required specifications.
• The evaluation should be made by comparing the life-cycle cost effectiveness of each alternative solution.
determine Load characteristics
determine Load of the motor shaft
determination of the motor characteristics
selection of the motor from the manufacturers data sheets
economic evaluation of the choice among different motors
Motor selection process flow

33
definition of the type and characteristics data of the load
The following load characteristics shall be defined:
• type of load (short description of the operating machine);• rotation speed required by the load in normal working conditions;• power or torque (constant torque, quadratic torque, decreasing torque) required by the
load at the above speed;• moment of inertia of the load;• mechanical characteristic (torque-speed) of the load (the values of torque at 75%, 50%,
25% of rated speed are recommended);• starting time required by the load;• starting torque to be applied to the load (may be computed from the starting time, the load
inertia and the rated speed);• ratio of starting torque to rated torque;• anticipated overloads and their duration;• type of mechanical coupling;• speed ratio r (load shaft/motor shaft speed): this ratio may imply the choice of the number
of poles; and• coupling efficiency.
mechanical data transfer from the load to the motor shaft
The mechanical data shall be transferred to the motor shaft via the r ratio defined above:
• rotation speed and moment of inertia;• adjusted power to account for the transmission losses;• adjusted torque to account for the transmission efficiency and speed ratio r; and• the starting time is unchanged.
Preliminary evaluation of the motor rating
The characteristics of the motor shall be preliminarily evaluated, to be compared later with the motors available in the market (number of poles, power):
• the rated speed and power (assumed to be the same as the load values transferred to the motor shaft);
• the supply frequency;• the rated slip is assumed to have the typical value for the motors with the required power
range;• the synchronous speed and the number of poles is computed accordingly;• if the number of pole pairs is close to an integer, the motor selection may be made by
means of the manufacturer’s technical sheets; if it is not the case, the speed ratio r shall be adjusted until an integer number of pole pairs is obtained.
selection of the motor from the manufacturer’s data sheets
The manufacturer’s data sheets shall be searched to find the motor characteristics which show the best fit with the preliminary calculations.

Manual for Industrial Motor Systems Assessment and Optimization
34
If wider safety margins are sought, the pro-cess may be repeated by selecting motors with a higher performance. The procedure is as follows:
• the number of pole pairs is set to the value arising from the preliminary calculation;
• the motor has a rated power close to the one computed and a torque characteris-tic (maximum to rated and locked rotor to rated torque ratios) that matches with the application requirement;
• the motor rated speed and slip are found in the data sheet;
• the motor torque data (such as maximum and starting torque) are found in the data sheet, and their consistency with the operating conditions (starting time, overload capability) and the rated torque shall be checked;
• the torque values at different loads (namely, the mechanical motor charac-teristic) are also usually provided by the manufacturer;
• the values of rated efficiency and power factor shall be determined accordingly.
Identification of the working point as the intersection of the load and motor characteristics
When the motor is selected, the following procedure applies:
• the working point (torque and speed) shall be determined. This may be accom-plished either graphically (plotting the motor and load torque-speed character-istics), or analytically (linearising the two characteristics in the neighbourhood of the working point).
The following parameters at the working point may now be calculated:
• speed and slip;• motor output power;• load factor (the ratio of the output power to
the rated output power);
• motor efficiency, either on the basis of the manufacturer’s data or the average data relevant to a load equal to 100%, 75%, 50%, 25% of rated power;
• motor input power (the ratio of the output power to the efficiency);
• power factor;• motor losses;• line losses.
economic evaluation of the choice among different motors
The evaluation should be made by compar-ing the cost-effectiveness of each alternative solution, considering both the cost of the motors and the anticipated yearly savings on the energy bill.
3.4. transmission systemThe transmission system transfers the mechanical power from the motor to the final end-use. The choice of transmission is dependent upon many factors, namely: the desired speed ratio, motor power, layout of the shafts, type of mechanical load, etc. The most important transmission types available include: direct shaft couplings, gearboxes, chains and belts.
belts
Most motors are connected to their loads through a transmission system, very fre-quently through a belt. About one third of the motor transmissions in industry uses belts. Belts allow flexibility in the posi-tioning of the motor in relation to the load. Additionally, belts can also increase or decrease the speed using pulleys of suita-ble diameters.
There are several types of belts namely: V-belts, cogged V-belts, synchronous belts and flat belts. While V-belts are the cheapest and the most common type, other types can offer greater efficiency as seen in Table 1.

35
table 1. Comparison of Belt Drive Characteristics [7]
typical efficiency range (%)
suitable for shock
Loads
Periodic maintenance
required
change of Pulleys
requiredspecial Features
V-belts 90-98 Yes Yes No Low first cost.
cogged-V-belts 95-98 Yes Yes No
Easy to retrofit.Reduced slip.
synchro-nous belts 97-99 No No
Yes, with higher
cost
Low-medium speed
applications. No slip. Noisy.
Fig. 23. a) Synchronous belt and sprocket; b) Cog belt (left) and V-belt
Fig. 24.
0% 50% 100% 150% 200% 250%82%84%86%88%
90%
92%94%96%
98%100%
Nominal Load
Effic
ienc
y
V-beltSynchronous belt
Efficiency Curve for a V-belt and a Synchronous belt [8]
The V-belt losses are associated with flexing 4 times per cycle, slippage and a small percent-age loss due to windage. With wear, V-belts stretch and need retensioning. They also smooth with wear, becoming more vulnerable
to slippage. Thus, V-belts need regular main-tenance, which is a disadvantage in relation to other non-stretch type belts. Furthermore, their efficiency will drop if the load is above or below the full load (see Figure 24).

Manual for Industrial Motor Systems Assessment and Optimization
36
The cogged V-belts have lower flexing losses, since less stress is required to bend the belt and so they are typically 1-4 percent more efficient than standard V-belts. They can be used on the same sheaves and pulleys as standard V-belts, last twice as long and require less frequent adjustments. The efficiency gained with cogged V-belts is larger when small pul-leys are used. Cogged V-belts cost 20-30% more than standard V-belts, but their extra cost is recovered over a few thousand operating hours.
The most efficient belt is the synchronous design, with 97-99% efficiency, because it has low flexing losses and no slippage. Synchronous belts have no slippage because they have meshing teeth on the belt and pulleys. Unlike standard V-belts that rely on friction between the belt and the pulley grooves to transmit the torque, synchronous belts are designed for minimum friction between the belt and the pulley. Due to their positive drive, these belts can be used in applications requiring accurate speed control. Syn-chronous belts stretch very little because of their construction, do not require periodic retensioning and they typically last 4 times longer than standard V-belts. Retrofitting synchronous belts requires installing sprocket pulleys that cost several times the price of the belt. In cases where pulley replacement is not practical or cost effective, cogged V-belts should be considered.
Gears
The selection of efficient gear drives can be a potential for important energy savings. The ratings for gear drives depend on the gear ratio (the ratio of the input shaft speed to the speed of the output shaft) and on the torque required to drive the load.
Several types of gears can be used in motor transmissions, namely: helical, spur, bevel and worm. Helical and bevel gears are the most widely used and their efficiency can reach 98% per stage (each step of reduction or increase in the shaft speed). Spur gears are used for the same purpose as helical gears but are less efficient, so they should not be used in new applications. Worm gears allow a large reduction ratio (5:1-70:1) to be achieved in a single stage. Their efficiency ranges from 55% to 94% and drops quickly as the reduction ratio increases. Thus, worm gears should be replaced with more efficient gears such as helical gears whenever possible.
Fig. 25. a) Worm gear b) Helical gear

37
3.5. operation and maintenance PracticesRegular maintenance (such as inspection, cleaning, lubrication, tool sharpening) is essen-tial to maintain peak performance of the mechanical parts and to extend their operating lifetime [9]. This subject is dealt with in more detail in Chapter 9 – Energy and Maintenance.
Lubrification
Regular maintenance with the right frequency is necessary, to reduce to the minimum the friction of the bearings. Bearing friction wastes energy, increases the motor running tem-perature and decreases both the motor and lubrificant lifetimes. Both under or over lubri-fication can cause higher friction losses and shorten the bearings’ lifetime. Additionally, overgreasing can cause the accumulation of grease and dirt on the motor windings, leading to overheating and premature failure. The use of synthetic lubrificants can achieve sub-stantial reduction in the friction losses.
Periodic checks
The temperature, and the electrical and mechanical conditions of a motor should be checked periodically. Additionally, the mechanical efficiency of the end-use tool (pump, fan, weaving machine, etc.) directly affects the overall system efficiency. Monitoring wear and erosion in the end-use tool is especially important as its efficiency can be dramatically affected. For example, the erosion of the pump impeller will cause the pump efficiency to drop sharply.
In general facilities with good maintenance programmes will inspect the motor driven system every six months.
cleaning and Ambient conditions
Cleaning the motor casing, which is frequently required in some dusty industries, is also relevant because its operating temperature increases as dust and dirt accumulates on the
chains
Unlike belts, chains have typically been used in low speed and high-torque applications. Like synchronous belts, chains do not slip. A well-maintained chain may have an effi-ciency of about 98%, but wear can decrease this efficiency by a few points.
With the exception of silent chains, chains are noisy. Furthermore, chains need read-justments and adequate lubrification, which may not be easy to provide. Thus, the use of synchronous belts may seem an attractive alternative to the use of chains.
Fig. 26. Chain transmission

Manual for Industrial Motor Systems Assessment and Optimization
38
case. The same can be said about providing a cool environment for the motor. The temperature increase leads to an increase of the windings’ resistivity and therefore to larger losses. An increase of 25 oK in the motor temperature increases the Joule losses by 10%.
commissioning
The proper installation and start-up of the motor system is critical to ensure optimal efficiency and maximum lifetime. Particularly in large installations, it is worth a third party thoroughly verifying the whole motor system and checking if the relevant specifications (electrical and mechanical) are met in a satisfactory way.
3.6. Load management and cyclingIn addition to energy savings, demand reduction can also be achieved through the use of ener-gy-efficient motor systems. Especially in the case of large investments, the economic benefits of demand reduction should also be taken into account when evaluating the cost-effective-ness of energy conservation investments. Additionally, motor cycling and scheduling can be performed, for load management purposes, to further reduce the power demand during peak periods. Typical loads which may benefit from cycling are loads with large time constants. Such loads include refrigeration equipment, air-conditioners, heat-pumps and other curtailable loads.
3.7. benefits of motor systems optimisationThe optimisation of motor systems within an organisation provides multiple benefits which extend beyond the more direct energy and corresponding cost savings. Figure 27 shows some of these benefits.
Fig. 27.
Energy efficiency improvement
Energy savings GHG
emissions
Energy security
Energy delivery
Energy prices
Macro-economics
impacts
Industrial productivity
Poverty allevation
Health & well-being
Employment
Local air pollution
Resource management
Public budgets
Disposable income
Asset values
The multiple benefits of energy efficiency improvements [10]

39
The implementation of an effective motor system management programme develops syn-ergies between preventive and predictive maintenance programmes, equipment operation and process productivity to establish a repair/replace policy based on a commitment to energy-efficient equipment selection and operation. Table 2 shows some of the benefits of implementing such a programme.
table 2. Benefits of Motor System Management programmes
Increased Productivity Improved reliability reduced costs
Greater control over process requirements
Scheduled downtime instead of breakdown
maintenanceMore efficient operation
Flexibility in meeting production requirements
Longer production runs between maintenance
outages
Reduced maintenance costs
Reduced scrap and rework Longer equipment life Lower unit cost

40

4141
4. VArIAbLe sPeed drIVes (Vsds)
A variable speed drive is an electronic system designed to control the speed of the motor’s shaft by varying the frequency and voltage applied to the stator windings in order to meet the application speed and/or torque requirements.
VSDs have a wide variety of possible applications in electric drives. In the industrial sector it is possible to identify a few typical functions covering the majority of these motor appli-cations, namely, robotics, machine-tools, materials handling, small and medium power process machines, compressors, centrifugal pumps and fans, etc. In Table 3 the typical in power ranges of common applications can be seen.
Electrical VSDs are normally incorporated into more or less complex systems. Depending on
the driven machine, it is possible to:
• control speed (angular or linear), torque, position, acceleration or braking;• optimise energy and/or material consumption, provided that a suitable sensor can be
found and that the control algorithm can be defined;• combine several machines and control their speeds in a coordinated manner;• communicate with different systems or different hierarchy levels in the same system,
the drive and the machine being considered as a single unit within a structure grouping together the complete process.
table 3. Positioning in power of the typical industrial applicationsApplication P<10 kw 10<P<50 kw 50<P<500 kw P>500 kw
Robotics
Machine Tools
Material Handling
Small and medium process machines
Large machines(e.g. mills, compressors)Centrifugal machines (excluding large machines)Replacement of thermal engines
4

Manual for Industrial Motor Systems Assessment and Optimization
42
The possibilities offered by VSDs are enhanced by the integration with computer-ised manufacturing systems.
The speed of the rotating field created by the induction motor stator windings is directly linked with the voltage frequency applied to the windings. Electronic Vari-able Speed Drives can produce variable frequency, variable voltage waveforms. If these waveforms are applied to the stator windings there will be a shift of torque-speed curve, maintaining a constant pull-out torque, and the same slope of the lin-ear operation region of the curve. In this way, the motor speed is going to be propor-tional to the applied frequency generated by the VSD (Figure 28).
Fig. 28. Speed
0 100%
f1 f2 f3 f4 f5
Torq
ue
Speed-Torque Curves for an Induction Motor (f
1<f
2<f
3<f
4<f
5 and f
5 = 50Hz)
Figure 29 shows the general configuration of most VSDs. The three-phase, 50Hz alter-nated current (AC) supply is initially con-verted to direct current (DC), then filtered and finally, the DC/AC inverter converts the
DC voltage to the variable voltage and vari-able frequency output applied to the motor.
The adjustment of the motor speed through the use of VSDs can lead to better process control, less wear in the mechanical equip-ment, less acoustical noise, and significant energy savings. However, VSDs can have some disadvantages such as electromag-netic interference (EMI) generation, current harmonics introduction into the supply and the possible reduction of efficiency and life-time of old motors.
Table 4 presents an overview of controlled AC-drive technologies, showing five basic forms of power electronic VSDs.
The criteria for VSD selection involves know-ing a certain amount of basic data which namely includes: power required, supply voltage, torque/speed requirements, speed range and speed accuracy. A VSD must be capable of:
• Starting the controlled load.• Driving this load in accordance with the
operating requirements.• Stopping this load in accordance with the
criteria linked to the operating mode.
To meet these three functions, which are common to all applications, it may be necessary to add the positioning or the synchronisation with other devices in the system.
Fig. 29.
MOTOR
3 phase AC input 50 Hz
AC/DCConverter
DC link+
Filter
DC/ACInverter
Variable frequencyVariable voltage
General Configuration of Inverter Based VSDs

43
table 4. Overview of power electronic VSDs
type of Vsdmain characteristics
Advantages disadvantages• Pulse-Width
Modulation (PWM)
• Voltage Source Inverter (VSI)
• Good power factor throughout speed range.
• Low distortion of motor current.• Wide speed range (100:1).• Multi motor capability.
• Limited to VSDs bellow 1 MW.• Slightly (about 1%) less efficient than
VSI or CSI.• Basic circuit has no regeneration
capability.
Six-step Voltage-Source Inverter (VSI)
• Good efficiency.• Simple circuit configuration.• Wide speed range (10-200%).• Multi-motor capability.
• Poor power factor at low speeds (unless a rectifier/chopper AC/DC converter is used).
• No regeneration capability.• Operation below 10% of rated speed
can produce cogging.
Force Commutated Current-Source Inverter (CSI)
• Simple and robust circuit design.• Regenerative capability.• Built-in short circuit protection.• Wide speed range (10-150%).
• Bulky.• Poor power factor at low speed/load.• Possible cogging below
10% of rated speed.
Load-Commutated Inverter (LCI)
• Simple and inexpensive circuit design.
• Regeneration capability.• Built-in short-circuit protection.
• Poor power factor at low speed.• Can only be used with
synchronous motors.
Cyclo-Converters
• Can operate down to zero speed.• High torque capability with field-
oriented control.• Can be used with induction and
synchronous motors.
• Cannot be used above 33% of input frequency.
• Complex circuit design.• Poor power factor at low speed.• Drives above 1 MW
To start a load the electromagnetic torque of the motor must be larger than the total resistive torque. The difference gives the acceleration torque, which is a function of the total inertia of the system and of the required accelerating time. Table 5 shows a few examples of starting requirements linked to typical applications and gives possible solutions.
Productivity normally increases with speed. The quality increases with steady-state accu-racy if the load varies little during the production cycle. Dynamic accuracy is relevant if the load cycle varies significantly and if there are many variations in the torque reference. Often, the transmission quality of the shaft line (backlash, elasticity, flexion, torsion, etc.) limits the improvement in performance due to the use of VSDs. One of the characteristics of VSDs is that the drive can be located as close as possible to its utilisation. It is therefore possi-ble to reduce to a minimum the problems linked to couplings and transmissions (backlash, elasticity, critical speeds).

Manual for Industrial Motor Systems Assessment and Optimization
44
In applications that require a wide range of speeds and/or accurate speed control, the most appropriate technique is to use electronic variable speed drives (VSDs) [11]. VSDs can match the motor speed to the load requirements. Motor-driven loads can be classified into four main groups according to whether the torque required increases quadratically or linearly, remains constant, or decreases as the speed increases (Figure 30). The mechani-cal power is equal to the product of torque times angular speed. In centrifugal pumps and fans (quadratic torque loads) the power required varies approximately with the cube of the motor speed. This means that in a fan system, only about half of the full power is required to move 80% of the rated flow.
table 5. Examples of starting requirements linked to certain typical applications and possible solutions
stArtInGrequirements typical applications Possible solutions
Limiting mechanical shocksBelt conveyor, escalator, conveyor for fragile products
Speed ramp
Eliminating backlashGearings, transmission handling line
Parabolic or S-shaped ramp
High inertia machine CentrifugeMotor with high starting torque
Machine with high resistive torque
Crusher, Grinder
Load with driving torque LiftSystem operating in 2 or 4 quadrants
Frequent starting in a given time
Handling machine Appropriate thermal rating
Within a time limit Centrifuge smoke extractor Speed ramp
Within a time and space limit Ski lift Special acceleration control
In terms of response, the pumps and fans controlled by VSDs can respond to changing conditions faster and more reliably than valves or dampers can. This is particularly true at the extremes of the flow range where valves become highly non-linear, even when equipped with linearising trims.
In the case of cube-law loads (ex.: centrifugal fans, pumps and compressors), significant reductions in the consumption can be obtained, compared to the throttling flow control. VSDs can also make induction motors run faster than their normal full speed ranges, pro-vided that the rotors can withstand higher operating speeds. Therefore, VSDs also have the potential to extend the useful operating range of compressors, pumps, and fans. For the many applications (such as forced draft fans) that are limited by fan or pump capability, a properly selected VSD and motor can extend both the high and the low end capability.
VSDs also isolate motors from the line, which can reduce motor stress and inefficiency caused by varying line voltage, phase unbalance, and poor input voltage waveforms. In some applications VSDs can drive multiple motors simultaneously, as in many web processes. For example, a single 100 kW PWM-VSD could be used to drive two 50 kW induction motors at exactly the same frequency. This approach can provide significant cost savings.

45
Fig. 30.
Quadratic Torque LoadConstant Torque LoadConstant Power LoadLinear (viscous) Torque Load
Speed
Torq
ue
Types of torque-speed curves:
• Quadratic torque load (e.g. centrifugal fans, blowers, pumps and compressors); • Constant torque load (e.g. conveyors, positive displacement pumps, screw compressors,
reciprocating compressors, crushers); • Constant horsepower load (e.g. traction, winders, rolling mils); • Linear Torque Load (e.g. calenders with viscous friction coupling, mixers, eddy current brakes).
stopping a system can be carried out in different ways depending on the performance required by the application. Table 6 summarises the main aspects related to the stopping operation. The problem of stopping is linked to that of positioning.
table 6. Main aspects related to the VSD stopping operationstoPPInG
requirement typical applications Possible solutions
Simple stopping FansFreewheel or mechanical brake
Limit mechanical shocks Belt conveyor drivesDeceleration ramp, torque limitation
Backlash elimination System incorporating gearsParabolic deceleration ramp
Short time Emergency stop centrifuges Speed ramp, DC injection
Load with driving torque Lifts, hoists Reversing drive
Electrical braking without motor heating, with or without regeneration
Rolling mills, electric tractionResistive dissipation or regenerative braking

Manual for Industrial Motor Systems Assessment and Optimization
46
In summary, the advantages of VSDs are:
• Energy savings associated with the speed control; • Improvement of the dynamic performance of induction motors;• High efficiency of the VSDs (96-98%) and high reliability;• High power factor (if active front end is used);• Small size and location flexibility; • Soft starting (savings!) and controlled/regenerative braking;• Motor protection features;• Lower acoustic noise and improvement of the process control;• Less wear maintenance needs of the mechanical components.
There are also a few possible disadvantages to the use of VSDs, which can be mitigated if certain precautions are taken, such as:
• Inject harmonic distortion in the network;• Voltage spikes leading to the failure of insulation in the windings of old motors;• Bearing current leading to premature failure.
4.1. Pumpssingle pump - The centrifugal pumps without lift (e.g. closed loop circuit) and respects the cube power law, i.e., the consumed power is proportional to the cube of the speed, as shown in Figure 31 (a). If the user wants to reduce the flow in the process, valve control can be used, or alternatively speed control can be applied, using a VSD. Although both tech-niques fulfil the desired objective, the consumed energy is significantly higher when valve throttle control is used. If there is a system head associated with providing a lift to the fluid in the pumping system the pumps must overcome the corresponding static pressure, as shown in Figure 31 (b).
Fig. 31.
0
10
20
30
40
50
60
70
80
90
100
40 45 50 55 60 65 70 75 80 85 90 95 100
Delivery rate in %
Elec
tric
al p
ower
con
sum
ed in
%
Throttlecontrol
Speedcontrol
0
10
20
30
40
50
60
70
80
90
100
40 45 50 55 60 65 70 75 80 85 90 95 100
Delivery rate in %
Elec
tric
al p
ower
con
sum
ed in
%
Throttlecontrol
Speedcontrol
Electrical power input of a pump with throttle control vs. one with speed control: (a) without static pressure head (e.g. recirculation systems); (b) with static pressure head

47
Fig. 33.
STANDARD MOTOR(Efficiency = 90%)
THROTTLE(Efficiency=66%)
PUMP(Efficiency=77%)
COUPLING(Efficiency=98%)
PIPE(Efficiency=69%)
STD
(a)
(b)
ENERGY INPUT 100 ENERGY OUPUT 31
ENETGY-EFFICIENTMOTOR
(Efficiency = 95%)
VARIABLESPEED DRIVE
(Efficiency = 96%) MOST EFFICIENTPUMP
(Efficiency=88%)
COUPLING(Efficiency=99%)
LOW-FRICTION PIPE(Efficiency=90%)
ENERGY INPUT 43 ENERGY OUPUT 31
VSD
EEM
Two pumping systems with the same output: (a) Conventional system (Total Efficiency = 31%); (b) Energy-efficient pumping system combining efficient technologies
(Total Efficiency = 72%)
In these pumping systems the mechanical energy is used to overcome the friction in the pipes, plus the mechanical work asso-ciated with lifting the fluid against the grav-ity, as shown in Figure 32.
If the percentage of the power associated with overcoming the pipe friction is rele-vant, energy savings can still be achieved, although typically less than in systems without static pressure head.
The overall efficiency of the pumping sys-tem depends on the efficiency of the dif-ferent components of the system. Figure 33 shows an example of the power absorbed by a pump system with different components. For the same end-use power, the inefficient system absorbs more than twice the power absorbed by the optimised system.
Fig. 32.
Static head
Friction head
Head
FlowTotal system resistance from
frictional losses plus static head losses

Manual for Industrial Motor Systems Assessment and Optimization
48
staged pumping plant - In many pumping applications several pumps are used in par-allel to produce the required flow. Operat-ing all pumps at reduced speed rather than cycling the pumps on/off according to the demand, significant energy savings can be made. For example, in a low static head two pump system, with independent piping cir-cuits, operating both pumps at 50% of the rated flow requires approximately 25% of the power required for a single pump operating at 100%. Other advantages are that pumps stay warm (no condensation in the windings) and seals stay wet and alive, also eliminat-ing high-shock starts on system. Figure 34 illustrates this situation. Also, it is possible to control the “water-hammer” effect which degrades the pipes by controlled accelera-tion/deceleration using VSDs.
4.2. FansSavings from adding variable speed control to fans can be significant even with fairly heavily loaded motors. Figure 35 illustrates the savings potential with VSD versus com-mon throttling methods.
High amounts of energy are wasted by throttling the air flow versus using adjustable
speed. The worst method is outlet dampers, followed by inlet vane control. For 50% flow, a VSD can save 80% and 68% of the consumed power when compared with dampers and inlet vanes, respectively. For example, a 100 kW motor driving a load continuously throttled to 50 percent of output will save almost 18,000 euros per year (assuming 0.06 Euro/kWh, 6,000 hours per year). The energy consump-tion in these loads is so sensitive to speed that the user can achieve significant sav-ings with even modest speed adjustments.
Example: In the heat exchanging systems, such as those represented in Figure 36 and Figure 37, the pump’s speed may be controlled as a function of the process or zone tempera-ture, and the fan’s speed as a function of the coolant water/fluid temperature, by means of VSDs or using two-speed SCIMs. The “heat exchange” capacity can also be adjusted by energising/de-energising each of the four subsystems. The combined pump and fan speed control as a function of the tempera-ture (Figure 36), compared with the ON/OFF cycling control, leads to a more stable temper-ature in the controlled zone/process and to a more efficient operation, typically decreasing the fan energy consumption in the range of 25-50%. Such systems can be found, for exam-ple, in cooling towers and roof top chillers.
Fig. 34.
TOTAL 100% POWER SAME FLOW TOTAL 25% POWER
50 Hz OFF 25 Hz
0%Power
12.5%Power
12.5%Power
Pumping plant: Useful relationship to consider with two independent closed loop circulating systems where “head” is not a major factor

49
Fig. 35.
ID = Inlet damperOD = Outlet damperIGY = Inlet guide vanesFC = Fluid couplingVSD = Variable Speed Drive Theoretical best
100
100
0Percent flow
Perc
ent p
ower
ID
ODIGV
FC
VSD
Relative power consumption of different air flow control methods
Fig. 36.
hot air hot air
hot water cold water
cold air cold airVSD
VSD
PumpM2 Fan
M1
T2
T3PROCESS
HEATEXCHANGE
T1
Simultaneous closed-loop speed control of the pump and fan of a heat exchanger or chiller
In the system represented in Figure 37, if the cooling water circuit is closed and only 50% of the heat dissipation is needed, it is rele-vant to optimise the reduction of the speed of the fans and of the pumps, provided that in the end the overall thermal resistance between the process to be cooled and the environment is kept at 50%, in order to main-tain a constant temperature for half of heat loss production. The fan and pump speed decrease will lead to cubic reduction in the required power.
If the amount of heat to be extracted from the process cooling system represented in Figure 37 is reduced to 75%, 50% or 25%, assuming inde-pendent closed-circulation piping systems, the user may switch off 1, 2 or 3 heat exchang-ers (pumps and fans), leading to a reduction of 25%, 50% and 75% of the required hydrau-lic/pneumatic power, respectively, or, alter-natively, reduce the speed of the pump and fan in the 4 heat exchangers to 75%, 50% or 25%, by means of VSDs, leading to a reduc-tion of 57.8%, 87.5% and 98.4% of the required hydraulic/pneumatic power, respectively [7].

Manual for Industrial Motor Systems Assessment and Optimization
50
Fig. 37.
hot air hot air
cold air cold air
FanM1
PumpM2
hot air hot air
cold air cold air
FanM3
PumpM4
hot air hot air
cold air cold air
FanM5
PumpM6
hot air hot air
cold air cold air
FanM7
PumpM8
HOT
WAT
ER F
ROM
THE
PRO
CESS
HEA
T EX
CHAN
GE
COLD
WAT
ER T
O T
HE P
ROCE
SS H
EAT
EXCH
ANG
E
System with four heat exchangers
4.3. compressorsRotary screw and piston air compressors are essentially constant torque loads and can also benefit from the application of variable speed control. The savings related to the use of variable speed control are dependent on the control system that is being replaced.
In Figure 38 the energy savings achieved by fitting a VSD to a rotary screw compressed air unit, compared to other methods of flow control at partial load, can be seen. In a compressor, with modulating control, if the demand is 50% of the rated capacity, the energy savings associated with the VSD inte-gration are about 38%.
hot water
hot water
hot water
hot water
cold water
cold water
cold water
cold water

51
Energy savings with constant torque loads are typically considerably less than with cen-trifugal pumps or fans which obey the power cube law, and so to retrofit a VSD to a com-pressor it is less likely to be economic on the grounds of energy savings alone. Addition-ally, care needs to be taken to ensure ade-quate lubrication at reduced speeds. How-ever, the introduction of screw compressors with integral speed control has enabled the additional price of variable speed control to be significantly reduced. These machines therefore deserve to be considered for all new applications with long running hours,
when there is a widely varying demand. Fur-ther energy savings will also be achieved through improved pressure control, by reducing the mean generation pressure.
Another example of VSD application in com-pressors is for refrigeration purposes (Figure 39). The use of VSD for temperature control (floating head operation) in the refrigeration pumps/compressors (ex.: Walk-in Freezer) can eliminate the on/off cycling, with large energy savings. The temperature control can also be improved, in terms of differential between internal and external temperatures.
Fig. 38.
Speed control with VSD
Reciprocating on/off
Rotary on/off
Pow
er In
put (
%)
Demand (% of rated capacity)
0
20
40
60
80
100
20 30 405 06 07 08 09 0 100
Modulating control
Energy saved by using a VSD on a rotary screw air compressor
Fig. 39.
Walk-in FreezerTCompressorVSD
Variable speed refrigeration compressor

Manual for Industrial Motor Systems Assessment and Optimization
52
4.4. LiftsNew VSD topologies allow the braking energy to be injected back to the source/grid. This feature can be a way of saving a significant amount of energy in applications with fre-quent braking operations, namely, lifts. This is only possible if the motor mechani-cal transmission allows this mode of oper-ation. When the lift is going down, and the load weight (people inside) is larger than the counterweight, then the motor torque is in the opposite direction to the speed, i.e., the motor is braking. In the same way, when
the lift is going up unloaded, energy savings can be made if the motor is controlled with a regenerative VSD.
In Figure 41, possible energy savings in lifts, using different technologies, can be seen. With the use of a regenerative VSD system, and special gear, the consumed energy can be reduced to 19%, when compared to a conventional system, using a pole changing drive. Permanent magnet motors with direct drive (without gears) coupling and regenera-tive braking are also being introduced in new high efficiency lifts.
Fig. 40.
AC Grid or Bus
M1J1
M4J4
M2J2
M3J3
mcBrak
e Brak
e
Mot
or
Mot
or
v
v
vv
F
F
F F
SYSTEM WITH MULTIPLE ELEVATORS
mc
m4mc
mcmc
m1
m2
m3
Lift motor operating modes ( fM
- Driving force ; v - Speed )
Fig. 41.
Frequency inverter with regeneration and special gearFrequency inverter with special gear
Frequency inverter with conventional gear
Controller with conventional gear
Conventional pole changing drive
19%
34%
52%
65%
100%
100% 120%80%60%40%20%0%
Energy balance of lifts, average energy consumption, percentage. Source: Flender-ATB-Loher, Systemtechnik

53
4.5. centrifugal machines and machine-tools
In high inertia loads (e.g. machine-tools) or/and high speed loads (e.g. centrifugal machines), with frequent accelerating/brak-ing operation, it is possible to save signifi-cant amounts of energy. When running, this type of load has a large amount of kinetic energy that, in a braking process, can be regenerated back to the grid, if a regenerat-ing VSD is used (the same regenerative pro-cess as used in lifts). Examples of this type of load are high speed lathes with an auto-matic feeder or high inertia saws (Figure 42).
In fact, when a high inertia saw or high speed lathe is running the speed and torque are in the same direction, but when the operation ends, typically it is necessary a fast stop. So, the braking energy can be re-injected to the grid, instead of being dissipated in a resist-ance. Another important aspect is the accel-eration process. As can be seen in Figure 43, if the motor is simply turned on (situation (a)), without any speed control, the rotor losses will be higher than if using a pole changeable motor (situation (b)). A more efficient acceleration technique uses a VSD (situation (c)), that will significantly reduce the energy consumption, comparatively to the other mentioned techniques.
Fig. 42.
Motor
HighInertia
Saw
+
+Motor
HighInertia
Saw
+
+
Speed andTorque
Shift
(a) (b)
Coupling Coupling
Driving operation Braking operation
Speed
Torque
Operation modes of a high inertia saw: (a) Driving operation; (b) Braking operation
Fig. 43.
VSD losses
Storedkinetic energy
Storedkinetic energy
Storedkinetic energy
00 0 n1
(c)(b)(a)
Stator losses
Stator losses
Stator losses
Rotorlosses
RotorlossesRotor losses
Energy Consumption for an Acceleration Period: (a) Standard Motor; (b) Pole

54
Changeable Motor; (c) Variable Speed Drive (VSD) [source: Siemens]
4.6. conveyorsIn the constant torque devices (ex.: horizontal conveyors), the torque is approximately inde-pendent of the transported load (is only friction dependent). Typically, the materials handling output of a conveyor is controlled through the regulation of input quantity, and the torque and speed are roughly constant. But, if the materials input to the conveyor can be changed, it is possible to reduce the speed (the torque is the same), and, as can be seen in Figure 45, significant energy savings will be made, proportional to the speed reduction.
Fig. 44.
Speed (m/s)
Motor
Conveyor Speed (rad/s)Torque (N.m)
Power=Torque.Speed (W)
Load
Power required by a conveyor
Fig. 45.
Energy Savings
Load
Power
Constant speed => Constant power (aprox.)
Lower speed => Lower power
Energy savings in a conveyor using speed control, in relation to the typical constant speed

5555
5. enerGY eFFIcIencY stAndArds
Almost all the major economies have some kind of voluntary or mandatory regulatory scheme regarding motor efficiency. Most of these economies have mandatory minimum efficiency levels for motors sold in the respective countries and labelling schemes for the promotion of higher efficiency motors.
Several different energy efficiency levels/classes were, until recently, in use around the world, increasing potential confusion and creating market barriers.
CEMEP-EU EFF1/EFF2/EFF3
USA EPAct/NEMA Premium
Australia Minimum Efficiency/High Efficiency
China Grade 1, 2 and 3
To further increase confusion, these classification schemes relied on different test methods which can produce significantly different results. Therefore, efficiency levels were not easily comparable.
Furthermore, the measurement tolerances varied in the different test methods, and the impact of the supply frequency (50Hz or 60Hz) used during the test on the final test results complicated things further.
With the purpose of harmonising the different energy efficiency classification schemes for induction motors in use around the world, the International Electrotechnical Commission (IEC) introduced, in 2008, a new classification standard – IEC60034-30 [12]. The standard covered single-speed three-phase 50Hz or 60Hz cage induction motors with a rated output PN of between 0.75 kW and 375 kW.
IEC 60034-30 has recently been revised (March 2014). It is now divided into two parts:
• Part 1 - E‐ciency classes of line operated AC motors (IE code)• Part 2 - Effciency classes of variable speed AC motors (IE code)
5

Manual for Industrial Motor Systems Assessment and Optimization
56
IEC 60034-30-1:2014 [13] significantly broadens the scope of products covered. The power range has been expanded to cover motors from 120 W to 1000 kW. All technical constructions of electric motors are covered as long as they are rated for direct on-line operation. These include single-phase motors, not just three-phase motors as in the previous edition, and line-start permanent magnet motors.
In this updated standard the IE4 class (Super-Premium), which in the previous standard was only envisaged, is now defined. Furthermore, a new superior IE5 class is introduced although not yet fully defined. It is the goal to reduce the losses of IE5 by some 20% relative to IE4.
The levels of energy efficiency defined are:
• IE5 – Ultra Premium efficiency (Preliminary values – still under development)• IE4 – Super Premium efficiency• IE3 – Premium efficiency (equivalent to NEMA Premium)• IE2 – High efficiency (equivalent to EPAct, and to old EFF1)• IE1 – Standard efficiency (equivalent to old EFF2)
For the purpose of efficiency classification according to standard IEC 60034-30-1, the preferred test method as indicated in standard IEC 60034-2-1 (2014) [14] for testing must be used. This means that in practice the “Summation of losses, with and without load test, P
LL determined
from residual losses” is used for all 3-phase motors in the 0.75 – 375kW power range.
Both standards will hopefully end the difficulties manufacturers encounter when producing motors for a global market and will help make it a more transparent one.
Fig. 46.
Output Power (kW)
Mot
or E
ffici
ency
(%)
0,1 10 100 1000
100,0
90,0
80,0
70,0
60,0
50,0
40,0
IE5
IE4
IE3
IE2
IE1
Efficiency levels in the IEC 60034-30-1 classification standard for 4 poled motors

57
At the time of the first edition of IEC 60034-30, in 2008, the efficiency levels of the Super Pre-mium (IE4) class were believed to be too high to achieve with standard induction motor tech-nology, particularly for small motors. However, it was expected that advanced technologies (e.g. Permanent Magnet motors, Synchronous Reluctance motors) would enable manufactur-ers to design motors to achieve this efficiency class with mechanical dimensions compatible for existing motors of lower efficiency classes, making these motors commodity products. Today, induction motors have reached the market with IE4 efficiency levels and the use of dif-ferent advanced technologies can produce motors with efficiencies above the IE5 efficiency threshold, as can be seen in Figure 47.
Most induction motors sold before 2000 and still being used today have poor efficiencies (below IE1). In most cases the low efficiency is aggravated by poor maintenance and repair practices.
The technical specification2 IEC TS 60034-30-2:2016 specifies efficiency classes for varia-ble speed rotating electric machines not covered in IEC 60034-30-1. The classification only covers machines designed for operation with sinusoidal fundamental currents that are not designed to be operated direct on-line (grid), for example permanent magnet synchronous machines with and without additional reluctance torque, sinusoidal reluctance synchronous machines and synchronous machines with DC field windings.
Fig. 47.
80
82
84
86
88
90
92
94
96
98
100
Effic
ienc
y (%
)
Power (kW)0.5 500
IE3 IE4 IE5 SCIM (IE4) LSPM (IE4) PM (IE5) SynRel (IE4) SynRel+PM(IE5)
Overview of the motor efficiency classes defined in the IEC600-34-30-1 standard and of the commercially available motor efficiency (catalogue data)
2 Technical specifications are often published when the subject in question is still under development or when insufficient consensus for approval of an international standard is available (standardisation is seen to be premature).

Manual for Industrial Motor Systems Assessment and Optimization
58
5.1. existing energy efficiency regulationAn overview of the AC three-phase induction motor efficiency voluntary agreements and reg-ulations around the world is presented in Figure 48 and Table 7. North America (USA, Canada and Mexico) has been the leading region in promoting both high-efficiency and Premium-ef-ficiency motors around the world.
Fig. 48.
Mandatory IE3 Proposed/developing
Mandatory IE2 No MEPS
Mandatory IE1 No data found
Overview of Minimum Energy Performance Standards (MEPS) Worldwide (Integral Polyphase Induction Motors)
table 7. Overview of Minimum Energy Performance Standards (MEPS) Worldwide
efficiency Levels
efficiency classes testing standard Performance standard
Iec 60034-30 Iec 60034-2-1 mePs
Premium Efficiency
IE3
Low Uncertainty
USA 2011 (< 150 kW)Canada Europe *
Korea 2015Mexico
High Efficiency
IE2
USA (> 150kW)Canada (> 150kW)Australia New Zealand Brazil
KoreaChinaJapanSaudi ArabiaSwitzerland
Standard Efficiency
IE1Medium
Uncertainty
Costa Rica IsraelTaiwan
* IE3 or IE2 + VSD
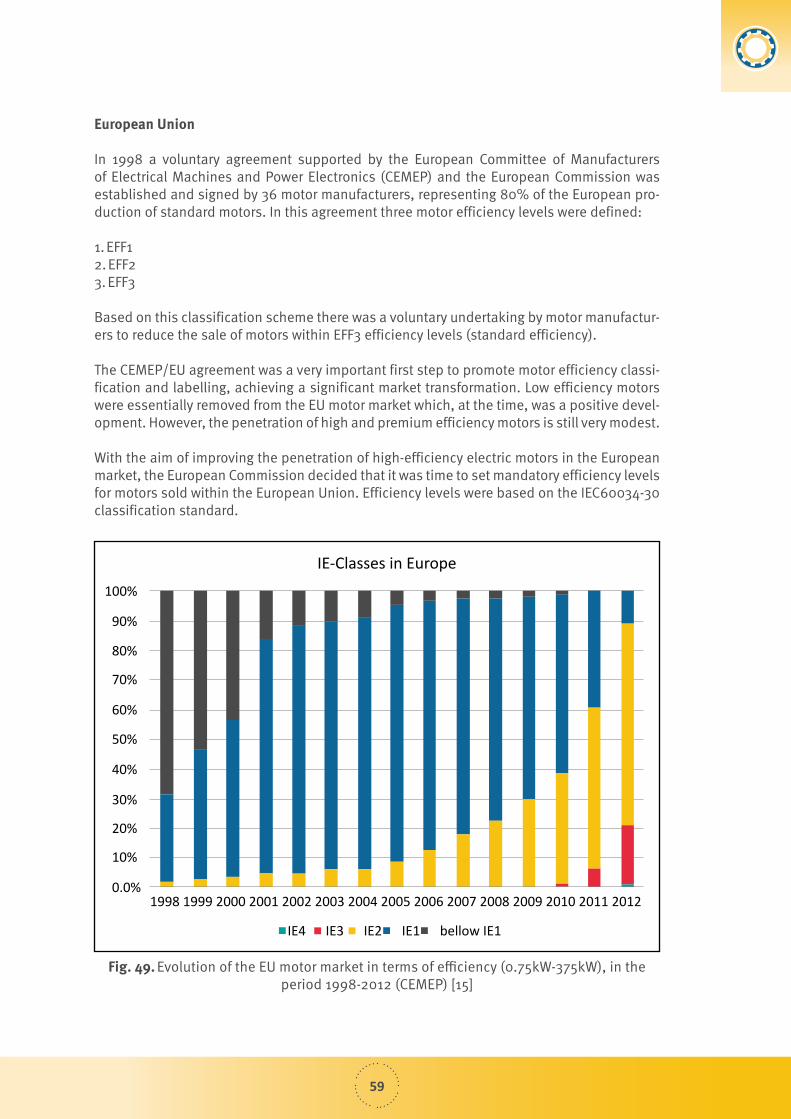
59
european union
In 1998 a voluntary agreement supported by the European Committee of Manufacturers of Electrical Machines and Power Electronics (CEMEP) and the European Commission was established and signed by 36 motor manufacturers, representing 80% of the European pro-duction of standard motors. In this agreement three motor efficiency levels were defined:
1. EFF12. EFF23. EFF3
Based on this classification scheme there was a voluntary undertaking by motor manufactur-ers to reduce the sale of motors within EFF3 efficiency levels (standard efficiency).
The CEMEP/EU agreement was a very important first step to promote motor efficiency classi-fication and labelling, achieving a significant market transformation. Low efficiency motors were essentially removed from the EU motor market which, at the time, was a positive devel-opment. However, the penetration of high and premium efficiency motors is still very modest.
With the aim of improving the penetration of high-efficiency electric motors in the European market, the European Commission decided that it was time to set mandatory efficiency levels for motors sold within the European Union. Efficiency levels were based on the IEC60034-30 classification standard.
Fig. 49.
1998 1999 2000 2001 2002 2003 2004 2005 2006 2007 2008 2009 2010 2011 2012
IE4 IE3 IE2 IE1 bellow IE1
IE-Classes in Europe100%
90%
80%
70%
60%
50%
40%
30%
20%
10%
0.0%
Evolution of the EU motor market in terms of efficiency (0.75kW-375kW), in the period 1998-2012 (CEMEP) [15]

Manual for Industrial Motor Systems Assessment and Optimization
60
Minimum efficiency requirements were set in the Commission Regulation (EC) No. 640/2009 [16], as follows:
1. From 16 June 2011: motors shall not be less efficient than the IE2 efficiency level.2. From 1 January 2015: motors with a rated output of 7.5-375 kW shall not be less efficient
than the IE3 efficiency level, or meet the IE2 efficiency level and be equipped with a vari-able speed drive.
3. From 1 January 2017: all motors with a rated output of 0.75-375 kW shall not be less effi-cient than the IE3 efficiency level, or meet the IE2 efficiency level and be equipped with a variable speed drive.
These requirements apply to 2-, 4- and 6-pole, single speed, Three-Phase, induction motors in the above mentioned power ranges, rated up to 1000 V and on the basis of continuous duty operation.
The following types of motor are excluded:
• motors designed to operate wholly immersed in a liquid;• motors completely integrated into a product (e.g. pump or fan) where the motor’s energy
performance cannot be tested independently from the product;• motors specifically designed to operate:
∙ at altitudes exceeding 1000 metres ∙ where ambient air temperatures exceed 40°C; ∙ in maximum operating temperatures above 400°C; ∙ where ambient air temperatures are less than –15°C (any motor) or less than 0°C (air-cooled motors);
∙ where the water coolant temperature at the inlet to a product is less than 5°C or exceeds 25°C; ∙ in potentially explosive atmospheres as defined in Directive 94/9/EC;
• brake motors.
The regulation has since been amended by Regulation (EC) No. 4/2014 which will reinforce the existing regulation by closing most of the loopholes that have become apparent by rede-fining the limit values applied to altitude (4000 metres), maximum and minimum ambient air temperatures (60°C and -30°C) and water coolant temperatures (less than 0°C or exceeding 32°C), and it will help to ensure fair competition in the market.
north America (usA, canada and mexico)
In 1992, the US Congress approved the Energy Policy Act (EPAct), which set the minimum effi-ciency requirements for motors manufactured or imported for sale in the USA. These manda-tory standards became effective in October 1997. From that time until 2008 the market sales for that efficiency level grew from 15% to 54%.
Meanwhile, many utilities and industry associations were promoting motors with a higher efficiency than the EPAct mandatory levels. Therefore, the National Electrical Manufacturers Association (NEMA) felt a need to define a classification scheme for premium higher effi-ciency motors. In June 2001, NEMA granted such “better-than-EPAct” motors special recogni-tion by creating a label designated NEMA Premium.

61
table 8. Characteristics of the motors included in EPAct [17]
motors included in ePAct scheme:
Polyphase squirrel-cage induction motors, NEMA Design A and B
Rated power 1-200 hp
Single-speed
230/400 Volts
60 Hz
Continuous rated
Tested in accordance with IEEE 112- Method B
2, 4 and 6 poles
Type of Enclosure: Totally Enclosed Fan-Cooled (TEFC) and Open Drip-Proof (ODP)
In order to further improve the market penetration of Premium Efficiency motors, the US Congress approved the Energy Independence and Security Act of 2007 (EISA), which was enforced in December 2010. It not only sets higher minimum efficiency mandatory levels but also broadens the scope of existing standards, as follows:
• Current minimum efficiency standards of general purpose induction motors as defined in the 1992 EPAct and covered by federal legislation should be raised to NEMA Premium levels.
• Seven types of low voltage poly-phase, integral-horsepower induction motors not currently covered under federal law should be subjected to minimum efficiency standards at the levels defined in 1992’s EPAct for general purpose induction motors. ∙ U-Frame Motors ∙ Design C Motors ∙ Close-coupled pump motors ∙ Footless motors ∙ Vertical solid shaft normal thrust (tested in a horizontal configuration) ∙ 8-pole motors (900 rpm) ∙ All poly-phase motors with voltages up to 600 volts other than 230/460 volts
• General purpose induction motors with power ratings between 200 and 500 horsepower should also meet the minimum efficiency levels as specified in 1992’s EPAct.
In Canada and the US, the MEPS relating to motors that conform to the National Electrical Manufacturers Association (NEMA) requirements are identical, but the Canadian programme also covers metric motors. Mexico has recently completed a revision of its MEPS, making the levels equivalent to those in the US and Canada.
The USA has recently issued a regulation, Energy Conservation Standards for Small Electric Motors, regarding the efficiency of “small induction motors”, either single-phase or three-phase, ranging from 1/4 to 3 horsepower.
Single-phase small electric motors are commonly found in products and appliances includ-ing pumps, fans, and power tools. Three-phase small motors are used to drive equipment such as pumps, fans, and compressors.

Manual for Industrial Motor Systems Assessment and Optimization
62
brazil
Brazil started a voluntary labelling programme for induction motors in 1993. It was a coordi-nated effort between motor manufacturers, CEPEL (Centro de Pesquisas de Energia Elétrica da Eletrobras) and INMETRO (Instituto Nacional de Metrologia, Normalização e Qualidade Industrial). The programme defined periodically revised efficiency levels, for standard- and high-efficiency motors.
In 2002, MEPS were introduced by Decree 4.508/2002, applying to three-phase induction motors in the 0.75 to 185kW power range, with 2 and 4 poles; and in the 0.75 to 110kW power range, with 8 poles. Motors below the standard efficiency levels (similar to IE1) were not allowed for sale in the country.
Since then (2010), MEPS have been raised to high efficiency levels (IE2).
Australia/new Zealand
Australia implemented its Minimum Energy Performance (MEPS) requirements in October 2001 for three-phase electric motors from 0.73kW to <185kW which were set out in AS/NZS 1359.5-2000. MEPS does not apply to submersible motors, integral motor-gear systems, var-iable or multi-speed motors or those rated only for short duty cycles.
These MEPS were updated in April 2006 which are set out in detail in AS/NZS 1359.5-2004, published in September 2004. The Minimum Efficiency levels were raised to IE2 equivalents and High Efficiency to IE3 equivalents.
Two methods of efficiency measurement, described in AS 1359.102, are allowed:
• Method A, identical to method 1 of IEC 61972 and technically equivalent to method B spec-ified in IEEE 112;
• Method B, based on the IEC 60034-2 “summation of losses” test procedure.
Therefore, there are two tables for each efficiency level, depending on the method used to determine efficiency.
china
China first introduced Minimum Energy Performance standards in 2002 (GB18613: 2002). The standards have since been revised and substituted by GB18613: 2006 – “The mini-mum allowable values of energy efficiency and the energy efficiency grades for small and medium three-phase asynchronous motors”. The revised standard, based on the CEMEP-EU Agreement, established energy efficiency Grades (Grades 1, 2 and 3), grade 1 being the highest efficiency level.
The standard was enforced in 2007 and prevents motors with efficiency below the Grade 3 level (equivalent to IE1) from being manufactured or sold in the country. The minimum efficiency requirements are expected to be raised to the IE2 levels in 2011 and further to IE3 until 2015. A label for IE4 efficiency motors is also expected to be introduced as a voluntary scheme.

63
It applies to general purpose motors (including explosion-proof) with 690V and lower volt-ages, 50Hz three-phase alternating current power supply, the scope of rating power between 0.55kW to 315kW for grade 2 and grade 3, and 3KW to 315KW for grade 1, the numbers of poles are 2, 4 and 6, single-speed close fan-cooled and N design.
Motor efficiency should be tested according to the method of Loss Analysis prescribed in GB/T 1032, where the stray loss of motors is calculated as 0.5% of the rated input power. This test method is described in IEC 60034-2-1 as being a medium uncertainty test method and is therefore not accepted as a valid test method in the IEC60034-30 classification standard. Provisions are being taken to revise GB/T 1032 in order to coordinate it with IEC standards.
Energy efficiency standards for small motors are also being developed in China.
The final draft of the standard is expected to be approved by the Standardization Administration of China in the near future. MEPS, Target MEPS, efficiency grades and testing methods have been specified. This standard applies to small three‐phase asynchronous motors (10W - 2.2kW), capac-itor‐run asynchronous motors (10W - 2.2kW), capacitor‐start induction motors (120W - 3.7kW), double‐value capacitor induction motors (250W - 3kW) for general purposes with the volt-age ≤ 690V, 50Hz AC power, and also to fan motors for room air conditioners (6W - 550W).
5.2. Incentive Policies and ProgrammesBesides the implementation of legal binding standards for the efficiency of electric motors, a number of initiatives have been put into practice with the purpose of increasing the penetra-tion of efficient electric motors and their drives. The experience of many energy saving initi-atives around the world shows that the most successful programmes are based on a mixture of technical information and financial incentives [18].
Fig. 50.
PRODUCT-DEVELOPMENT
NEW PRODUCTCYCLE
USE
BUYING
BUYING & MARKETINGby OEMs
MARKETINGby motor manufacturers
SUBSIDIES FOR R & D
PROCUREMENTPROGRAMMES
STANDARDS
STANDARDS LABELLING
VOLUNTARYAGREEMENTS
VOLUNTARYAGREEMENTS
TRAINING OF SALEPERSONNEL CONSULTANCY/
ADVISERS
CAMPAIGNS REPLACINGIN EFFICIENT APPLIANCES
SUBSIDESAND DUTIES
LABELLINGINFORMATION
INFORMATION
CONSULTANCY/ADVISERSENVIRONMENTAL
TAXES
Policy instruments to reduce obstacles to diffusion of high-efficiency electric motor systems along the product cycle [19]

Manual for Industrial Motor Systems Assessment and Optimization
64
Most of the programmes implemented worldwide are based on common elements of which some examples are given:
Labelling
As stated above, there are a number of labelling schemes in place for motors with efficiency beyond minimum standards: NEMA Premium (US), Voluntary High Performance Standards (Australia), IE3 (Europe), Grade 1 Motors (China). The purpose of these labelling schemes is to increase the visibility of products that exceed the minimum energy-efficiency require-ments and to educate consumers. Labels provide a highly visible and easy way to identify high performance equipment.
training/education
Some countries have training programmes in place directed at technical personnel – typically plant engineers, maintenance engineers, occasionally production personnel or energy man-agers. These will also be the individuals who will identify and then win funding for energy sav-ing projects. Promotional/educational materials and schemes are available that address their differing needs at each stage on the way to implementing successful energy saving projects:
• Becoming interested in saving energy• Receive sound technical information on energy saving options• Identify possible energy saving projects• Write and present proposal(s)• Implement project(s)• Estimate energy savings made
A selection of materials is provided, from short and simple introductory brochures to guides giv-ing much more detailed technical information needed to satisfy more experienced personnel.
Guidelines on the application of energy-efficient motors and drives are also widely available relating not only to motors but also to the system they are included in. These guidelines vary in complexity and some can be very detailed dealing with particular applications such as pumps, fans, compressors, etc.
raising awareness
Various techniques are used, including:
• Advertising• Trade press releases• Direct mail, newsletters• Conferences• Workshops
case studies
The best case studies of real life energy savings show not only all the benefits, but also any problems, giving confidence to readers that the stories are real and not simply omitting to
65
mention important practical considerations. These case studies not only inspire others to do similar work, but can also help both equipment suppliers to sell their products, and give per-sonnel who will have to allocate funds a great deal of comfort that the technologies represent a sound investment of company funds.
calculation aids
Calculation aids, such as software, can give better estimates of possible energy savings. However, in practice, (particularly with VSD software), the input data is not known to have sufficient accuracy to give particularly accurate answers. However, it does give a good indi-cation of likely energy savings, which alone is usually adequate to decide whether further consideration of an energy saving option is warranted.
Databases containing electric motor data are also available (EURODEEM, MotorMaster+) and are an important information tool that allows users to easily carry out an evaluation of the best instal-lation or replacement options, therefore helping to achieve electricity and money savings. Fur-thermore, they include motor inventory management tools, maintenance log tracking, efficiency analysis, savings evaluation, energy accounting, and environmental reporting capabilities.
Financial Incentives
Rebates are now seen primarily as a short term measure to help stimulate the market for energy saving products, which (as in North America) was a very useful precursor to legislation on minimum motor efficiency standards.
Rebates have been successfully applied to energy efficient motors, where they are typically set to equal the price premium of higher efficiency motors. Some money also needs to be given to the distributors to encourage them to stock such a range of motors. While giving rebates directly to the user is attractive, giving them to the manufacturers allows for a very useful “gearing” effect of the value of the rebate through the sales chain. Inevitably some EEMs will be purchased where the running hours are insufficient to give a good return on investment, but overall it is hoped that the scheme will give a good return, and in particular will stimulate interest in EEMs.
Rebates have also been given for VSDs, but this is a bit more involved. Most VSDs are sold for non-energy saving reasons, and so systems need to be put in place to give confidence that users are using them in approved applications only. It is likely that some form of assessment of the energy savings potential will need to be made, and if this involves proper power mon-itoring over a representative period (perhaps a few days), will involve the potential equip-ment supplier facing a lot of expense. Having received a detailed energy saving assessment, the company will then naturally seek several quotes to ensure best value for money, and so equipment suppliers may be reluctant to participate. Rebate schemes giving a reduction of perhaps 50% off the cost of a VSD are good for stimulating general awareness, but will still require similar levels of authorisation for funding, and so the increase in demand may not be huge. A key point relating to rebates for VSDs is that they will encourage users to focus on the price of VSDs, but the falling prices and resultant changes in the VSDs market means that instead users should be encouraged to look for the quality of service and technical support. The long term effect of rebates for VSDs needs to be clearly and carefully considered in order to ensure a sustainable change in the market [20].

66
Low interest or interest free loans are another tool used as an incentive to increase the mar-ket share of energy efficient equipment.
Capital allowance schemes are also in place which allow for the reduction of the tax paya-ble, as an incentive for investment in energy efficient equipment. A certain percentage of the capital asset’s cost is allowed as capital allowance during the accounting period in which it was purchased.
Several utilities and equipment suppliers have tried schemes in which equipment (usually VSDs) is paid for from the energy savings, effectively giving a no cost route to purchase. While this sort of scheme is apparently very simple, in practice many schemes have failed because of the difficulty in agreeing the exact terms of agreement. In particular, there may be disa-greement over the true level of energy savings due to changes in the pattern of use, or argu-ments over the appropriateness or accuracy of measurements. When in schemes such as this there is a very close focus on the actual energy savings made, so additional care must be taken to ensure that very reasonable estimates of energy savings are made, and it is sensible to slightly underestimate savings in order to help avoid later disputes.
other Financial tools
Bidding – Essentially an auction where electricity users bid the lowest price for rebates on electricity saving measures. Here motor users will be competing not only against each other for funds but also against other projects.
Penalties – Various forms of taxes on electricity bills to help improve the attractiveness of energy saving measures.

6767
6. motor sYstems enerGY Assessments
A Motor Systems Energy Assessment is an excellent starting point for understanding which motor systems offer the best opportunities for saving energy. It will:
• Identify some “quick wins”, low hanging fruit that requires little further investigation.• Identify some systems which with a short investigation within the motor systems assess-
ment can give sufficiently accurate information to make an investment proposal.• Identify some systems that would justify a more detailed Fan, Pump or Compressed Air
System Opportunities Assessment.
rememberLook, listen and ask questions. No question is too obvious!
6.1. motor systems energy Assessment
6.1.1. sector motor use Information
By looking at the results of previous studies of motor use in your type of plant, good clues can be given as to both where the big energy using motors are, and what the best opportunities are. This will greatly help in the next stage of the EMS audit.
6
•Instruments – are they believable?
•Energy use – what exactly is it measuring?
•Maintenance history – are there any hidden skeletons?
•Problem machines – what clues might operators unknowingly have?

Manual for Industrial Motor Systems Assessment and Optimization
68
6.1.2. select motor systems to consider
To reduce the time for the audit to something manageable, it is a good idea to just pick the largest rated 50-100 motors on your site, comprising perhaps 20 systems. This list should then be refined by calculating the actual annual energy use for each of these motors, which will also take account of both the running hours and percentage load:
Annual energy use = NamePlate Power (kW) x Running Hours pa x Load (%)
Where the load is not known, a default value of 67% is a useful average. (This actually understates energy use in that it ignores actual motor efficiency, but for this first screening is quite adequate).
Once the motor systems have been ranked by energy use, the energy conservation opportu-nities can be evaluated for each.
6.1.3. Prioritising your time
where not to look:
• Process equipment (Value of throughput too high and plant already fine tuned for the process)• Critical processes (Risk of unexpected problems unacceptable)• Small equipment (Energy use too small to justify detailed investigation or implementation)• Equipment scheduled for replacement (Financial payback unattractive)
where to look
• Big equipment• Long down times• Varying duties• Support equipment• Problem equipment
6.1.4. evaluate the opportunities
For each motor on the list, consider the following 5 Energy Saving Areas:
• Switch the motor off when it is not needed• Slow it down (control motor speed)• Reduce the motor losses (improve motor efficiency)• Reduce transmission losses• Reduce losses in the driven system
6.1.5. estimate the energy saving Potential
Make a very rough estimate of the energy savings and cost of implementing the identified opportunities.

69
detailed evaluation of energy saving Potential
Evaluated opportunities should be split into the following action categories:
• Some opportunities will be “quick fixes” which require little funding and give very good paybacks.
• Other opportunities will be uneconomic and should be immediately rejected.• Opportunities which have marginal economics may require further refinement, which will
include collecting more data.
6.1.6. motor Load control
The first item to check is whether the power or work supplied corresponds to the actual load requirements. The most cost-effective and rational measures are those aimed at preventing unnecessary running of the motor at no load. Therefore, a first set of questions concern the proper load matching, distinguishing between simple and trivial switch off measures and continuing with more targeted measures for controlling variable loads.
can it be switched off when it is not needed?
Compare the actual running time of the motor with the actual period of time for which it is doing useful work - for instance:
• Holidays• Weekends• Nights• Starts too soon before shift• Finishes too long after shift• Lunch and mid-morning/afternoon breaks
In these cases energy savings can be made by fitting time, proximity or load switches.
running continuously where loads are irregular
• Batch operations• Irregularly used services• Switch off one of a bank of machines
Where a motor runs irregularly, multiple machines or a smaller machine could be fitted to suit the load conditions.
Is there a varying demand?
Perhaps demand varies with throughput, outside temperature, product type, etc.?
The greater the time at lower flows, the better the economics.

Manual for Industrial Motor Systems Assessment and Optimization
70
Typical applications for VSD control:
• Water circulation pumps• Cooling tower fans• Extract fans• Boiler motor systems• Secondary refrigeration pumps• Variable volume ventilation fans
The potential savings from fitting VSDs will depend on the number of operating hours and duty cycle. A good example is when a pump motor load varies between 100% and 10% full load power and the time at lower loads is greater than 50%, and additionally if the pump operates for more than 5,000 hours each year. Full monitoring of potential energy saving and payback is recommended.
The use of VSDs often gives other benefits in terms of product quality, reduced maintenance, etc., and so a full evaluation of these savings may encourage the fitting of VSDs.
Other uses for VSDs include:
• Stirrers - can be good savings but very dependent on application.• Conveyors - some savings from reducing internal losses.• Air compressors.
∙ Screw compressors. Very marginal as retrofit, but could make good sense if bought with integral VSD.
∙ Centrifugal compressors. Leave alone. ∙ Reciprocating compressors. Possible, but significant spending may be not desirable on these older machines.
∙ Can the motor be slowed down or is the equipment just over-sized for the application?
Modern motors are designed for maximum efficiency at 75% full load and between 50-100% there is only a minimal variation in efficiency. However, a significant reduction in efficiency occurs at loads of 25% full load or less, and it is at this level that serious consideration should be given to fitting a smaller motor.
The Power-cubed rule that applies to centrifugal fans and pumps, in low head systems, means that if the speed can be reduced by just 20%, then energy savings of up to 50% can be made. These are therefore the applications to target at the initial screening stage. If the motor drive chain can be slowed down, important savings can be obtained.
Direct process plants such as conveyors, machine tools, and packaging units are usually optimised for production efficiency, and so there is usually little scope for speed control. Indeed, these are the applications where you are most likely to find speed controls already fitted. Installing and commissioning new equipment can cost expensive downtime and lead to temporary reject products while being commissioned,so it is really worth leaving these applications for later.

71
Is there occasionally a requirement for much more or much less flow?
The speed may be acceptable most of the time, but sometimes it could be much less (e.g. night-time extraction requirements) or much more (e.g. emergency faster extraction require-ments). Multi-speed machines might be appropriate.
reduce the motor losses (efficient electric motors)
It is unusual to know the efficiencies of the motors on site, especially if there are many different brands as is often the case with OEM equipment. Before finding efficiency infor-mation, it is suggested that consideration be given to leaving the use of Higher Efficiency Motors (HEMs) and Motor Replace/Repair as a single site-wide policy action. Since most measures can only be implemented when a motor needs replacing anyway, this realistic approach greatly reduces the initial audit time without missing out on significant economic energy saving measures.
Sizing is generally of lesser practical importance, and “off-the-shelf’ units such as compres-sors, fans and many pumps are unlikely to be grossly over-sized. It is custom designed instal-lations where excess safety margins are most likely to lead to over-sized motors.
coupling and transmission Losses
If the motor is not direct-coupled, review the type of transmission and how well it is main-tained. Drive belts and gearboxes are the main source of efficiency loss.
6.1.7. driven equipment & systems
For each motor, consider the efficiency of the equipment and system that it is driving. For anything more than the simplest opportunities, it is just sufficient to identify the simple and obvious opportunities, more advanced options will need a specialist, perhaps as part of a Fan, Pump or Compressed Air system audit.

72
7373
7. tAkInG meAsurements
Taking measurements takes time and so costs money. Some energy saving opportunities are so obvious that there is little point in obtaining any actual energy consumption data. How-ever, if you do need more data to gain more certainty on a possible measure or to put forward a more convincing business case, then there are various options available.
Field measurements can be an invaluable source of information for better decision making when optimising your motor system. The energy savings achieved are dependent on a num-ber of factors, such as:
• motor size; • annual hours of use; • load factor;• efficiency gain (at the load point).
Field measurements are necessary to establish the load imposed upon an existing motor by its driven equipment and then to determine motor efficiency at its load point.
In a three-phase power system it is necessary to measure the following in each motor:
• phase-to-phase voltage between all three phases; • current values for all three phases; • power factor in all three phases, and • operating speed of motor and driven load.
Equipment necessary for these measurements includes:
• Three-phase power analyser (ideally), with a set of probes covering different current ranges (e.g. 20A, 200A and 1000A);
• voltmeter or multimeter; • clamp-on ammeter; • power factor meter; • tachometer.
7

Manual for Industrial Motor Systems Assessment and Optimization
74
Fig. 51.
L1 L2 L3
L3L2L1
Three-phase power analyser, with current clamps and voltage probes on the right
Meters should be of adequate quality to read true RMS values.
A modern three-phase power analyser can, simultaneously, take readings of voltage, current, power, power factor, energy, har-monics, frequency and transients, and also have logging capabilities which allow for the recording of parameters over time. (Fig. 51).
Speed measurements are critical as speed may change with frequency, load and belt slip. A simple tachometer is a contact type instrument which can be used where direct access is possible. More sophisticated and safer ones are non-contact instruments such as stroboscopes. (Fig. 52).
Furthermore, measurements can help to determine process load requirements – flow, pressure, temperature, speed, etc.
Measurements can also help to identify problems with the quality of the power sup-ply such as:
• Voltage and current unbalance; • Low power factor;• Harmonics.
Fig. 52.
a) b)Contact tachometer (a) and stroboscopic tachometer (b)

75
7.1. Voltage unbalanceIdeally, the voltages that you measure in each phase of a three-phase system should be the same. This is also true for current measurements.
Voltage unbalance (VU) is given by:
%VU =max. voltage deviation from the avg. voltage
× 100avg. voltage
Voltage unbalance can cause voltage notching and excessive current flow in one or more phases going to the motor, which can cause tripping of the motor drive’s current overload fault pro-tection, leading to unnecessary downtime. Voltage unbalance also reduces motor efficiency.
7.1.1. Low Power Factor
Low power factor reduces the efficiency of the electrical distribution system both within and outside of your facility. Low power factor results when induction motors are operated at less than full load.
7.2. HarmonicsThe 50 or 60Hz frequency of the voltage supplied by the utility is called the fundamental frequency. Some electrical loads (such as computers, controls, VSDs, lighting) can cause other frequencies to appear in your measurements. These other frequencies, which are multiples of the fundamental (so 120Hz, 180Hz, and so on for a 60Hz fundamental fre-quency), are called harmonics.
The power at the service entrance of your facility will usually be low in harmonic frequencies. Inside your facility, however, harmonics may be high if there are a lot of harmonic-generating devices in the facility.
Although motor drives can be affected by harmonics, they are often the source of harmonics that affect other devices in the facility. If you detect significant levels of harmonics in your drive measurements, you may need to consider adding filtering to block those harmonics.
7.3. Load estimation techniquesTo accurately estimate the savings of replacing an existing motor with a more efficient one, you first need to know the actual load of the existing motor.
Motor part-loads may be estimated through using input power, amperage, or speed meas-urements. The input power method gives the most reliable results and is preferred.

Manual for Industrial Motor Systems Assessment and Optimization
76
a) Input power method
With measured input power taken from hand-held instruments, and information from the motor nameplate (efficiency and rated power), it is possible to calculate the three-phase input power to the loaded motor and the motor load by using the following equations. The accuracy of the method drops when the load is below 40% since efficiency sharply drops below that value.
Pinput
=P
n
η
Load (%) =P
measured × 100P
input
Where,
Pinput
– is the nominal input electrical power at full load
Pn – is the mechanical nominal power (rated
on the nameplate)
Pmeasured
– is the measured input power
For further information, see Chapter 5 Motor Load and Efficiency Estimation Techniques, continuous energy Improvement in motor-driven systems – A Guidebook for Industry, United States DOE, Feb. 2014.
eXAmPLe:
name plate data: measured data:Rated kW of Motor = 30 kW Measured speed = 1460 rpm
Rated Amps = 55 A Input load current = 33 A
Rated voltage = 400 V Operating voltage = 415 V
Name plate efficiency = 92% Input power = 20 kW
Name plate speed = 1440 rpm
a) Input power method
Pinput
= 30/0,92 = 32,6 kW
Load = 20 /32,6 x 100= 61%

77
7.4. safety considerationsThe following text is for general guidance only. You should only take measurements if you are competent to do so.
• Do not use handheld instruments above 600V.• Use line workers gloves.• Keep left hand out of the way when attach-
ing probes.• Tie back loose hair or clothing.• Beware of the unconnected ends of current
transducers when connecting to a separate display device.
• Where possible, connect leads when the power is off.
• Periodically check that the leads and con-nectors are in good condition. If in doubt, throw them out.
• Use leads rated for the voltage.
7.5. sensitivity of motor Load to operating speed
Motor and driven-equipment speeds must be measured as closely as possible, ideally with a strobe tachometer. Motor speed is impor-tant because a replacement motor should duplicate the existing motor speed.
For centrifugal loads such as fans or pumps, even a small change in a motor’s full-load speed translates into a significant change in load and annual energy consumption. Fan or “affinity” laws indicate that the load-ing imposed on a motor by centrifugal load varies with the cube of its rotational speed. When considering motor changes, it is useful to measure the speed.
Most energy-efficient motors tend to oper-ate with reduced “slip”, meaning that they work with a slightly higher speed than their standard-efficiency equivalents. This small difference - an average of only 5 to 10RPM for 1500-RPM synchronous speed motors - is significant. Just a small 20 RPM increase in a motor’s full-load rotational speed from 1240 to 1260 RPM can result in a 3.5% increase in the load placed upon the motor by the rotat-ing equipment. A 40 RPM increase can boost energy consumption by
7%, completely offsetting the energy savings typically expected from the purchase of an energy efficient motor. However, the greater speed means that the work is being done at a faster rate, and so providing that it is prop-erly controlled, the expected energy savings will still appear.
Fig. 53. SYNCHRONOUS SPEED (%)
TORQ
UE
STANDARD MOTOR
CENTRIFUGAL FAN
100%
HIGHEFFICIENCY
MOTOR
Standard and high efficiency motor torque speed-curves

78

7979
8. enerGY And mAIntenAnce
8.1. benefits of better maintenanceThe primary purpose of maintenance is to keep equipment running at optimum performance and, at the same time, to avoid premature failure.
A well maintained motor system will also bring energy benefits, such as:
• Use less energy;• Be more reliable, and so reduce the energy and production costs of unplanned downtime;• Give the option of extending an existing maintenance programme and related systems to
identifying and maintaining energy efficiency options.
8.2. motor maintenance techniquesPreventive maintenance is the traditional form of maintenance but, recently, predictive main-tenance has received increasing attention.
Preventive maintenance (also called planned maintenance or planned preventive mainte-nance) is driven by time, meter or event based triggering. Maintenance tasks that are under-taken during PMs are pre-determined based on a number of factors including experience, age, manufacturer’s recommendations, etc. It is assumed that a machine component will degrade within a time period that is common for its type. Under a preventive management approach, the relevant parts will be removed, replaced or rebuilt on or before the expected failure point. For example, the engine oil in your car is proactively replaced at 10,000 miles.
Predictive maintenance is determined by the condition of equipment rather than average or expected life statistics. Essentially, this methodology tries to predict the failure before it actually happens by directly monitoring the machine during normal operating conditions. In the car example above, rather than replacing the oil every 10,000 miles, using the predictive maintenance methodology, oil samples are taken at regular intervals and the oil is replaced when it degrades beyond a certain point.
8

Manual for Industrial Motor Systems Assessment and Optimization
80
A comprehensive maintenance programme contains elements of both predictive and preventive maintenance (PPM). Both involve scheduled actions to the motors and con-trols, as well as record keeping.
The most important items to check on a motor maintenance programme are:
• dirt and corrosionDirty motors run hot - Heat reduces insu-lation life and eventually causes motor failure. Serious corrosion may indicate internal deterioration and/or a need for external repainting.
• LubricationObserve the bearings’ lubrication sched-ule. Improper lubrication shortens bearing life in many ways. Additionally, operating environment has a significant effect on lubrication requirements.
• mountings, couplings, and AlignmentIncorrect mounting can lead to decreased efficiency and reduced service life. Correct shaft alignment ensures the effi-cient transmission of power from the motor to the driven equipment.
Fig. 54.
a)
b)
Parallel misalignment (a) and angular misalignment (b)
(source: <www.flowcontrolnetwork.com/>)
Fig. 55. Modern laser alignment equipment (directindustry.com)
• transmissionCheck for drive belt wear, and replace pul-leys if needed. Check for belt tension using a tension meter and belt wear using simple profile gauges. Maintain a gear lubrication schedule.
• Heat, noise and vibrationExcessive heat is both a cause of motor failure and a sign of other motor problems. A change in noise or vibration can signal bearing problems, shaft misalignments, bent shaft, load imbalance.
Written records indicating date, items inspected, service performed and motor condition are important to an effective rou-tine maintenance programme. From such records, specific problems in each applica-tion can be identified and solved routinely to avoid breakdowns and production losses. Additionally, maintenance records can be used to collect information relevant to the energy management of motor systems.
Thermal testing and trending of temperature data, along with vibration analysis are exam-ples of predictive maintenance techniques.
The following (free) commercial guides are highly recommended for the information

81
that they provide, but UNIDO cannot recom-mend specific brands of equipment.
Thermal Imaging Thermal imaging guidebook for industrial applications, FLIR, 2011<http://www.flirmedia.com/MMC/THG/Brochures/T820264/T820264_EN.pdf>
Vibration Analysis Making Maintenance Matter - Optimising plant availability using laser shaft align-ment, vibration analysis and dynamic bal-ancing techniques, Pruftechnik, 2002<http://www.pruftechnik.com/fileadmin/pt/Downloads/Brochures-Flyers_SPECIAL/Engineers_Guide_ALI_CM/EngineersGuide2012.pdf> Fig. 56. Thermal imaging
8.3. maintenance decisions matter: An Alternative Approach to stimulating energy savings
From an overall business perspective, the productivity benefits of improved maintenance, including avoidance of the sometimes huge costs of unplanned plant failure, make it a higher management priority than energy efficiency. As a result, industry is much more likely to spend money on maintenance than on energy saving activities.
8.3.1. why maintenance?
Finman & Laitner (2001) analysed 77 published case studies on energy efficiency, from which they identified 5 common non-energy saving benefits:
• Reductions in waste; • Reductions in emissions; • Reductions in maintenance and operating costs; • Improvements in productivity and quality; • Improvements in the working environment.
Other, such as from saving space, reducing capital expenditure, improved public image, and improved worker morale.
Of the 52 case studies that attempted to put monetary values to these gains, the average payback fell from 4.2 years on energy savings alone, to just 1.9 years when all savings were taken account of. Although the high energy-only payback is distorted by the many case stud-ies demonstrating newer and innovative technologies, the general result remains valid. A further paper (Laitner et al., 2001) shows the results of ascribing monetary values to the non-energy saving benefits of possible energy saving actions in the US iron and steel sector.

Manual for Industrial Motor Systems Assessment and Optimization
82
This showed that for the same payback criteria, taking account of the non-energy benefits doubled the savings that could economically be made. This is equivalent to additional energy savings of 1.9 GJ/tonne of steel produced, or 170 PJ (1.6 x 10¹⁴ Btu) of potential savings across the whole sector.
An analysis of UK studies also shows that in many cases it was actually these non- energy benefits that were the critical factor behind the decision to consider the project in the first place. This finding was one of the principal reasons behind the idea to try to implement an initiative that, instead of just promoting energy efficiency, would instead use the non-energy saving benefit of maintenance as the primary proposition, knowing that energy saving would follow through the back door.
8.3.2. examples of maintenance Issues Affecting the Implementation of energy efficiency measures
There is much evidence from ongoing energy efficiency work to support the idea that an interest in maintenance is behind the adoption of energy saving practices, with the following selected to show the diversity of the ways in which this occurs:
The European Copper Institute’s long running UK campaign to encourage greater cable sizing to reduce power losses had been disappointing, but when the same measure was expressed as a way of reducing the incidence of plant failure through improving power quality, it became very successful, as it was now something of great and immediate interest to lots of companies.
While the economic argument for higher efficiency motors in the UK is good, it hasn’t been convincing enough to see a big change in the market. However, promoting best practice to take account of what to do when a motor fails is of greater interest. It is therefore much more likely to lead to management attention being given to the running costs of motors and the importance of efficiency.
Many consultants have noted that having a site maintenance engineer accompany a consult-ant during a site energy savings opportunities assessment can give a much deeper insight into the true state of plant operation than anyone else. For example, a compressed air system that always gives enough air at the right pressure and adequate quality would be regarded as no trouble by the Production Department, but it’s the Maintenance Department staff who will point out the need for more and more compressors or excessive maintenance effort needed to provide this service. More generally, pausing to stop and ask questions of everybody in a plant with an interest in a particular system, in particular any problems that it causes, can also help to identify all sorts of discrepancies in people’s understanding of the requirements and performance of systems, and so can give an excellent clue as to energy saving solutions.
One of the key drivers behind the Europump/Hydraulic Institute Guide to Life Cycle Costing (LCC) of pumping systems was the realisation that energy savings alone were insufficient to make many people improve the design and maintenance of pumping systems. The basis of the Life Cycle Costing Guide was that all directly attributable costs over the lifetime of an item of plant, such as purchase, maintenance, energy, spares, disposal, etc. should be accounted for when designing a system. The success of this wider approach suggests that thinking beyond just energy saving is more likely to stimulate action. Interestingly, when ana-

83
lysing the impact of the work, it became clear that the rigorous engineering analysis needed to do a proper LCC calculation was too often being ignored either because of time pressures or simply a lack of skills. We have seen this as a further stimulus to better educate person-nel in maintenance and energy and their related costs, since these are usually the biggest unknowns in an LCC calculation.
table 9. The Link Between Energy and Maintenance Savings
Practice result
motors
Rewinding A good quality rewind will reduce efficiency by only 0.5 – 2.0%
LubricationOver-lubrication can cause premature bearing failure and efficiency loss of up to 1%
Shaft Alignment Incorrect shaft alignment costs about $8/kW per degree of misalignment
Belt adjustment Belt drive efficiency deteriorates by 10-15% without regular adjustment
compressed Air systems
Fixing leaks
Typically reduces costs by 15-20% if controls are adjusted to accommodate the reduced volume required. Network zoning, removal of redundant spurs, and maintenance of connector & cylinder seals all reduce leakage
Condensate drain traps
Electronic condensate drain traps are much more reliable, wasting less air than mechanical or manual traps
Servicing Regular servicing maintains performance and efficiency
Pumping systems
Impeller maintenance
Maintaining impellers and coating pumps maintains efficiency. Pump condition monitoring equipment identifies the proper timing for pump refurbishment
Speed control Variable speed control reduces wear on the pump, bearings, and seals
Variable speed drives (VSDs)
ASDs can alleviate water hammer and its effects, and can prevent cavitation in certain circumstances
ValvesJammed non-return valves waste lots of energy in parallel pumping systems
Fixing leaks Reduces water consumption as well as reducing energy consumption
Fan systems
Filter cleaning Dirty filters produce unnecessary pressure drop
Duct cleaning Dirty ducts create excessive friction, producing unnecessary pressure drop
Blade maintenance Worn and dirty fan blades reduce efficiency
Dampers Worn or inoperable dampers increase energy consumption
steam systems
Boiler maintenance A poorly maintained boiler loses 5-10% efficiency
Oxygen control systems & ASDs on combustion air fans
Reduces the need to regularly monitor and adjust burner controls, thus saving fuel, reducing emissions, and reducing fan power consumption
Fixing leaks Leaks and faulty steam traps waste energy
Pipe insulation Maintaining the integrity of pipe insulation minimizes steam heat loss
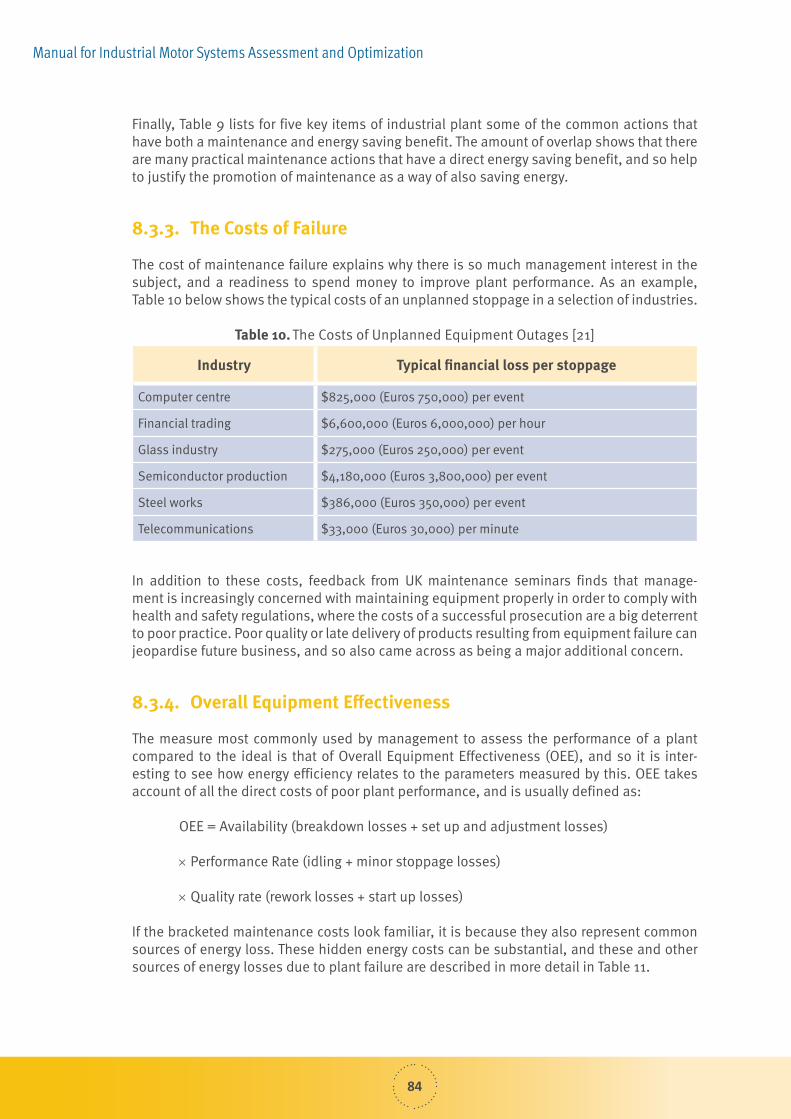
Manual for Industrial Motor Systems Assessment and Optimization
84
Finally, Table 9 lists for five key items of industrial plant some of the common actions that have both a maintenance and energy saving benefit. The amount of overlap shows that there are many practical maintenance actions that have a direct energy saving benefit, and so help to justify the promotion of maintenance as a way of also saving energy.
8.3.3. the costs of Failure
The cost of maintenance failure explains why there is so much management interest in the subject, and a readiness to spend money to improve plant performance. As an example, Table 10 below shows the typical costs of an unplanned stoppage in a selection of industries.
table 10. The Costs of Unplanned Equipment Outages [21]
Industry typical financial loss per stoppage
Computer centre $825,000 (Euros 750,000) per event
Financial trading $6,600,000 (Euros 6,000,000) per hour
Glass industry $275,000 (Euros 250,000) per event
Semiconductor production $4,180,000 (Euros 3,800,000) per event
Steel works $386,000 (Euros 350,000) per event
Telecommunications $33,000 (Euros 30,000) per minute
In addition to these costs, feedback from UK maintenance seminars finds that manage-ment is increasingly concerned with maintaining equipment properly in order to comply with health and safety regulations, where the costs of a successful prosecution are a big deterrent to poor practice. Poor quality or late delivery of products resulting from equipment failure can jeopardise future business, and so also came across as being a major additional concern.
8.3.4. overall equipment effectiveness
The measure most commonly used by management to assess the performance of a plant compared to the ideal is that of Overall Equipment Effectiveness (OEE), and so it is inter-esting to see how energy efficiency relates to the parameters measured by this. OEE takes account of all the direct costs of poor plant performance, and is usually defined as:
OEE = Availability (breakdown losses + set up and adjustment losses)
× Performance Rate (idling + minor stoppage losses)
× Quality rate (rework losses + start up losses)
If the bracketed maintenance costs look familiar, it is because they also represent common sources of energy loss. These hidden energy costs can be substantial, and these and other sources of energy losses due to plant failure are described in more detail in Table 11.

85
table 11. The Energy Costs of Plant Failure
effect of unplanned breakdown related energy cost
Temporary reduction of output during breakdowns
Core or background energy needed to maintain essential services is spread across less output, and so the specific energy consumption rises.
Start up lossesA lot of energy is lost during the warm up time of high temperature processes.
Alternative methods for re-gaining production used
Less efficient methods of production may be used, perhaps using older equipment or involving additional transport costs.
Loss of product during warm up time
Some processes have to produce scrapped product while they are “warming up”.
Energy used in part processing the product is lost
Much energy may have been expended in getting a product to near the end of a production process, and this energy will be wasted.
Disposal of damaged productThere may be energy costs involved n the physical disposal of scrap product.
Emergency repairs made to re-start plant ASAP
Maintenance staff will do what ever is quickest to get the plant running, with speed taking priority over getting the optimum quality repair or looking for the most efficient spare part or replacement kit.
Rework costs Additional energy used in re-working spoiled product.
Time lost for less urgent work Time that could have been spent on energy saving work is lost
Table 12 gives a simple breakdown of the causes of plant breakdown, and the remedies to eliminate the causes. Again, the direct energy efficiency benefits of better maintenance in the top 85% of causes are apparent.
table 12. How Plant Breakdowns Can Be Eliminated [22]
Percentage of breakdowns / stoppages How they can be eliminated
> 40%Refurbishment and hence restoration of equipment to its standard conditions
> 20%Application of daily asset care checks and best practice routines of operation
> 25%By application of regular and relevant condition monitoring and planned maintenance
> 15% By designing out physical weaknesses in the equipment

Manual for Industrial Motor Systems Assessment and Optimization
86
8.3.5. How maintenance best Practice can Help overcome non-economic barriers to energy efficiency
So far it is just the clear links between energy efficiency and maintenance that have been shown. But in addition to the commonality of technical measures, there are other aspects of maintenance best practice that help to overcome some of the common non-economic barri-ers to energy saving projects being implemented:
Gaining the support of others who might benefit from a Project
Talking to other staff, such as maintenance and production personnel, who are also familiar with the item of plant, is a very good way of identifying other benefits. But in addition, by making them feel involved and being able to identify what is in it for them personally, they are more likely to support the proposal.
Integrating energy saving Actions with Planned maintenance shutdowns
On equipment that runs for weeks or months between scheduled stoppages, the cost in lost production means that shutting down a plant to fit and commission energy saving equipment can only be done if planned ahead as part of a scheduled shutdown.
Integrating regular maintenance and energy saving databases
A list of all key equipment should be at the heart of a maintenance management programme, and is an excellent basis for an energy management programme.
Integrating routine maintenance and energy savings checks
Routine checks on equipment such as checking for leaks, monitoring temperatures/pres-sures, etc. are core elements of both maintenance and energy saving campaigns. The impli-cation is that the person doing these should be aware of both the reasons for undertaking them, and where appropriate, modify the details of the work to maximise all energy saving and maintenance benefits.
reviewing site service demands
Expansion or contraction of plant output can quickly lead to a mismatch between the provi-sion of site services and the actual demand, and is a common cause of inefficiency. A better match minimises the costs of maintenance both through better use of the existing plant, and through the avoided costs of maintenance on plant to supply capacity that is no longer needed. The periodic re-appraisal of what site services are actually needed should therefore be part of maintenance and energy saving best practice.
design for maintenance
Designing equipment so that it can be easily maintained, or not need maintaining at all, can reduce energy consumption.

87
A way of working
An organisation that has a right approach towards maintenance, both by having a mainte-nance management system that works, and by having the right employee attitude, is in a much better position to implement a successful energy saving campaign.
better maintenance Is Free
Analysis of case studies from the 2002 UK Maintech conference (Maintech 2002) shows that in all five of the detailed examples cited, in addition to reaping the benefits of better mainte-nance, overall maintenance costs actually went down. This is because the additional expend-iture on better monitoring and preventative maintenance was more than compensated for by the reduction in expensive fire-fighting maintenance. With so many companies looking to further squeeze maintenance budgets, the idea that you can do better with less expenditure is a very attractive promotional idea. The overall operational benefits from these studies are summarised below:
summary of savings Achieved in Practice from Improved maintenance Practices
Lever Faberge increased production capacity by $2.4 million/year (£1.5 million) via an increase of OEE of 110%, while reducing maintenance costs by 31%.
British Aerospace increased OEE on machinery from 26% to 65%, improved quality by 10%, reduced downtime by 10% and halved spares costs in another area.
Blue Circle Cement reduced breakdowns by 67% and saved almost 20% on their mainte-nance budget.
Imperial Chemical Industries (ICI) reduced maintenance expenditure by 20% while increas-ing throughput, leading to a reduction of maintenance costs/tonne of product of 30%.
Unilever achieved a 30% improvement in productivity whilst reducing maintenance costs by 30% and also substantially reducing defects.

88

8989
9. motor rePAIr
9.1. best Practice motor repairRepairing an induction motor will typically lose 0.5-2.0% of efficiency, and you will miss the opportunity to upgrade to a new, more efficient motor.
A first action is to always use a quality motor repairer that adheres to international best prac-tice. This is described in the Good Practice Guide section of the following publication:
9.1.1. the effect of repair/rewinding on motor efficiency (eAsA/Aemt)
9
Management and Energy Managers. Execu-tive Summary (pp.1-3)
Maintenance personnel and motor repairers. Good Practice Guide (pp.2-3)
When motors fail, there is also the opportu-nity to change to a more efficient motor, so gaining additional energy savings. But the economics of this are highly site and motor dependent, and so a Motor Management Policy is suggested so that it is easy to make the best decision and that maintenance per-sonnel are authorised to sometimes spend more up front in order to yield longer term energy savings.

Manual for Industrial Motor Systems Assessment and Optimization
90
9.1.2. considerations when fitting a new motor
There are many practical considerations to take account of when considering swapping to a new motor:
• Mounting hole positions and size• Length of motor• Starting current• Slip (and hence running speed)• Shaft height• Shaft diameter
9.1.3. Improving an old motor
A good repairer, and informed user, can alter the stator windings slightly to give, for example, better efficiency or a slightly higher starting torque. However, this depends on having a detailed understanding of the load, and should only be contemplated by expe-rienced personnel.
9.2. A motor Procurement Policy templateIdeally an organisation should have a simple procurement policy that is understood by all. It will comprise some guidelines like the example below:
Our Motor Procurement Policy
Below ___ kW we replace the motor
Above ___ kW we repair the motor, unless it has been rewound twice.
Between ___ kW and ___ kW we may repair or replace the motor, depending on the duty.
The simpler it is, the better. Some flexibility is needed, but not such that it is easy for person-nel to just override the policy whenever convenient!
Some suppliers suggest decision charts such as that below (ABB), but you should always be sure that the chart reflects your particular circumstances.

91
Replace with IE3 motor (or higher – IE4, IE5)
Motor Fails
Send for repair
Metric or imperial?
Cost to replace
Imperial
Metriclow high
no
no
no
no
yes
yes
yes
yes
As it been rewound before?
Does it run long periods?
Power less than 18.5kW?
Is it a IE3 motor?
Further information on the replace: repair decision is in this White Paper by ECI.3
3 <http://www.leonardo-energy.org/sites/leonardo-energy/files/documents-and-links/cu0104_an_whitepaper-motorreplacement_v3.pdf>
Identifying a quality repair shop is difficult, but the following are some indicators to take account of:
• What motors can they rewind?• What wire gauges do they have in stock? • If limited, there may be compromises on
stator resistance or number of turns.• Is there a controlled burn-out oven? And
what other techniques do they use for winding removal?
• How experienced are the employees?• What training do the employees receive?• Is there a core tester to check for core
damage?

92

9393
10. seLLInG It – How to wIn APProVAL For Your IdeA
Because Energy Efficiency is perceived by some as discretionary, less important because of its low value and technically risky, it sometimes has a low place on the management priority list.
Therefore, just identifying a good technical opportunity and preparing a good financial case isn’t enough to make it happen.
Some common objections are:
we are not convinced because…
…the problem is not clear.
…we don’t understand your solution.
…there is no evidence it would work.
…we disagree with your assumptions.
we like the project, but…
…installing it sounds like it would be disruptive.
…we are not sure how long we are going to retain this building/process/equipment.
…the workforce would not accept it.
…we do not have any money available to fund the project.
…the necessary staff resources are needed for other work.
…one of us has got a better idea.
…why haven’t you done anything about this issue before?
10

Manual for Industrial Motor Systems Assessment and Optimization
94
How can you overcome these problems?
The following is essential reading for everyone involved in obtaining funding for energy efficiency4:
who do you need to influence?
Whoever you are pitching to, think carefully about what their considerations will be, what their motivations are, and the format that they want information in.
Can you engage them in the process early to aid their understanding and secure their support?
Often you will need support from other colleagues impacted by your projects, and so take care to also consult them with the same level of detail.
building your case
The developed business case must present clear objectives, not only financial but, if possi-ble, worthwhile additional benefits:
• Monetised specific savings goals.• Lower maintenance.• Improved production processes.• Improved environmental performance.• Enhanced corporate reputation.
4 <https://www.carbontrust.com/resources/guides/carbon-footprinting-and-reporting/making-the-business-case-for-a-carbon-reduction-project>

95
These objectives must be supported by an appropriate analysis of the costs, benefits, and risks, and accompanied by an implementation timetable. Savings estimates made by third-parties (e.g. equipment suppliers) should be verified. Presenting optimistic savings in the first place can yield disappointing results and impair your credibility to implement future projects.
A thorough risk analysis should be carried out and all the risks and downsides to the project should be part of the business case, as well as the strategies to control or mitigate those risks.
Identifying supporters
Identifying somebody who can support your work is invaluable to help smooth the way for winning funding.
They will not only help you portray your project in the best light, but will also bring an under-standing of the wider business issues that you may be able to relate to. They can also support you by sounding out other interested parties that need to be consulted and reassured.
Your credibility
Putting forward a case for investment or change is always much easier if you have become known for promoting sensible and effective ideas for saving money, energy or carbon. This is one reason for portraying ‘making a business case’ as a continuous process rather than a discrete event. Ultimately, senior management should be asking you for ideas, rather than you having to pitch to them.
Strategically it is sensible to pick some “easy winners” which give good savings for little invest-ment or effort. The next step is to publicise the success, quantifying it as much as possible.
It will take time to build a reputation, but just one failure can set your reputation back a long way, so always follow these rules:
• Evaluate projects diligently – be convinced before advocating them.• Never make exaggerated claims.• Try to leave yourself headroom to deliver more than you promised.• When you get approval for something, implement it without delay and do everything you
can to ensure its success.• Keep up with the news – become an authority on the subject.• Make sure people know what you have achieved, and keep it all on record.

96

9797
11. enerGY mAnAGement sYstem
Energy management is a culture for the continual improvement of energy performance and efficiency that is integrated within an organisation’s normal business practice. It positions an organisation to achieve energy and cost savings through informed deci-sion making and the implementation of energy saving practices for facilities, processes, equipment and operations [23].
A successful ongoing programme of identifying and implementing successful motor energy saving opportunities relies on an organisation having proper systems in place.
Without these systems, there will be no framework for management to easily approve investments, or for implementing and reviewing their actual performance.
If the systems are incomplete or weak, you need to identify these problems and take action as far as you can to ensure that your measures don’t fail because of these systemic problems.
If you are in a position to influence the development of a formal energy management sys-tem (EnMS), then consider attending a formal course on this.
The benefits of energy management include:
• Improved profits• Reduced energy costs• Improved processes• Reduced emissions• Reduced risk to energy price fluctuations
Additional benefits of Energy Management:
• Might help management meet legal obligations• Green credentials can give competitive advantage• Improved working conditions and productivity
11

Manual for Industrial Motor Systems Assessment and Optimization
98
11.1. energy management is not a single project, it is an on-going programme and way of doing things.
The growing importance of improving energy performance in industry has led to the develop-ment of a standard for the implementation of Energy Management Systems (ISO 50001:2011, Energy management systems – Requirements with guidance for use [24]).
ISO 50001:2011 offers a framework for organisations to [25]:
• Establish an energy policy; • Allocate resources and create teams to effectively implement an energy management system; • Conduct energy reviews; • Identify opportunities for improving energy performance; • Establish baselines and energy performance indicators for tracking progress; • Set energy performance improvement targets; and • Implement action plans to achieve those targets.
ISO 50001 is based on the ISO management system model familiar to more than a million organisations worldwide that implement standards such as ISO 9001 (quality management), ISO 14001 (environmental management), ISO 22000 (food safety) and ISO/IEC 27001 (infor-mation security). In particular, ISO 50001 follows the Plan-Do-Check-Act process for continual improvement of the energy management system.
The approach can be briefly described as follows.
► Plan: conduct the energy review and establish the baseline, energy performance indica-tors (EnPIs), objectives, targets and action plans necessary to deliver results in accordance with opportunities to improve energy performance and the organisation’s energy policy.
► Do: implement the energy management action plans.
► Check: monitor and measure processes and the key characteristics of its operations that deter-mine energy performance against the energy policy and objectives and report the results.
► Act: take actions to continually improve energy performance and the EnMS.
And, as summarised in the following process chart shown in Figure 57, from ISO 50001.
Within energy management, according to ISO 50001, the following points are particularly relevant for motor systems. Motor systems aspects can easily be integrated and are already discussed in this manual (maintenance, motor selection, VSD). In fact, motor systems con-stitute a logical starting point for initiating an energy management programme as it includes:
• Establishing and setting criteria for the effective operation and maintenance of signifi-cant energy uses, where their absence could lead to a significant deviation from effective energy performance.

99
• The organisation shall consider energy performance improvement opportunities and operational control in the design of new, modified and renovated facilities, equipment, systems and processes that can have a significant impact on its energy performance.
• The organisation shall establish and implement the criteria for assessing energy use, con-sumption and efficiency over the planned or expected operating lifetime when procuring energy using products, equipment and services which are expected to have a significant impact on the organisation’s energy performance.
• The organisation shall define and document energy purchasing specifications, as appli-cable, for effective energy use.
• maintaining records of corrective actions and preventive actions.
Fig. 57.
Energy policy
Internal audit of the EnMS
CheckingMonitoring,
measurement and analysis
Non-conformities, correction, corrective and
preventive action
Energy planning
Implementation and operation
Management review
Continual improvement
EnMS model for ISO 50001

100

101101
12. cAse studIes
Efficient motor systems can make a significant contribution to the reduction of energy use in industry, with motor systems consuming in most sectors more than 75% of a plant’s elec-tricity. Often, improving the efficiency of a motor-driven system, be it a pump system, a com-pressed-air system, a mechanical movement system, will uncover solutions to a number of production and maintenance problems. Typically, motor system optimization energy assess-ments lead to projects and practical implementation of optimization measures. In the indus-try, there is reluctance towards implementing any measures until the technology is proven to produce concrete and measurable results. Consequently, it is extremely important to present the success stories and the lessons learned in an informative manner so that it can be dis-seminated to the industry.
Case studies help to impart significant knowledge about a specific type of technology, pro-cess, best practices, implementation cost information and important lessons learned by oth-ers who may have successfully implemented motor systems optimization at their plants and facilities. Furthermore, case studies can be used to prove to management that the quanti-fied energy and cost savings in the motor system optimization report are achievable and as demonstrated in other similar (or different) industry sectors.
This section contains a few selected case studies that were developed as result of motor systems optimization assessments conducted within the scope UNIDO’s industrial energy efficiency projects.
12.1. case study #1 beshay steel company This case study reviews the optimization of a cooling tower fan motor system within a large industrial plant in the Iron and Steel sector. The study revealed that for the cooling tower fan motors, 910,000 kWh (equivalent to EGP 510,000 and 0.15% of the total plant electricity con-sumption) could be saved per annum through no/low cost optimization measures. The motor system optimization assessment was carried out as part of a project implemented by UNIDO in partnership with the Egyptian Environmental Affairs Agency, the Ministry of Industry, Trade and SMEs and the Federation of Egyptian Industries; with the financial support for the Global Environment Facility.
12

Manual for Industrial Motor Systems Assessment and Optimization
102
12.1.1. company and Plant background
Beshay Steel group is one of the largest steel producers in Egypt and the Middle East. The group employs more than 4,000 personnel. Beshay has a production facility comprised of steel melting shop and two rolling mills plants. The annual production capacity of the melting shop is 1,040,000 Tons /year of billets. The majority of the production meets the demands of the local market and the balance is exported to the Middle East, Europe and Asia.
Global steel production and pricing have put pressure on Egyptian steel companies to improve the performance of operations in order to remain competitive. One of the strategies adopted was to implement an energy managements system in order to reduce operational costs related to energy consumption. This has been exacerbated by the increase in local elec-tricity prices. Beshay implemented an energy management system and identified area of sig-nificant energy use. The MSO project has been an extension of this EnMS work where Beshay have identified motors as the largest consumer of electrical energy at the plant.
Beshay chose the cooling tower fans of the Water Treatment Plant (WTP) as the motor systems for assessment and optimization. The cooling tower is composed of 18 fans set out in 6 sec-tions of 3 fans each. This simplifies the study as only one or two fans need to be assessed, with the results being replicated across the other fans. Beshay was also experiencing reliability problems with these fans as some of them had failed after only nine months in service. Apart from the energy saving, Beshay was also keen on improving reliability and reducing mainte-nance and replacement costs. Eight fans are driven by 30 kW and ten by 37 kW motors. The total fan motor systems energy consumption represents 21% of the total WTP energy consumption.
12.1.2. optimization strategies
Following the MSO methodology the mechanical load of the fans were studied in detail. The heat capacity of the cooling tower is 10°C cooling water from 45°C to 35°C.
During certain times the full 10°C of cooling is not required. Optimization strategies were developed based on this varying production requirement and also by assessing the method of power transmission along the motor system.
The optimization measures identified ranged from no/low cost measures such as blade angle adjustment to medium cost measures such as retrofitting of energy efficiency transmissions. Opportunities for VSD installation on some of the motors, and replacement of motors with high efficiency equivalents were also identified.
12.1.3. results
The outcomes of the MSO assessment have shown that blade angle adjustments would improve the system efficiency allowing shutting down 4 to 6 fans, saving from 19% to 28% of the total system energy consumption, depending on the season.
Furthermore, the replacement of transmission belts with more efficient gearboxes would improve energy performance by a further 10%. VSD installation and replacement of existing motors with higher efficiency units have longer paybacks.
103
Beshay decided to implement first the blade angle adjustment measure). It then engaged with suppliers to look into new technology available for cooling fan motors that offer high environmental protection and greater reliability. Beshay will then incorporate some of the other MSO energy savings options into the new design.
The experience at Beshay has proved that it is possible to achieve significant energy savings through low cost energy efficiency measures. It has also shown that by studying in more details the motor application a better understanding of motor reliability requirements can be gained. Improved energy performance can then be applied at the design stage.
12.2. case study #2 sidpec company This case study reviews the optimisation of the utility cooling water system within a large industrial plant in the Petrochemical sector. The study revealed that for the two major motor systems assessed 1,630,000 kWh (or EGP 930,000) per annum could be saved at an invest-ment cost of EGP 100,000.
12.2.1. company and Plant background
Sidpec is an Egyptian joint stock company established in 1997 under the Egyptian invest-ment law, located in Alexandria, Egypt. It produces 225,000 Ton/Year of Poly-Ethylene. Sid-pec production portfolio also includes Ethylene (285,000 Ton/Year), LPG (50,000 Ton/Year) and Butene-1 (10,000 Ton/Year).
Large motor systems within the utility plants were identified as a pilot project. The utility plant was perceived to have a low production and business risk. Successful implementation could realize energy savings but also serve as a stepping stone to realize more energy sav-ings in other areas of production.
Utilities consumption represents 38% of the total electricity consumed by the company. The two major motor systems (cooling pumps and cooling fans) were identified as significant energy users consuming 50% and 10% of the utilities plant electrical consumption respectively.
The assessment involved reviewing process requirements, reviewing historical data, taking system measurements and developing optimisation solutions. This approach requires the engineers to develop a strong understanding of the system efficiency, operation and control conditions, as well as maintenance practices impact.
12.2.2. optimization strategies
The fans cooling system consists of eight 110 kW fans. However, the process requirements do not dictate the operation of all eight fans at the same time most of the year. Three possible opportu-nities for energy saving in cooling fans system were identified. Two of them involved operating parallel fans at reduced speeds to get more reduction in power. The third opportunity was simply through switching off the equipment based on process requirements. A more in-depth study of the process requirements was found to be necessary before this option could be implemented. There are seven 1,100 kW cooling water pumps, of which two are switched off eight months of the year.

Manual for Industrial Motor Systems Assessment and Optimization
104
Review of process requirements showed the flow rate could be reduced without any negative effects on production. Three opportunities were identified for the cooling pumps. The first was to replace larger pumps with readily available smaller pumps (750 kW), the second was by install-ing VSDs on the newly installed smaller pumps and the third was to add VSDs to all larger pumps.
12.2.3. results
For the pumps, the company has decided to implement first the pumps replacement measure and use the savings generated to review implementation of other measures. For the fans, the company has decided to operate the fans in parallel at reduced speeds. Combined, these measures have led to total savings amount to 1,630,000 kWh (or EGP 930,000) per annum at an investment cost of EGP 100,000.
Applying a structured approach to MSO, substantial energy savings can often be realised with no or low cost requirements. This single pilot project generated 0.8% reduction of total energy consumption.
Sidpec is now aware of the total potential savings, since it has many other large motor sys-tems in the plant that could also be optimized. Using a continuous improvement approach Sidpec intends to pursue implementation and to realize these savings in future projects.
12.3. case study #3 ezz Flat steel company This case reviews the optimisation of a single motor system within a large industrial plant in the steel manufacturing sector. The study revealed that for the fume extraction system 10,250,000 kWh (equivalent to EGP 4,100,000), which represent 1.8% of the plant’s total electricity consumption, could be saved per annum at zero investment cost.
12.3.1. company and Plant background
Ezz Flat Steel (EFS) is part of EZZ industries, the leading group of companies in Egypt for steel making and continuous casting and rolling with a total production of more than 5 million tons of steel (long and flat products) per yeary. The EFS plant has facilities for steel making, treatment, thin slab casting, BCC casting, hot rolling mills (rebar and flat), and skin pass treatment. The plant has a production capacity of 1.2 million tons per year.
After attending the MSO training course provided by the UNIDO’s project, EFS staff applied the methodology leant in the course and developed and implemented the pilot motor system optimisation project described here. The induced draft (ID) fan in the Fume Extraction System of the Melt Shop was selected for the initial interventions. The Melt Shop represents 41% of the total plant electricity consumption, whilst the Fume Treatment Plant consumes 5% of the Melt Shop consumption. The fume extraction system consists of four 1,200 kW fans that operate continuously. The actual fume extraction is controlled by regulating dampers and it is changed during the various phases of production.
Analysis of the motor system involved reviewing process requirements, reviewing historical data, taking system measurements as required, and developing optimisation solutions for the

105
identified system. Careful analysis of the production process showed that all ID fans were not required to operate at full power at all times, since during certain production phases less power was required. This finding formed the basis for the development of optimization strategies.
12.3.2. optimization strategies
Better understanding of the process requirements led to the development of four potential optimization strategies. These involved either stopping or slowing down the fans in response to process requirements.
12.3.3. results
MSO strategies developed proved to have strong potential for achieving significant energy and financial savings. In general MSO strategies offer always a number of no-cost and low-cost solutions that can deliver same or even greater energy and financial savings of meas-ures requiring higher investments. Technically simple interventions are often missed. By applying a structured methodology to analyse and operate systems, MSO strategies often reveal technical simple interventions and other options for significant energy saving without the need for additional resources.
After taking into account investment requirements, operational impact, maintenance and tech-nical difficulties associated with commissioning new equipment, EFS management chose to pursue the implementation of the MSO strategies developed. These are expected to generate annual electricity savings of 10,250 MWh, or 1.8% of the plant’s total annual consumption (540,000 MWh). In financial terms this would represents savings of 4,100,000 EGP per annum.
12.4. case study #4 novaceroThis case reviews the work of the company Novacero for optimizing a compressor system and to completely refurbishthe plant’s shredder. The introduction of high efficiency motor for the compressor led to 205,217 kWh and US$ 19,085.00 of electricity savings. The refur-bishment of the shredder generated average energy savings of 43.41 kWh/ton. The pay-back periods for these two MSO projects were 17 months for the compressor and 18 months for the shredder.
12.4.1. company and Plant background
Novacero S.A. is an Ecuadorian company dedicated to the recycling of scrap metal for the production of bars, rods and solid sections of iron and steel for, among others, industrial, commercial, educational, housing and road infrastructure facilities. It has been operating since 1973 and currently has industrial plants in Quito, Guayaquil and Lasso.
The Novacero Lasso plant consumes approximately 3.0 million kWh per month for the rolling and smelting processes. The main areas targeted for efficiency improvements were the com-pressed-air and shredder motor systems.

Manual for Industrial Motor Systems Assessment and Optimization
106
12.4.2. optimization strategies
The initial assessment indicated high potential savings that could be achieved from replac-ing existing motors in the compressor and shredder with higher efficiency motors.
The Lasso plant has three lubricated rotary screw compressors - located in the fumes treat-ment plant chamber – that are used in various processes. The existing 350 HP motor was replaced by a new one with following specifications: i) 300 HP, ii) Voltage of 2300/4160, iii) Totally Enclosed, Fan-Cooled (TEFC) and iv) suitable for variable speed drives.
The shredding process involves grinding of scrap metal to adjust its size for feed into the fusion furnace. The following optimization measures were identified during the initial assessment:
• Replacement of the main wound-rotor motor starting drive with a new fully automatic liquid rheostat able to control motor current during the entire process. This new solution acquires current, temperature, conductivity and other signals and uses a PLC to control operation;
• Modifications in the design to avoid high level of vibration using springs and other impor-tant changes;
• Installation of a new motor management relay;• Installation and programing of a new control system panel, with the use of a PLC; and• Installation and commissioning of the belt scale system.
12.4.3. results
The replacement of the compressor motor with a higher efficiency one resulted in energy savings of 205,217 kWh per year, equivalent to US$ 19,085. Considering the investment cost of US$ 39,299, the expected payback period is 17 months.
The refurbishment of the shredder yielded also very good results. From January to June 2015, the five-month average energy consumption was 98.1 kWh/ton. After the overhaul project, energy consumption dropped to 54.7 kWh/ton, with average energy savings of 43.41 kWh/ton. In October 2015 (7,552 tons of scrap metal processed) cumulative monthly savings were 327,832 kWh and US$ 25,243. Considering that the shredder’s overhaul total cost was US$ 544,232, the expected payback period is 18 months.

107

108

109109
13. FurtHer reAdInG
13.1. text books• Energy-Efficient Motor Systems – A Handbook on Technology, Programs, and Policy Opportu-
nities, Steve Nadel, Michael Shepard, Steve Greenberg, Gail Katz, Anibal T. de Almeida, ACEEE
• Energy Efficiency Improvements in Electric Motors and Drives, Anibal T. de Almeida, Paolo Bertoldi, Hugh Falkner (Editors), Springer, 2000
• Electric Motors and Drives – Fundamentals, Types and Applications, Austin Hughes, BH Newnes, 2nd Edition
• The Control Techniques Drives and Controls Handbook, Bill Drury, The Institution of Engi-neering and Technology, 2nd Edition, 2009
13.2. standards
13.2.1. Performance rating of motors
• IEC 60034-2-1 (Ed. 2.0): Rotating electrical machines – Part 2-1: Standard methods for determining losses and efficiency from tests (excluding machines for traction vehicles), 2014, which describes methods to determine motor efficiency from tests.
• IEC 60034-30-1 (Ed.1.0): Rotating electrical machines – Part 30-1: Efficiency classes of line operated AC motors (IE code), 2014, which defines energy classes for electric motors rated for operation on a sinusoidal voltage supply.
• IEC 60034-4: Rotating electrical machines – Part 4: Methods for determining synchronous machine quantities from tests.
13

110
• IEC 60034-19: Rotating electrical machines – Part 19: Specific test methods for d.c. machines on conventional and rectifier-fed supplies.
• IEC 60034-1: Rotating electrical machines – Part 1: Rating and performance.
• IEC 60034-2-2: Rotating electrical machines - Part 2-2: Specific methods for determining separate losses of large machines from tests - Supplement to IEC 60034-2-1.
• IEC TS 60034 – 25 (Ed. 2): Rotating electrical machines - Part 25: Guidance for the design and performance of a.c. motors specifically designed for converter supply, 2007.
• IEC 61800-2: Adjustable speed electrical power drive systems - Part 2: General require-ments rating specifications for low voltage adjustable frequency a.c. power drive systems.
13.2.2. selection and application of motors
• IEC 60034-31 (Ed.1.0): Rotating electrical machines - Part 31: Selection of energy-efficient motors including variable speed applications - Application guide, 2010.
• IEC 60072-1: Dimensions and output series for rotating electrical machines - Part 1: Frame numbers 56 to 400 and flange numbers 55 to 1080.
• IEC TS 60034-17: Rotating electrical machines — Part 17: Cage induction motors when fed from converters - Application guide.
• NEMA MG10, Energy Management Guide For Selection and Use of Fixed Frequency Medium AC Squirrel-Cage Polyphase Induction Motors.
• NEMA MG11, Energy Management Guide For Selection and Use of Single-Phase Motors.
13.3. other useful documents• Continuous Energy Improvement in Motor Driven Systems - A Guidebook for Industry, DOE/
EERE/Industrial Technologies Program, 2014.
• Premium Efficiency Motor Selection And Application Guide - A Handbook for Industry, DOE/EERE/Industrial Technologies Program, 2014.
• Improving Motor and Drive System Performance - A Sourcebook for Industry, DOE/EERE/Industrial Technologies Program, 2008.
• Energy-efficient motor systems assessment guide, CIPEC.
• Energy Efficiency Reference Guide Electric Motors, NRCAN.
• Energy Management for Motor Driven Systems, USDOE.

111111
14. reFerences
[1] A. de Almeida, J. .. T. .. E. .. F. Ferreira and J. Fong, Standards for efficiency of electric motors - Permanent magnet synchronous motor technology, 2011.
[2] SEW Eurodrive, “Slides on Power Drive Systems,” September 2012.
[3] Rockwell Automation, “Basic for practical operation – motor starting,” 1998.
[4] S. Fassbinder, “Saving Energy with High Efficiency Motors,” Leonardo Energy, 2007.
[5] A. M. Knight and C. I. McClay, “The design of high-efficiency line-start motors,” IEEE Transactions on Industry Applications, vol. 36, no. 6, pp.1555-1562, Nov.-Dec. 2000.
[6] G. Baoming, A. de Almeida and F. J. Ferreira, “Design of Transverse Flux Linear Switched Reluctance Motor,” IEEE Transaction on Magnetics, vol. 45, no. No. 1, pp.113-119, January 2009.
[7] F. J. T. E. Ferreira and A. T. De Almeida, “Energy Regeneration and Output Power Reduction in Electric Motor Driven Systems,” in IEEE/IAS 52nd Industrial and Commercial Power Systems Technical Conference (I&CPS), Detroit, 2016.
[8] International Electrotechnical Commission, “IEC 60034-31: Guide for the selection and application of energy efficient motors including variable-speed applications,” 2010.
[9] “Electric Motors Energy Efficiency Reference Guide,” Natural Resources Canada.
[10] International Energy Agency, “Capturing the Multiple Benefits of Energy Efficiency,” 2014.
[11] Office of Energy Efficiency of Natural Resources Canada, “Energy Efficient Motor Systems Assessment Guide,” CIPEC, 2004.
[12] International Electrotechnical Commision, “IEC 60034-30: Efficiency classes of single-speed, three-phase, cage-induction motors,” 2010.
14

Manual for Industrial Motor Systems Assessment and Optimization
112
[13] IEC, IEC 60034-30-1 (Ed.1): Rotating electrical machines - Part 30-1: Efficiency classes of line operated AC motors (IE code), International Electrotechnical Commission, 2014.
[14] IEC, “IEC 60034-2-1: Methods for determining losses and efficiency of rotating electrical machinery from tests - excluding machines for traction vehicles,” 2014.
[15] A. T. de Almeida, P. Fonseca, F. Ferreira and J. Fong, “EuP Lot 11 Motors, Ecodesign Assessment of Energy Using Products,” ISR-University of Coimbra for EC-DG-TREN, 2008.
[16] Commission Regulation (EC) No. 640/2009 of 22 July 2009 Implementing Directive 2005/32/EC of the European Parliament and of the Council with regard to ecodesign requirements for electric motors.
[17] A. Balducci, EPACT Legislation - The United States experience of minimum efficiency standards for induction motor, Springer - Venlag, 1997.
[18] C. Brunner and P. Waide, “Energy-Efficiency Policy Opportunities for Electric Motor-Driven Systems,” International Energy Agency, 2011.
[19] E. Jochem, Lecture on Energy Economics and Policy, Zurich: ETH (Swiss Federal Institute of Technology), 2008.
[20] A. d. A. e. al., “Improving the penetration of Energy-Efficient Motors and Drives,” European Commission, 2000.
[21] European Copper Institute, “The Costs of Poor Power Quality,” Brussels, 2001.
[22] S. Petrie, “Presentation at Action Energy Maintenance Decisions Matter Seminar, Livingston, Scotland,” 2003.
[23] US Department of Energy, “Energy Management Systems eGuide,” [Online]. Available: <https://ecenter.ee.doe.gov/_layouts/ecenter/ppc.eguide/home.aspx>. [Accessed Jul. 2016].
[24] International Standards Organisation, “ISO 50001:2011 - Energy management systems - Requirements with guidance for use,” 2011.
[25] United Nations Industrial Development Organisation, “The UNIDO Programme on Energy Management System Implementation in Industry,” June 2015.
[26] “Improving Motor and Drive System Performance: A Sourcebook for Industry,” US Department of Energy, 2008.

113

Manual for Industrial Motor Systems Assessment and Optimization
114
notes

115
notes

UNIDO helps raise the business potential of industry by introducing and enhancing energy management practices and accounting methods. The present Manual for Industrial Motor Systems Assessment and Optimiza-tion seeks to provide direction and support to companies seeking to opti-mize their existing motor systems and an additional knowledge resource for industrial energy efficiency service providers.
Vienna International Centre · P.O. Box 300 · 1400 Vienna · AustriaTel.: (+43-1) 26026-o · [email protected]


