ilectric Power lesearch Institute Topics: Solid wastes Wastewater Hazardous materials Waste management Water management EPRl CS-5281 Project 2215-1 Final Report July 1987 Manual for Management of Low-Volume Wastes From Fossil-Fuel-Fired Power Plants Prepared by Radian Corporation Austin, Texas
Transcript
ilectric Power lesearch Institute
Topics: Solid wastes Wastewater Hazardous materials Waste management Water management
EPRl CS-5281 Project 2215-1 Final Report July 1987
Manual for Management of Low-Volume Wastes From Fossil-Fuel-Fired Power Plants
Prepared by Radian Corporation Austin, Texas
SUBJECTS
TOPICS
AUDIENCE
BACKGROUND
OBJECTIVES
APPROACH
RESULTS
R E P O R T S U M M A R Y Water quality control I Hazardousltoxic substances I Solid by-product disposallreuse I Integrated environmental control
Solid wastes Waste management Water management Wastewater
Hazardous materials .~
Generation engineers and operators l Environmental engineers and ~ ~ ~~~~
scientists -
Manual for Management of Low-Volume Wastes From Fossil-Fuel-Fired Power Plants
If a low-volume waste (LVW) is classified as hazardous, off-site dis- posal could cost 3 to 15 times more than conventional treatment. An integrated approach to LVW management is now available that summarizes current federal regulations, discusses classifications for 10 major wastes, and presents treatmentldisposal options with estimated costs.
LVWs are generated intermittently and have varied chemical compositions. According to the federal Resource Conservation and Recovery Act (RCRA), a nonhazardous waste cannot be reactive, ignitable, or corrosive and can- not produce an extract by the proposed toxic characteristic leaching proce- dure (TCLP) with a composition that is 100 times greater than primary drinking water standards. Nonhazardous LVWs can be discharged after treatment in National Pollutant Discharge Elimination System facilities or disposed in suitable landfills. In general, hazardous LVWs require more- involved and restrictive handling, treatment, and disposal procedures, although certain exceptions exist.
To characterize LVWs according to RCRA procedures and to summarize the technical and economic aspects of suitable LVW treatment/disposal options.
Researchers collected 90 LVW samples at 21 plants. These samples in- cluded not only raw wastes but also treated wastes to determine the perfor- mance of treatment practices. Samples were then characterized according to RCRA procedures. Using these data, researchers prepared generic con- ceptual designs for LVW treatment and disposal options and estimated the associated capital and annual operating costs. Finally, an integrated LVW management approach was developed by cross-referencing LVW with treat- ment/disposal options and presenting a series of example cases.
The study found almost all of the LVW samples to be nonhazardous ac- cording to the proposed RCRA TCLP Boiler chemical cleaning wastes (BCCWs) appeared to have the greatest potential for being classified as hazardous. Several BCCW samples had chromium concentrations that ex- ceeded the RCRA toxicity criteria. The high chromium levels were due to
__
~
EPRl CS-5281s
the presence of trivalent chromium, not hexavalent chromium. This dis- tinction is significant because RCRA has a process for excluding from RCRA regulation wastes containing trivalent chromium if certain condi- tions are met. In addition, BCCW from hydrochloric acid cleaning soh- tions may be classified as RCRA corrosive. However, neutralizing these wastes in-line or in tanks can eliminate the corrosivity. For most LVWs, treatment options are based on two fundamental approaches: (1) con- struction of dedicated treatmentldisposal facilities and (2) codisposal with highvolume wastes such as coal ash or scrubber sludge. The esti- mated costs for codisposal are significantly lower than the costs for dedicated treatment/disposal facilities. Although codisposal is an effec- tive treatment for most LVWs, BCCWs containing chelating agents are best treated in alkaline ash ponds; achieving adequate iron and copper levels for discharge from neutral or acidic ash ponds may be difficult.
____
EPRl PERSPECTIVE
Proper handling, treatment, and disposal of power plant LVWs depend on the classification of these wastes as hazardous or nonhazardous ac- cording to prevailing environmental regulations. In 1985, EPRl published report 65-3737, an evaluation of LVW characteristics and the probable classification of these wastes according to the toxicity criteria of the RCRA extraction procedure. This manual updates and expands that re- port by classifying wastes according to the more recent RCRA TCLP and by presenting technical and economic data on LVW treatment op- tions. Future LVW research, continuing under the same EPRl project, will focus on laboratory studies to evaluate the performance of various BCCW treatment approaches and to investigate the recyclelreuse of BCCW in limellimestone flue gas desulfurization systems and on field monitoring of BCCW evaporation in utility boilers to determine potential environmental impacts.
PROJECT RP2215-1 EPRl Project Managers: Wayne Micheletti; Ralph Komai Coal Combustion Systems Division Contractor: Radian Corporation
For further information on EPRl research programs, call EPRl Technical Information Specialists (415) 855-2411.
Manual for Management of Low-Volume Wastes From Fossil-Fuel-Fired Power Plants
CS-5281 Research Project 2215-1
Final Report, July 1987
Prepared by
RADIAN CORPORATION 8501 Mo-Pac Boulevard
Austin, Texas 78759
Principal Investigators L. J. Holcombe G. P Behrens S. J. Galegher
M. L. Owen
Prepared for
Electric Power Research Institute 3412 Hillview Avenue
Palo Alto, California 94304
EPRl Project Managers W. C. Michelett
R. Komai
Heat, Waste, and Water Management Program Coal Combustion Systems Division
ORDERING INFORMATION
Requests for copies of this report should be directed to Research Reports Center (RRC), Box 50490, Palo Alto, CA 94303, (415) 965-4081. There is no charge for reports requested by EPRl member utilities and affiliates, U S utility associations, U.S. government agencies (federal, state, and local), media, and foreign organizations with which EPRl has an information exchange agreement. On request, RRC will send a catalog of EPRl reports.
Electric Power Research Institute and EPRl are regiaered service marks 01 Electric Power Research Institute. Inc
Copyright @ 1987 Electric Power Research Institute, Inc. All rights reserved
NOTICE This iepolt was prepared by the organization(s) named below as an account of work Sponsored by the Electric Power Research Institute, Inc. (EPRI). Neither EPRI, members of EPRI. the organiratian(s) named below, nor any person aning an behalf of any of them: (a) makes any warranty, express or implied. wlth respect to the use of any information, apparatus, method. 01 process disclosed in this report or that such use may not infringe privately owned rights; or (b) assumes any liabilities with respen to the use of, or for damages resulting from the use 01, any information, apparatus. method. or P ~ O C ~ S S disclosed in this report
Prepared by Radian Corporation Austin. Texas
ABSTRACT
Proper handl ing, t rea tment and d isposal o f power p l a n t low volume wastes depend on
t h e c l a s s i f i c a t i o n o f these wastes as hazardous o r nonhazardous accord ing t o pre-
v a i l i n g environmental r e g u l a t i o n s .
c o l l e c t and c h a r a c t e r i z e accord ing t o Resource Conservat ion and Recovery A c t (RCRA)
procedures a s e r i e s o f low volume waste samples, and ( 2 ) t o summarize t h e techn ica l
and economic aspects of s u i t a b l e low volume waste t reatment op t ions . An e v a l u a t i o n
o f 90 samples f rom 21 p l a n t s i n d i c a t e d t h a t b o i l e r chemical c l e a n i n g wastes have
t h e g r e a t e s t p o t e n t i a l f o r be ing c l a s s i f i e d as RCRA hazardous.
wastes are generated i n t e r m i t t e n t l y and have v a r i e d chemical composi t ions, an
i n t e g r a t e d approach t o t reatment and d isposal i s recommended.
codisposal of low volume wastes w i t h h i g h volume wastes i s an e f f e c t i v e and economic
t reatment approach. However, some wastes, such as b o i l e r chemical c l e a n i n g wastes
c o n t a i n i n g c h e l a t i n g agents, may r e q u i r e t h e use o f dedicated t reatment /d isposal
f a c i l i t i e s .
The o b j e c t i v e s o f t h i s s tudy were (1) t o
Because low volume
I n many instances,
iii
ACKNCWLEDGMENTS
T h i s document represents t h e combined e f f o r t s o f a number o f i n d i v i d u a l s . The
au thors wish t o thank Mr . Wayne M i c h e l e t t i , P r o j e c t Manager a t t h e E l e c t r i c Power
Research I n s t i t u t e , f o r h i s va luab le guidance and ass is tance and Dr . Ralph Komai
who was t h e i n i t i a l EPRI P r o j e c t Manager.
power p l a n t owners and opera tors who a l lowed us access t o t h e i r s i t e s and as-
s i s t e d us i n sampling. Many of t h e concepts presented i n t h i s manual a r e a
d i r e c t product of d iscuss ions w i t h personnel a t t h e p l a n t s we v i s i t e d and sam-
pled.
We a l s o wish t o thank t h e v a r i o u s
The Radian p r o j e c t team was headed by M r . L a r r y Holcombe, P r o j e c t D i rec to r . and
M r . M i l t o n Owen. Program Manager. Mr . Greg Behrens and Ms. S h e i l a Galegher were
l a r g e l y respons ib le f o r t h e waste t rea tment engineer ing analyses.
Other members of t h e Radian p r o j e c t team inc luded M r . Dean Delleney, our Program
Manager a t t h e s t a r t of t h e pro jec t , M r . J im Owens. Sampler and Analyst, and Ms.
Special A p p l i c a t i o n s - N e u t r a l i z a t i o n o f HC1 B o i l e r Chemical Cleaning Waste
Process Summary
Impoundments and Tanks
A p p l i c a b l e Streams
Treatment E f fec t i veness
Conceptual Designs
Treatment Costs
Speci a1 Considerat ions
Process Summary
Physical/Chemical Treatment
A p p l i c a b l e Streams
Treatment E f fec t i veness
Conceptual Design
Treatment Costs
Process Summary
L a n d f i l l s
A p p l i c a b l e Streams
Treatment E f f e c t i v e n e s s
Conceptual Design
Disposal Costs
Specia l Considerat ions
Process Summary
4-1
4-2
4-2
4-2
4-2
4-4
4-8
4-10
4-10
4-11
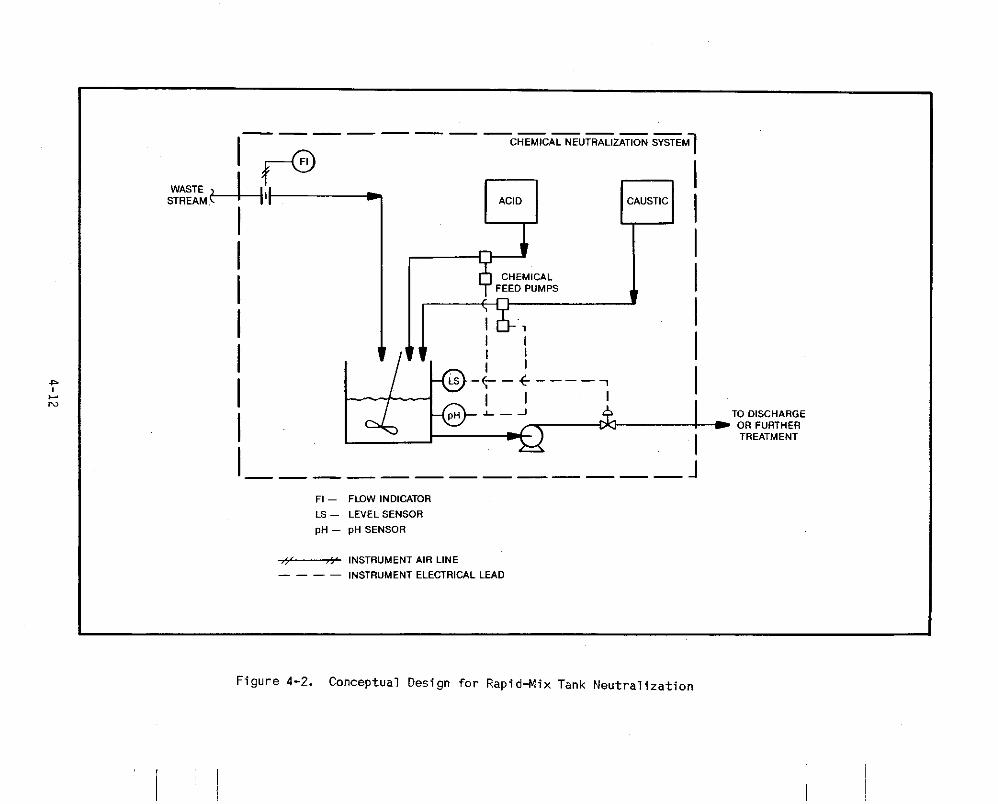
4-14
4-23
4-27
4-27
4-27
4-28
4-37
4-40
4-54
4-57
4-59
4-59
4-60
4-64
4-67
4-68
4-72
4-72
4-73
4-79
4-02
4-91
4-91
i x
CONTENTS (Cont inued)
Evaporat ion
A p p l i c a b l e Waste Streams
Treatment E f fec t i veness
Conceptual Design
Treatment Costs
Specia l Considerat ions
Process Summary
A l t e r n a t i v e / I n n o v a t i v e Techniques
On-Stream B o i l e r Chemical Cleaning
Metal Recovery
Sol i d i f i c a t i o n
Reuse
I n n o v a t i v e Treatment Methods
I r r i g a t i o n and Land Treatment
5 INT€GRATION OF LOW VOLUME WASTE 1REATMENT WITH PLANT WATER AND WASTE MANAGEMENT - CASE STUDIES
Approach
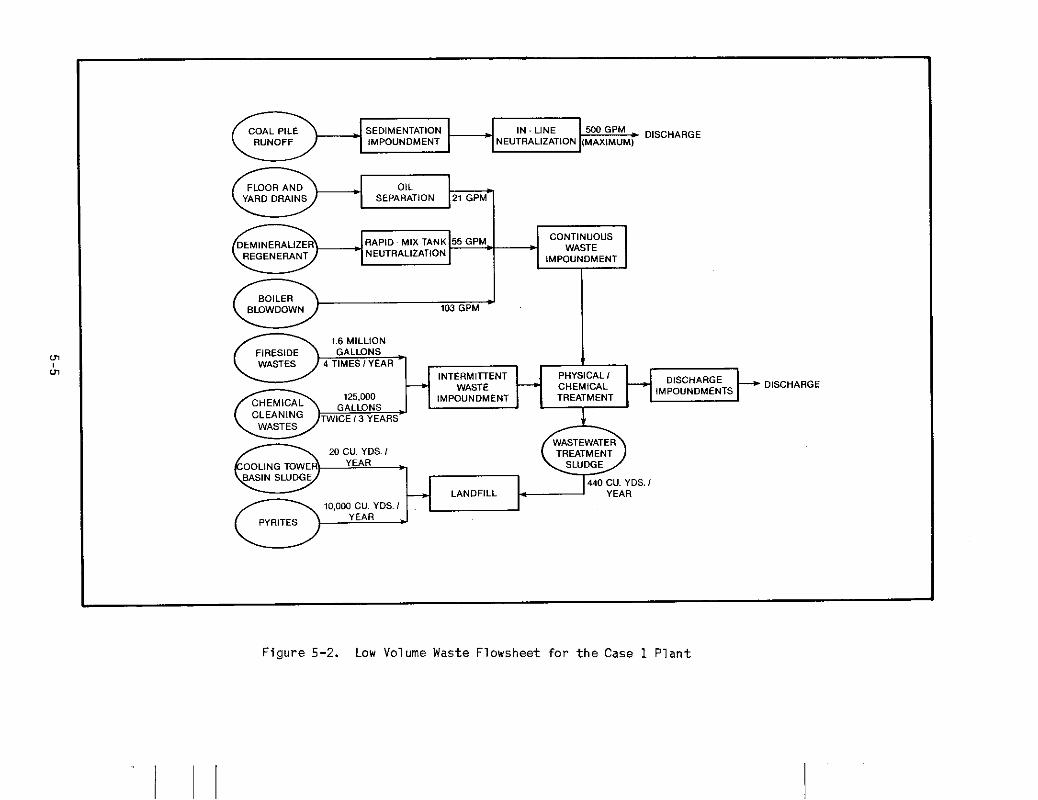
Case 1. Eastern Coal P l a n t Wi th Dry Ash Handl ing
Low Volume Wastes and Treatment
System Costs
Lob Vclume Hastes and Treatment
Systeni Costs
Low Volume Wastes and Treatment
Systeni Costs
Low Volume Wastes and Treatment
System Costs
Low Volume Wastes and Treatment
System Costs
Case 2. Fastern Coal P l a n t Wi th Wet Ash Handl ing
Case 3. Western Coal P l a n t Wi th Dry Ash Handl ing
Case 4. Western Coal P l a n t Wi th Wet Ash Handl ing
Case 5. Eastern O i l P l s n t
Summary
X
4-92
4-92
4-92
4-93
4-94
4-97
4-97
4-97
4-98
4-99
4-99
4-100
4-100
4-100
5-1 5-1
5-3
5-3
5-7
5-7
5-10
5-12
5-12
5-15
5-17
5-19
5-19
5-22
5-24
5-24
5-27
5-27
CONTENTS (Continued)
6 GLOSSARY OF TERM
7 REFERENCES
APPENDIX A - SAMPLING AND ANALYSIS OF LOW VOLUME WASTES A 1 FOSSIL FUEL-FIRED POWER PLANTS
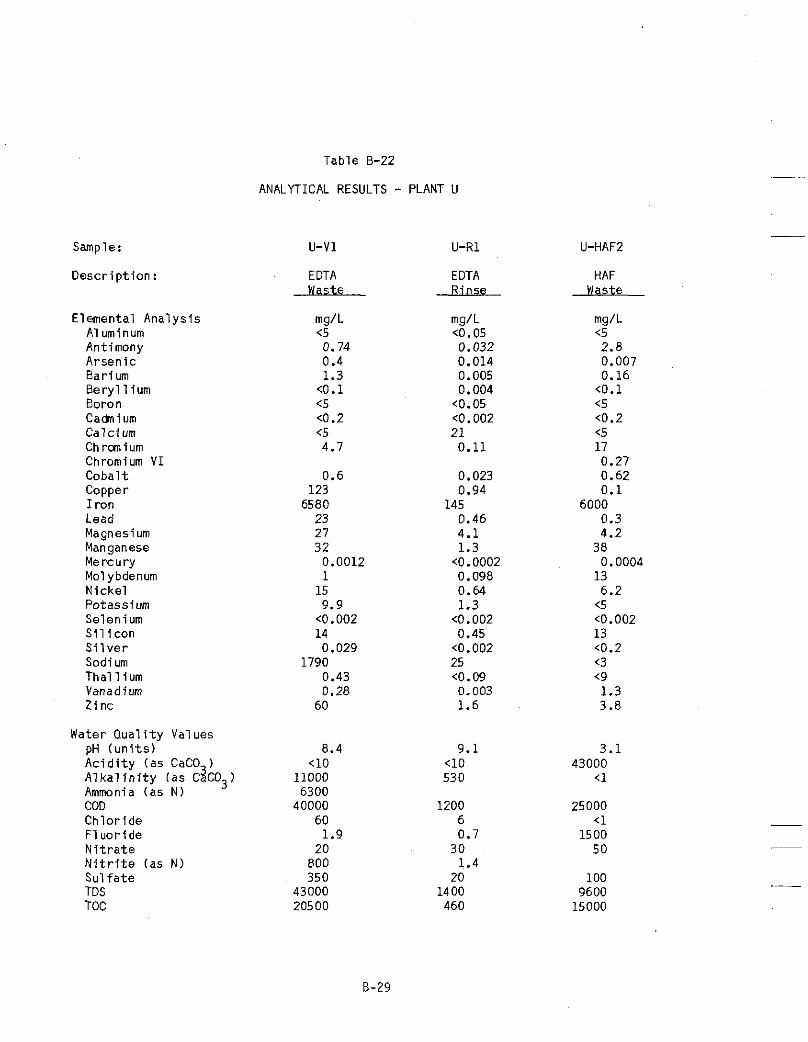
APPENDIX B - TABULATION OF RESULTS FOR SAMPLING AND ANALYSIS OF LOW VOLUME WASTES AT FOSSIL FUEL-FIRED POWER PLANTS
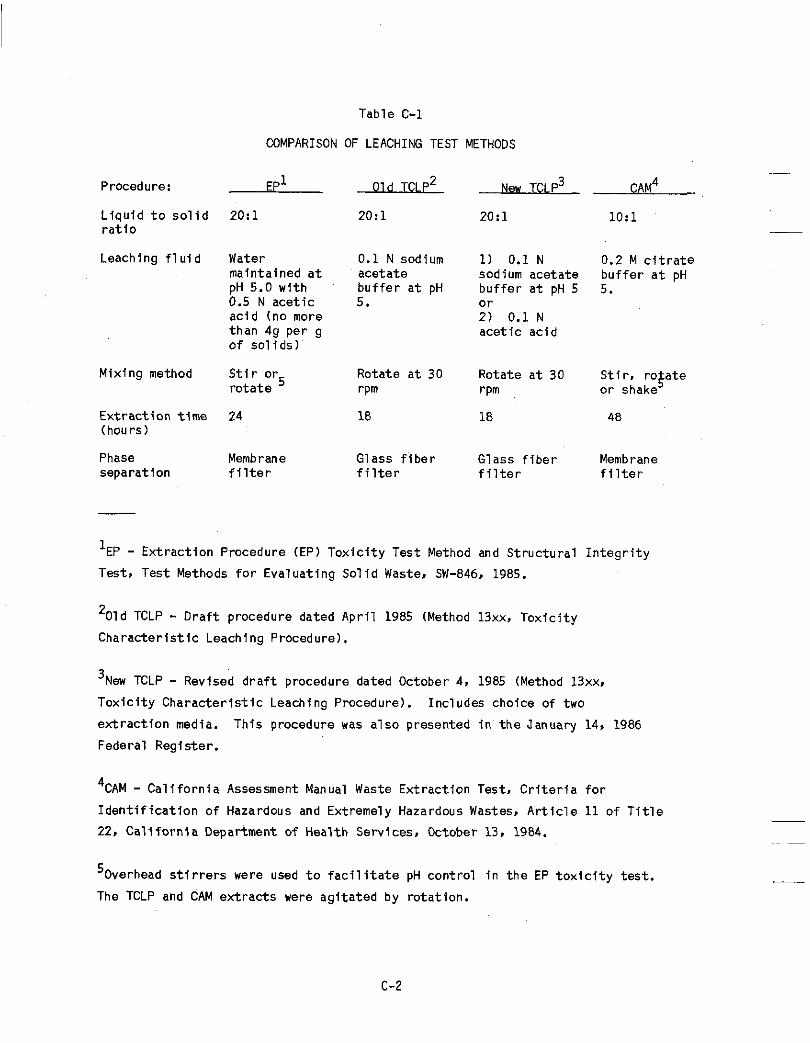
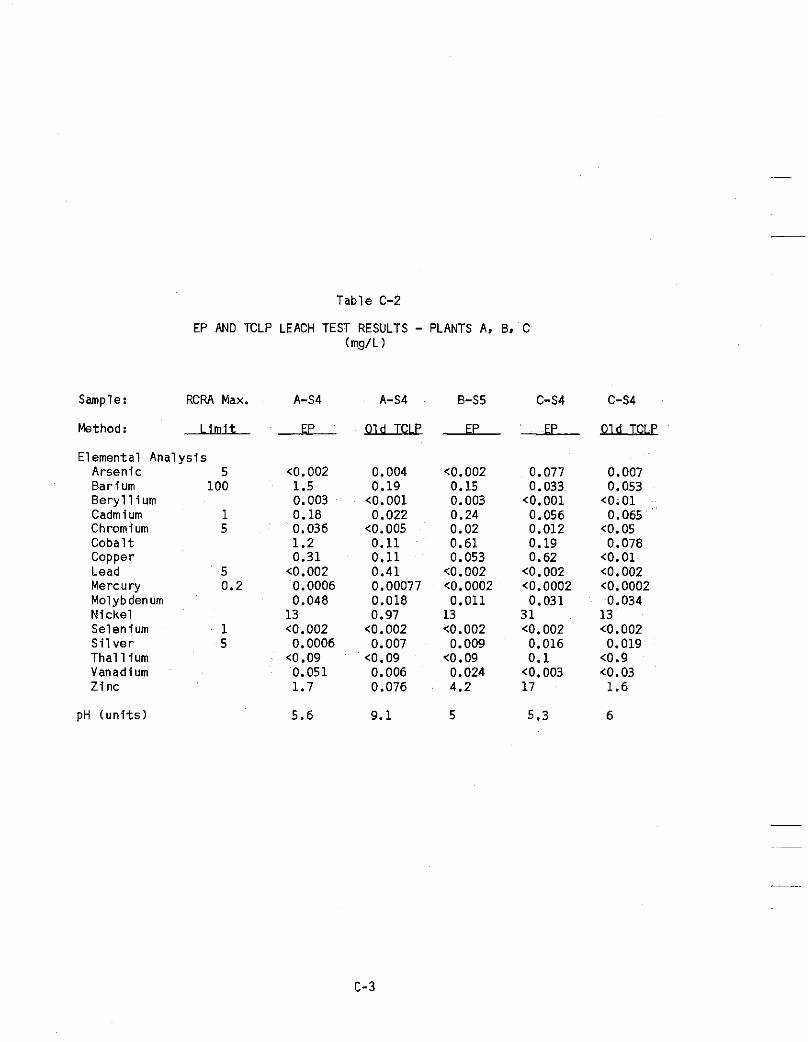
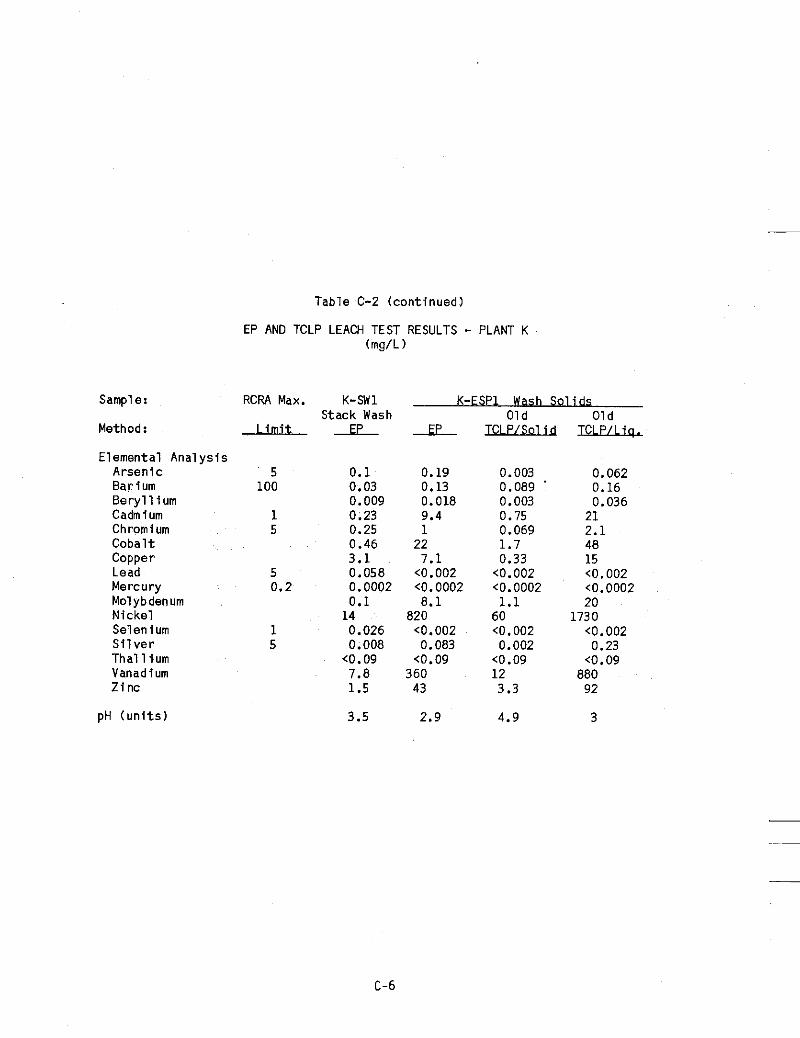
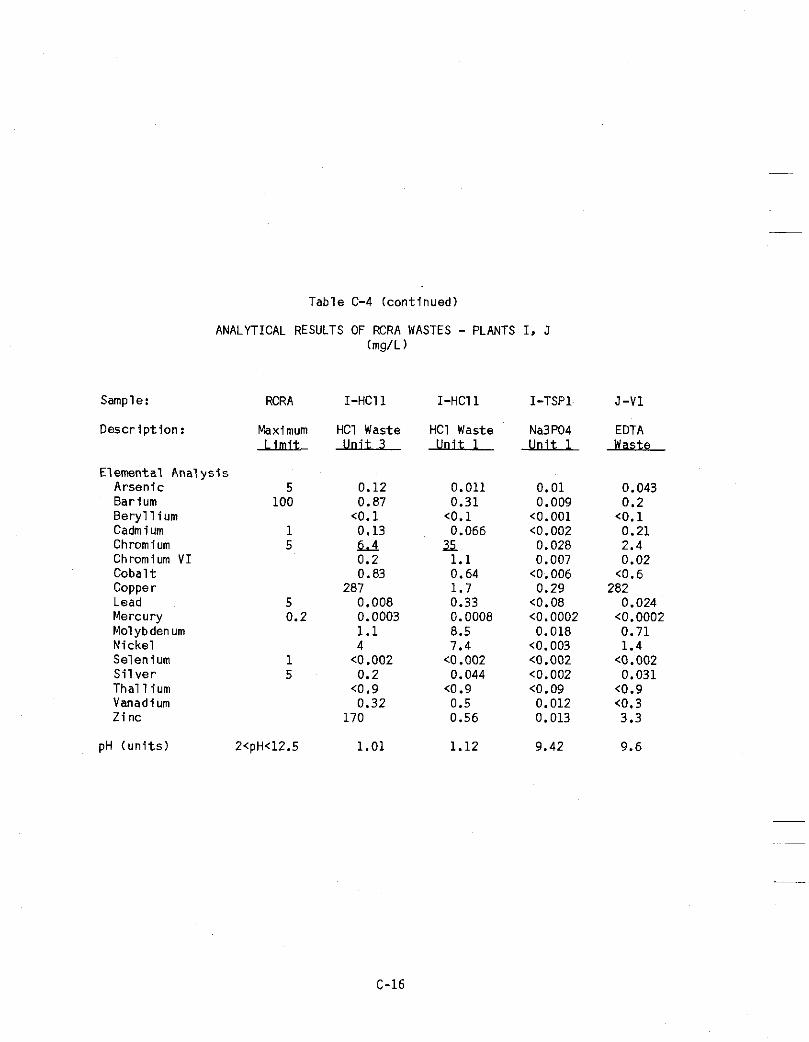
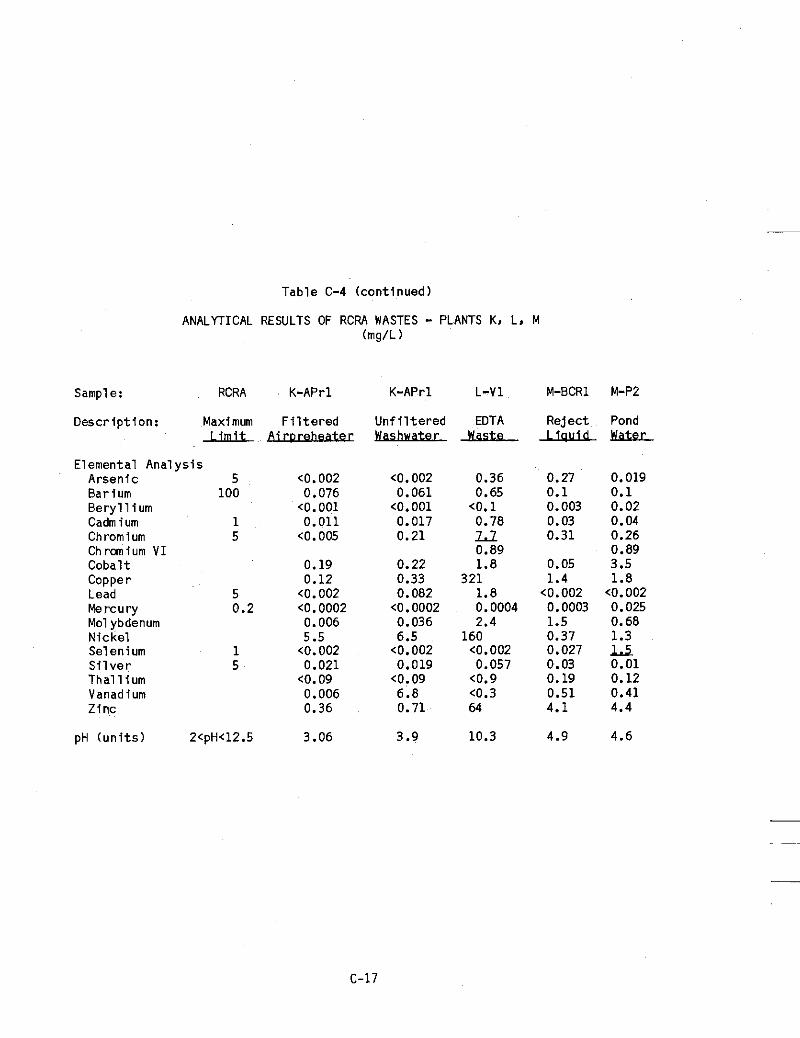
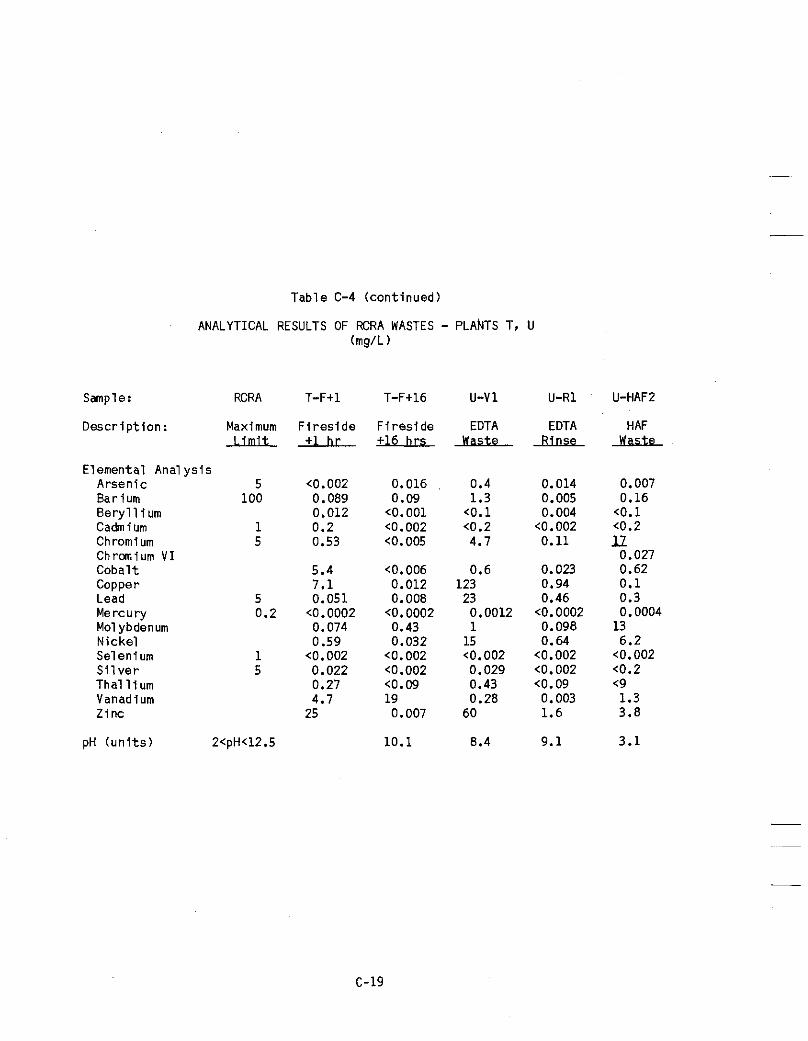
APPENDIX C - TABULATION OF REGULATORY ANALYSIS OF LOW VOLUME WASTES AT FOSSIL FUEL-FIRED POWER PLANTS
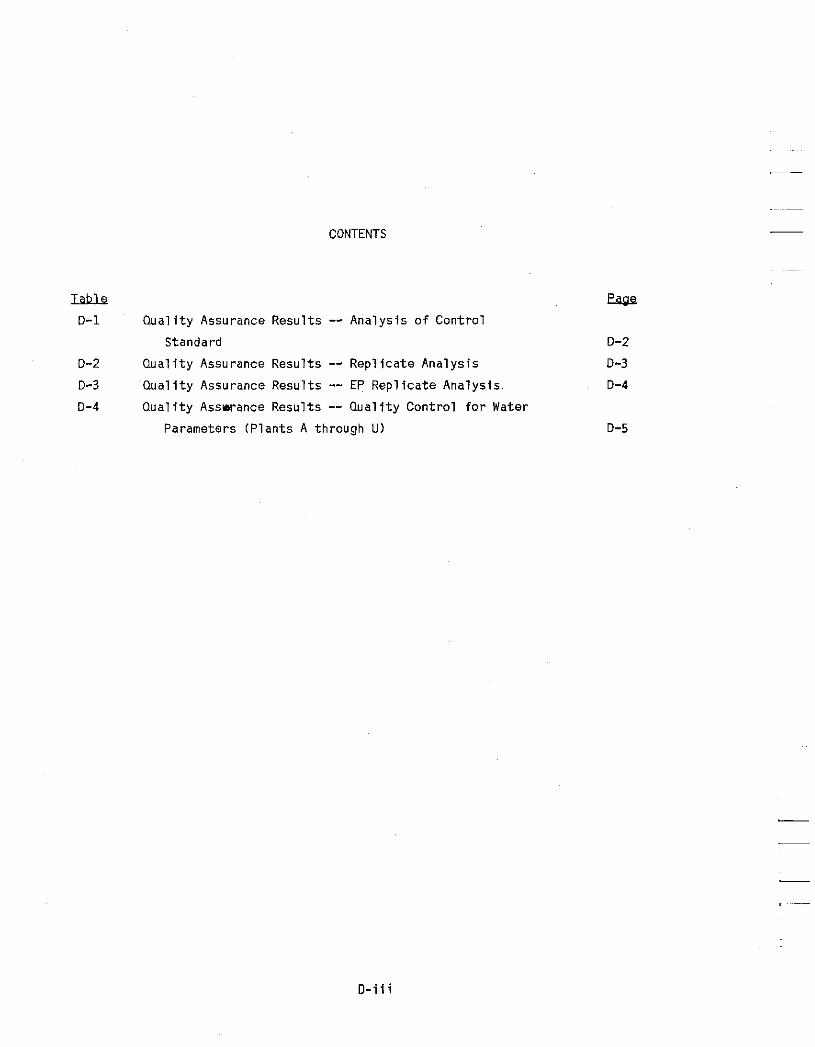
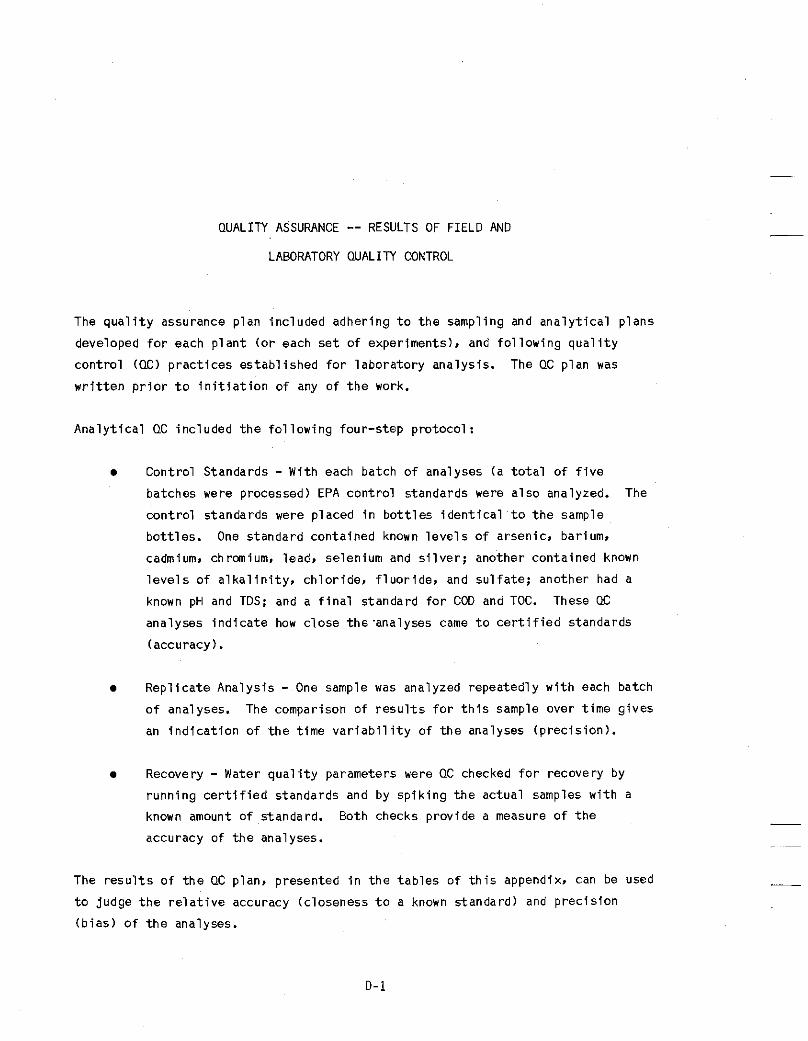
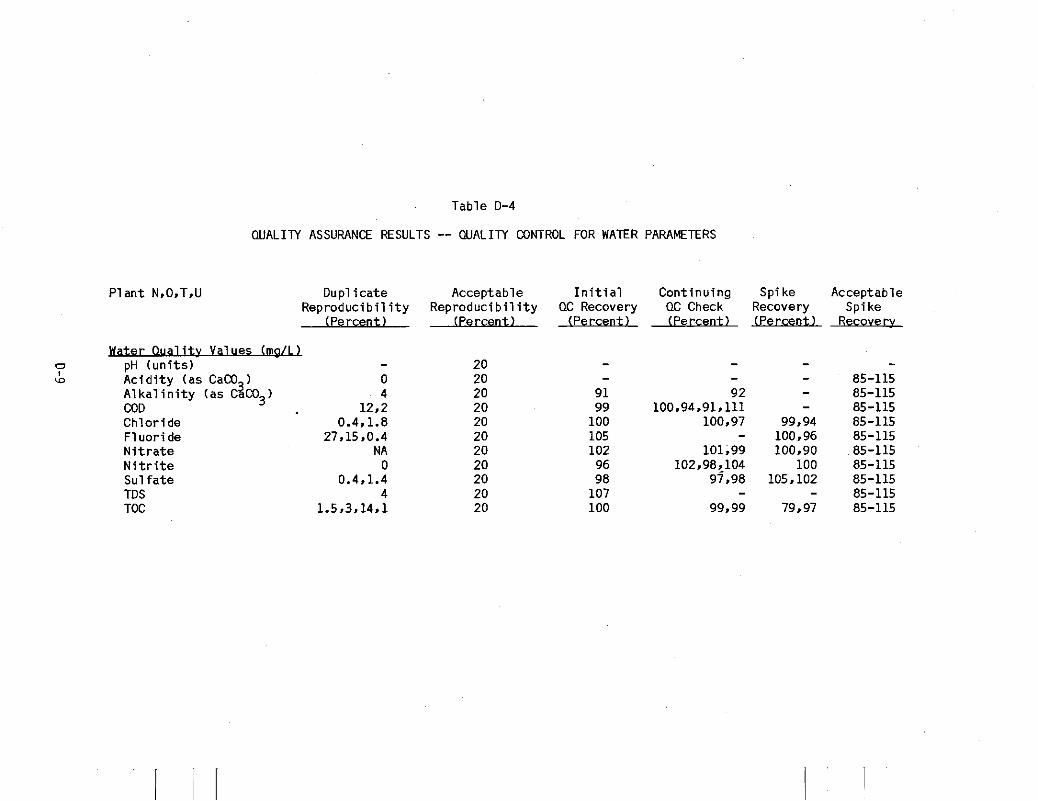
APPENDIX D - QUALITY ASSURANCE -- RESULTS OF FIELD AND LABORATORY QUALITY CQNTROL
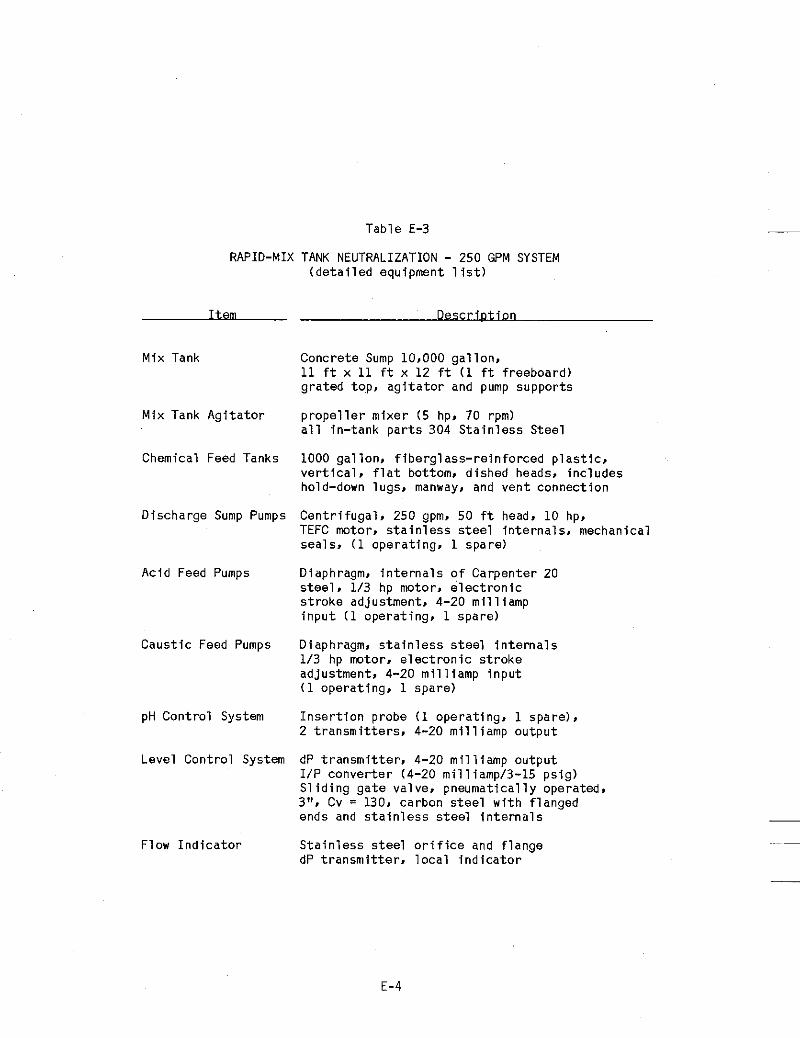
APPENDIX E - COST BASIS
Pa&
6-1
7-1
A- 1
B-1
c- 1
D-1
E- 1
x i
ILLUSTRATIONS
3-1
4-1
4-2 4-3
4-4
4-5
4-6
4-7
4-8
4-9
4-10
4-11
4-12
4-13 4-14
4-15
4-16
4-17
4-18
D e f i n i t i o n of RCRA Hazardous Waste as it App l ies t o Low Vol ume U t i 1 i t y Waste
Low Volume Wastes and Common Treatment Processes
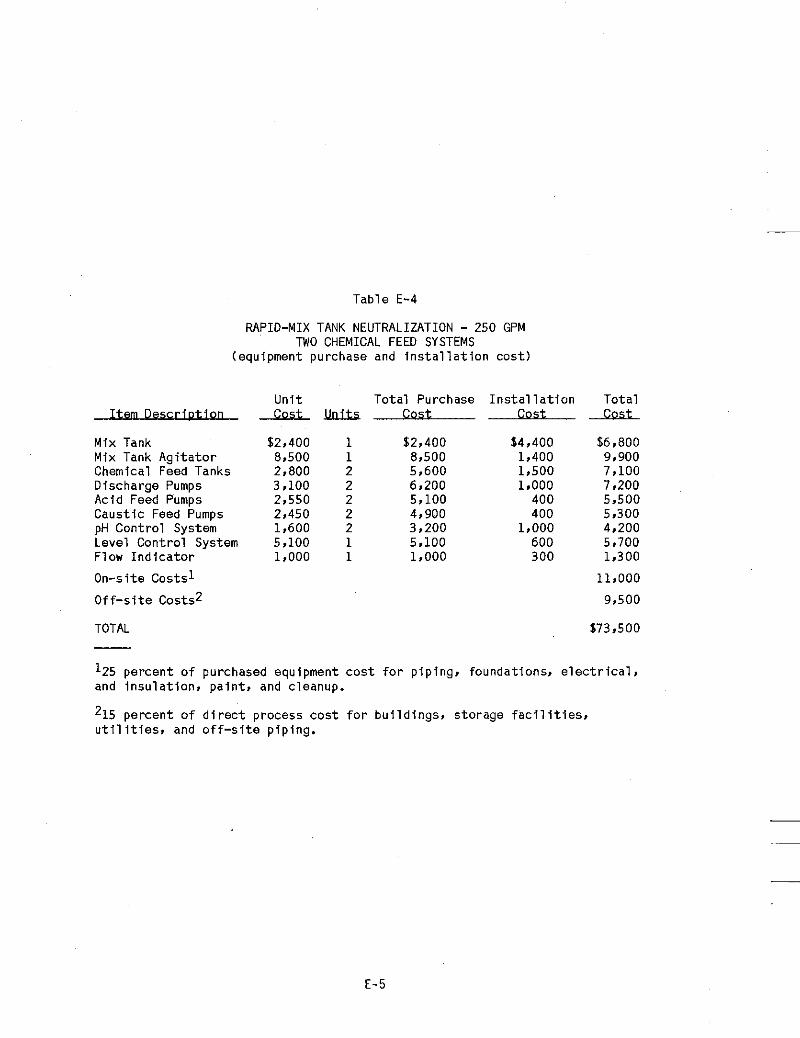
Conceptual Design f o r Rapid-Mix Tank N e u t r a l i z a t i o n
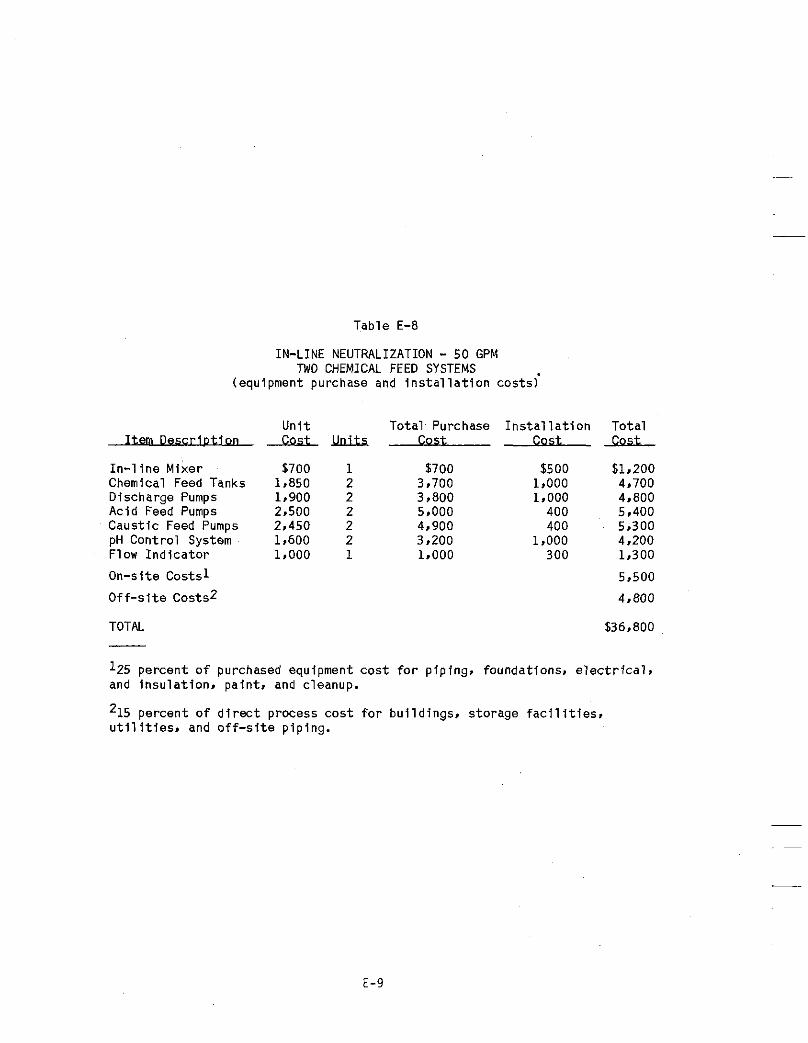
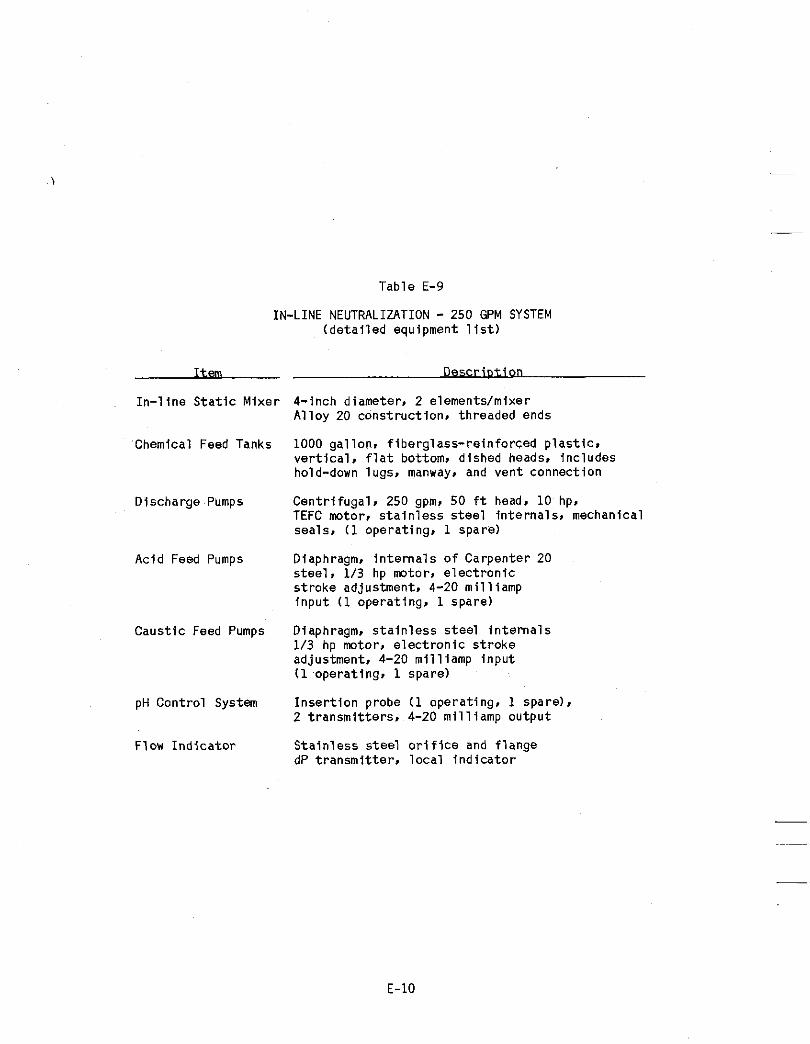
Conceptual Design for In -L ine N e u t r a l i z a t i o n
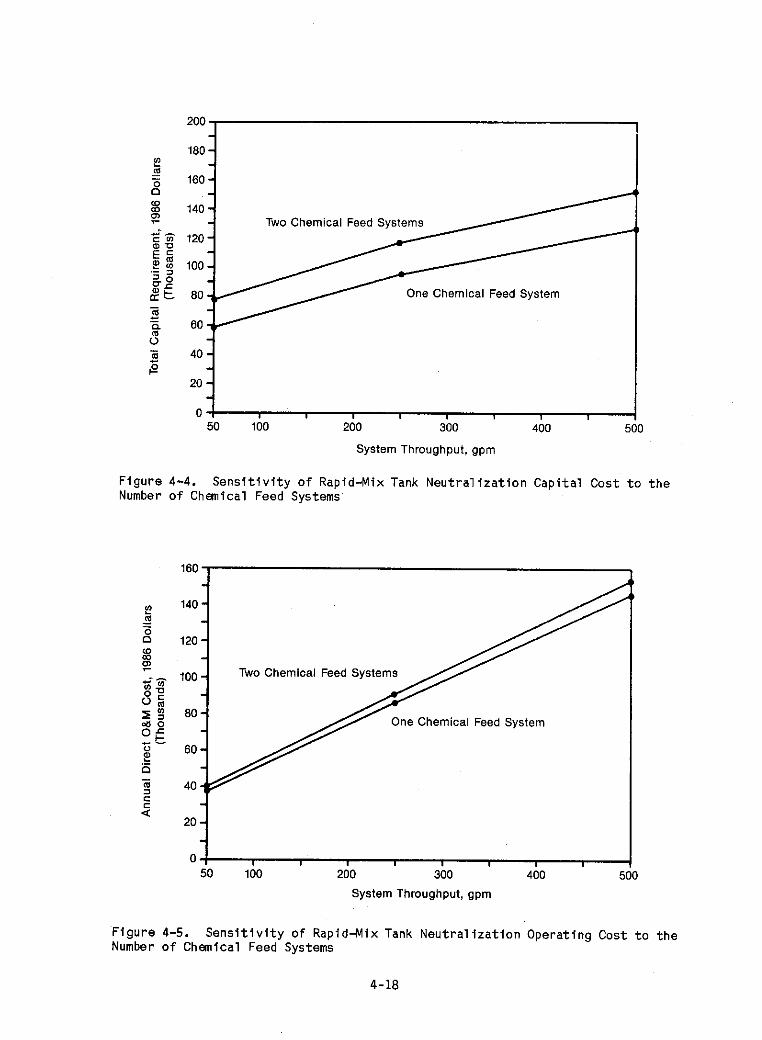
S e n s i t i v i t y of Rapid-Mix Tank N e u t r a l i z a t i o n C a p i t a l Cost t o t h e Number o f Chemical Feed Systems
S e n s i t i v i t y o f Rapid-Mix Tank Neut ra l i z a t i o n Opera t ing Cost t o t h e Number o f Chemical Feed Systems
S e n s i t i v i t y of Rapid-Mix Tank N e u t r a l i z a t i o n C a p i t a l Cost t o Caust ic Dosage
S e n s i t i v i t y o f Rapid-Mix Tank N e u t r a l i z a t i o n Operat ing and Maintenance Cost t o Caust ic Dosage
S e n s i t i v i t y of In -L ine N e u t r a l i z a t i o n C a p i t a l Cost t o t h e Number o f Chemical Feed Systems
S e n s i t i v i t y of In -L ine N e u t r a l i z a t i o n Operat ing and Maintenance Cost t o t h e Number o f Chemical Feed Systems
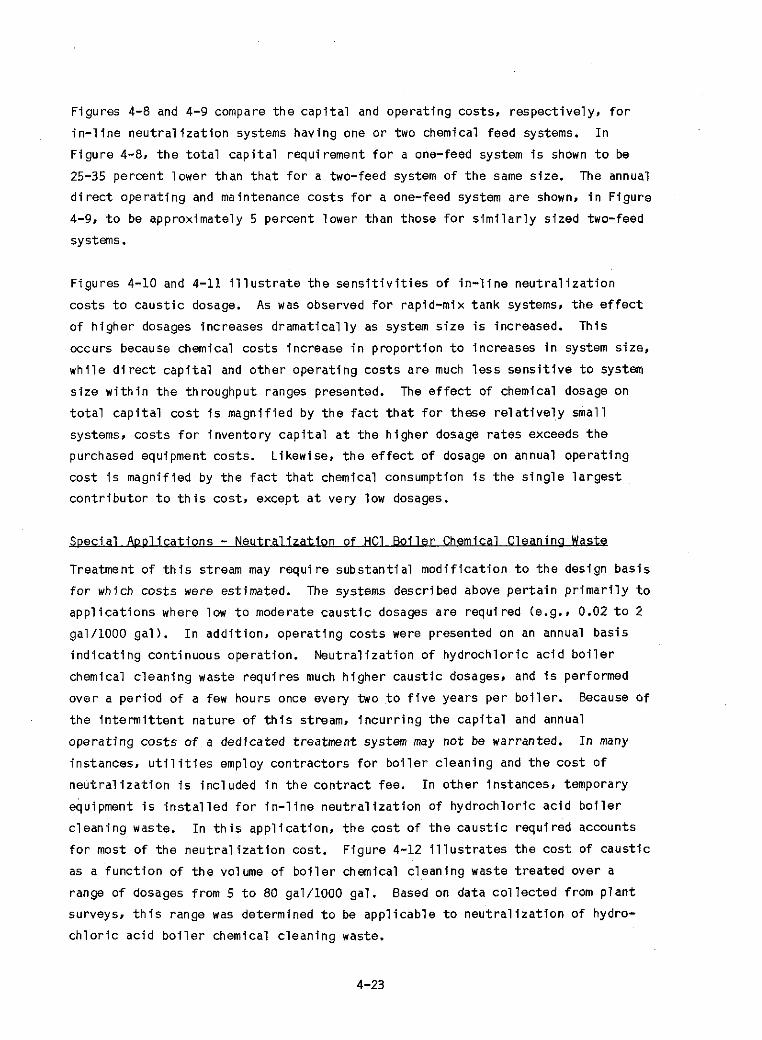
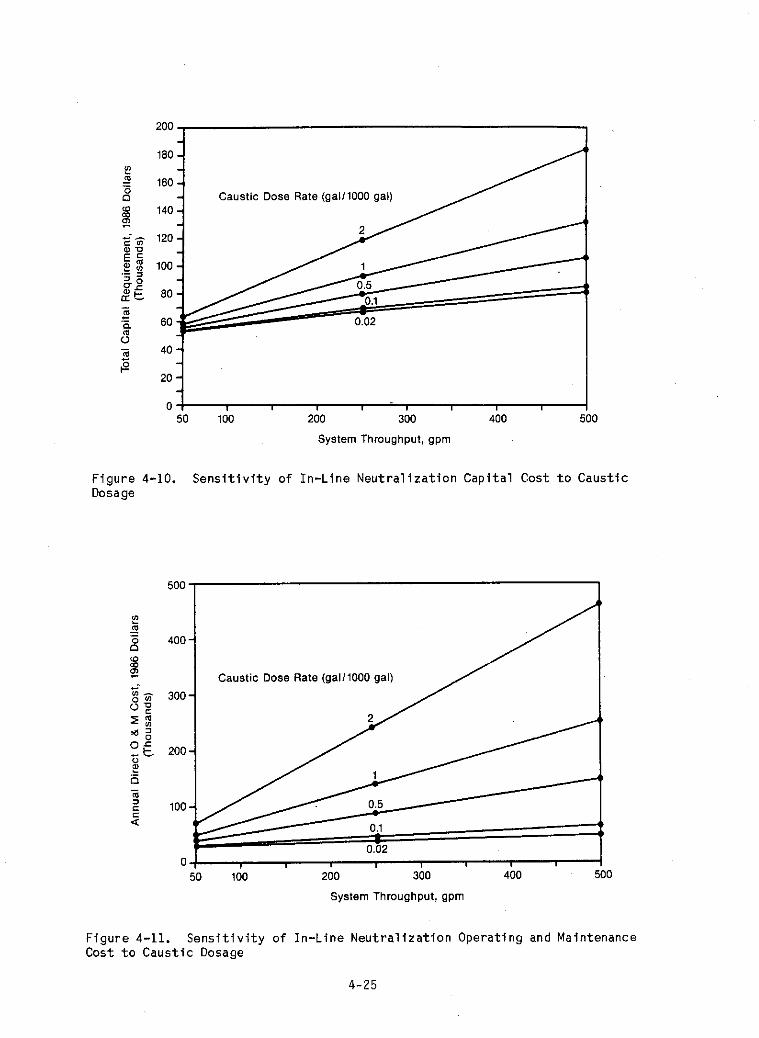
S e n s i t i v i t y of In -L ine N e u t r a l i z a t i o n C a p i t a l Cost t o Caust ic Dosage
S e n s i t i v i t y o f In -L ine N e u t r a l i z a t i o n Operat ing and Maintenance Cost t o Caust ic Dosage
Caust ic Cost f o r H y d r o c h l o r i c A c i d B o i l e r Chemical Cleaning Waste N e u t r a l i z a t i o n as a Func t ion o f B o i l e r Volume
Annual Net Evaporat ion i n t h e U n i t e d S t a t e s ( inches)
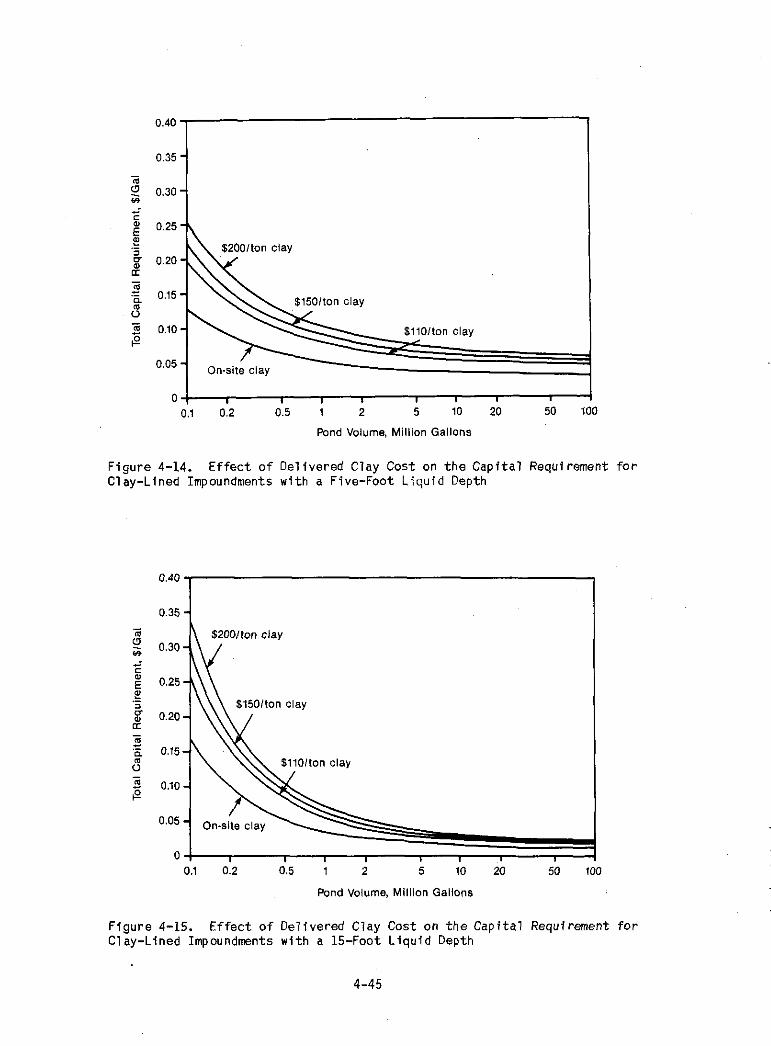
E f f e c t of D e l i v e r e d Clay Cost on t h e C a p i t a l Requirement f o r Clay-Lined Impoundments w i t h a Five-Foot L i q u i d Depth
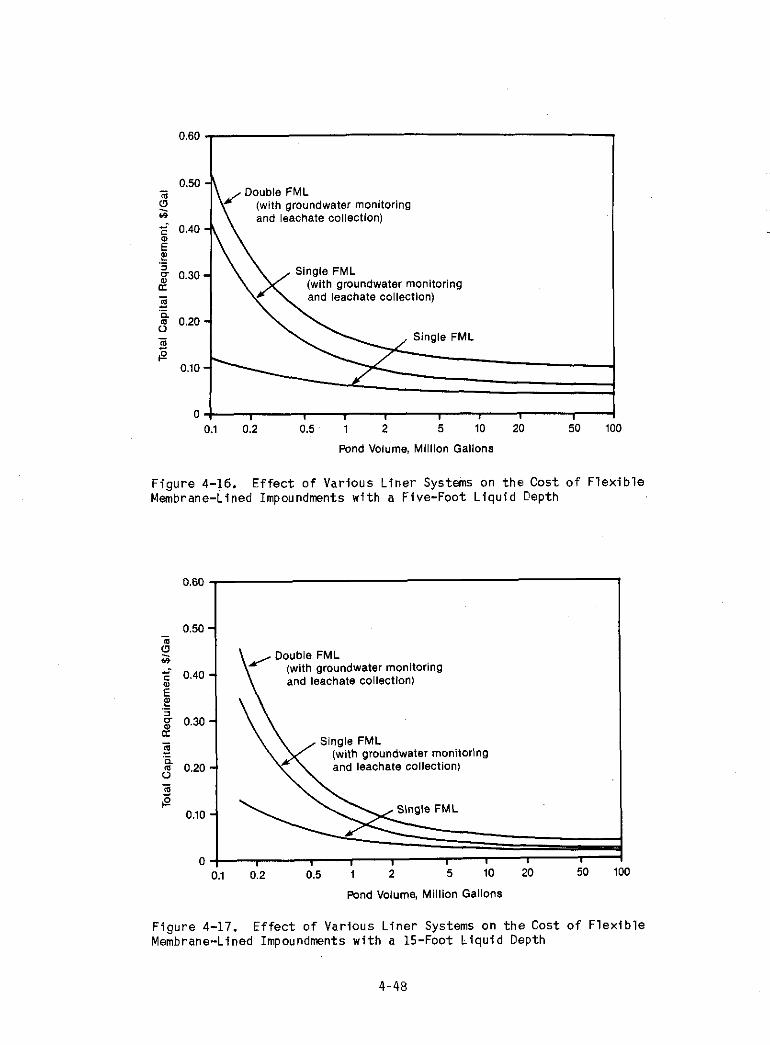
E f f e c t o f D e l i v e r e d Clay Cost on t h e C a p i t a l Requirement f o r Clay-Lined Impoundments w i t h a 15-Foot Depth E f f e c t o f Var ious L i n e r Systems on t h e Cost o f F l e x i b l e Membrane-Lined Impoundments w i t h a Five-Foot L i q u i d Depth
E f f e c t o f Var ious L i n e r Systems on t h e Cost o f F l e x i b l e Membrane-Lined Impoundments w i t h a 15-Foot Depth
Est imated T o t a l C a p i t a l Requirement f o r FRP, Steel and Concrete Tanks
3-3 4-3 4-12 4-13
4-18
4-18
4-19
4-19
4-24
4-24
4-25
4-25
4-26 4-30
4-45
4-45
4-48
4-48
4-53
x i i i
ILLUSTRATIONS (Continued)
4-19
4-20
4-21
4-22
4-23
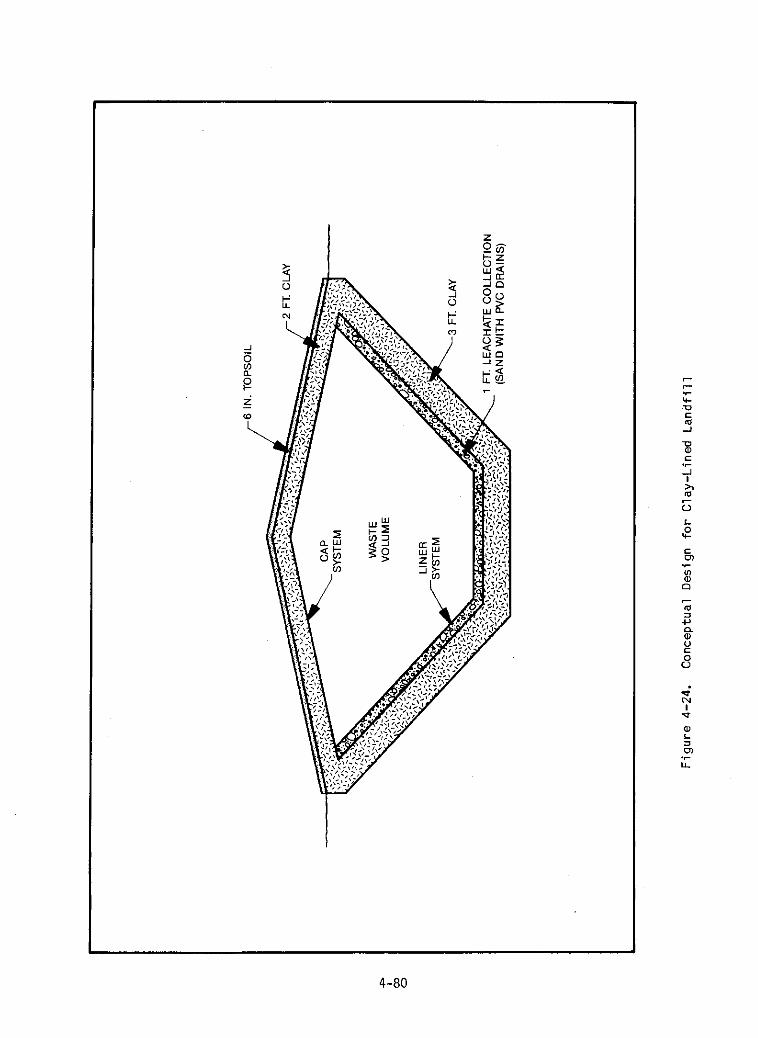
4-24
4-25
4-26
4-21
4-28
4-29
5-1
5-2
5 -3
5-4
5-5
5-6
5-7
5-8
5-9
5-10
Est imated T o t a l C a p i t a l Requirement f o r Ponding Sol i d Wastes
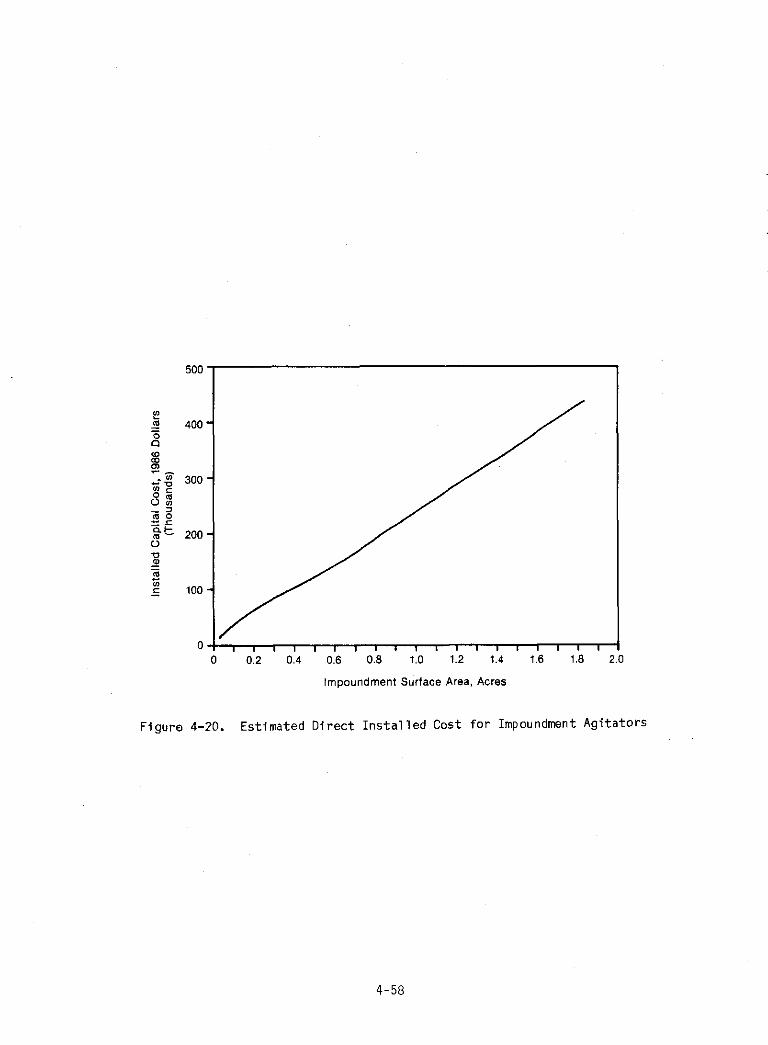
Est imated D i r e c t I n s t a l l e d Cost f o r Impoundment A g i t a t o r s
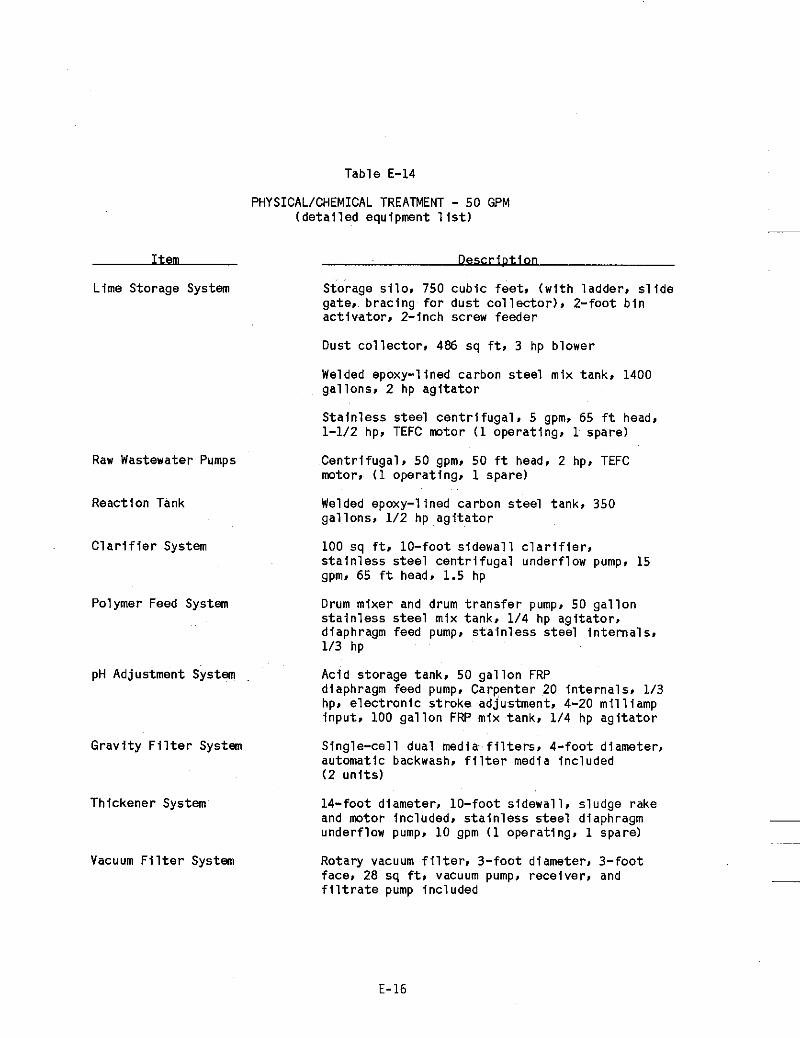
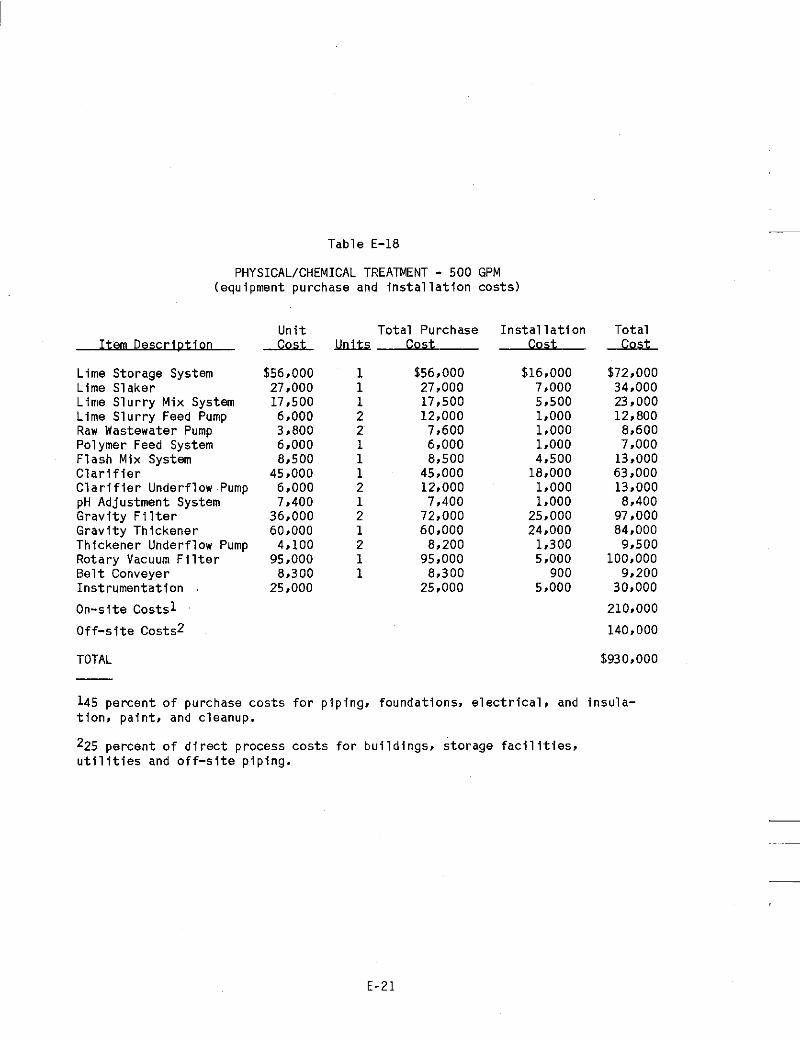
Conceptual Design f o r Phys i ca lKhemica l Treatment
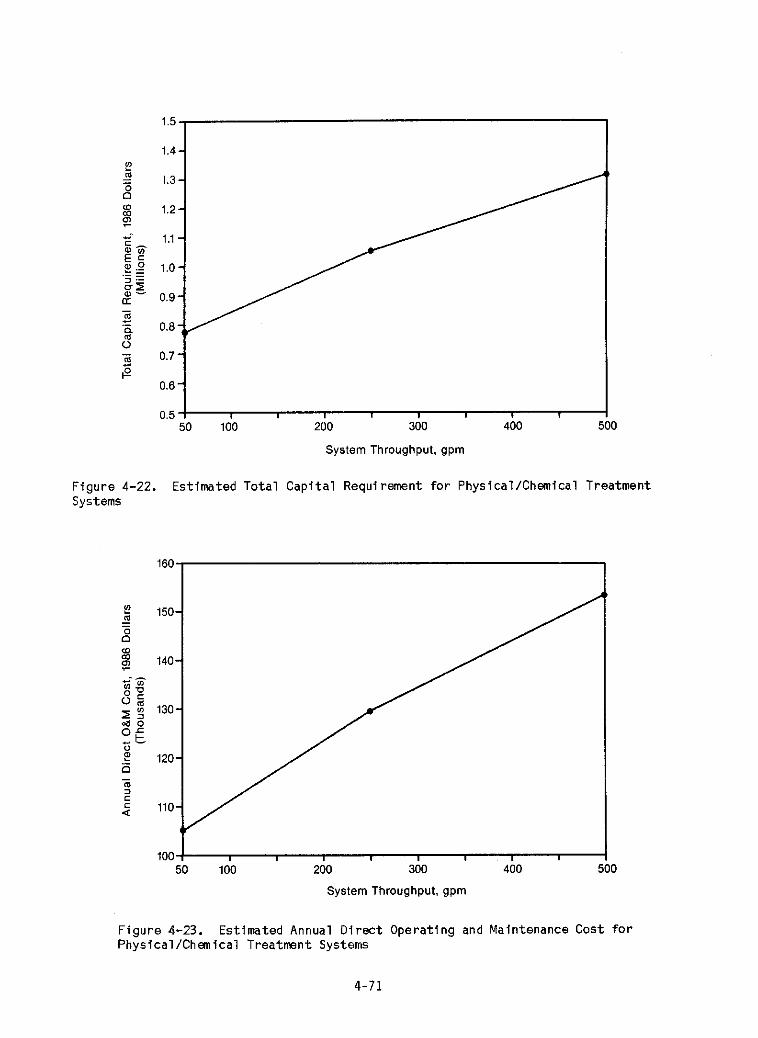
Est imated T o t a l C a p i t a l Requirement f o r Phys i ca lKhemica l Treatment Systems
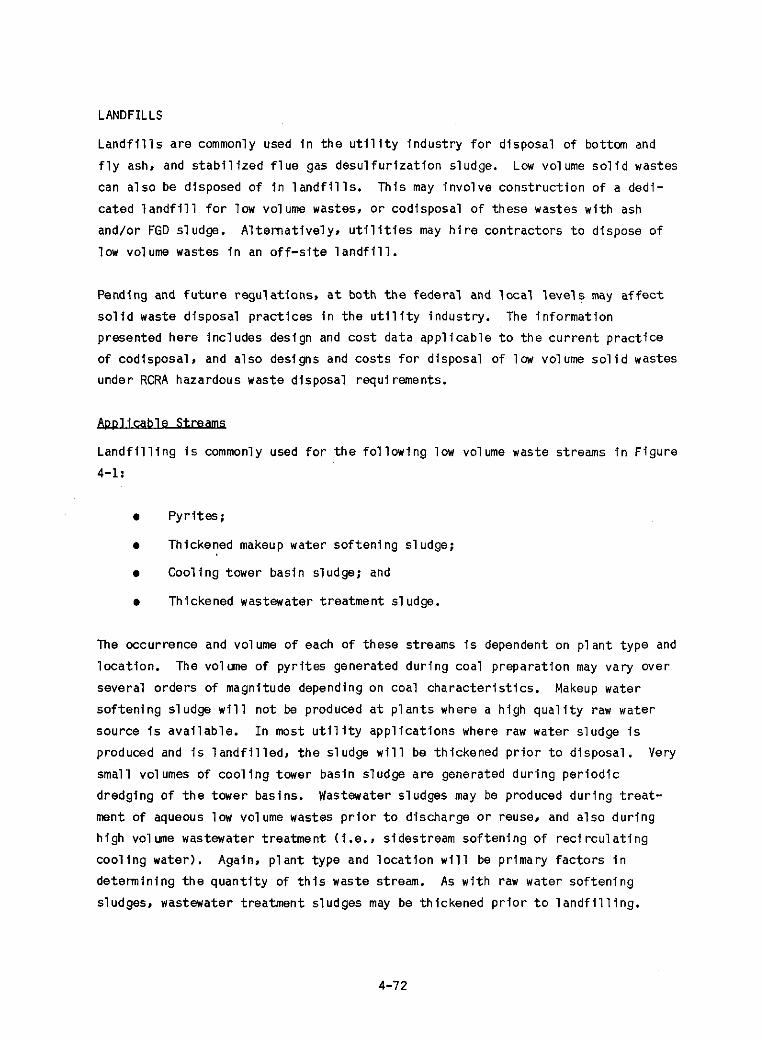
Est imated Annual D i r e c t Opera t ing and Maintenance Cost f o r Phys i ca lKhemica l Treatment Systems
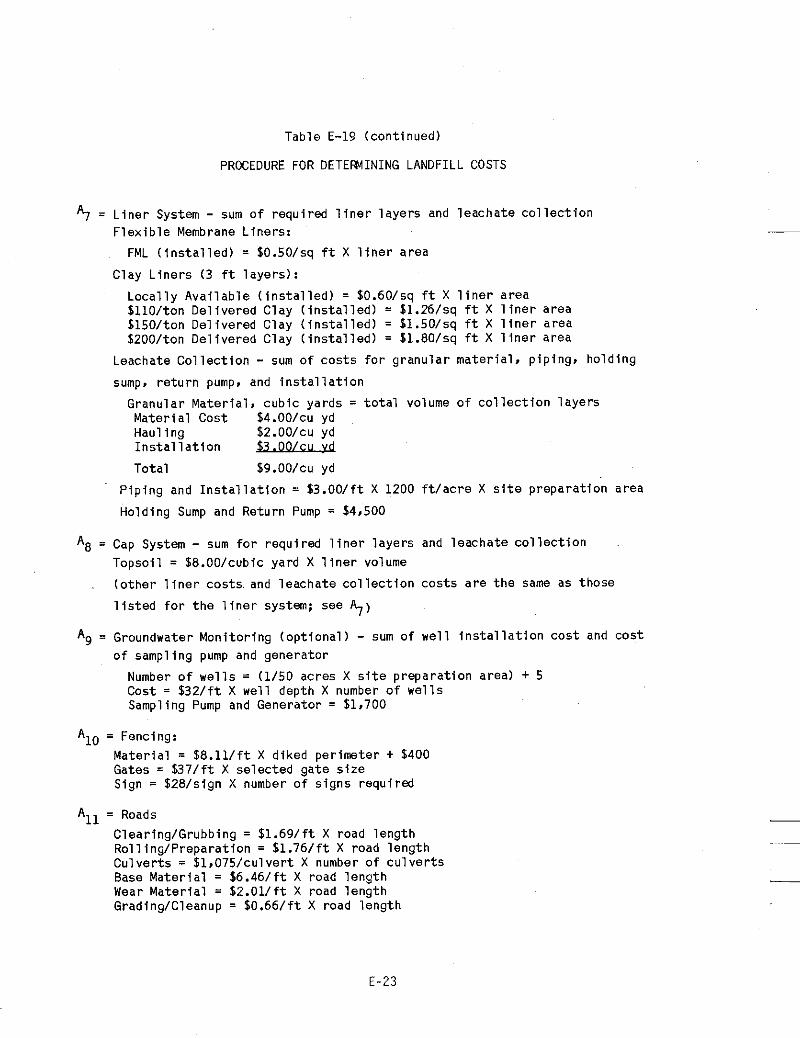
Conceptual Design f o r Clay-Lined L a n d f i l l s
Conceptual Design f o r Double-Lined L a n d f i l l s
Est imated T o t a l C a p i t a l Requi r m e n t s f o r Clay-Lined L a n d f i l l s
Est imated Annual D i r e c t Operat ing and Maintenance Cost f o r Clay-Lined Landf i l l s
T o t a l Est imated C a p i t a l Requi r m e n t f o r Double-Lined Landf i l l s
Est imated Annual D i r e c t Operat ing and Maintenance Cost f o r Double-Lined L a n d f i l l s
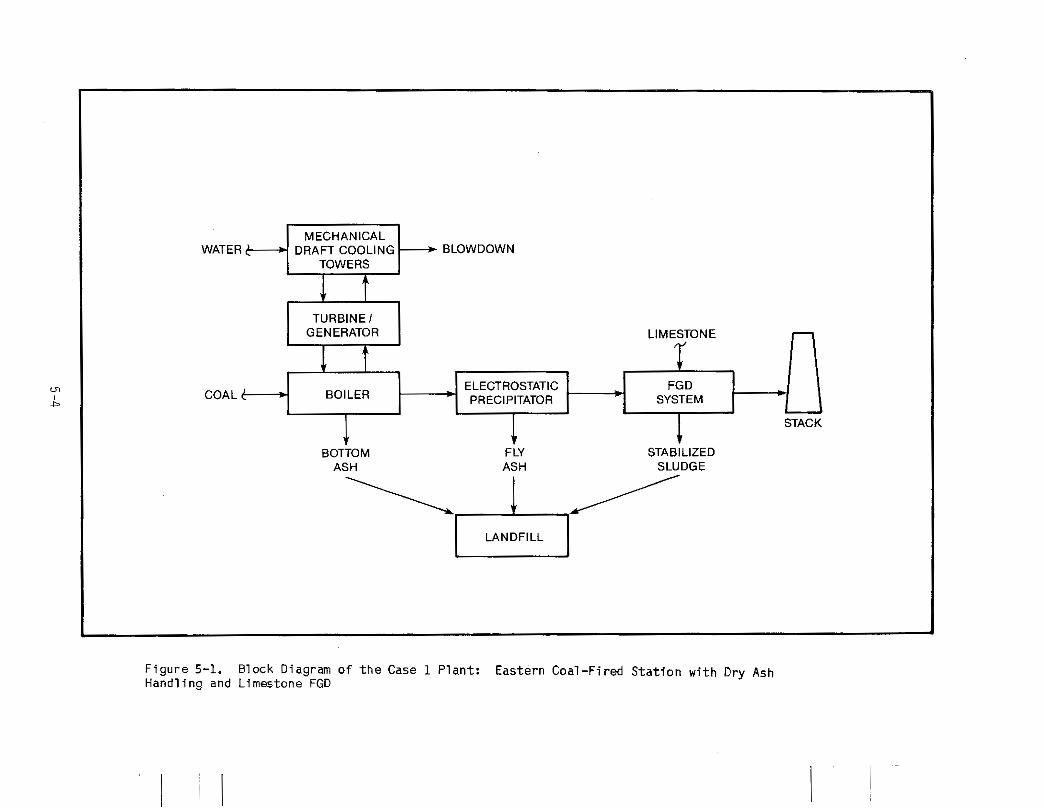
B lock Diagram o f t h e Case 1 Plan t : Eastern Coal F i r e d S t a t i o n Wi th Dry Ash Handl ing and Limestone FGO
Low Volume Waste Flowsheet f o r t h e Case 1 P l a n t
B lock Diagram o f t h e Case 2 P l a n t : Wet Ash Hand l ing
Low Volume Waste Flowsheet for t h e Case 2 P l a n t
B lock Diagram o f t h e Case 3 P lan t : Dry Ash Hand l ing
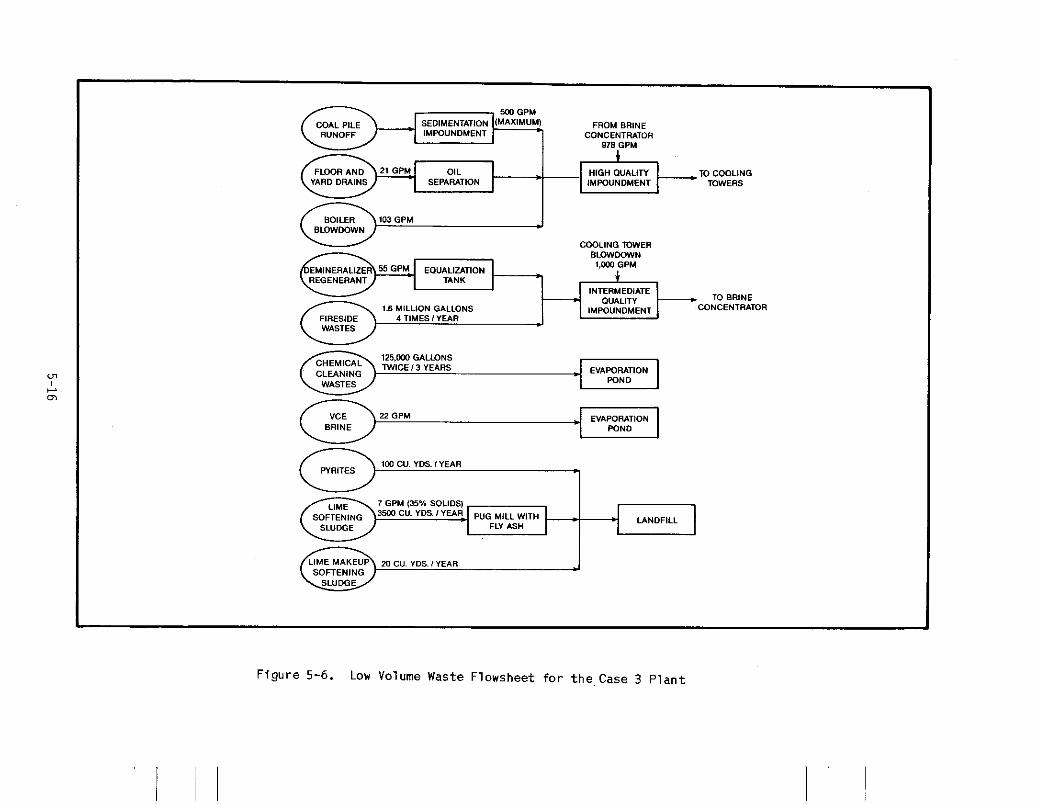
Low Volume Waste Flow Sheet f o r t h e Case 3 P l a n t
Block Diagram o f t h e Case 4: Ash Hand l ing
Low Volume Waste Flowsheet for t h e Case 4 P l a n t
B lock Diagram o f t h e Case 5 P lan t : Eastern O i l -F i red With Once-Through Cool i n g
Low Volume Waste Flowsheet for t h e Case 5 P l a n t
Eas tern Coal-Fired With
Western Coal-Fired With
Western Coal-Fired With Wet
4-55
4-58
4-67
4-71
4-7 1 4-80
4-81
4-86
4-86
4-90
4-90
5 -4
5 -5
5-9
5-11
5-14
5-16
5-20
5-21
5-25
5-26
x i v
TABLES
2-1 2-2 2-3
2-4 2-5 2-6 2-7 2-8 2-9 2-10 2-11
2-12
2-13 2-14 2-15 2-16 3-1 3-2 3 -3
3-4 3-5 3-6 4-1 4-2 4-3 4-4
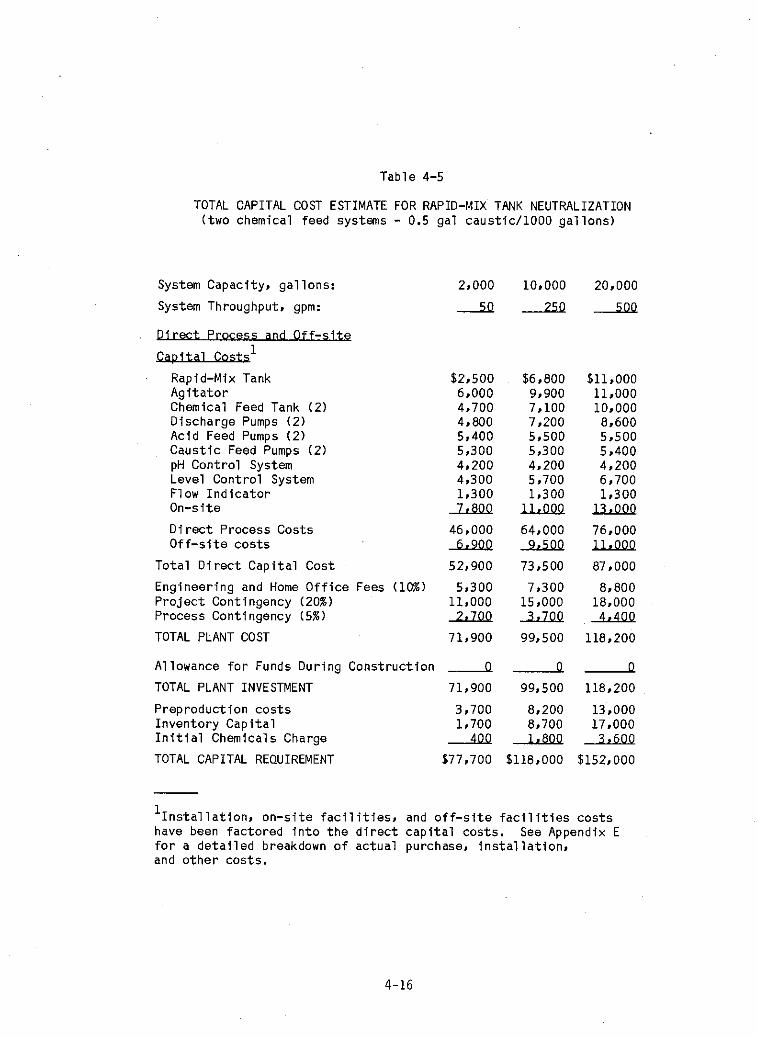
4-5
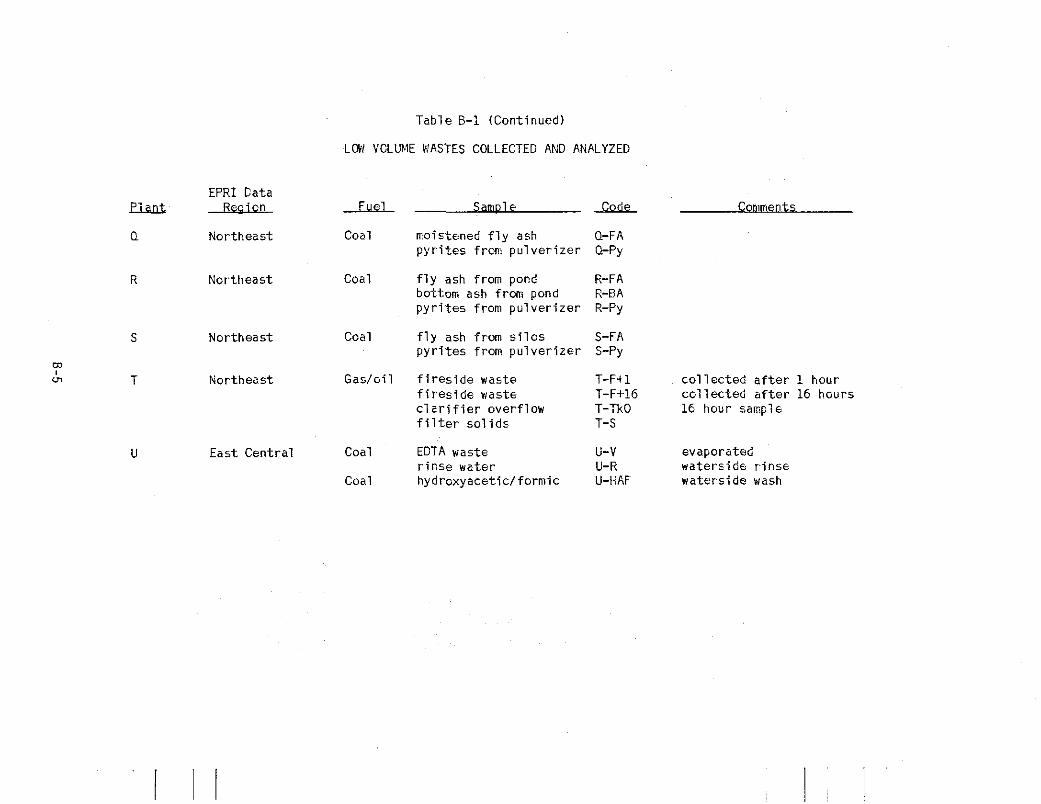
Low Volume Wastes Co l l ec ted and Analyzed
A n a l y t i c a l P r e c i s i o n P y r i t e Composit ions
Coal P i l e Runoff Composit ions
Deminera l i zer Regenerant C h a r a c t e r i s t i c s
Frequewy and Volume o f F i r e s i d e Washes
F i r e s i d e Waste Compositions
EPRI Survey o f B o i l e r Chemical Cleaning Frequency
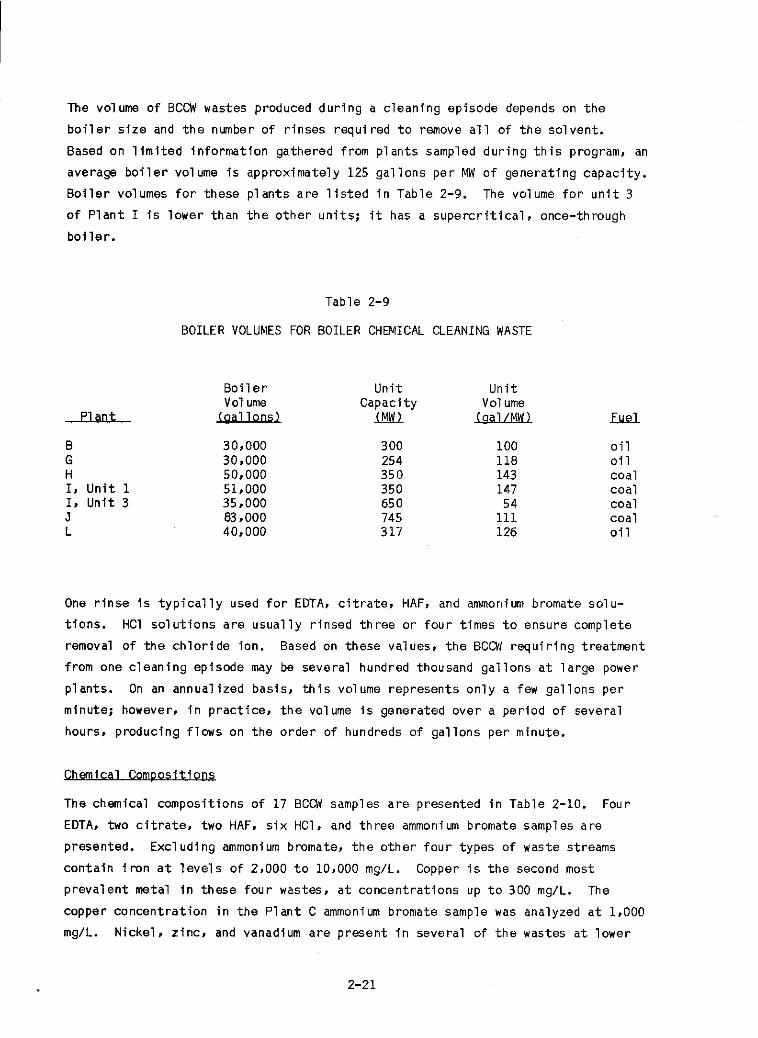
B o i l e r Volumes f o r B o i l e r Chemical Cleaning Waste
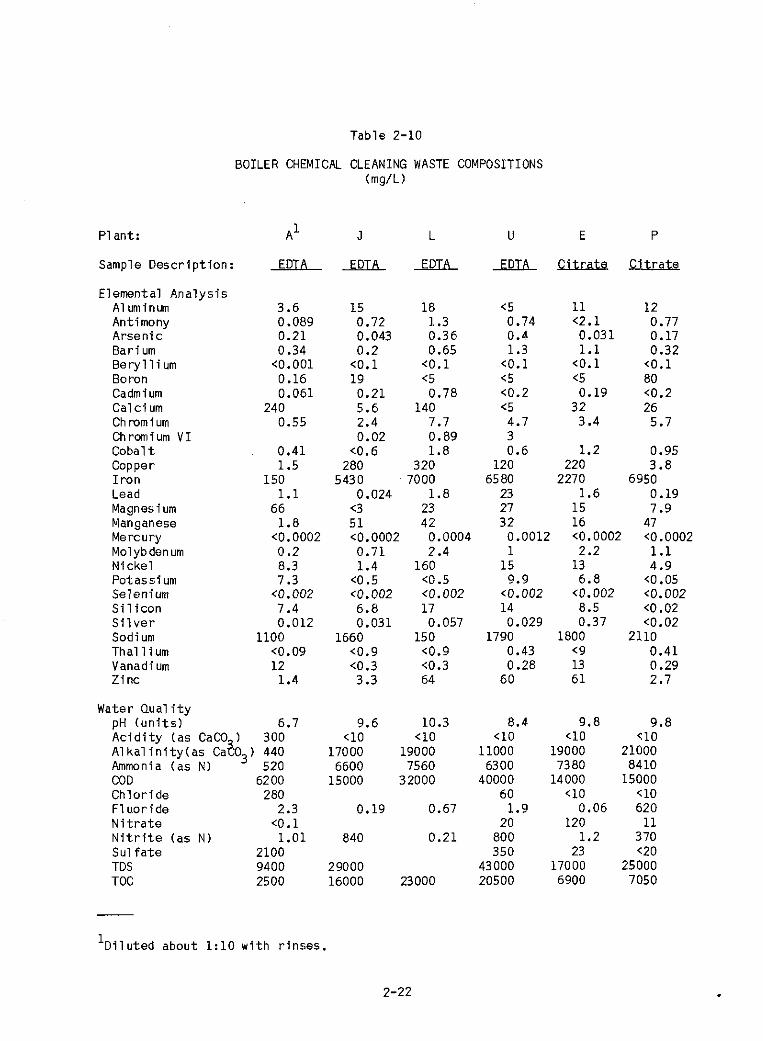
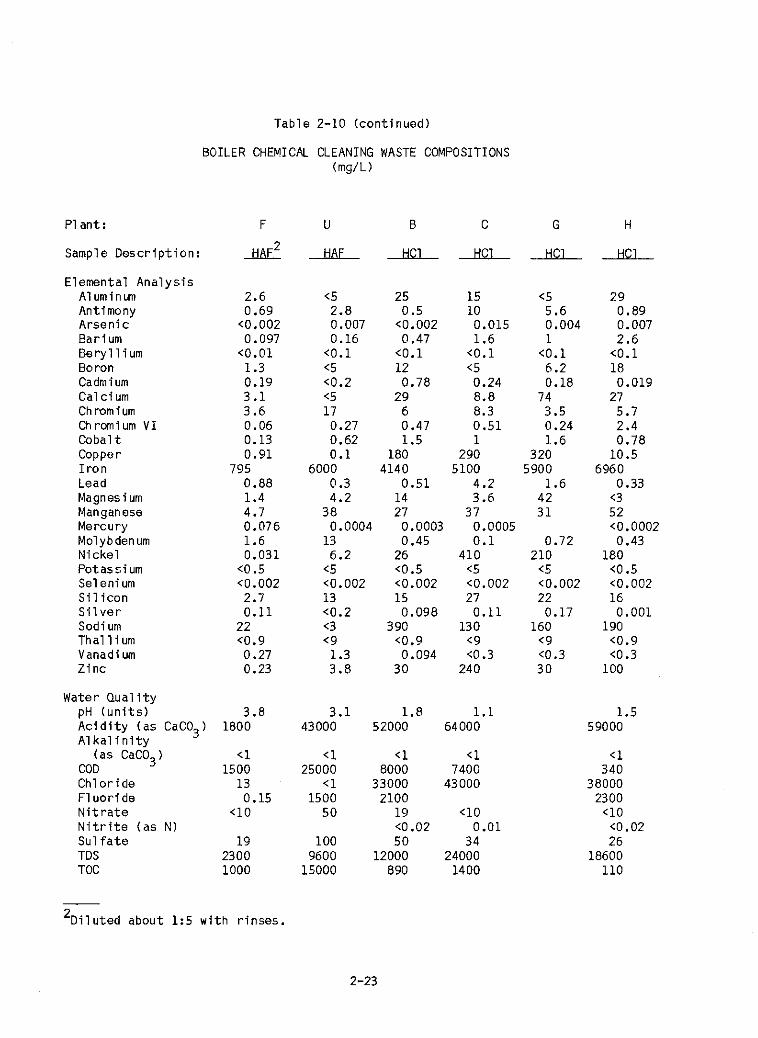
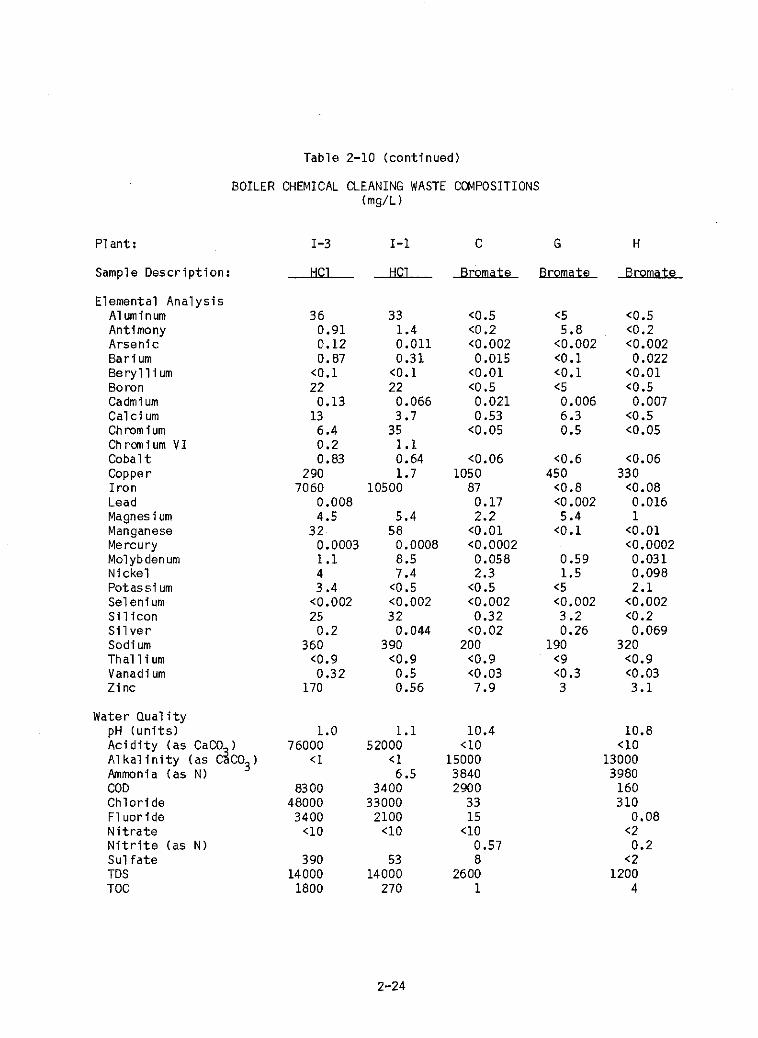
B o i l e r Chemical Cleaning Waste Composit ions
B o i l e r Cleaning Rinse Composit ions
Treatment Methods Observed f o r B o i l e r Chemical Cleaning Waste Samples Est imated Volumes of Sludges and Br ines
B o i l e r Cleaning Treatment Sludge Compositions
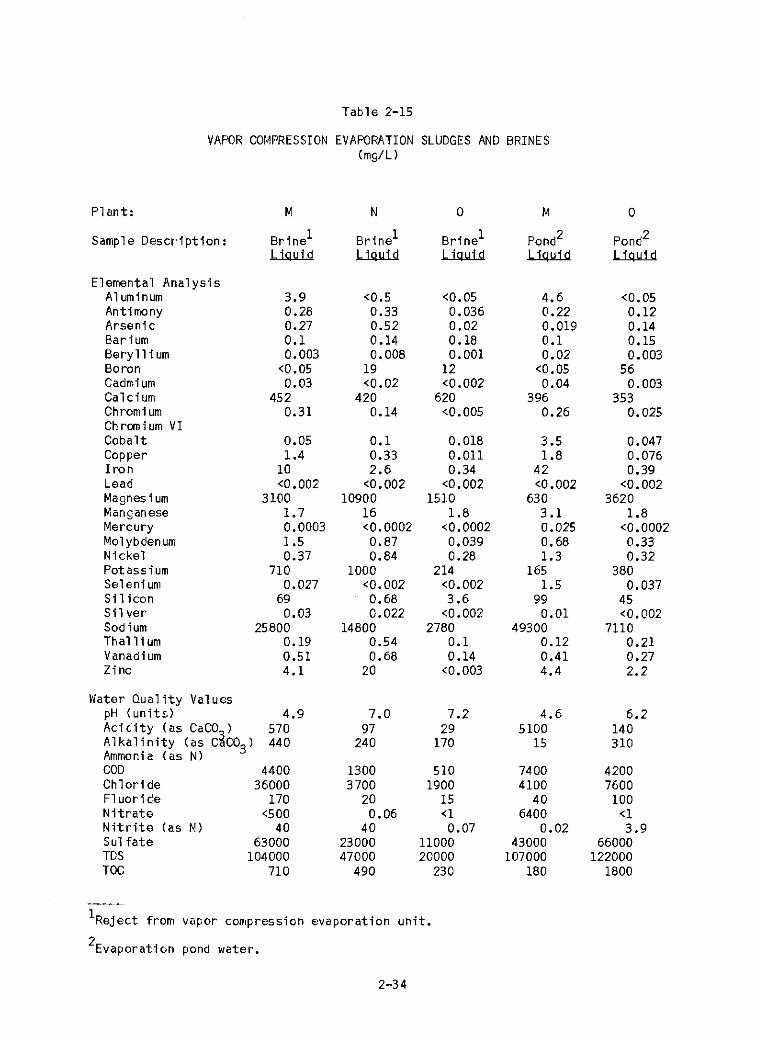
Vapor Compression Evaporat ion Sludges and Br ines
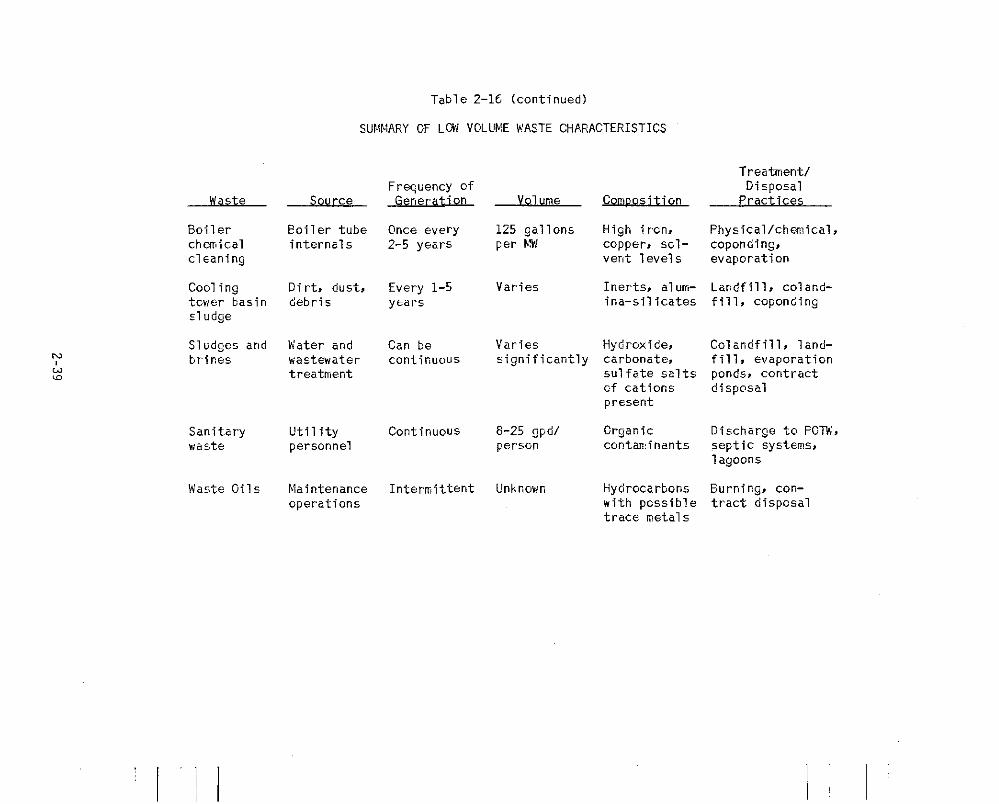
Summary of Low Volume Waste C h a r a c t e r i s t i c s
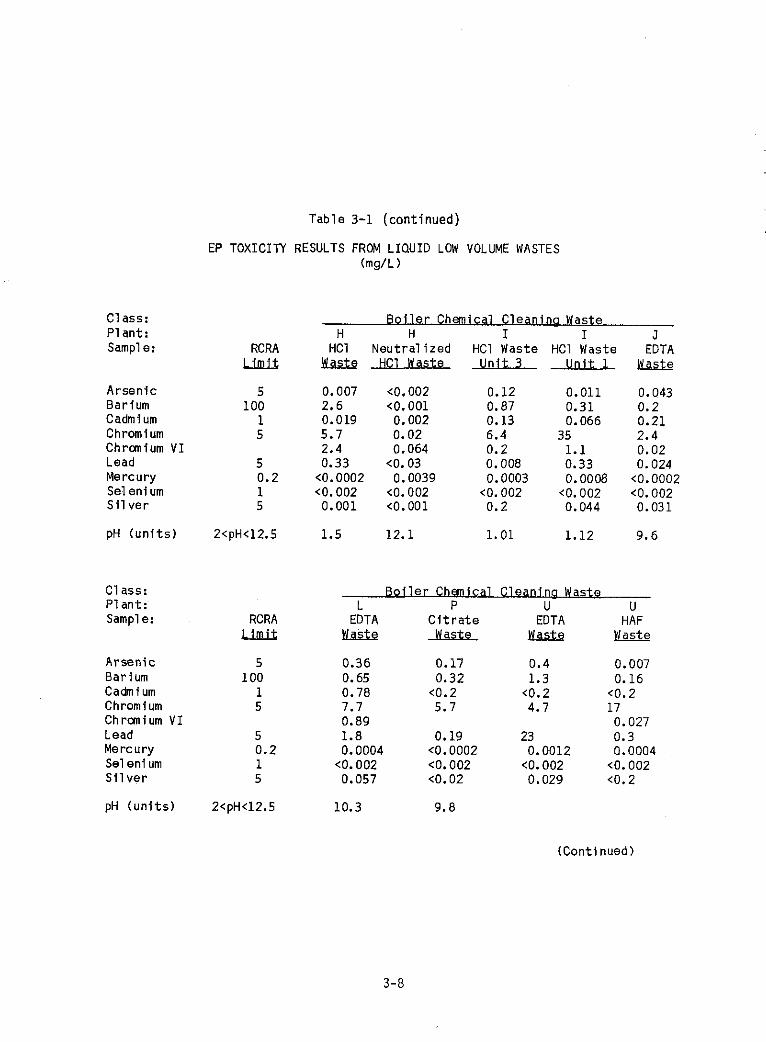
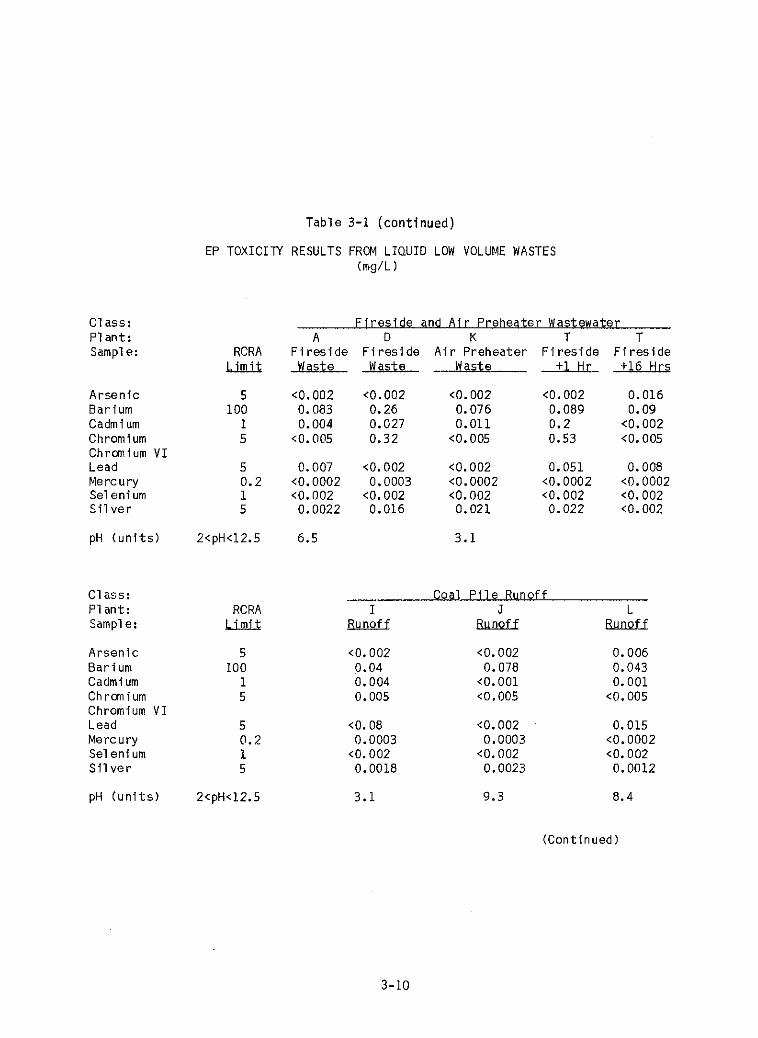
EP T o x i c i t y Resu l ts From L i q u i d Low Volume Wastes
EP T o x i c i t y Tes t Resu l t s f o r Low Volume Waste Sludges
Proposed T o x i c i t y C h a r a c t e r i s t i c Contaminants and Regulatory Leve ls
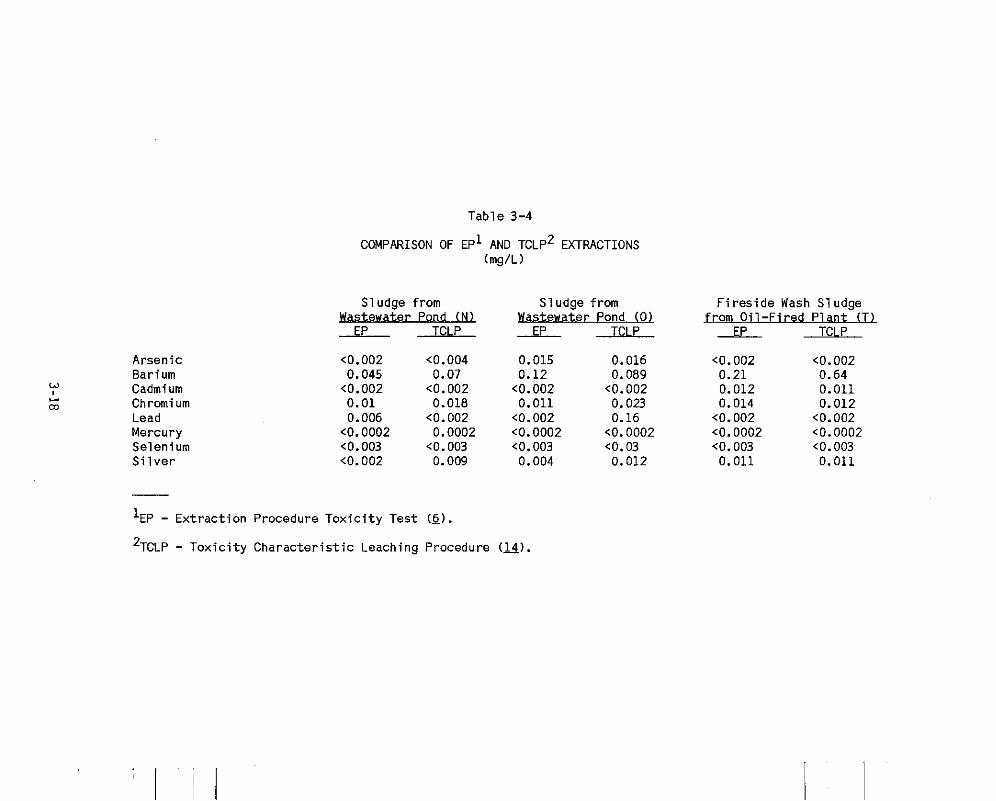
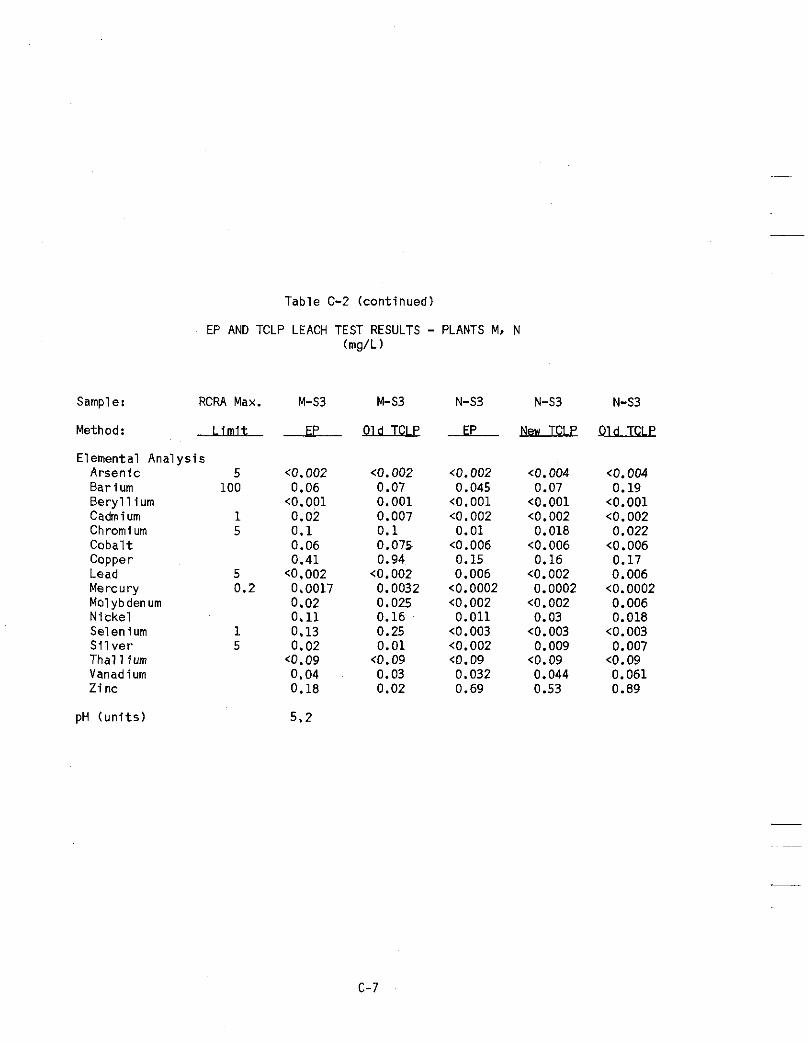
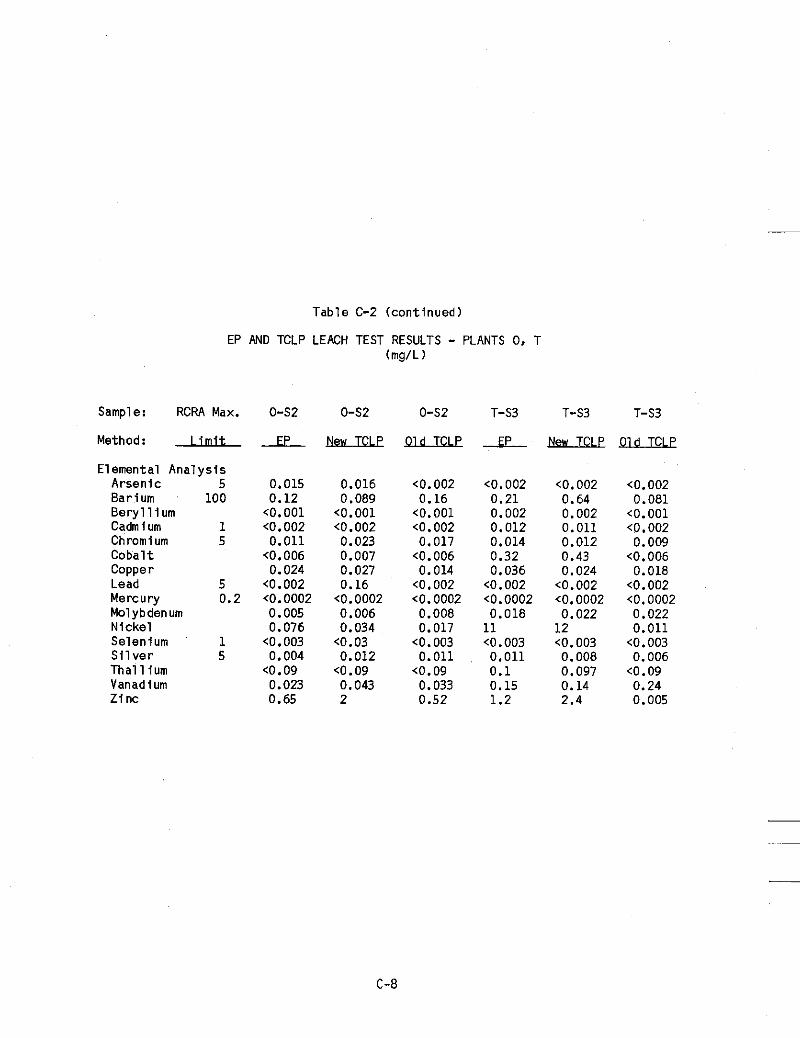
Comparison o f EP and TCLP E x t r a c t i o n s
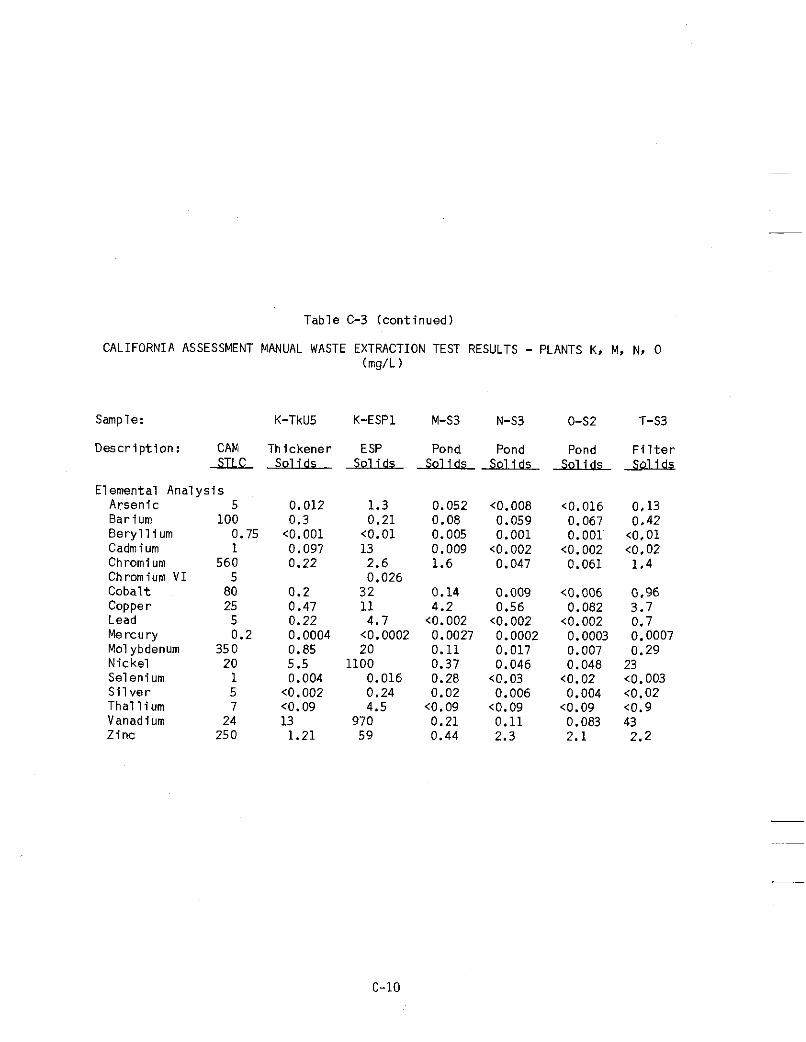
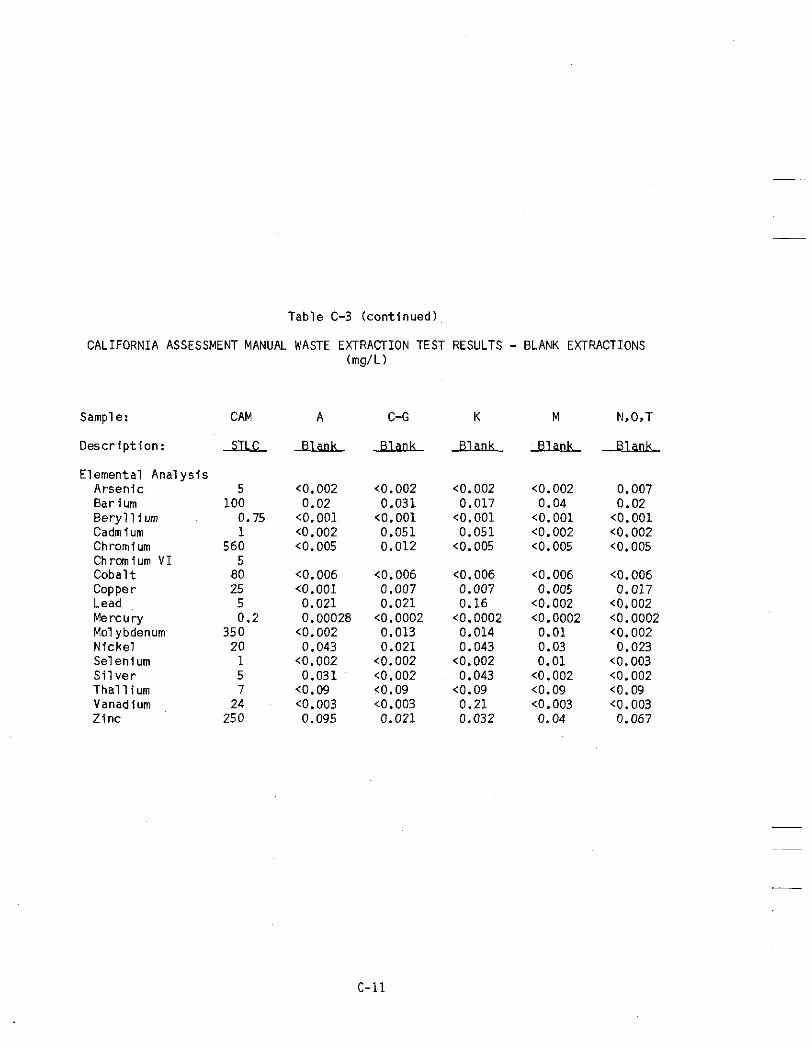
C a l i f o r n i a Waste E x t r a c t i o n Tes t (WET) Resu l t s
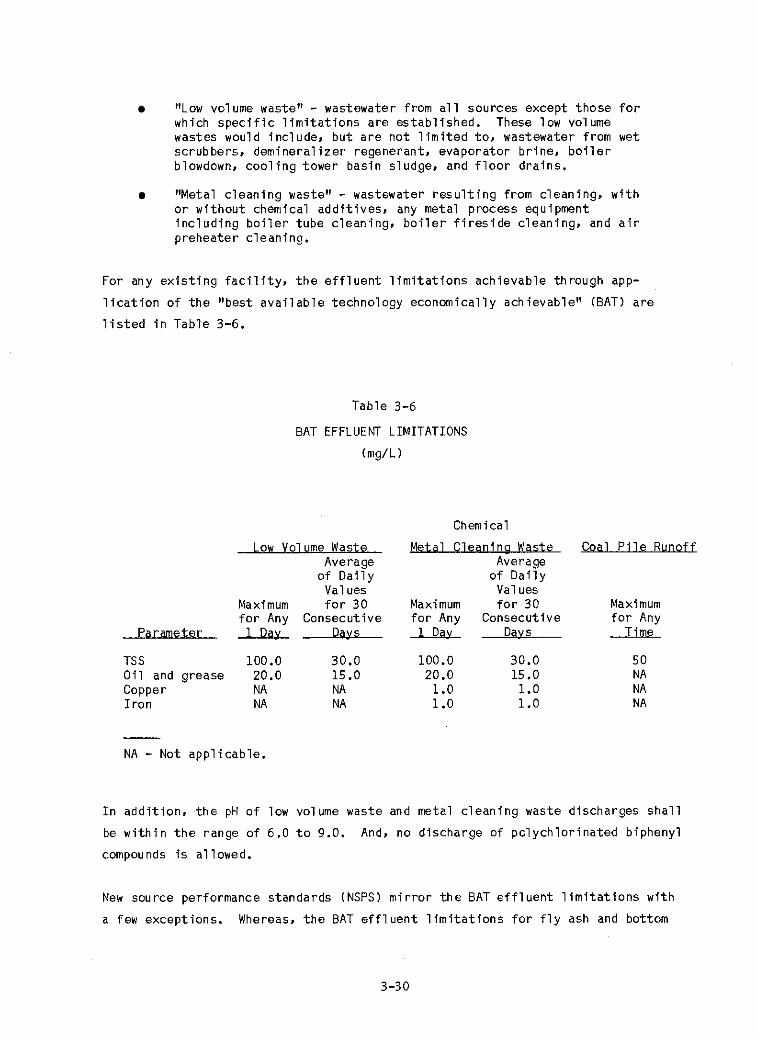
BAT E f f l u e n t L i m i t a t i o n s (mg/L)
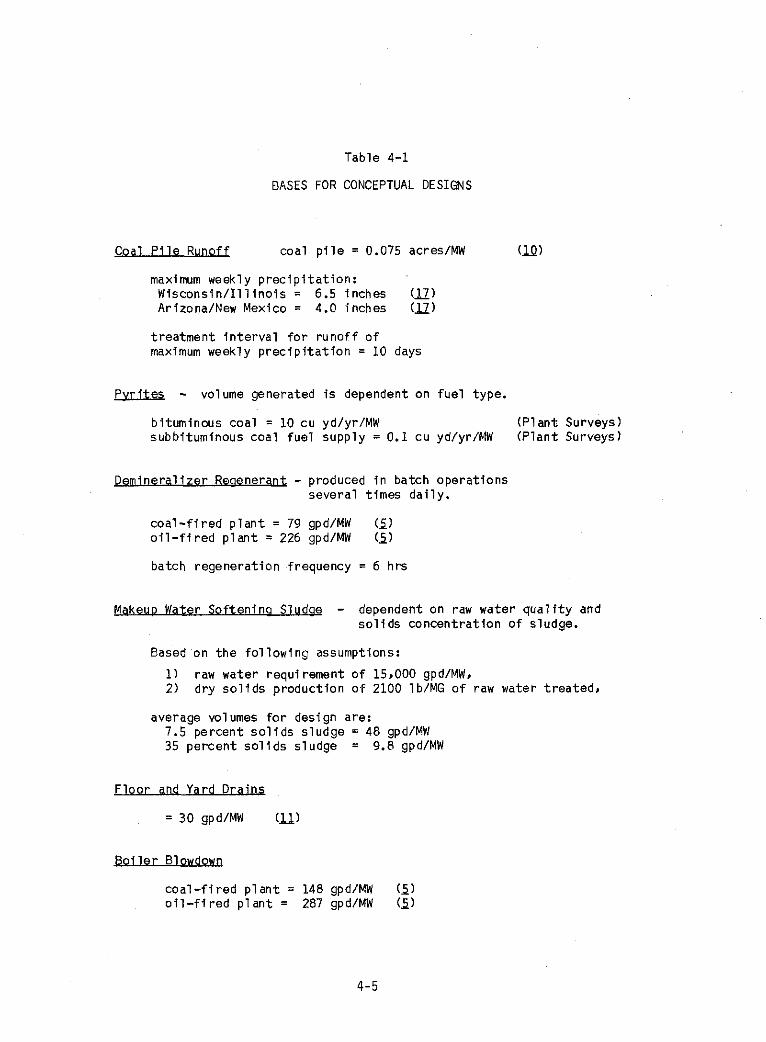
Bases for Conceptual Designs
T o t a l C a p i t a l Cost Es t ima t ion Methodology
Operat ing and Maintenance Cost Methodology
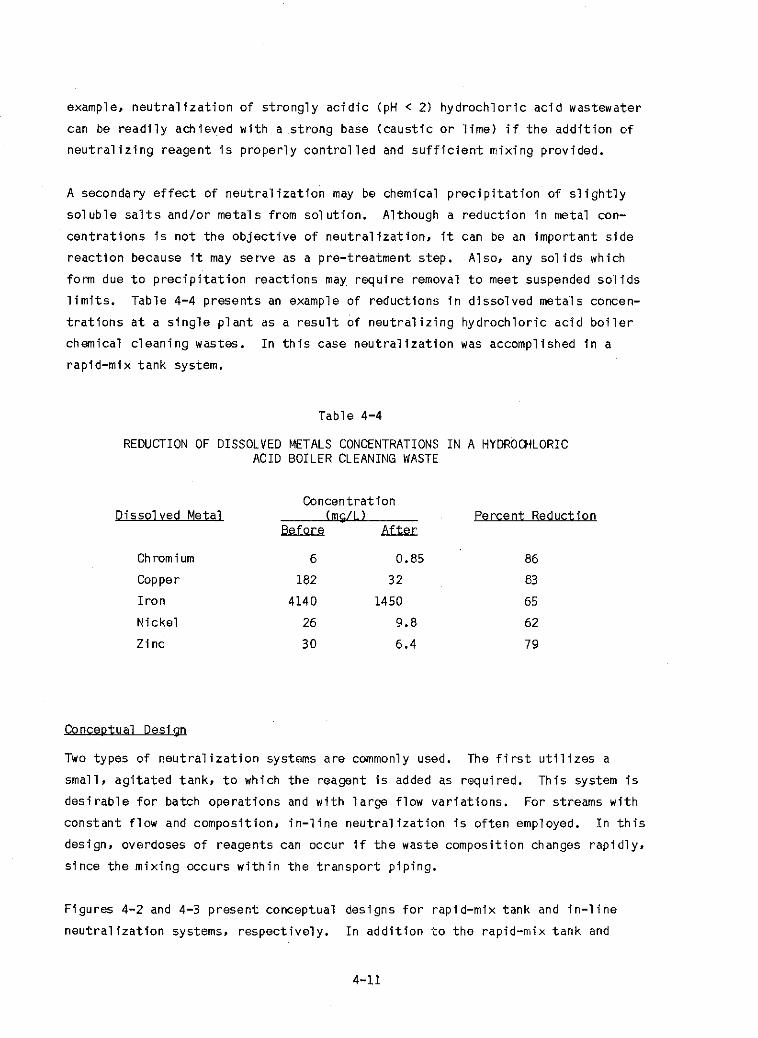
Reduction o f D isso lved Meta ls Concentrat ions i n a Hydroch lo r i c Ac id B o i l e r Cleaning Waste To ta l Cap i ta l Cost Es t ima t ion f o r Rapid-Mix Tank N e u t r a l i z a t i o n
2-3
2-7 2-10
2-12 2-14 2-16 2-18 2-20 2-21 2-22 2-26
2-28 2-31 2-32 2-34 2-38 3-7 3-12
3-17 3-18
3-22 3-30 4-5 4-7 4-9
4-11 4-16
xv
TABLES (Continued)
I?&&
4-6
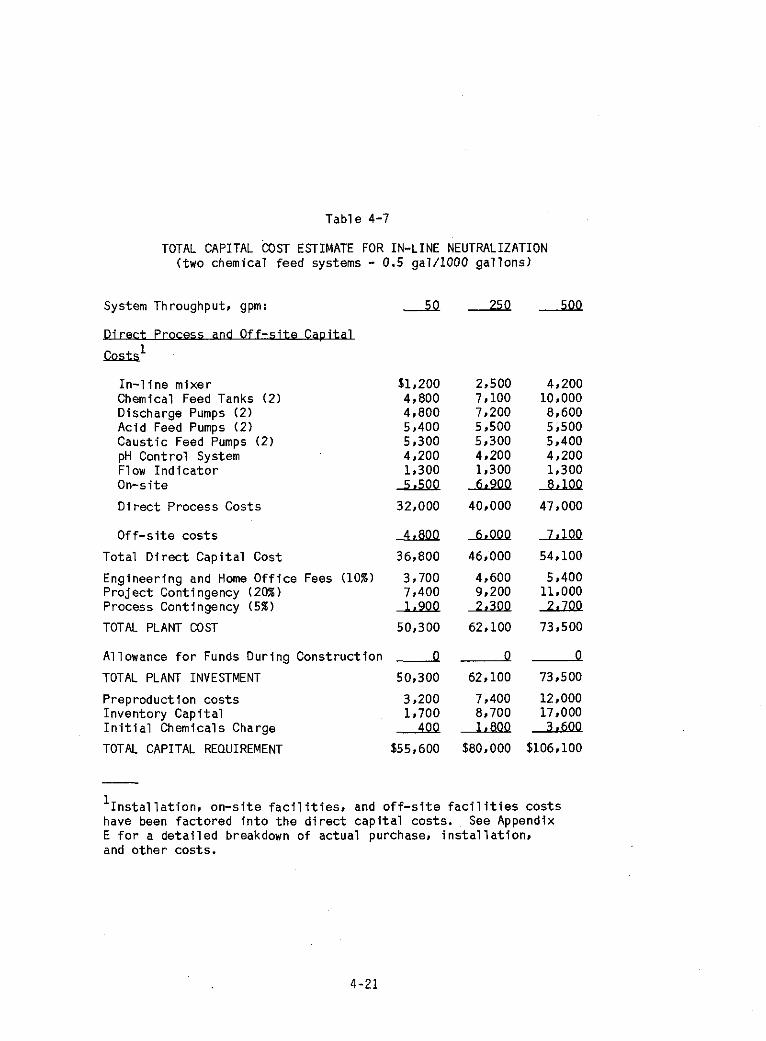
4-7
4 -8
4-9
4-10
4-11
4-12
4-13
4-14
4-15
4-16
4-17
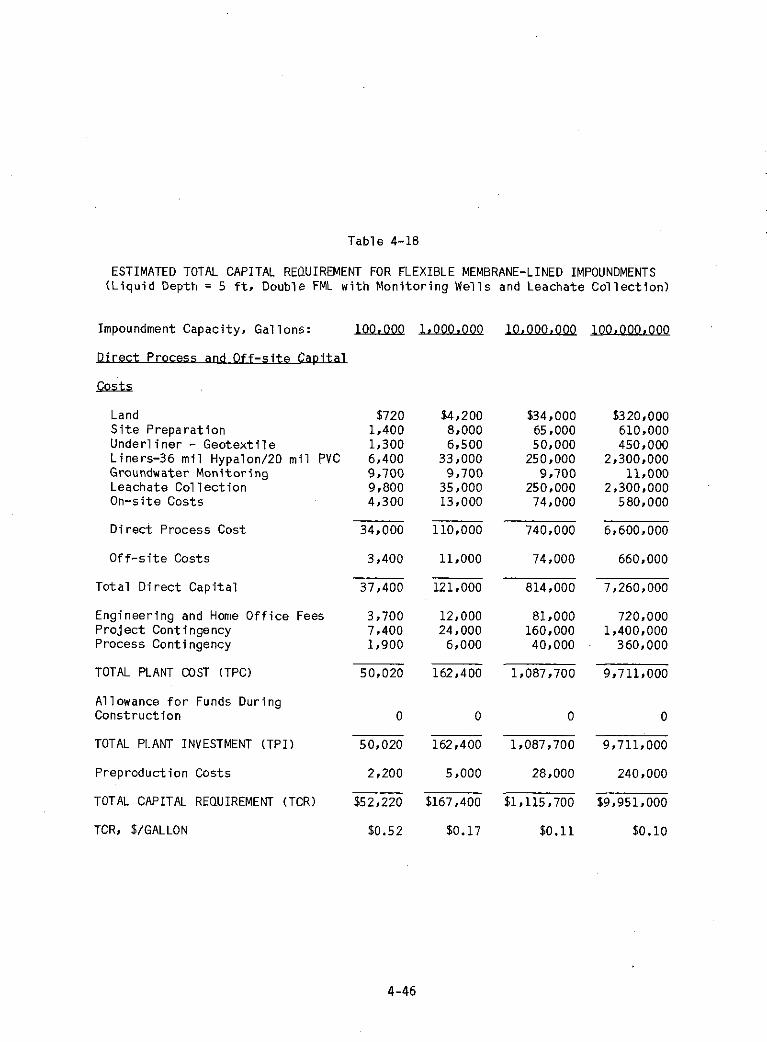
4-18
4-19
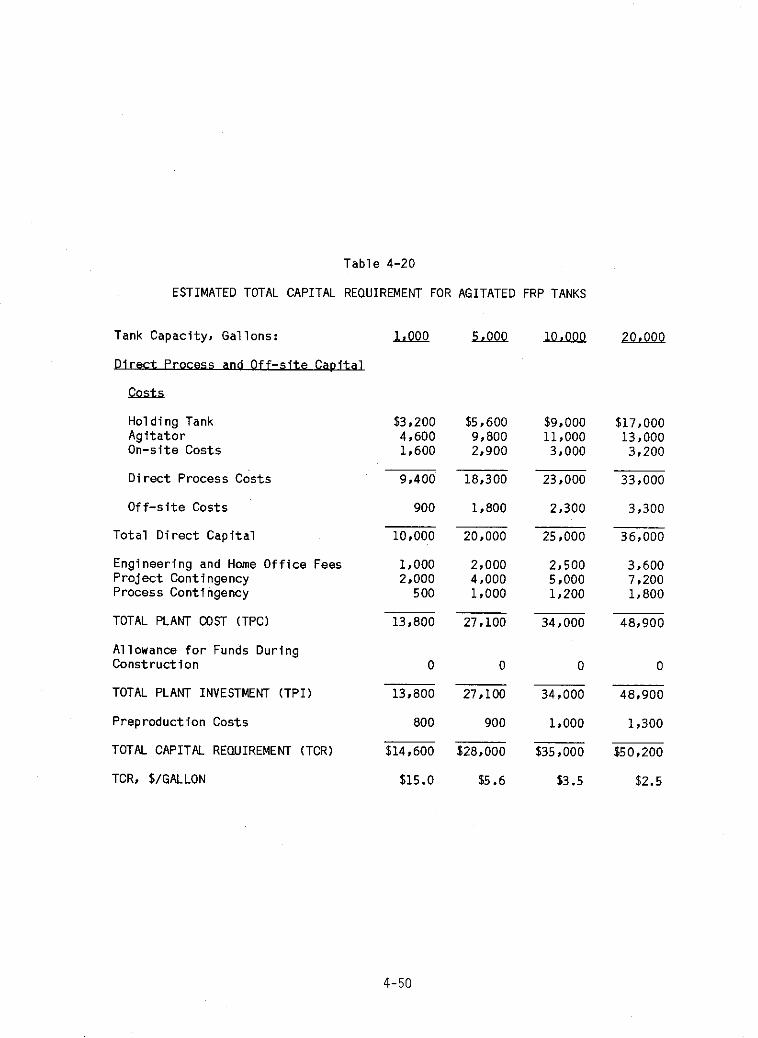
4-20
4-21
4-22
4-23
4-24
4-25
4-26
4-27
4-28
4-29
4-30
4-31
4-32
Est imated Operat ing and Maintenance Costs f o r Rapid-Mix Tank N e u t r a l i z a t i o n
T o t a l Cap i ta l Cost Est imated fo r In -L ine N e u t r a l i z a t i o n
Est imated Opera t ing and Maintenance Cost f o r I n -L ine N e u t r a l i z a t i o n
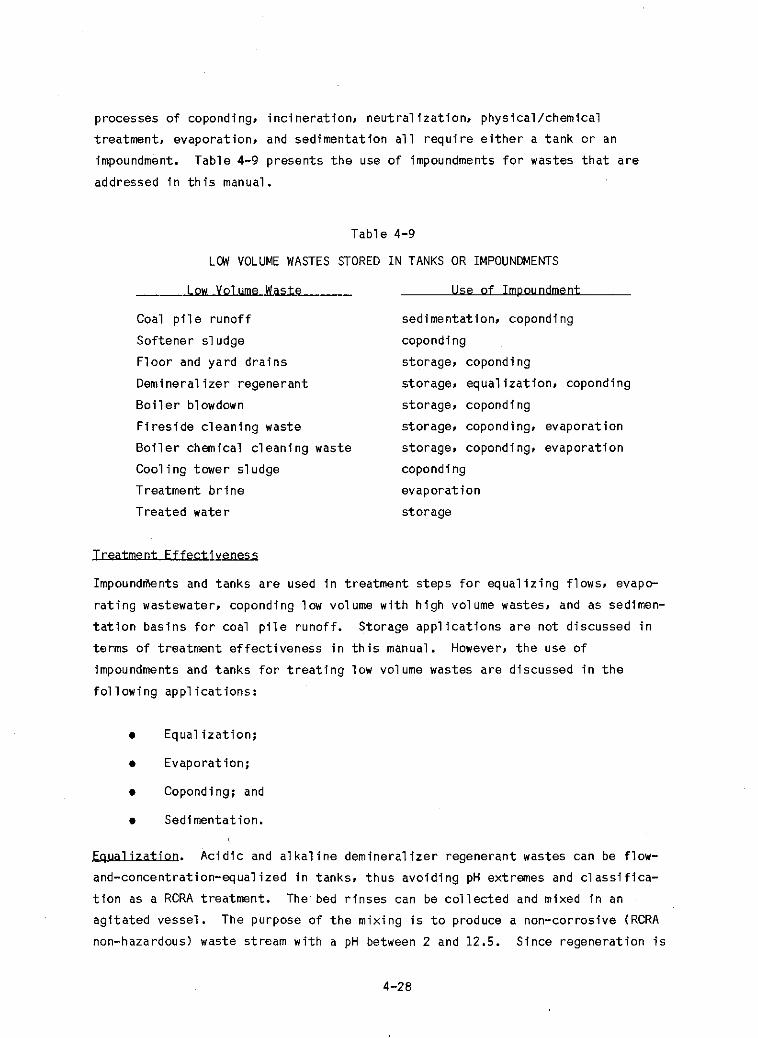
Low Volume Wastes Stored i n Tanks o r Impoundments
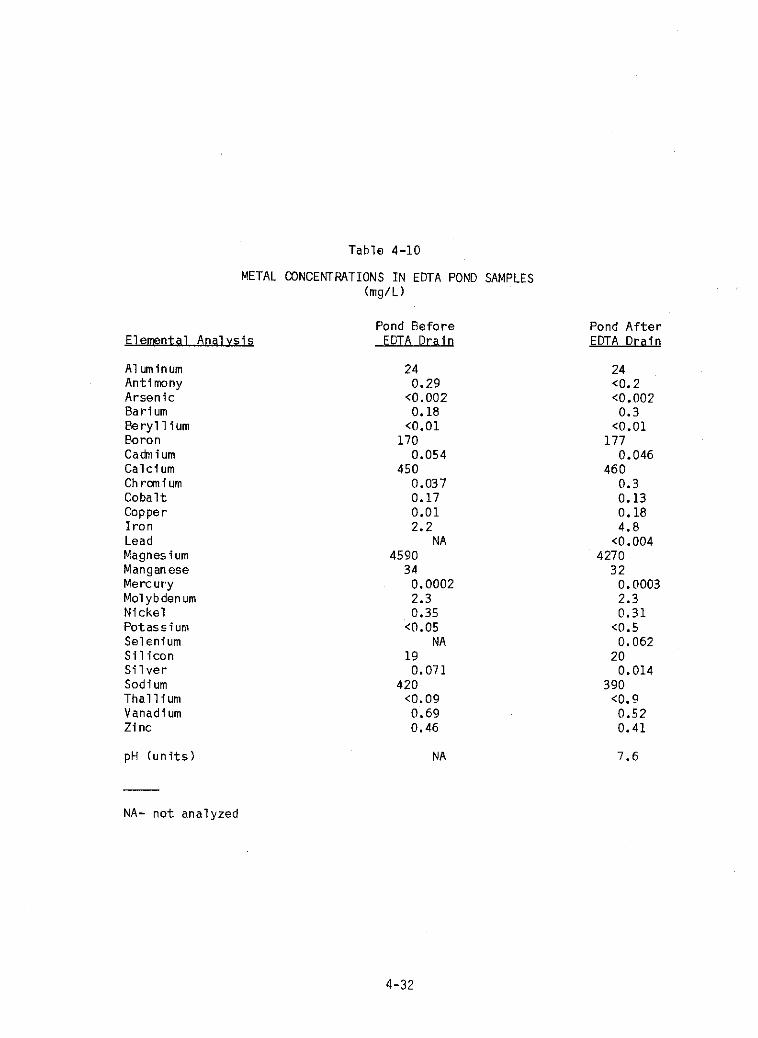
Metal Concentrat ions i n EDTA Pond Samples
Metal Concentrat ions i n C i t r a t e Pond Samples
Metal Concentrat ions i n Ash Pond Discharge Samples
Resu l t s o f Laboratory T r i a l s o f Coponding Treatment Methods
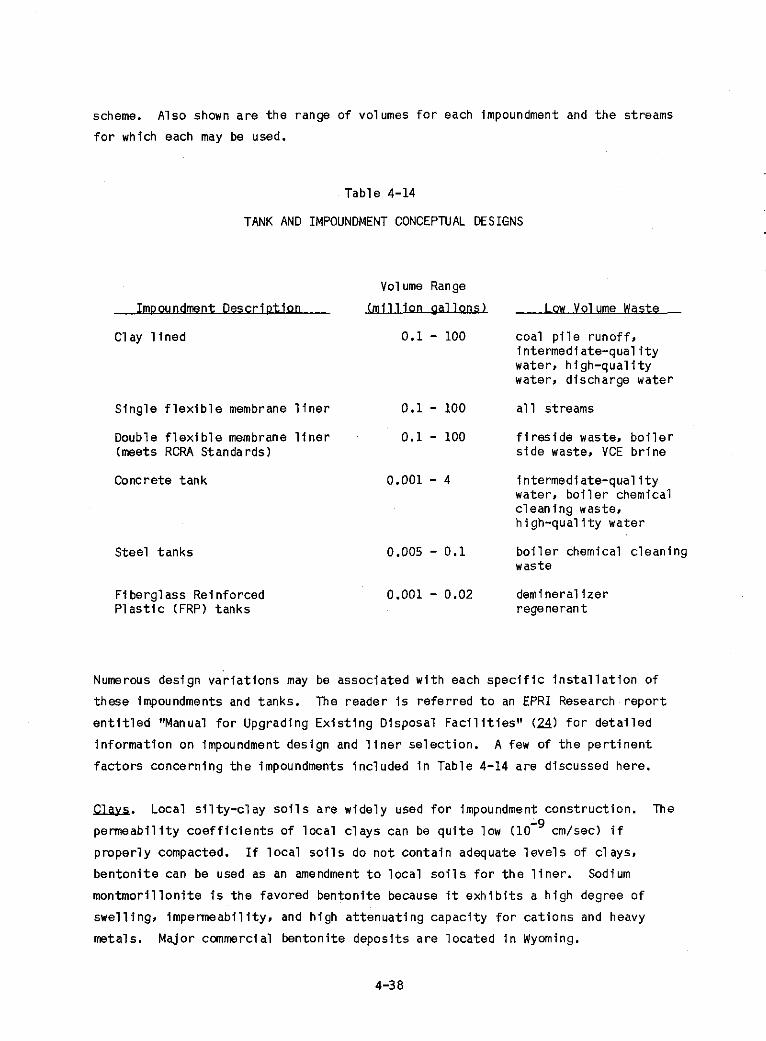
Tank and Impoundment Conceptual Designs
Costs o f F l e x i b l e Membrane L i n e r s
Est imated To ta l Cap i ta l Requirement f o r Clay-Lined Impoundments
Est imated T o t a l Cap i ta l Requirement f o r Clay-Lined Impoundments
Est imated T o t a l C a p i t a l Requirement f o r F l e x i b l e Membrane-Lined Impoundments
Est imated T o t a l C a p i t a l Requirement f o r F l e x i b l e Membrane-Lined Impoundments Est imated T o t a l C a p i t a l Requirement f o r Ag i ta ted FRP Tanks
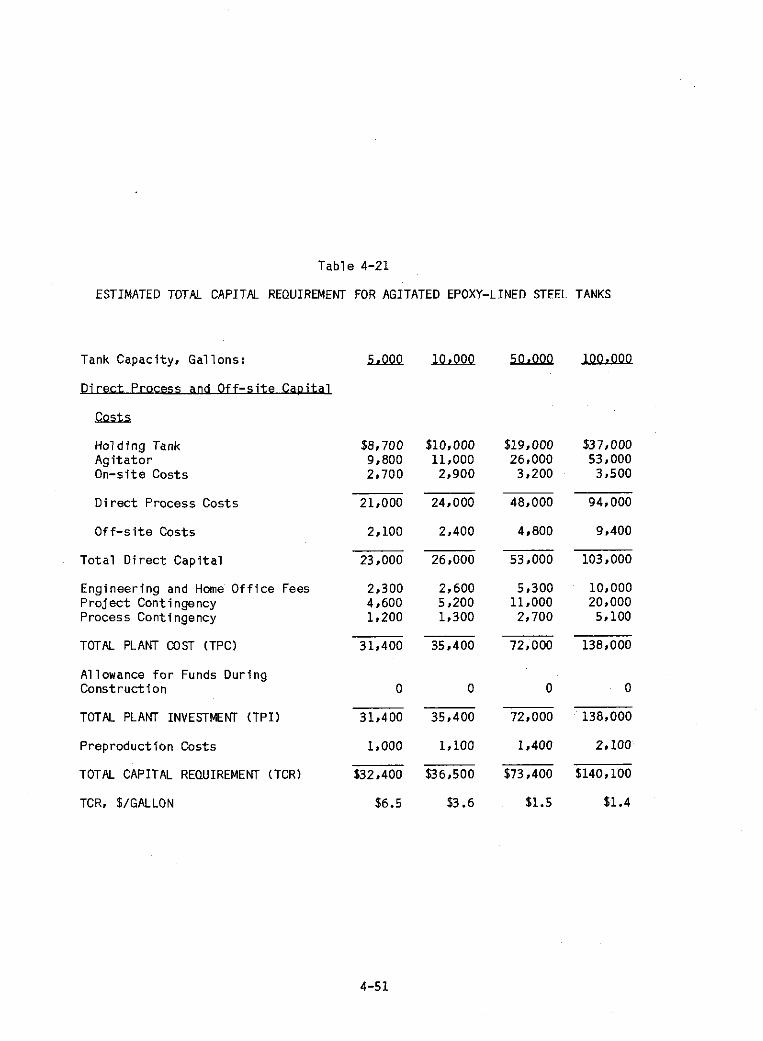
Est imated T o t a l C a p i t a l Requirement f o r Epoxy-Lined Stee l Tanks
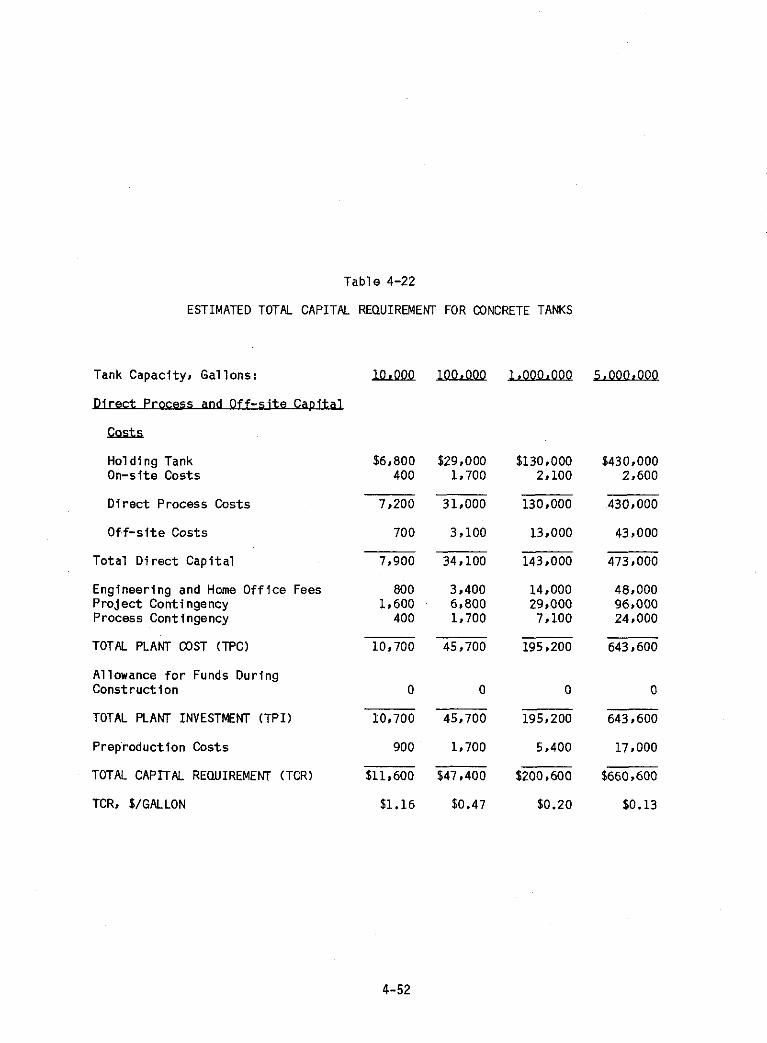
Est in iated T o t a l C a p i t a l Requirement f o r Concrete Sumps
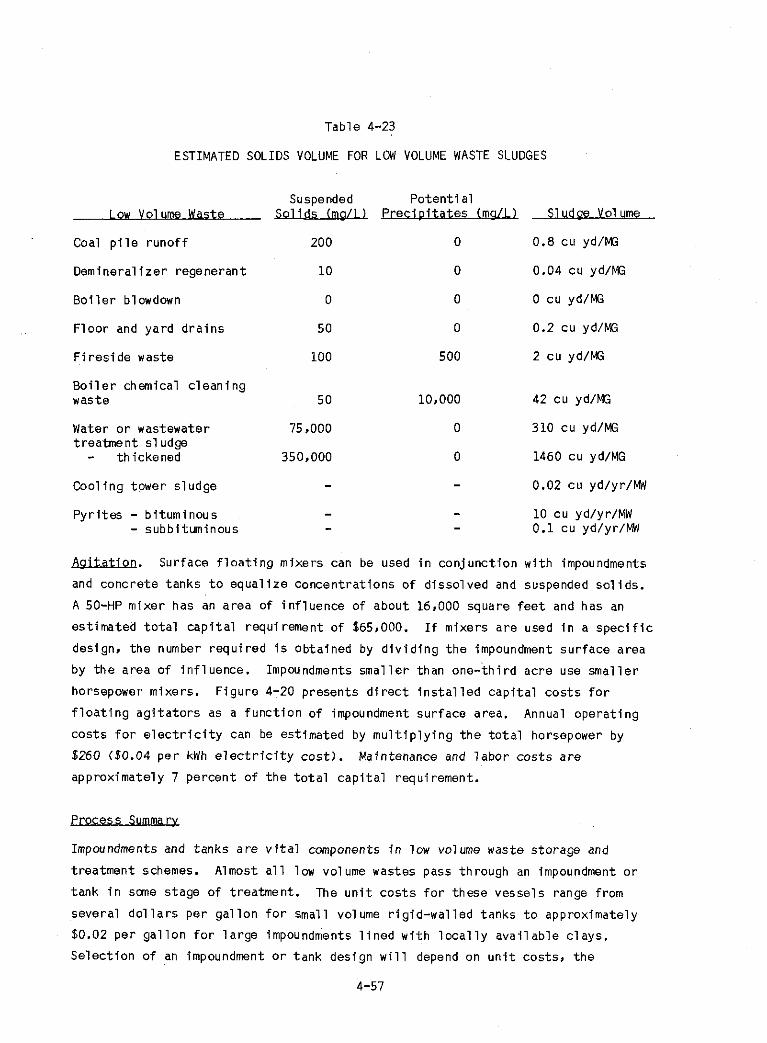
Est imated Sol i d s Vol ume For Low Vol ume Wastes S1 udges
F i e l d Resu l t s of Physical/Chemical Treatment o f B o i l e r Chemical Cleaning Wastes
Resu l t s of Labora tory Tes ts of Physical/Chemical Treatment Methods
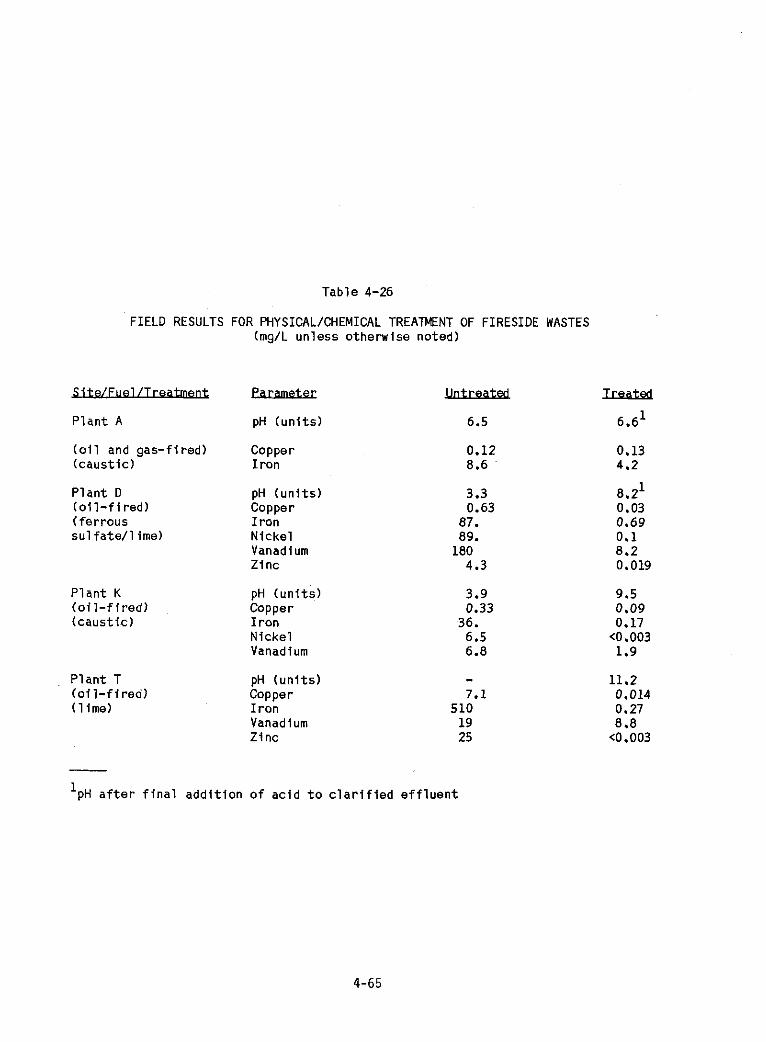
F i e l d Resu l t s for Physical/Chemical Treatment o f F i r e s i d e Wastes
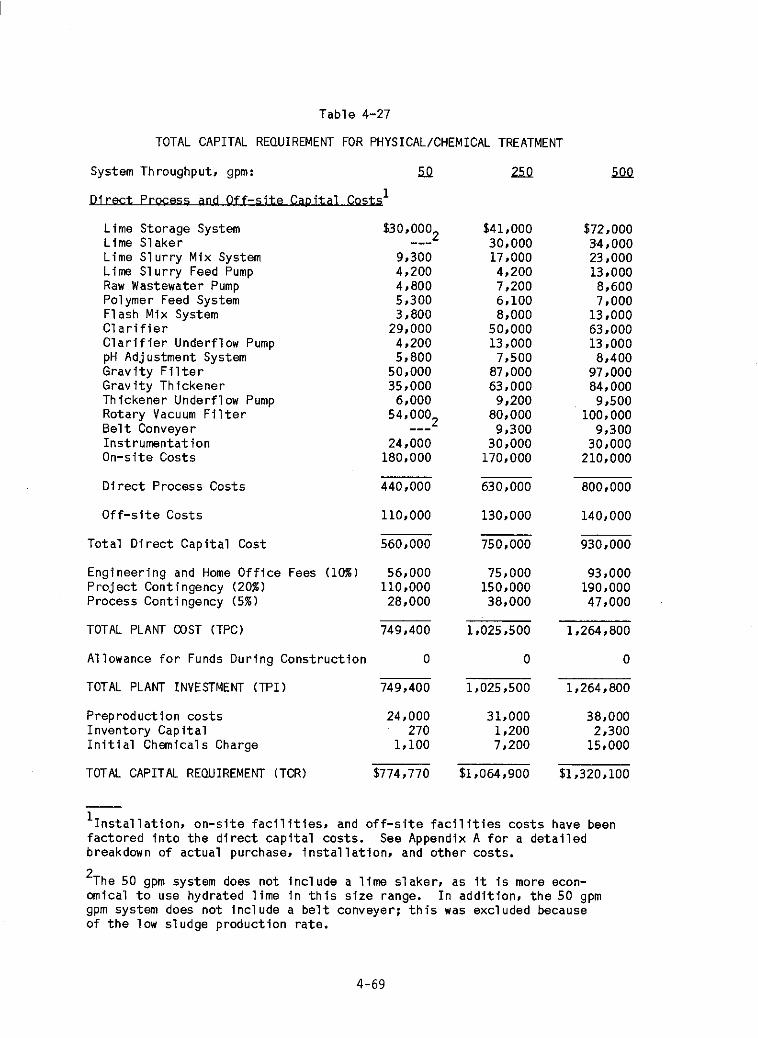
T o t a l C a p i t a l Requirement f o r Physical/Chemical Treatment
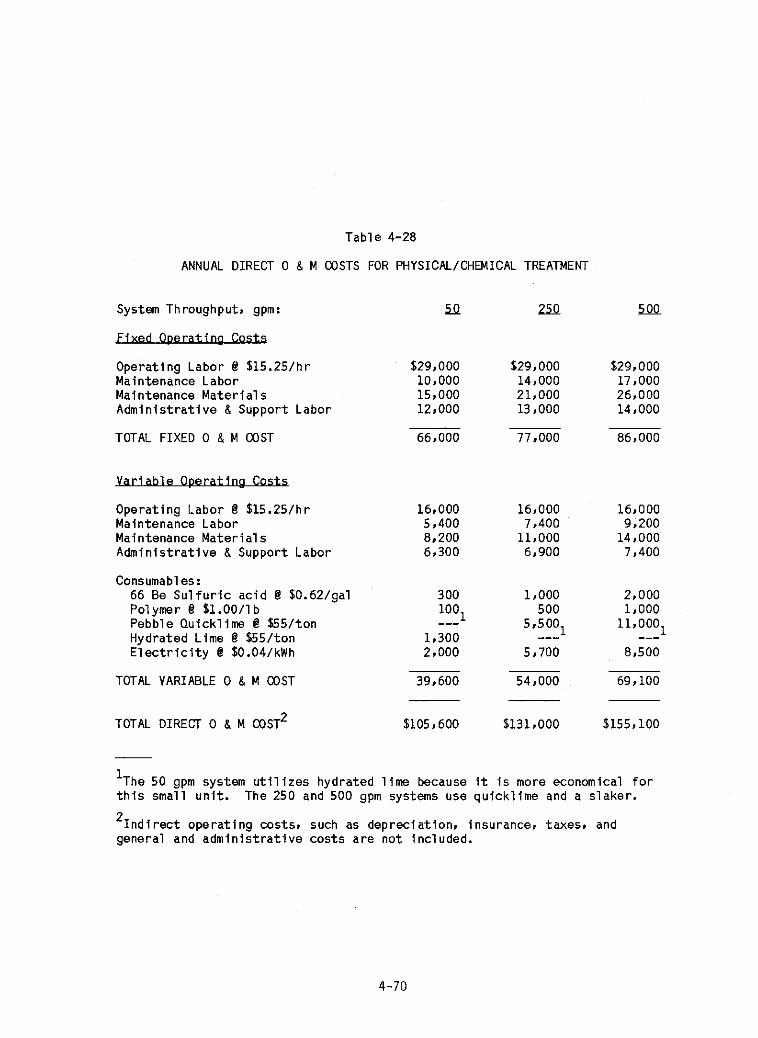
Annual D i r e c t 0 & M Costs f o r Physical/Chemical Treatment
EP T o x i c i t y Tes t Resu l t s on Low Volume Wastes Used i n Codlsposal Lab Study EP T o x i c i t y Tes t Resu l t s on Coal F l y Ashes Used i n Codisposal Lab Study
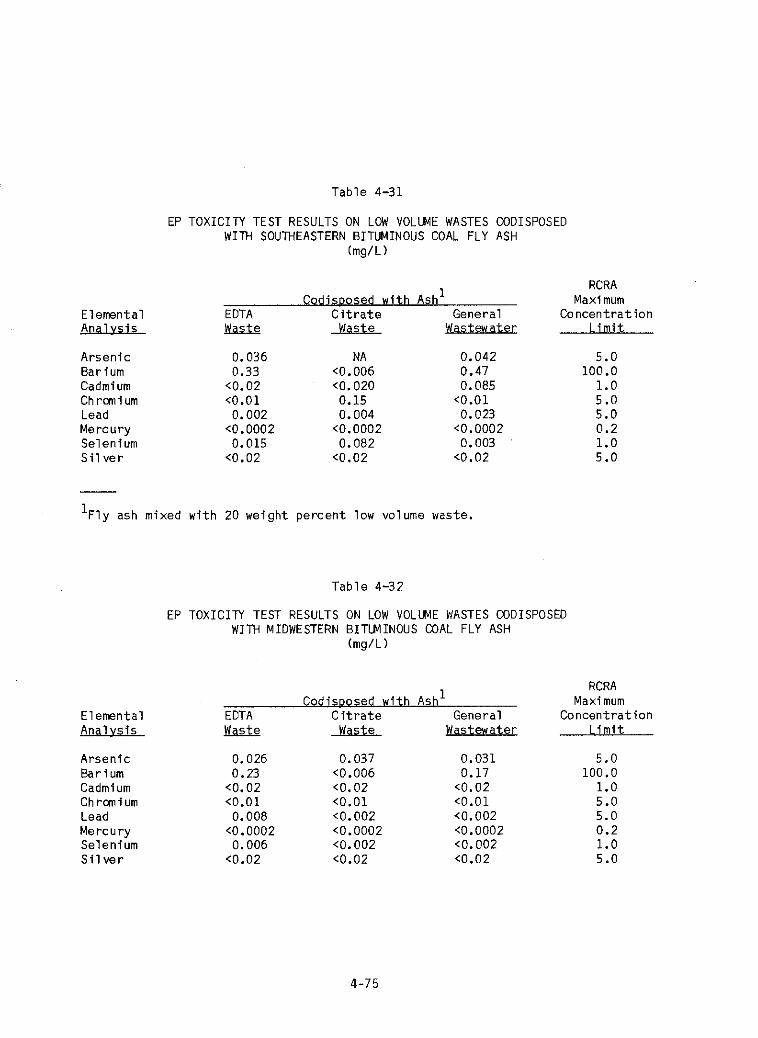
EP T o x i c i t y Tes t Resu l t s on Low Volume Wastes Codisposed w i t h Southeastern Bi tuminous Coal F l y Ash
EP T o x i c i t y T e s t Resu l t s on Low Volume Wastes Codisposed w i t h Midwestern Bi tuminous Coal F l y Ash
.&Is
4-17
4-21
4-22
4-28
4-32
4-33
4-35
4-36
4-38
4-40
4-42
4-43
4-46
4-47 4-50
4-51
4-52
4-57
4-61
4-63
4-65
4-69
4-70
4-74
4-74
4-75
4-75
xv i
TABLES (Continued)
4-33
4-34
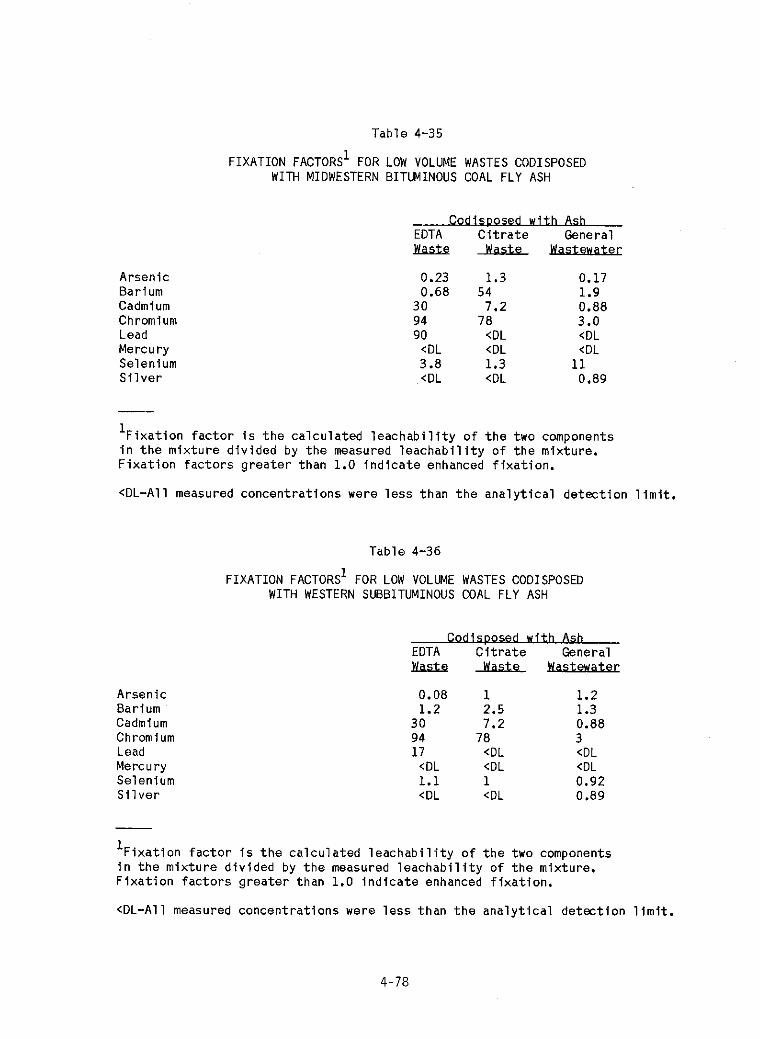
4-35
4-36
4-37
4-38
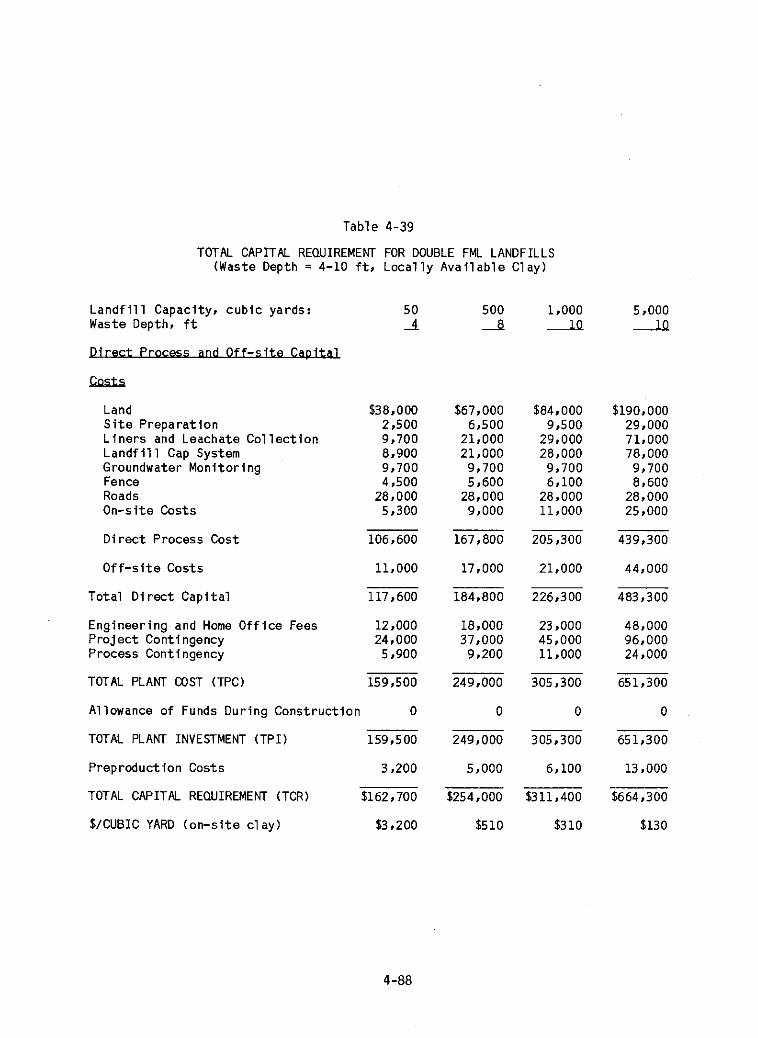
4-39
4-40
4-41
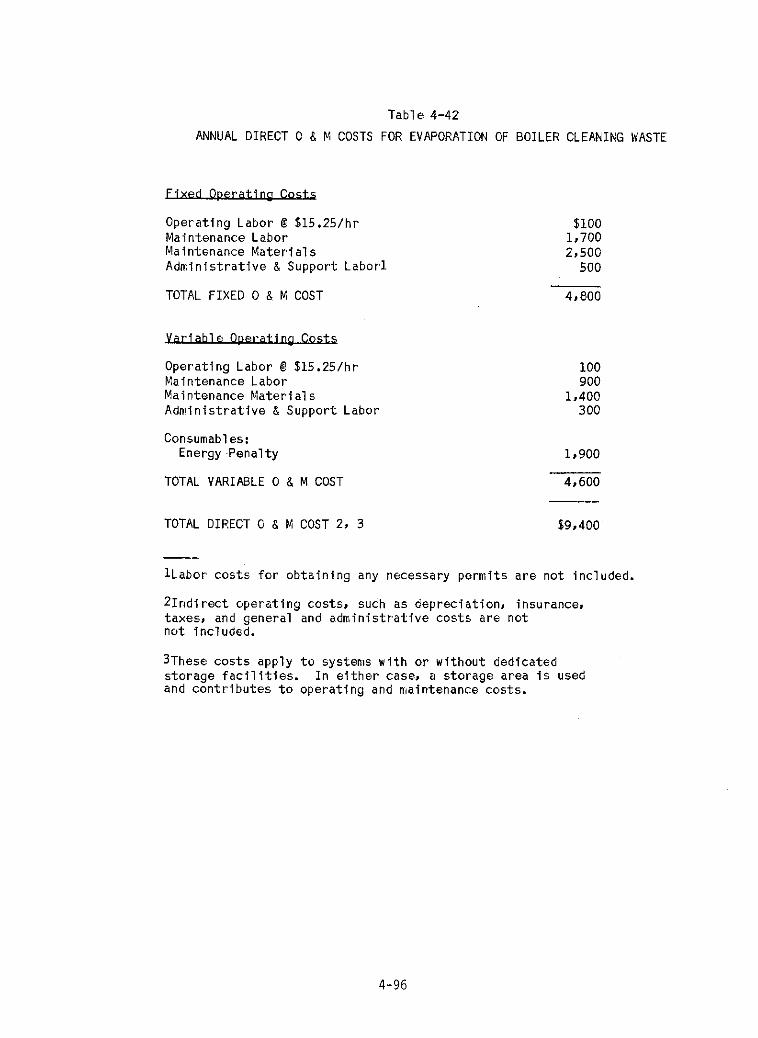
4-42
5-1
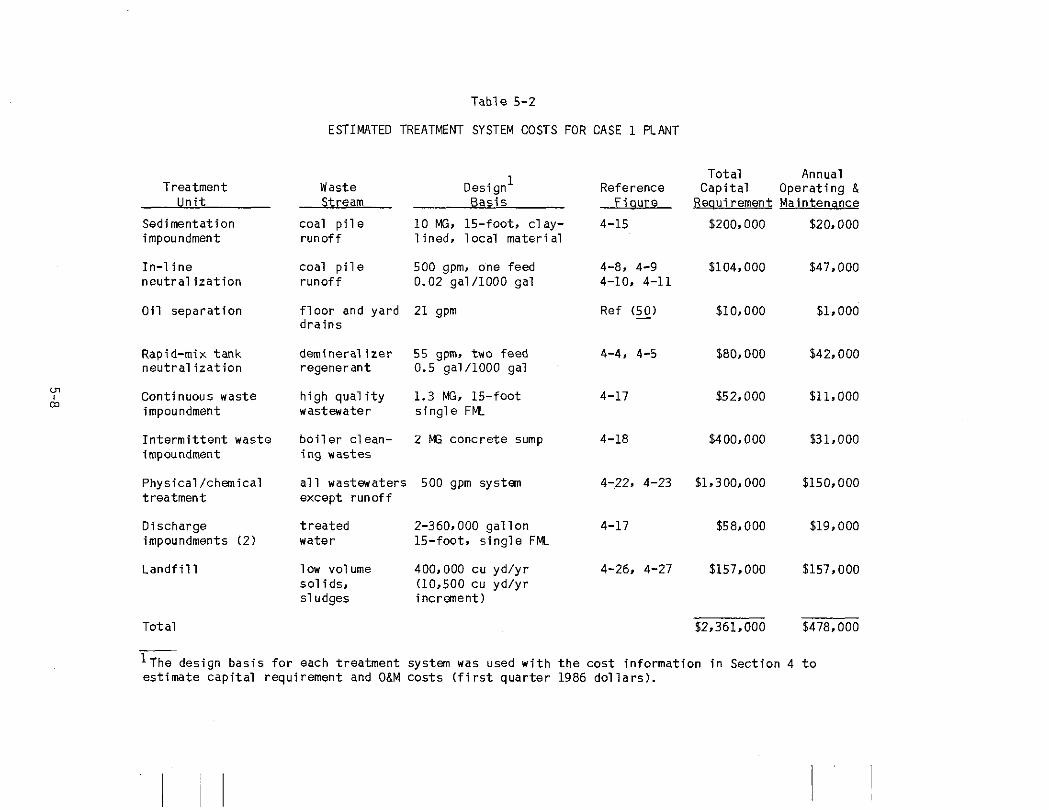
5-2
5-3
5-4
5-5
5-6
5-7
EP T o x i c i t y Tes t Resu l ts on Low Volume Wastes Codisposed w i t h Western Subbituminous Coal F l y Ash
F i x a t i o n Fac tors f o r Low Volume Wastes Codisposed w i t h Southeastern Bi tuminous Coal F l y Ash
F i x a t i o n Fac tors f o r Low Volume Wastes Codisposed w i t h Midwestern Bi tuminous Coal F l y Ash F i x a t i o n Fac to rs f o r Low Volume Wastes Codisposed w i t h Western Subbituminous Coal F l y Ash
Est imated T o t a l C a p i t a l Requirement f o r Clay-Lined L a n d f i l l s
Annual 0 8 M Cost f o r Clay-Lined L a n d f i l l s
T o t a l C a p i t a l Requirement f o r Double FML L a n d f i l l s
Annual D i r e c t 0 8 M Costs f o r Double FML L a n d f i l l s
Est imated T o t a l C a p i t a l Requirement for I n c i n e r a t i o n o f B o i l e r Cleaning Waste
Annual D i r e c t 0 8 M Costs f o r I n c i n e r a t i o n of B o i l e r Cleaning Waste
Model P l a n t Con f igu ra t i ons
Est imated Treatment System Costs f o r Case 1 P l a n t
Est imated Treatment System Costs f o r Case 2 P l a n t
Est imated Treatment System Costs f o r Case 3 P l a n t
Est imated Treatment System Costs f o r Case 4 P l a n t
Est imated Treatment System Costs f o r Case 5 P l a n t
Summary o f Low Volume Waste Management Costs f o r F i v e Case Study P l a n t s
4-76
4-76
4-78
4-78
4-84
4-85
4-88
4-89
4-95
4-96
5-2
5-8
5-13
5-18
5-23
5-28
5-29
x v i i
SUMMARY
F o s s i l f u e l - f i r e d power p l a n t s generate a number o f waste streams which a re
recycled. t reated, discharged o r disposed us ing a combination of opt ions. Th is
manual descr ibes sane of t h e c h a r a c t e r i s t i c s and management op t i ons f o r low
volume u t i l i t y wastes. S p e c i f i c low volume wastes i nc lude py r i t es . coal p i l e
runoff, l i m e sof tener sludge, f l o o r and yard drains, deminera l i zer regenerant.
b o i l e r blowdown. f i r e s i d e c lean ing waste, b o i l e r chemical c lean ing waste, c o o l i n g
tower bas in sludge. and sludges and br ines from wastewater treatment.
Because u t i 1 i t y low volume wastes have v a r i e d chemical compositions, c e r t a i n
wastes may r e q u i r e d i f f e r e n t methods o f t rea tment and d isposal . For example,
some low volume wastes may have r e l a t i v e l y h ighe r concent ra t ions of d isso lved
meta ls than others. Several o f t h e b o i l e r chemical c lean ing wastes (BCCW)
sampled had concent ra t ions o f metals. genera l l y chranium. which exceeded t h e
t o x i c i t y c r i t e r i a es tab l i shed under t h e Resource Conservation and Recovery Act
(RCRA) regu la to ry program. Analys is o f these wastes, however, i nd i ca ted t h a t t h e
BCCW samples which d i d exceed t h e regu la to ry l i m i t s f o r chromium d i d so because
of t he presence o f t r i v a l e n t chrwnium. n o t hexavalent chromium. Th is i s s ig-
n i f i c a n t because t h e RCRA r e g u l a t i o n s prov ide fo r a p e t i t i o n i n g process t o
exclude t r i v a l e n t chromium-containing wastes from RCRA r e g u l a t i o n if c e r t a i n
c o n d i t i o n s a re met.
s o l u t i o n s may, i n c e r t a i n s i t u a t i o n s , a l so exceed t h e t o x i c i t y c r i t e r i a
th resho lds es tab l i shed under RCRA because of c o r r o s i v i t y .
c h a r a c t e r i s t i c , however, can be avoided by n e u t r a l i z i n g these wastes i n l i n e o r
i n elementary n e u t r a l i z a t i o n u n i t s ( tanks) .
I n add i t ion . BCCW from t h e use of hyd roch lo r i c ac id c lean ing
T h i s c o r r o s i v i t y
Most low volume wastes r e q u i r e t reatment before they can be discharged.
charge t o sur face waters o r p u b l i c l y owned t rea tment works i s regulated under t h e
Federal Water P o l l u t i o n Cont ro l Act. as amended by t h e Clean Water Act (CWA).
The c r i t e r i a f o r discharge o f most low volume waste streams inc lude pH, t o t a l
suspended so l i ds , and o i l and grease. Chemical metal c lean ing wastes, such as
those from b o i l e r chemical cleaning. must meet c r i t e r i a f o r these parameters as
we l l as l i m i t s f o r copper and i r o n . D i f f e r i n g t rea tment and disposal methods may
r e s u l t i n d i f f e r e n t management requirements f o r low volume wastes. For example,
Dis-
s- 1
under Sec t ion 3001 of RCRA. u t i l i t y wastes generated p r i c a r i l y from t h e conibus-
t i o n of coal o r o the r f o s s i l f ue l s a re tempora r i l y exempt from hazardous waste
regu la t i on . T h i s s t a t u t o r y exc lus ion encompasses o the r u t i l i t y wastes, i n c l u d i n g
low volume wastes. which a re generated i n con junc t i on w i t h t h e burn ing o f f o s s i l
f u e l s and which a re codisposed o r co t rea ted w i t h coa l combustion wastes. There-
fore. low volume wastes which a re co t rea ted o r codisposed w i t h u t i l i t y coal
combustion wastes are exempt from hazardous waste regu la t ion .
A range of t rea tment op t i ons e x i s t s which can be broad ly grouped i n t o t h e f o l -
low ing ca tegor ies :
N e u t r a l i z a t i o n ;
0 Physica l /chemical t rea tment i nco rpo ra t i ng pH adjustment. p r e c i p i t a t i o n ,
Evaporat ion d i r e c t l y i n t h e b o i l e r .
Treatment i n impoundments and tanks;
f l occu la t i on , c l a r i f i c a t i o n . f i l t r a t i o n , and s o l i d s concentrat ion; and
The above op t i ons can be app l l ed t o t h e t reatment and disposal o f low volume
wastes us ing two fundamental approaches: 1) cons t ruc t i on o f dedicated t reatment
o r d isposa l f a c i l i t i e s f o r t h e low volume wastes o r 2) codisposal o f low volume
wastes w i t h h igh volume wastes such as coa l ash o r scrubber sludge.
gas - f i r ed p l a n t s on l y t h e f i r s t approach i s ava i l ab le .
a f f e c t i n g t h e t rea tment approach used a t c o a l - f i r e d p l a n t s i s t h e t ype o f ash
handl ing used.
t rea tment /d isposa l opt ion. The c a p i t a l and opera t i ng and maintenance cos ts
est imated i n t h i s manual f o r p l a n t s us ing coponding were s i g n i f i c a n t l y lower than
f o r p l a n t s us ing dedicated low volume waste t reatment and disposal f a c i l i t i e s .
A t o i l - and
The primary f a c t o r
Ash hand l ing a f f o r d s a cho ice because coponding can be used as a
Coponding can be an e f f e c t i v e t rea tment o p t i o n f o r many 3ow volume wastes.
However, f i e l d and labo ra to ry r e s u l t s from t h i s study showed t h a t t h e e f f e c t i v e -
ness o f t r e a t i n g low volume wastes i n ash ponds depends on t h e t ype o f low volume
waste and on t h e ash. The most d i f f i c u l t t o t r e a t wastes were t h e b o i l e r
chemical c lean ing wastes us ing c h e l a t i n g agents t o promote metal s o l u b i l i t y
(i.e., e thy lenediamine t e t r a a c e t i c ac id (EDTA) o r c i t r i c ac id ) . Based on labo-
r a t o r y tes ts . a l k a l i n e ash ponds are more e f f e c t i v e i n reducing i r o n and copper
l e v e l s t o t h e requ i red d ischarge l i m i t s than a re n e u t r a l or a c i d i c ash ponds.
s-2
Sect ion 1
INTRODUCTION
The vast m a j o r i t y of wastes produced a t f o s s i l f u e l - f i r e d power p l a n t s c o n s i s t o f
ash and sludge from a i r p o l l u t i o n c o n t r o l devlces. However, u t i l i t i e s a l s o
generate a number o f low volume wastes such as py r i t es . coa l p i l e runoff, l i m e
so f tene r sludge, f l o o r and yard drains, deminera l i zer regenerant, b o i l e r blow-
down, f i r e s i d e c lean ing waste, waters ide c lean ing waste ( b o i l e r chemical c lean ing
wastes), c o o l i n g tower basin sludge, and sludges and b r ines from wastewater
t reatment . These wastes vary cons iderab ly i n chemical c h a r a c t e r i s t i c s , q u a n t i t y
produced, and frequency o f generation.
The proper choice o f t rea tment and disposal methods f o r each waste should con-
s i d e r waste composition, c u r r e n t waste disposal and e f f l u e n t regu la t ions , costs.
and s i t e c h a r a c t e r i s t i c s . The 1984 amendments t o t h e Resource Conservation and
Recovery Ac t (RCRA) cou ld r e s u l t i n changes i n t h e management of some low volume
wastes.
cou ld cos t up t o $0.80 per g a l l o n o r more, versus convent ional t reatment cos ts
t h a t range from $0.05 t o $0.25 per ga l l on .
If a low volume waste i s c l a s s i f i e d as hazardous, o f f - s i t e disposal
The E l e c t r i c Power Research I n s t i t u t e (EPRI) i s sponsoring research t o a s s i s t
u t i l i t i e s i n t h e management o f low volume wastes. T h i s research (RP2215) has
inc luded: 1) c o l l e c t i n g and ana lyz ing low volume waste samples from coal-. o i l - ,
and gas - f i red power p lan ts ; 2) determin ing t rea tment and disposal requirements
necessary t o meet fede ra l regu la t ions ; and 3 ) c h a r a c t e r i z i n g t h e performance o f
t reatment processes c u r r e n t l y p rac t i ced by t h e e l e c t r i c u t i l i t y indus t ry . Th i s
i n fo rma t ion was used t o develop t h i s manual.
PURPOSE
The purpose o f t h i s manual i s t o p rov ide in fo rmat ion f o r u t i l i t y managers and
engineers t o develop s t r a t e g i e s f o r cos t -e f fec t i ve management o f l o w volume
wastes w h i l e meeting t h e c u r r e n t regu la to ry requirements f o r environmental
p ro tec t i on .
1-1
Previous EPRI research charac ter ized low volume wastes and commonly p r a c t i c e d
t rea tment and disposal methods (1 - 4). Much of t h e i n fo rma t ion presented i n
t h i s manual i s a r e s u l t o f a sampling and ana lys i s e f f o r t t o cha rac te r i ze t h e
composit ion of d i f f e r e n t low volume wastes from over 20 power p lan ts . Based on
t h i s e f f o r t and e a r l i e r research, low volume wastes were i d e n t i f i e d which might
present problems t o u t i l i t i e s i n meeting regu la t i ons such as RCRA and t h e Federal
Water P o l l u t i o n Cont ro l Ac t (FWPCA). Some low volume wastes may have t h e charac-
t e r i s t i c s of hazardous waste based on RCRA gu ide l i nes f o r t o x i c i t y and c o r r o s i -
v i t y . However, c e r t a i n s t a t u t o r y and regu la to ry p rov i s ions a l low these wastes
and t h e i r res idua ls t o be handled i n such a manner t h a t they are not c l a s s i f i e d
as hazardous. These p rov i s ions o f t e n al low u t i l i t y opera tors t o avoid t h e RCRA
regu la to ry process.
Performance da ta were a l s o c o l l e c t e d du r ing t h e sampling and ana lys i s e f f o r t t o
determine t h e e f fec t i veness of var ious a l t e r n a t i v e s i n t r e a t i n g low volume
wastes. These data i n d i c a t e t h a t same low volume wastes are more d i f f i c u l t t o
t r e a t than others. T h i s manual presents t rea tment approaches and conceptual
designs t o meet e f f l u e n t l i m i t s .
a re a l s o presented.
The associated cos ts o f t h e conceptual designs
An e f f e c t i v e low volume waste management system must a l s o consider s i t e - s p e c i f i c
fac to rs d i c t a t e d by fue l type, p l a n t loca t ion , and p l a n t design. Th is manual
prov ides examples of how t h e low volume waste management system can be i n teg ra ted
i n t o t h e o v e r a l l p l a n t a i r , water, and s o l i d waste management systems. The
examples cons ider such va r iab les as fue l t ype (coal , o i l ) . p l a n t l o c a t i o n (east-
e r n and western Un i ted Sta tes) , federal and reg iona l r e g u l a t i o n s (NSPS requ i re -
ments f o r f l u e gas d e s u l f u r i z a t i o n (FGD), reg iona l requirements f o r zero d i s -
charge), and p l a n t design (wet versus dry f l y ash handling. e t c ) .
ORGANIZATION OF MANUAL
The manual i s organized t o f a c i l i t a t e i t s use i n develop ing management p lans f o r
low volume wastes. Low volume waste c h a r a c t e r i s t i c s . i n c l u d i n g q u a n t i t i e s
generated and t h e i r compositions, a re presented i n Sec t ion 2. Most in fo rmat ion
i n t h a t sec t i on i s based on sampling and ana lys i s a c t i v i t i e s conducted du r ing t h e
course of t h e p ro jec t . These data a re supplemented by i n fo rma t ion i n o the r
p u b l i c a t i o n s desc r ib ing u t i l i t y low volume wastes.
Sec t ion 3 presents c u r r e n t regu la t i ons addressing low volume waste handling.
treatment. and d isposal , i n c l u d i n g regu la t i ons enacted by RCRA and FWPCA. Th is
1-2
sec t i on r e l a t e s t h e r e g u l a t i o n s t o t h e low volume waste c h a r a c t e r i s t i c s presented
e a r l i e r i n Sec t ion 2 . Sect ion 3 a l s o presents t h e r e s u l t s o f s o l i d waste c l a s s i -
f i c a t i o n s based on RCRA and se lec ted s t a t e procedures.
E x t r a c t i o n Procedure ( c u r r e n t regu la t i ons ) and t h e proposed T o x i c i t y Charac ter is -
t i c Leaching Procedure (proposed regu la t i ons ) a r e presented.
Data from both t h e RCRA
Treatment methods f o r low volume wastes a r e discussed i n Sec t ion 4, and inc lude:
N e u t r a l i z a t i o n ;
Treatment i n impoundments and tanks; i n c l u d i n g coponding w i t h h igh volume waste, pond evaporation, sedimentation, and storage;
Phys ica l /chemical treatment; i nco rpo ra t i ng pH adjustment, p r e c i p i - t a t i o n . f l occu la t i on , c l a r i f i c a t i o n , f i l t r a t i o n . and so l i d s concentrat ion;
L a n d f i l l i n g ; separate, c o l a n d f i l l i n g w i t h h igh volume waste. and cont rac ted d isposal ; and
Evaporat ion d i r e c t l y i n a b o i l e r .
Discussed f o r each t rea tment method are: 1) t h e a p p l i c a b i l i t y o f a t rea tment
method t o a g iven waste stream; 2) t rea tment e f fec t i veness as determined from
f i e l d and l a b o r a t o r y measurements; 3 ) conceptual designs of t h e t reatment sys-
tems; and 4 ) t rea tment c o s t s (Class I1 p r e l i m i n a r y c o s t est imates f o r t h e con-
ceptual designs presented).
Sec t ion 5 discusses t h e i n t e g r a t i o n of low volume waste management w i t h t h e
o v e r a l l p l a n t a i r . water. and s o l i d waste management systems. Case s tud ies f o r
f i v e model p l a n t s a re presented as i l l u s t r a t i o n s of how t o use t h e i n fo rma t ion
presented i n t h e prev lous sec t i ons of t h e manual.
u r a t i o n s a r e exaniples se lec ted t o i l l u s t r a t e t h e use o f t h e manual f o r a v a r i e t y
o f common t rea tment scenarios.
These case s tudy p l a n t con f ig -
The appendices p rov ide d e t a i l e d in fo rmat ion and a n a l y t i c a l data from t h e charac-
t e r i z a t i o n work performed i n t h i s p r o j e c t . Also, t h e bas i s f o r c o s t est imates i n
Sec t ion 4 i s conta ined i n t h e appendices.
1-3
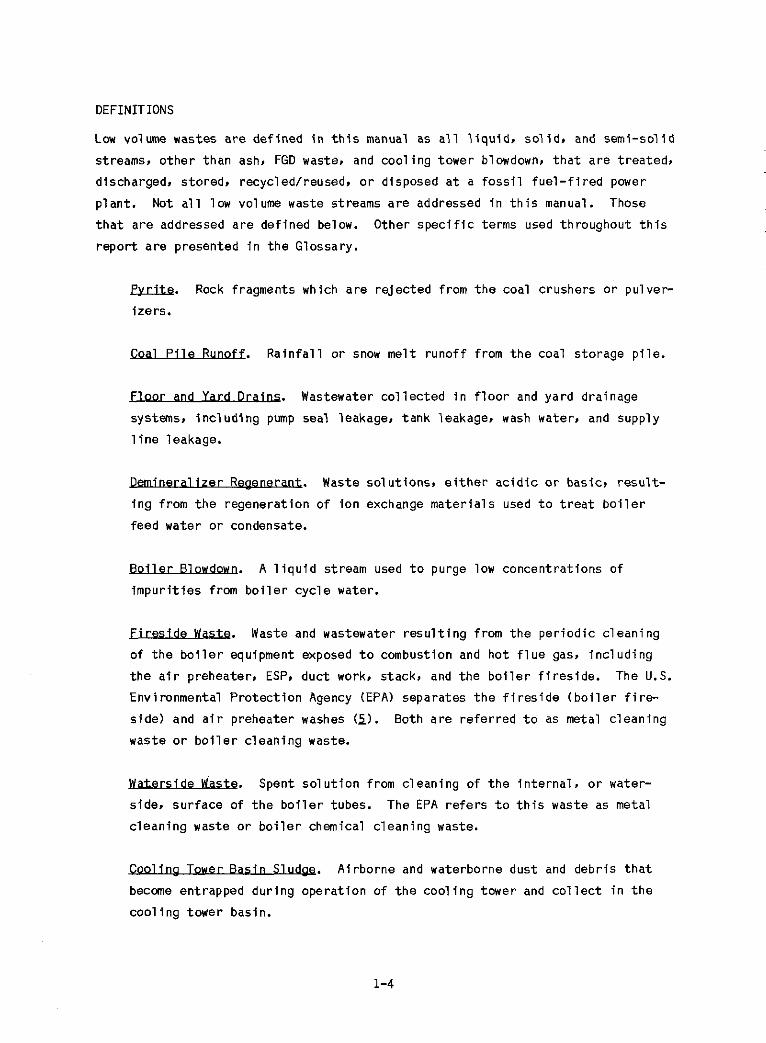
DEFINITIONS
Low volume wastes a r e de f i ned i n t h i s manual as a l l l i q u i d . s o l i d , and semi -so l id
streams, o the r than ash, FGD waste, and c o o l i n g tower blowdown, t h a t a r e t rea ted ,
discharged, stored, recycled/reused, o r disposed a t a f o s s i l f u e l - f i r e d power
p lan t . Not a l l low volume waste streams a r e addressed i n t h i s manual. Those
t h a t a re addressed a r e de f ined below.
r e p o r t a r e presented i n t h e Glossary.
Other s p e c i f i c terms used throughout t h i s
m. i ze rs .
Rock fragments which a r e r e j e c t e d from t h e coal crushers o r pu lver -
Cm1 P i l e Runaff. R a i n f a l l o r snow me l t runof f from t h e coal s torage p i l e .
Elwr and Yard Drains.
systems, i n c l u d i n g pump seal leakage, tank leakage, wash water, and supply
1 i n e leakage.
Wastewater c o l l e c t e d i n f l o o r and yard drainage
a1 i z e r R e . Waste so lu t ions , e i t h e r a c i d i c o r basic, r e s u l t -
i n g from t h e regenera t ion of i o n exchange m a t e r i a l s used t o t r e a t b o i l e r
feed water o r condensate.
Boiler. A l i q u i d stream used t o purge low concent ra t ions o f
i m p u r i t i e s from b o i l e r c y c l e water.
Fireside. o f t h e b o i l e r equipment exposed t o combustion and h o t f l u e gas, i n c l u d i n g
t h e a i r preheater, ESP, duc t work, stack, and t h e b o i l e r f i r e s i d e . The U.S.
Environmental P r o t e c t i o n Agency (EPA) separates t h e f i r e s i d e ( b o i l e r fire-
s ide) and a i r preheater washes (5). Both a r e r e f e r r e d t o as metal c lean ing
waste o r b o i l e r c lean ing waste.
Waste and wastewater r e s u l t i n g from t h e p e r i o d i c c lean ing
U t e r s i d e ULnrte. Spent s o l u t i o n from c lean ing o f t h e i n t e r n a l , o r water-
side. su r face o f t h e b o i l e r tubes. The EPA re fe rs t o t h i s waste as metal
c lean ing waste o r b o i l e r chemical c lean ing waste.
QsiLtng Tower Bas in Sludge. A i rborne and waterborne dus t and debr is t h a t
become entrapped du r ing opera t i on of t h e c o o l i n g tower and c o l l e c t i n t h e
c o o l i n g tower basin.
1-4
k i i e w a t e r Treatment Sludges and Br ines. Sludges and b r i n e s produced from
processes t r e a t i n g e i t h e r water o r wastewater.
LIMITATIONS OF MANUAL
The major l i m i t a t i o n s of t h i s manual r e s u l t f rom t h e c o n s t a n t l y changing regula-
t o r y c l fmate. F u t u r e changes i n RCRA or FWPCA c o u l d a l t e r s t r a t e g i e s f o r man-
ag ing low volume wastes. As much as poss ib le , t h e manual addresses c u r r e n t
r e g u l a t i o n s and cons iders p o s s i b l e f u t u r e r e g u l a t i o n s . For example, t h e r e s u l t s
of t h e proposed T o x i c i t y C h a r a c t e r i s t i c Leaching Procedure (TCLP) a r e presented
f o r numerous wastes, a l though t h e ac tua l procedure and r e g u l a t o r y l i m i t s have n o t
been adopted. However. sane u n c e r t a i n t y I n t h e r e g u l a t o r y f u t u r e i s unavoidable.
I n a d d i t i o n , t h e manual does n o t a t tempt t o address a l l p o s s i b l e t r e a t m e n t
approaches o r a l t e r n a t i v e s . S i t e - s p e c i f i c f a c t o r s may present o t h e r t rea tment
op t ions , and u t i l i t i e s , vendors, and eng ineer ing f i r m s may i d e n t i f y and develop
a l t e r n a t i v e , i n n o v a t i v e t rea tment schemes for develop ing new c o s t - e f f e c t i v e
management plans.
1-5
Sect ion 2
UTILITY LOW VOLUME WASTE CHARACTERISTICS
Dur ing t h e process o f combusting f o s s i l f u e l s t o generate e l e c t r i c i t y , power
p l a n t s produce several waste o r by-product streams. The g rea tes t volumes of
waste r e s u l t f rom t h e c o n t r o l o f p a r t i c u l a t e and s u l f u r d i o x i d e (SO2) emissions
produced by f o s s i l f u e l combustion. These streams a re o f t e n c l a s s i f i e d as h i g h
volume wastes: bottom a s h / f l y ash, and f l u e gas d e s u l f u r i z a t i o n (FGD) wastes.
A d d i t i o n a l l y , c o o l i n g tower blowdown i s o f t e n considered a h i g h volume waste
stream. Th is manual focuses on t h e low volume wastes which are generated.
Eleven s p e c i f i c streams have been i d e n t i f i e d as low'volume wastes and a re
discussed i n t h i s sec t ion :
P y r i t e s B o i l e r chemical c lean ing wastes Coal p i l e r u n o f f Coo l ing tower basin sludge F l o o r and ya rd d r a i n s Treatment sludges and b r i n e s Deniineral i z e r regenerant San i ta ry wastes B o i l e r blowdown Waste o i l s F i r e s i d e wastes
The low volume wastes generated a t each p l a n t depend on fac to rs such as fuel,
geographic l o c a t i o n , environmental regu la t i ons , and o the r s i t e - s p e c i f i c
cons idera t ions . Many of these wastes a re generated cont inuous ly d u r i n g p l a n t
opera t ion . Streams such as demineral i z e r regenerant, f l o o r and yard drains,
water and wastewater t rea tment sludges, b o i l e r blowdown, and s a n i t a r y wastes are
e i t h e r generated cont inuous ly o r a re f r e q u e n t l y produced i n batch volumes du r inc
t h e opera t i on o f t h e power p l a n t .
outages f o r equipment maintenance. These s t r e a m inc lude f i r e s i d e and b o i l e r
chemical c lean ing wastes, and c o o l i n g tower bas in sludge. A d d i t i o n a l l y . some
p l a n t s may generate o t h e r low volume wastes, f o r example. wastes c o n t a i n i n g
so l ven ts and p a i n t sludges. These wastes a re n o t discussed here.
Other streams are generated du r ing scheduled
Prev ious E P R I research on u t i l i t y low volume wastes examined t h e chemical
c h a r a c t e r i s t i c s of a v a r i e t y of low volume waste streams (1). Based on t h i s
screening study, t h r e e types of wastes were found t o con ta in r e l a t i v e l y h igher
concent ra t ions o f metals than many o t h e r low volume wastes. Th is f i n d i r l g was
based on t h e r e s u l t s of t o x i c i t y t e s t i n g by t h e U.S. Environmental Proi.ectior1
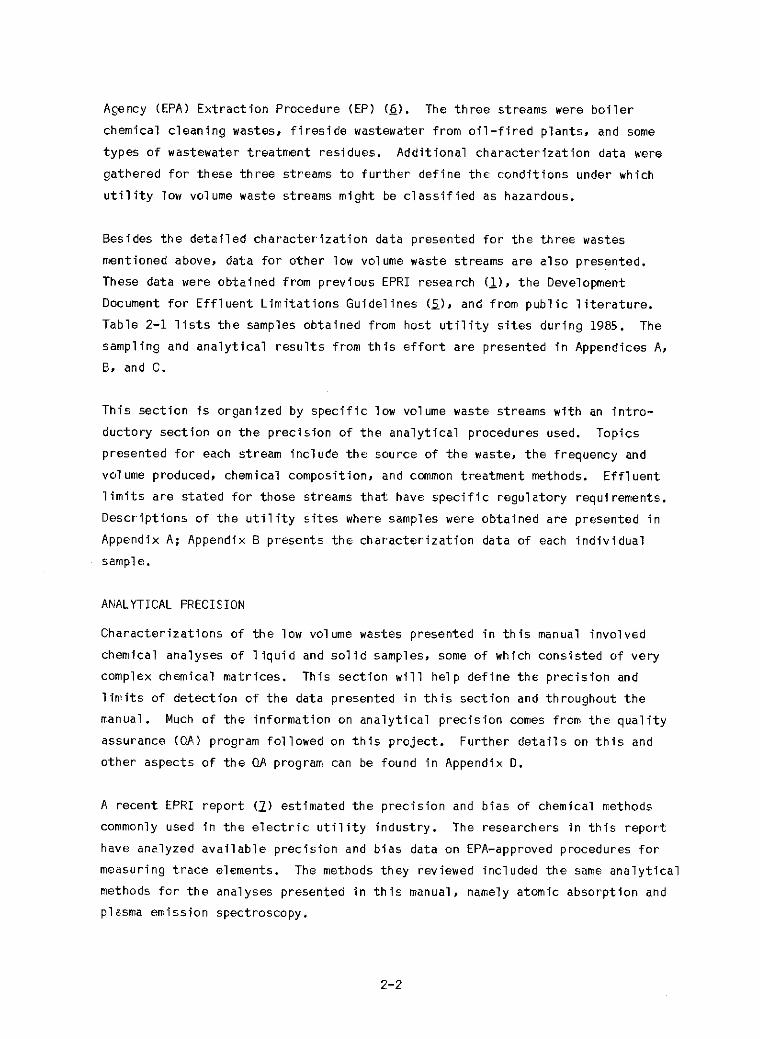
2-1
Agency (EPA) E x t r a c t i o n Procedure (EP) (6 ) . The t h r e e streams were b o i l e r
chemical c l e a n i n g wastes, f i r e s i d e wastewater f rom o i l - f i r e d plants, and some
t ypes o f wastewater t reatnient residues. A d d i t i o n a l c h a r a c t e r i z a t i o n data "ere
gathered f o r these t h r e e streams t o f u r t h e r d e f i n e t h e c o n d i t i o n s under which
u t i l i t y low volume waste streams might be c l a s s i f i e d as hazardous.
Besides t h e d e t a i l e d c h a r a c t e r i z a t i o n data presented f o r t h e t h r e e wastes
mentioned above, data f o r o the r low volume waste streams a re a l s o presented.
These data were ob ta ined from prev ious EPRI research (L), t h e Development
Document fo r E f f l uen t L i m i t a t i o n s Gu ide l ines (5) . and from p u b l i c l i t e r a t u r e .
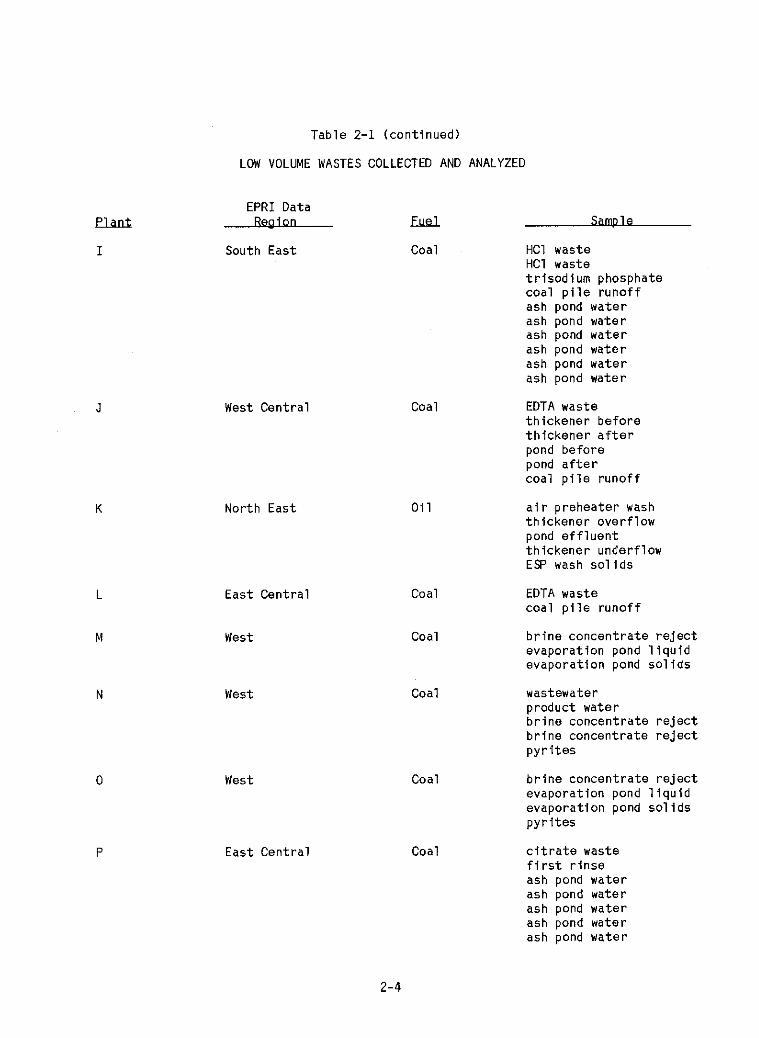
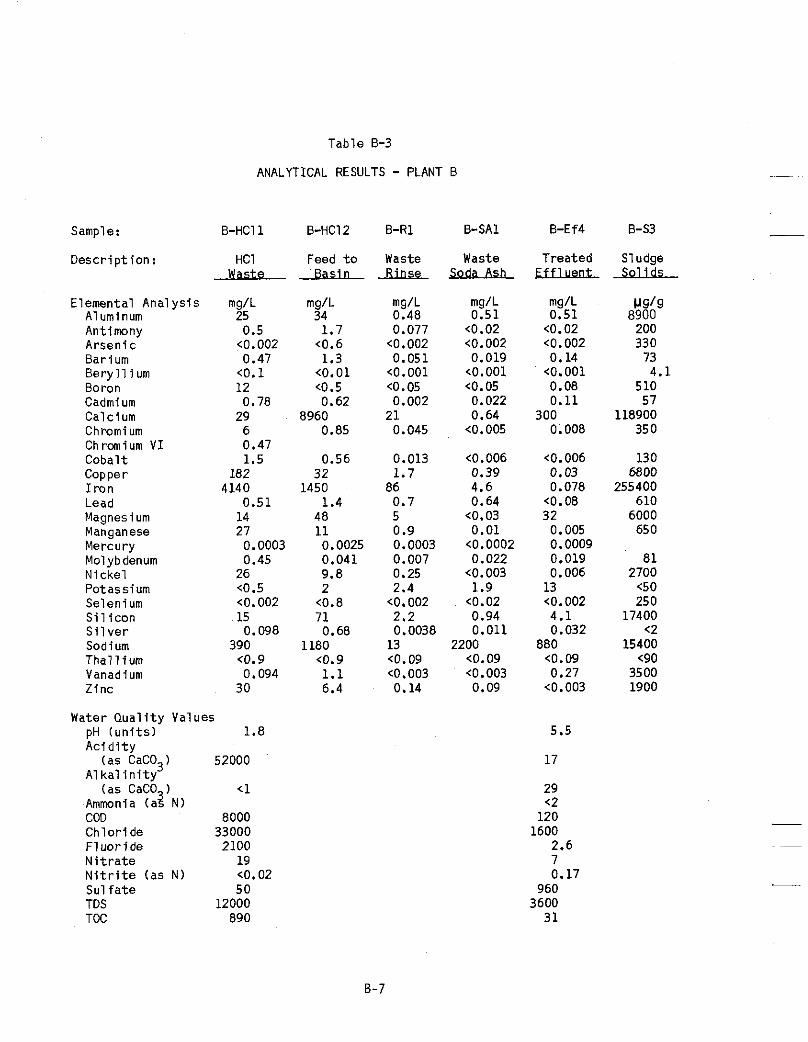
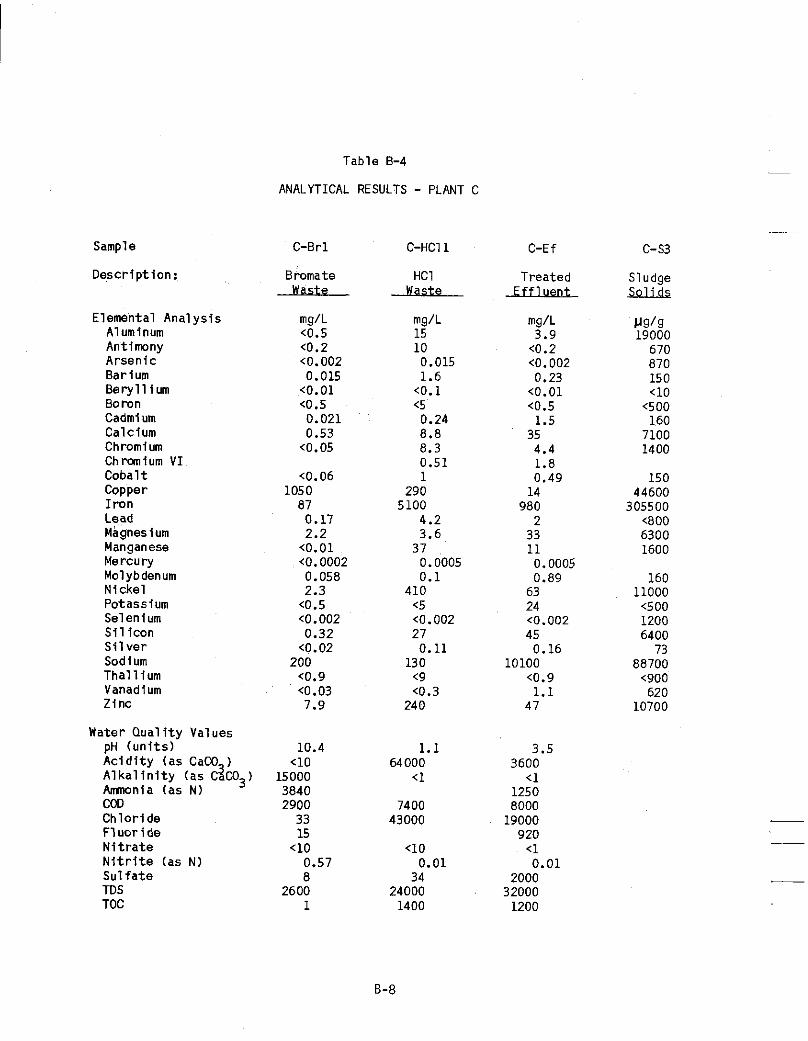
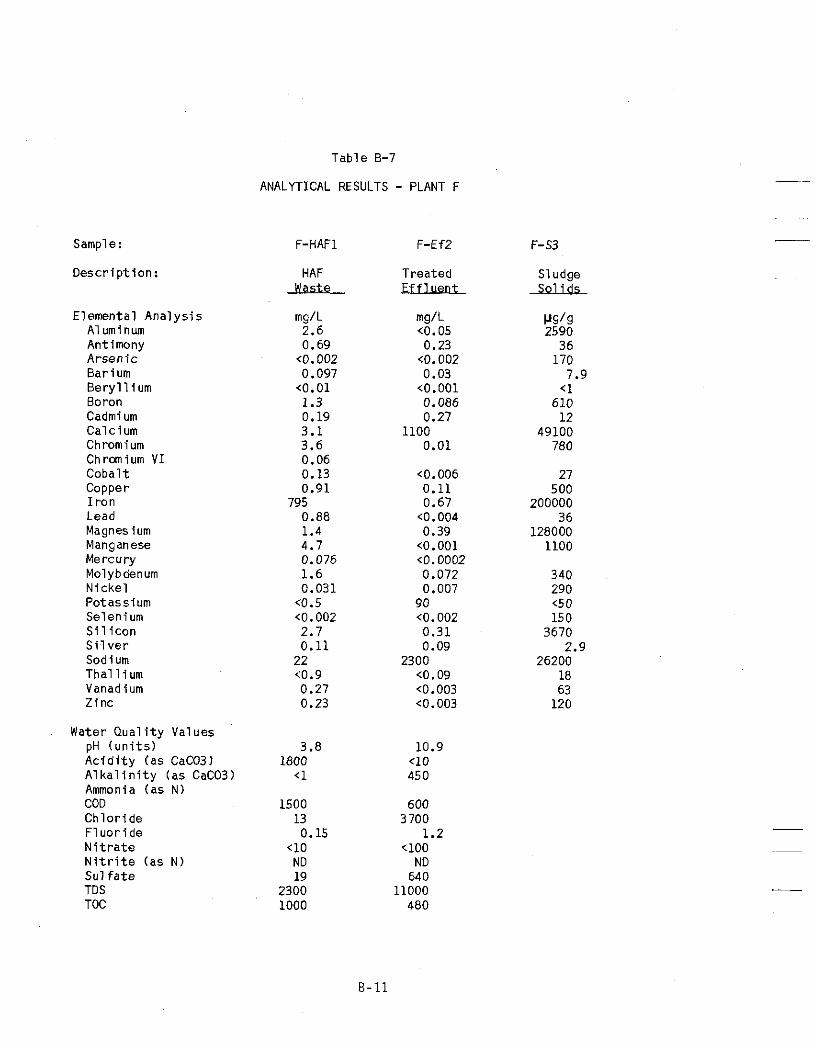
Tab le 2-1 l i s t s t h e samples ob ta ined from host u t i l i t y s i t e s du r ing 1985.
sampling and a n a l y t i c a l r e s u l t s f rom t h i s e f f o r t a re presented i n Appendices A,
B, and C.
The
T h i s sec t i on i s organized by s p e c i f i c low volume waste streams w f t h an i n t r o -
duc tory s e c t i o n on t h e p r e c i s i o n o f t h e a n a l y t i c a l procedures used.
presented f o r each stream inc lude t h e source of t h e waste, t h e frequency and
vu1 unie produced, chemical composit ion. and common t rea tment methods. E f f l u e n t
l i m i t s a re s t a t e d f o r those streams t h a t have s p e c i f i c regu la to ry requirements.
Desc r ip t i ons o f t h e u t i l i t y s i t e s where samples were ob ta ined a re presented i n
Appendix A; Appendix B presents t h e c h a r a c t e r i z a t i o n data o f each i n d i v i d u a l
samDle.
Topics
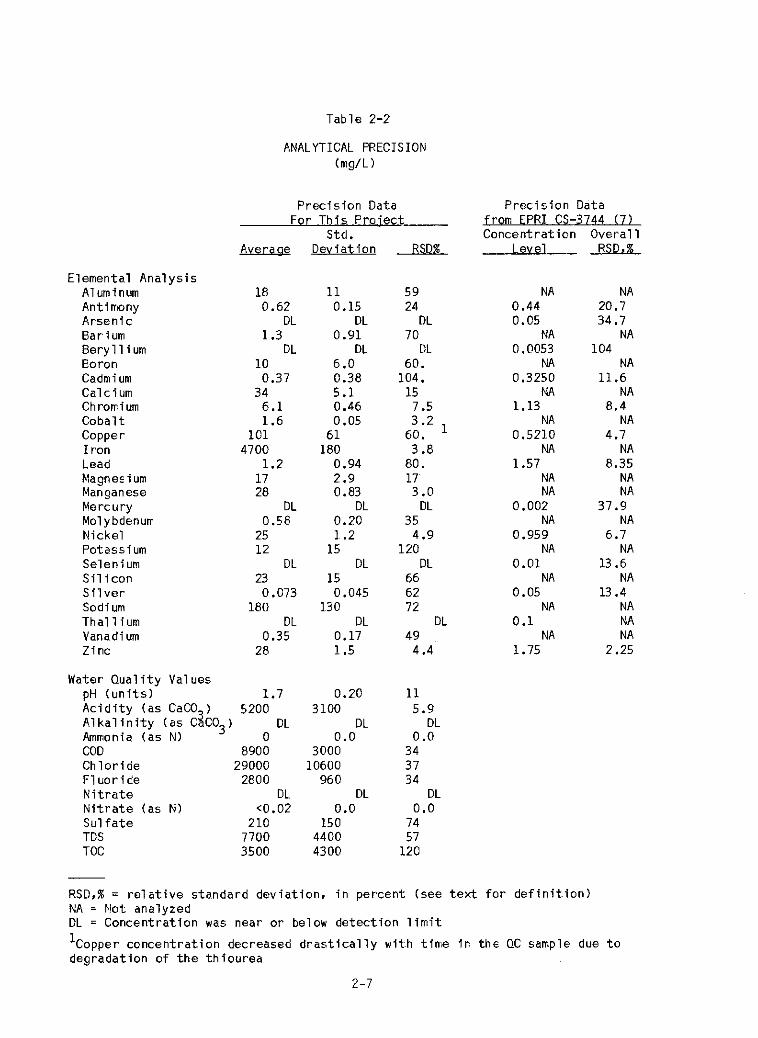
ANALYTICAL PRECISION
Charac te r i za t i ons o f t h e low volume wastes presented i n t h i s manual i nvo l ved
chemical analyses of l i q u i d and s o l i d samples, some o f which cons is ted of very
complex chemical mat r i ces . Th is sec t i on w i l l he lp de f ine t h e p r e c i s i o n and
l i m i t s o f d e t e c t i o n o f t h e data presented i n t h i s s e c t i o n and throughout t h e
ranua l .
assurance ( C A I program fo l lowed on t h i s p r o j e c t . Fu r the r d e t a i l s on t h i s and
o the r aspects o f t h e QA program can be found i n Appendix D.
Much of t h e i n fo rma t ion on a n a l y t i c a l p r e c i s i o n comes from t h e q u a l i t y
A recent EPRI r e p o r t (1) est imated t h e p r e c i s i o n and b i a s of chemical methods
commonly used i n t h e e l e c t r i c u t i l i t y i ndus t r y . The researchers i n t h i s r e p o r t
have anslyzed a v a i l a b l e p r e c i s i o n and b i a s data on EPA-approved procedures f o r
measuring t r a c e elements.
methods f o r t h e analyses presented i n t h i s manual, namely atomic abso rp t i on and
plasma m i s s i o n spectroscopy.
The methods they reviewed inc luded t h e 5 a ~ e a n a l y t i c a l
2-2
ElAixt
A
B
C
D
E
F
G
H
Table 2-1
LOW VOLVvlE WASTES COLLECTED AND ANALYZED
EPRI Data Reoion w SamDle
West Gas f i r e s i d e waste t r e a t e d e f f l u e n t EDTA wash t r e a t e d EDTA combined s o l i ds
HC1 waste n e u t r a l i z e d HC1 r i n s e water soda ash r i n s e s ludge from bas in e f f 1 uent
Nor th East 01 1
West
Nor th East
South Cent ra l
West
West
South East
Gas
01 1
Gas
o i 1
O i l
Coal
ammonium bromate HC1 waste pond water pond s o l i d s
f i r e s i d e wash c l a r i f i e r supernate s ludge s o l i d s c l a r i f i e r underflow
c i t r a t e waste
waters ide composite t r e a t e d e f f l u e n t t rea tment sludge
composite waste t r e a t e d e f f l u e n t t rea tment s ludge HC1 waste ammonium bromate water r i n s e hydraz ine waste
ammonium bromate HC1 waste n e u t r a l i z e d HC1 pond water
2-3
J
J
K
L
M
N
Table 2-1 (cont inued)
LOW VOLUME WASTES COLLECTED AND ANALYZED
EPRI Data Realon fual SamDle South Eas t Coal HC1 waste
HC1 waste t r i s o d i u m phosphate coa l p i l e r u n o f f ash pond water ash pond water ash pond water ash pond water ash pond water ash pond water
EDTA waste t h i c k e n e r be fo re t h i c k e n e r a f t e r pond be fo re pond a f t e r coa l p i l e r u n o f f
West Cen t ra l Coal
Nor th East
Eas t Cen t ra l
West
West
West
East Cen t ra l
O i 1
Coal
Coal
Coal
Coal
Coal
a i r p reheater wash t h i c k e n o r ove r f l ow pond e f f l u e n t t h i c k e n e r underf low ESP wash s o l i d s
EDTA waste coa l p i l e r u n o f f
b r i n e concen t ra te r e j e c t evapora t ion pond l i q u i d evapora t ion pond s o l i d s
wastewater p roduc t water b r i n e concen t ra te r e j e c t b r i n e concent ra te r e j e c t p y r i t e s
b r i n e concen t ra te r e j e c t evapora t ion pond l i q u i d evapora t ion pond s o l i d s p y r i t e s
c i t r a t e waste f i r s t r i n s e ash pond water - ash pond water ash pond water ash pond water ash pond water
-
2-4
Table 2-1 (cont inued)
LOW VOLUME WASTES COLLECTED AND ANALYZED
€%ant
Q
R
S
T
U
EPRI Data Reaion
Nor th East Coal
Nor th East Coal
Nor th East
Nor th East
East Cent ra l
Coal
Gas/o i 1
Coal
Coal
SamDle moistened f l y ash p y r i t e s from p u l v e r i z e r
f l y ash from pond bottom ash from pond p y r i t e s from p u l v e r i z e r
f l y ash from s i l o s p y r i t e s from p u l v e r i z e r
f i r e s i d e waste f i r e s i d e waste c l a r i f i e r over f low f i l t e r s o l i d s
EDTA waste EDTA r i n s e hyd roxyacet ic / fo rmic
2-5
The major s t a t i s t i c from t h e EPRI work, as it app l i es t o t h i s manual, i s t h e
p r e c i s i o n of ana lys is . P r e c i s i o n i s t h e measure o f t h e s c a t t e r of data from
r e p l i c a t e analyses. It i s de f i ned mathematical ly as:
where:
RSD, % i s t h e r e l a t i v e standard d e v i a t i o n i n percent,
S i s t h e samDle standard dev ia t ion , and
- X i s t h e sample mean concent ra t ion .
Tab le 2-2 presents t h e prec is ion , expressed as t h e RSD, f o r a s e t of r e p l i c a t e
analyses performed on one sample of b o i l e r chemical c lean ing waste from t h i s
study.
a n a l y t i c a l task. The sample was analyzed each t ime a batch o f low volume waste
samples was sent t o t h e l a b f o r ana lys is . A lso presented i n t h e t a b l e a r e
p r e c i s i o n da ta compiled f o r t h e e a r l i e r EPRI study (7) . The mat r ices of t h e
samples t e s t e d i n t h e e a r l i e r study inc luded d i s t i l l e d water, r i v e r water, and
min ing wastewater.
The sample was analyzed four t imes over t h e f i v e month d u r a t i o n of t h e
The RSO values f o r elements analyzed i n t h e b o i l e r chemical c lean ing waste range
from near u n i t y t o over 100 percent. The l a r g e r RSDs a re a t t r i b u t a b l e t o t h e
concen t ra t i ons being very near t h e d e t e c t i o n l i m i t s o f t h e a n a l y t i c a l method o r
t o t h e complex m a t r i x present i n t h e b o i l e r chemical c lean ing waste sample.
Ma jor d i f f e r e n c e s i n t h e p r e c i s i o n observed i n t h i s study and t h e e a r l i e r EPRI
study a re apparent f o r cadmium, copper. lead, and s i l v e r . The cadmium
concen t ra t i on i n t h e b o i l e r chemical c lean ing waste sample i s very near t h e
d e t e c t i o n l i m i t f o r t h e plasma emission spectrometer, hence t h e poor p rec i s ion .
The copper concen t ra t i on i n t h e waste sample decreased d r a s t i c a l l y over t h e
d u r a t i o n of t h e analyses ( a f i v e month t i m e pe r iod ) due t o degradat ion of t h e
copper c h e l a t i n g agent i n t h e b o i l e r chemical c lean ing waste sample. The
p r e c i s i o n measured f o r l e a d a n a l y s i s was low because o f one o u t l y i n g r e s u l t
o f an a n a l y s i s performed i n October of 1985 and t h e s i l v e r concent ra t ions i n t h e
waste sample were a l s o near o r below t h e a n a l y t i c a l d e t e c t i o n l i m i t s .
2 - 6
Table 2-2
ANALYTICAL PRECISION (mg/L)
P r e c i s i o n Data P r e c i s i o n Data For Th is Proiect-
Std.
Elemental Ana lys i s A1 um i num A n t i rriony Arsen ic Barium B e r y l l i u m @oron Cadmium Calcium Chromium Coba l t Copper I r o n Lead Magnezium Manganese Mercury Molybdenum Nicke l Pot ass i um Selen i um S i l i c o n S i l v e r Sodium Tha l l i um Vanadium Z inc
Water Qual i t v Values PH ( u n i t s ) - A c i d i t y (as CaCO ) 5200 A l k a l i n i t y (as CSCO,) DL Amnionia (as N) 0
e
18 0.62
1.3 DL
OL 10
34 0.37
6.1 1.6
101 4700
17 28
1.2
DL 0.58
25 12
23
180
OL
0.073
DL 0.35
28
1.7
Dev ia t i on RSDX
11 59 0.15 24
0.91 70 DL OL
OL OL 6.0 60. 0.38 104.
~ .~ 5.1 15 0.46 7.5 0.05 3.2
6 1 60. 180 3.8
0.94 60. 2.9 17 0.83 3.0
DL DL 0.70 35 I .2 4.9
15 120 OL DL
15 66 0.045 62
130 72 OL OL
0.17 49 1.5 4.4
0.20 11 3100 5.9
DL DL 0.0 0 .o
coo 8900 3000 34 C h l o r i d e 29000 10600 37 F1 u o r i de 2800 96 0 34 N i t r a t e DL OL OL N i t r a t e (as N) (0.02 0.0 0.0 S u l f a t e TOS
210 150 74 7700 4400 57
TOC 3500 4300 120
from EPRI CS-3744 (7 ) Concent ra t ion O v e r a l l
Level
NA 0.44 0.05
NA 0.0053
NA 0.3250
NA 1.13
NA 0.5210
NA 1.57
NA NA
NA
NA
NA
NA
NA
0.002
0.959
0.01
0.05
0.1
1.75
. RSD,%
NA 20.7 34.7
NA
NA 11.6
NA 8.4
NA 4.7
NA 8.35
NA NA
NA
NA
NA
NA NA NA
2.25
104
37.9
6.7
13.6
13.4
RSO,% = r e l a t i v e standard dev ia t ion , i n percent (see t e x t f o r d e f i n i t i o n ) NA = Not analyzed DL = Concent ra t ion was near o r below de tec t i on l i m i t
'Copper concen t ra t i on decreased d r a s t i c a l l y w i t h t inte i n t h e @C sample due t o degradat ion o f t h e t h i o u r e a
2-7
The l i m i t s of d e t e c t i o n (LOCI) f o r a Siven a n a l y s i s a re based on t h e standard
d e v i a t i o n th rough t h e f o l l o w i n g r e l a t i o n s h i p :
LOO = 3s0
where:
LOD i s t h e l i m i t o f de tec t i on and
So i s t h e standard d e v i a t i o n a t zero concent ra t ion .
Therefore, t h e LOD f o r an element v a r i e s f rom sample t o sample depending on t h e
p r e c i s i o n o f ana lys i s f o r t h a t sample.
mat r ix . such as a b o i l e r chemical c lean ing waste, would have lower p r e c i s i o n and
t h u s a h ighe r LOD than a sample o f a more d i l u t e wastewater. For t h i s reason,
t h e analyses presented i n t h i s sec t i on o f ten show d i f f e r e n t LOD's f o r one element
between d i f f e r e n t samples.
For example, a sample w i t h a complex
PYRITES
h & e Source
Before coa l i s used i n a u t i l i t y b o i l e r , several steps a re i nvo l ved i n p repar ing
t h e fue l f o r combustion, i n c l u d i n g c rush ing and p u l v e r i z i n g . Dur ing t h l s
p repara t ion , rock fragments incorpora ted i n t h e coa l may be r e j e c t e d from t h e
c rushers o r p u l v e r i z e r s because they are harder than t h e coal .
f ragnents. c a l l e d coa l r e j e c t s o r p y r i t e s . t y p i c a l l y c o n s i s t o f shale from t h e
coa l seam. The ac tua l p y r i t e ( i r o n s u l f i d e ) conten t o f t h i s r e j e c t stream i s
va r iab le .
These rock
Frequencv of Generat ion
The p y r i t e waste o f concern t o t h e u t i l i t y i s usua l l y removed i n t h e coa l
p u l v e r i z e r s immediately be fore t h e b o i l e r . The waste i s generated cont inuously,
a l though it may be removed f o r disposal on an i n t e r m i t t e n t basis. Volumes of
p y r i t e wastes vary depending on t h e coa l and t ype of p u l v e r i z e r .
p l a n t s generated 750, 950, and 1200 tons of p y r i t e per year per 100 Mw capac i ty .
A l l t h r e e p l a n t s f i r e d a bi tuminous coa l w i t h medium s u l f u r con ten t (1.5 t o 3.5
percent s u l f u r by we igh t ) .
Three eas tern
2-8
Chemical C o m a o w
P y r i t e wastes do n o t c o n s i s t e n t i r e l y of t h e minera l p y r i t e (FeS2), b u t u s u a l l y
c o n t a i n a l a r g e percentage o f p y r i t e incorpora ted i n unweathered rock.
wastes can generate a c i d i c leachate. The r e a c t i o n s respons lb le f o r producing
a c i d i c leachate from u t i l i t y p y r i t e wastes a r e t h e same r e a c t i o n s t h a t produce
a c i d i c drainages from coal mines, base metal mines. and mine t a i l i n g s . A l l
r e s u l t from t h e weatherlng of p y r i t e .
P y r i t e
Elemental analyses o f p y r i t e samples from four p l a n t s a r e presented i n Table 2-3. Assuming t h e p y r i t e s tandard t o be as pure a form o f minera l p y r i t e as possible,
t h e u t i l i t y p y r i t e s c o n t a i n between 6 and 86 percent a c t u a l minera l p y r l t e . The
p y r i t e wastes from eas tern bituminous c o a l s c o n t a i n t h e h i g h e s t percentage o f
p y r i t e : 27, 44, and 86 f o r p l a n t s S, Q, and R, r e s p e c t i v e l y . The p y r l t e from
t h e p l a n t f i r i n g western subbituminous coal c o n t a i n s much l e s s ac tua l p y r i t e : 6
percent.
rock. probably shale.
The remainder o f t h e waste t h a t i s n o t p y r i t e c o n s i s t s of t h e hos t
DisDosal P r a c t i c e s
P y r i t e s a r e t y p i c a l l y combined w i t h f l y ash o r bottom ash waste streams f o r
d isposal .
Coponding i s a l s o an opt ion.
The canbined waste i s then l a n d f i l l e d , o r b a c k f i l l e d i n t h e coal mine.
COAL P ILE RUNOFF
Coal p i l e runof f i s an i n t e r m i t t e n t low volume waste stream which i s generated
d u r i n g per iods of r a i n f a l l and snow mel t . I n some cases. it i s s u i t a b l e f o r
sur face water d ischarge w i thout t reatment .
and/or conta ins suspended s o l i d s and r e q u i r e s n e u t r a l i z a t i o n and/or c l a r i f i c a t i o n
p r i o r t o dlscharge.
A t o t h e r s i t e s , t h e runoff I s a c f d i c
Waste Source
Coal p i l e runoff may c o n t a i n coal f ines and/or fe r rous s u l f a t e and s u l f u r i c a c i d
from o x i d a t i o n of p y r i t e i n t h e coal .
represented by t h e f o l l o w i n g r e a c t i o n :
The o v e r a l l o x i d a t i o n o f p y r i t e can be
2FeS2 ( p y r i t e ) t 702 t 2H20 2FeS04 + 2H2S04.
The f e r r o u s i r o n can be f u r t h e r ox id ized. e i t h e r chemical ly o r b i o l o g i c a l l y , t o
f e r r i c i ron, which forms a d d i t i o n a l s u l f u r i c ac id . A t pH l e v e l s below 5, severa l
2-9
.
Table 2-3
PYRITE CCMPOSITIONS (Ilg/g)
P1 ant: N
Coal : Subbltumlnous
Elemental Ana lys is Aluminun 16100 Antimony Arsenic Barium B e r y l 1 i um Boron Cadmium Cal c i um Ch rumium Col ba l t Copper Ironl Lead Magnesium Manganejle Me rc u ry Mol yb den um Nicke l Phosphorus Potass iuy Selenium S i l v e r Sodium S u l f u r ( % I T i t a n i um Tha l l ium Vanadi um Z i n c
Heat ing Val ue ( B t u / l b )
12 36 209
37 (4
10800 320
0.56
3.3 6.2
1.6 26000
7960 410 0.04 1.3 7.4
340 6380
0.5 (0.4
5120
420 1180
11 19
0.94
6100
R
Bituminous
8130 (40
3460 (2 12
(100 (4
1670 520 15
374000
610 170
11 59
(500 1190
9.2
0.27
0.76
(0.5 5.8
46.34 940
150 (180 (3 0 78
3200
Q
Bituminous
17100 (40 1180
(2 (2
(100 (4
15300 550
57 193400 1560 1800 280
3.2
0.86 (0.4 2.6
1500 7460 (0.5 1.8
18.12 3.4
8180
(180 67 34
4900
S P y r i t e
B i tum ino& Standard
48800 (40 200 3800
15 NA (4
3670 44 20 100
65 3000 130
86900 435900
0.2 15 37
1300 11000
(4 (2 730 14.04 49.5
2500
4200 2174
‘Atanic absorp t ion ana lys is . plasma emiss ion spect rometry (ICP).
NOTE: analyses which were prepared f o r a n a l y s i s by l i t h i u m metaborate fus ion .
A l l o t h e r elements by i n d u c t i v e l y coupled argon
Whole-sample d i g e s t i o n s b y . p e r c h l o r i c acid, except f o r i r o n and s i l i c o n
2-10
a c i d o p h i l i c , chemoautotrophic b a c t e r i a t h a t per form t h e fe r rous o x i d a t i o n
r e a c t i o n become ac t i ve . These species i nc lude J h i o b a d l l u s ferroxidanst F e r r o b a c i l l u s f e r r o x i d a m , and M e t a l l o o e n i w , which use C02 as t h e i r carbon
source ( 5 ) . Because o f these react ions, coa l p i l e r u n o f f can be very ac id i c :
t h i s low pH may i n t u r n s o l u b i l i z e o t h e r meta ls from t h e coal .
Freau encv . of G ene ra t i o n
Coal p i l e runo f f i s on l y generated du r ing r a i n f a l l o r snow m e l t cond i t i ons . The
Tennessee Va l l ey A u t h o r i t y has developed t h e f o l l o w i n g
the amount o f runof f from a r a i n (5 ) : c o r r e l a t i o n t o p r e d i c t
Runoff ( inches /acre) = r a i n f a l l ( inches) x 0.855 t 0.0082.
Th is equat ion i n d i c a t e s t h a t about 86 percent o f a r a i n f a l l becomes runoff.
Chemical Comoosi ti on
Analyses f o r runof f samples from t h r e e u t i l i t i e s a re presented i n Table 2-4.
P l a n t I burns b i tuminous coal , w h i l e P lan ts J and L burn a l k a l i n e subbituminous
coa l . The pH o f t h e runof f from t h e b i tuminous coal i s a c i d i c (3.1), w h i l e t h e
two subbituminous coa ls have neu t ra l t o a l k a l i n e runof f pH values. The f a c t o r s
which a f f e c t t h e pH, a c i d i t y , and t r a c e metal concent ra t ions o f coal p i l e r u n o f f
a re (I):
a Concentrat ion and form of p y r i t i c s u l f u r i n t h e coal;
a Size of t h e coa l p i l e ;
a Method o f coal p repara t i on and c lean ing p r i o r t o storage:
a C l i m a t i c condi t ions, i n c l u d i n g r a i n f a l l and temperature;
a Concentrat ions of a1 ka l i n e substances i n t h e coal ;
a Concentrat ion and s p e c i a t i o n o f t r a c e meta ls i n t h e coal ; and
a Residence t ime i n t h e coal p i l e .
Disposal P r a c t i c e s
Coal p i l e r u n o f f d isposal methods depend on t h e water composition, geographic
l o c a t i o n , and t h e p l a n t c o n f i g u r a t i o n . I n many Instances, r u n o f f i s d i r e c t e d t o
ash ponds w i t h o u t any t reatment . A t o the r l oca t i ons , a sedimentat ion impoundment
2-11
Plant :
1 Coal :
Elemental Analys is A1 um 1 n urn Antimony Arsenic Barium B e r y l l i u m Boron Cadmium Calcium Chromium Cobal t Copper I r o n Lead Magnesl um Manganese Mercury Molybdenum Nicke l Potassium Sel en i um S i l i c o n S i l v e r Sodium Thal 1 ium Vanadium 7.1 nc
Water Q u a l i t y pH ( u n i t s ) A c i d i t y (as CaCO 1 A l k a l i n i t y (as C&03) COD Chlor ide F1 u o r i de N i t r a t e N i t r i t e (as N) S u l f a t e TOS TOC
Table 2-4
COAL PILE RUNOFF COMPOSITIONS (mg/L)
I
14 (0.02 <0.002 0.04 0.007
(0.05 0.004
72 0.005 0.17 0.06 2.6
(0.08 19 3.2 0.0003 0.005 0.21 1.8
(0 .002 4.4 0.0018
12 (0.09 (0,003
0.59
3.1 180 (1 (5 20
0.61 2
(0.02 480 660
2
J
Subbltumlnous
0.15 (0.02 <0.002 0.078
<0.001 0.8
<0.001 45 (0.005 (0.006 0.002 0.38
(0.002 18 0.023 0.0003
(0.002 (0.003
0.76 (0.002 1.8 0.0023
85 <0.09 (0.003 (0.003
9.3 (10 93 ( 5 8 0.24 6 0.03
420 970
2
1
Sub b i t u m i w
0.54 c0.02 0.006 0.043
<0.001 0.95 0.001
(0.005 <O .006 0.002
13.3 0.015
68 1.2
(0 . 0002 <0.002 3 4.1
270
(0.002 11
48 0.0012
<o .09 CO .003
0.01
8.4 (10 310
<5 34
<2 0.24
c0.02 740
1500 4
' A l l coa ls conta in l e s s than 1.5 percent s u l f u r .
2-12
may be used t o reduce suspended s o l i d s concent ra t ions . Runoff i s pH ad jus ted as
necessary t o meet t h e requirements o f sur face d ischarge pe rm i t s (pH 6 t o 9) . I f
h igh l e v e l s o f meta ls a re present, it may be necessary t o use a phys ica l /chemical
t rea tment system p r i o r t o d ischarg ing t h e water.
i n a r i d regions, runo f f i s genera l l y c o l l e c t e d and recyc led f o r use as makeup
water.
A t zero discharge s ta t ions . o r
FLOOR AND YARD DRAINS
Numerous l o c a t i o n s i n power p l a n t s generate wastewater which i s c o l l e c t e d i n
dralnage systems. Pump seals, tank leakage. wash water, and temporary supply
l i n e s a l l c o n t r i b u t e t o f l o o r and yard d r a i n f lows. None o f these wastes were
sampled d u r i n g t h e EPRI program. P o l l u t a n t s o f regu la to ry concern i nc lude sus-
pended s o l i d s and o i l and grease. I n a pub l i shed study, t h e average f low f o r
f l o o r and yard dra ins was estimated t o be 30 ga l l ons per day per megawatt
(gpd/MW) (8 ) . Laboratory sample l i n e s used t o analyze b o i l e r opera t ion are
genera l l y operated cont inuous ly and produce an est imated f l ow o f 10 gpd/MW (a). Laboratory d r a i n wastes do no t i nc lude wastes such as spent so lvents which are
genera l l y c o l l e c t e d and disposed o f o f f s i t e by con t rac to rs .
d r a i n waste surface discharges are requ i red t o meet t h e standard pH, t o t a l
suspended s o l i d s (TSS), and o i l and grease parameters f o r power p lan ts . They are
commonly combined w i t h o the r waste streams a f t e r o i l removal.
F loo r and yard
DEMINERALIZER REGENERANT WASTE
Deminera l izer regenerant i s produced du r ing t h e regenera t ion of t h e makeup water
and condensate p o l i s h e r i on exchange beds. Th is stream can be e i t h e r a c i d i c o r
a l k a l i n e , depending on t h e exchange mate r ia l and t h e regenerant so lu t i on . - I o n exchange m a t e r i a l s a re t h e most common means of t r e a t i n g b o i l e r cyc le water.
These m a t e r i a l s a re o rgan ic macro rec t i cu la r r e s i n s which con ta in numerous a c t i v e
s i t e s . Several f o rmu la t i ons e x i s t f o r d i f f e r e n t t reatment ob jec t i ves . I n
operat ion, t h e a c t i v e s i t e s remove i o n i c species and r e l i n q u i s h hydrogen o r
hydroxyl ions. Dur ing regeneration, e i t h e r ac ids or bases are used t o remove t h e
i o n i c species and rep lace them w i t h hydrogen o r hydroxyl ions. The waste
s o l u t i o n con ta ins s a l t s of t h e m a t e r i a l s removed from t h e b o i l e r cyc le water and
2-13
an excess o f t h e regenerant. e i t h e r a c i d or base. Th is excess ac id o r base can
c r e a t e RCRA hazardous wastes i f t h e pH f a l l s below 2.0 o r r i s e s above 12.5,
because o f t h e c o r r o s i v i t y c h a r a c t e r i s t i c .
w Average spent regenerant f low ra tes were determined i n an EPA study t o be 104,
86, and 42 gpd/MW f o r coal. gas, and o i l un i t s , r e s p e c t i v e l y (I). o f regenera t ion depends on severa l factors , no tab ly i n l e t water composit ion.
Batch regenera t ion frequency may vary from severa l t imes pe r day t o once pe r
week.
t h e manner i n which r i n s e volumes are handled.
The frequency
The amount of regenerant produced per batch depends on u n i t s i z e and on
The composit ions of deminera l i zer regenerant wastes are h i g h l y var iab le . F i v e
bas ic types of i o n exchange m a t e r i a l s a re used. Weak and s t rong a c i d and base
res ins are used f o r removing e i t h e r a l k a l i n e ca t i ons (weak ac id) , m inera l a c i d
anions (weak base). o r a l l ions ( s t rong a c i d and base). Sodium c y c l e r e s i n replaces ca lc ium and magnesium w i t h sodium. The regenerat ion o f t h e s t rong
r e s i n s i s performed w i t h h i g h (2 t o 6 percent ) concent ra t ions of e i t h e r s u l f u r i c
a c i d o r caus t i c .
h igh d isso lved s o l i d s concentrat ions, which can cause ca lc ium s u l f a t e and ca lc ium carbonate s c a l i n g i n equipment.
As can be seen, t h e minimum pH values recorded are l e s s than 2. i n d i c a t i n g t h e
p o s s i b i l i t y o f process ing a RCRA c o r r o s i v e waste.
Th is may produce a waste stream w i t h co r ros i ve pH l e v e l s and
Table 2-5 presents f i n d i n g s from an EPA survey.
Table 2-5
DEMINERALIZER REGENERANT CHARACTERISTICS (5)
P a r a m e t e r Q h m u t b E Me an L!l.” l3zd”
PH 122 6.15 1.7 10.6 Suspended so l i d s (mg/L) 88 44 3.0 3 05 Dissolved s o l i d s (mg/L) 39 6060 1890 9650 O i l and grease (mg/L) 29 6.0 0.13 22
2-14
D i S D O s a l P r a c t i c es
Spent regenerant i s o f ten routed t o an e q u a l i z a t i o n tank where c a t i o n i c and
an ion i c wastes a r e combined.
g e n e r a l l y adequate t o produce a non-corrosive e f f l u e n t (2<pH<12.5).
a l t e r n a t i v e s i n c l u d e coponding, m i x i n g w i t h c o o l i n g tower blowdown, and t reatment
i n a phys ica l /chemical system. Federal e f f l u e n t discharge standards r e q u i r e a pH
between 6 and 9, 30 mg/L TSS (30-day average, 100 mg/L one day maximum), 15 mg/L
o f 1 and grease (30-day average, 20 mg/L one day maximum). I n some regions,
discharge pe rm i t s a l s o r e g u l a t e t h e concen t ra t i on and/or mass r a t e of d i sso l ved
s o l i d s which can be discharged.
Th is prov ides a degree of s e l f - n e u t r a l i z a t i o n .
Other
BOILER BLOWOOWN
B o i l e r blowdown i s t y p i c a l l y one o f t h e h ighes t q u a l i t y waste streams produced a t
a power p l a n t and i s o f t e n reused w i t h i n t h e p l a n t r a t h e r than discharged
a l though it may c o n t a i n t r a c e l e v e l s of c o n d i t i o n i n g chemicals, such as
hydrazine. No b o i l e r blowdown samples were obta ined d u r i n g t h i s program.
b o i l e r s o p e r a t i n g above 2,000 ps i , t h e maximum recommended t o t a l s o l i d s
concen t ra t i on i s 15 mg/L, which would a l s o be t h e blowdown concen t ra t i on (5). Average f low r a t e s f o r blowdown a r e presented i n t h e EPA e f f l u e n t l i m i t a t i o n s
gu ide l i nes document (5 ) . r a t e i s 148 gpd/MW.
gpd/MW, respec t i ve l y .
f l ows for p l a n t s us ing d i f f e r e n t f ue l s .
a t t r i b u t a b l e t o t h e age and types o f b o i l e r systems a t t h e p l a n t s surveyed.
For
For c o a l - f i r e d un i t s , t h e est imated average blowdown
Blowdowns f o r o i l and gas u n i t s a re g lven as 287 and 163
No exp lana t ion i s g i ven for t h e v a r i a t i o n i n blowdown
It i s l i k e l y t h a t t h i s v a r i a t i o n i s
FIRESIDE WASTES
Waste Source
Coal, o i l , and t o a l e s s e r e x t e n t n a t u r a l gas, c o n t a i n i m p u r i t i e s . These impur i -
t i e s form both gaseous ( s u l f u r d ioxide, n i t r o g e n oxides. hydrogen ch lo r i de , e tc . )
and s o l i d ( f l y ash, bottom ash, soot, s l a g ) combustion byproducts.
s o l i d s a r e e n t r a i n e d from the b o i l e r i n t h e combustion gas stream and a r e removed
by p a r t i c u l a t e c o n t r o l equipment such as e l e c t r o s t a t i c p r e c i p i t a t o r s o r baghouses
f o r coa l and some o i l p lan ts . However, small amounts of t h e s o l l d s adhere t o t h e
heat t r a n s f e r surfaces of t h e b o i l e r , i.e.. water tubes, superheater tubes. and
a i r preheater. I n some cases, the p a r t i c u l a t e c o n t r o l equipment a l s o becomes
fouled.
Most o f t h e
2-15
Over time, these deposi ts b u i l d up and reduce t h e b o i l e r e f fect iveness. O i l -
f i r e d b o i l e r s a re prone t o soo t depos i t i on on t h e b o i l e r tubes.
s low ly ox id ized, caus ing flames a long t h e tube banks and sparks e x i t i n g i n t h e
f l u e gas.
deposi t ion; however, tube depos i ts can be formed i f s lagg ing occurs because t h e
ash fus ion tenpera tu re i s exceeded. The c h a r a c t e r i s t i c s of tube f o u l i n g formed
du r ing s lagg ing cond i t i ons may range from so f t , e a s i l y removed deposi ts t o hard,
masslve depos i ts t h a t r e q u i r e mechanical c lean ing (91.
This m a t e r i a l i s
I n c o a l - f i r e d un t t s , abras ion from f l y ash can he lp t o reduce
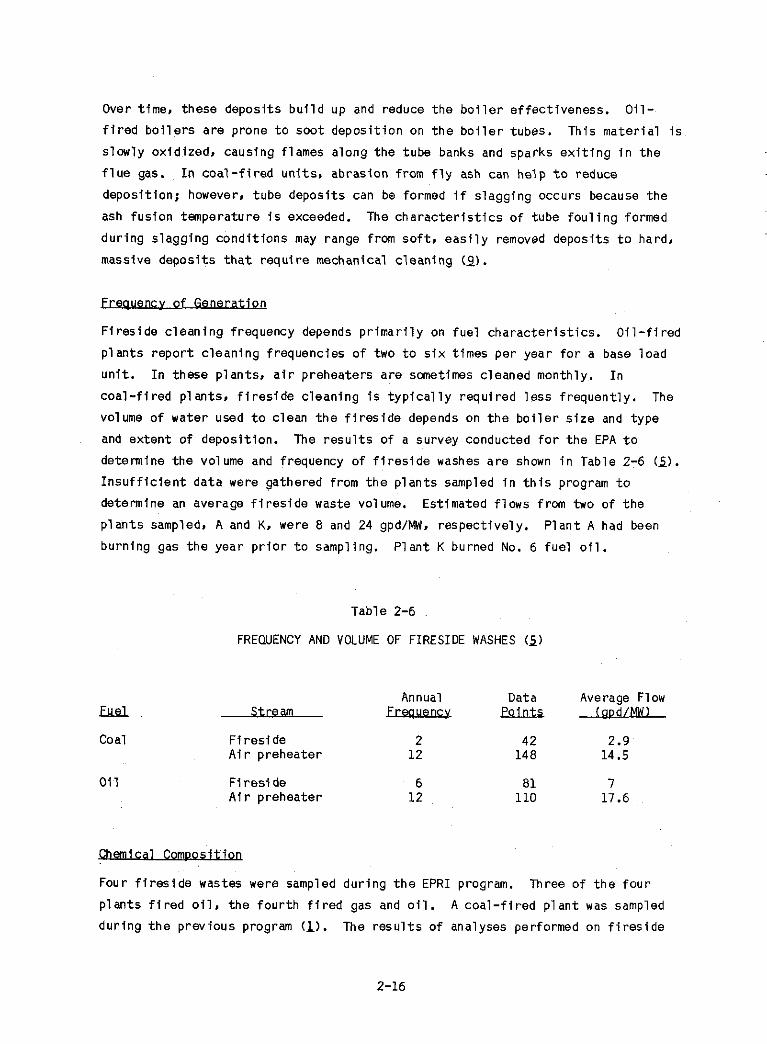
w F i r e s i d e c l e a n i n g frequency depends p r i m a r i l y on f u e l c h a r a c t e r i s t i c s . O i l - f i r e d
p l a n t s r e p o r t c lean ing f requencies o f two t o s i x t imes pe r year f o r a base load
u n i t . I n these p lants , a i r preheaters a r e sometimes cleaned monthly. I n
c o a l - f i r e d p lan ts , f i r e s i d e c lean ing i s t y p i c a l l y requ i red less f r equen t l y . The
volume of water used t o c lean t h e f i r e s i d e depends on t h e b o i l e r s i z e and t ype
and ex ten t of deposi t ion.
determine t h e volume and frequency o f f i r e s i d e washes a r e shown i n Table 2-6 (5). I n s u f f i c i e n t da ta were gathered from t h e p l a n t s sampled i n t h i s program t o
determine an average f i r e s i d e waste volume.
p l a n t s sampled. A and K. were 8 and 24 gpd/MW, respec t i ve l y . P l a n t A had been
burn ing gas t h e year p r i o r t o sampling. P l a n t K burned No. 6 f u e l o i l .
The r e s u l t s of a survey conducted f o r t h e EPA t o
Estimated f l ows from two of t h e
Table 2-6
FREQUENCY AND VOLUME OF FIRESIDE WASHES (5)
Annual Data Average Flow .€LEA Stream Freauency eeintS- Coal F i r e s i d e 2 42 2.9
A i r p reheater 12 148 14.5
01 1 F i r e s i d e 6 81 7 A i r p reheater 12 110 17.6
Four f i r e s i d e wastes were sampled du r ing t h e EPRI program.
p l a n t s f i r e d o i l , t h e f o u r t h f i r e d gas and o i l .
du r ing t h e prev ious program (1).
Three o f t h e f o u r
A c o a l - f i r e d p l a n t was sampled
The r e s u l t s o f analyses performed on f i r e s i d e
2-16
waste streams a re shown i n Table 2-7. The p r e d m i n a n t contaminants i n t h e wastes
a r e i ron, magnesium, n i c k e l . s u l f a t e , vanadium, and zinc. Some u t i l i t i e s use a
s o l u t i o n o f soda ash d u r i n g t h e e a r l y stages o f washing t o c o n t r o l pH. The P l a n t
T analyses show t h e d i f fe rences i n waste composi t ion between t h e e a r l y and l a t e
stages of a c lean ing episode.
concentrat ions, and, t h e r e f o r e i s n o t c l a s s i f i e d as a RCRA hazardous waste
according t o t h e t o x i c i t y c h a r a c t e r i s t i c . Several s t a t e s have a d d i t i o n a l
c r i t e r i a t h a t may inc lude metals n o t on t h e RCRA l i s t f o r EP t o x i c i t y .
example, t h e l e v e l s of n i c k e l and vanadium i n some of t h e f i r e s i d e wastes
analyzed exceed t h e t o x i c i t y l e v e l s i n C a l i f o r n i a Department o f Hea l th Serv ices
s t a t e regu la t i ons . (See Sec t ion 3 o f t h i s manual f o r a d iscuss ion o f C a l i f o r n i a
s t a t e regu la t ions . )
None of these waste streams exceeds EP t o x i c metal
For
The composi t ions o f o i l -genera ted f i r e s i d e wastes determined i n a p rev ious study
(1) were s i m i l a r t o those shown i n Table 2-7. I n t h e e a r l i e r study, coa l b o i l e r
f i r e s i d e wastes were found t o have s i g n i f i c a n t l y lower l e v e l s o f d i sso l ved
metals. Calcium, magnesium, and t h e o the r elements common t o f l y ash were t h e
major species i n t h e f i r e s i d e wastes from c o a l - f i r e d b o i l e r s .
Cur ren t discharge requirements f o r f i r e s i d e wastes a r e s p e c i f i e d i n t h e Federal
Reg is te r (U). These wastes, i f generated from c lean ing us ing added chemicals.
a r e considered t o be chemical metal c lean ing wastes, and a re governed by t h e
f o l l o w i n g discharge c r i t e r i a :
0 6.0 < pH (9.0;
0 T o t a l suspended s o l i d s (30 mg/L;
O i l and grease (20 mg/L; and
0 I r o n and copper il mg/L each.
The Best A v a i l a b l e Technology (BAT) f o r these wastes i s physical /chemical t r e a t -
ment us ing l i m e p r e c i p i t a t i o n (EL). A l l of t h e o i l - f i r e d power p l a n t s sampled
d u r i n g t h i s program used t h i s method f o r t r e a t i n g f i r e s i d e wastes. I n add i t i on ,
P l a n t D i nco rpo ra ted fe r rous s u l f a t e a d d i t i o n t o remove vanadium pentoxide. The
e f f e c t i v e n e s s of physical /chemical t rea tment f o r f i r e s i d e wastes i s presented i n
Sec t ion 4 along w i t h system costs.
2-17
Table 2-7
FIRESIDE WASTE COMPOSITIONS (mg/L)
P1 ant:
Sample Desc r ip t i on :
Elemental Ana lys i s A1 um i n um Ant i mony Arsenic Barium B e r y l l i u m Boron Cadmium Calcium Chromi um Cobal t Copper I r o n Lead Magnesium Manganese Mercury Molybdenum N i c k e l Potassium Selenium S i l i c o n S i l v e r Sodium T h a l l ium Vanadium Zinc
6.5 A c i d i t y (as C a m ) 23 A l k a l i n i t y (as CkO,) 35 Ammonia (as N) COD 230 Ch 1 o r i de 130 F1 uor i d e 2.1 N i t r a t e <O.l N i t r i t e (as N ) (0.1 S u l f a t e TDS TOC
560 1040
D K
1 F i r e s i d e A i r preheater B Z t e - _waste--
13 <0.2 <0.002 0.26 (0.01 (0.5 0.027
0.32 0.79 0.63 87 (0.002
950 3.6 0.0003 1.1
89 <0.5 <o ,002 13 0.016
700 1
180 4.3
270
3.3 480 (1
5 67
0.28 25
0.22 6400 8900
3
2.8 <o .02 (0.002 0.061 (0.001 0.2 0.017
0.21 0.22 0.33
0.082 0,008 1.1
<o .0002 0.036 6.5 8.8
<0.002 0.49 0.019
10
36
420 <o .09 6.8 0.71
3.9 170 (1
(5 35 0 0.21 10 (0.02
990 2000
4
T
2 F i r e s i d e W +16 hours
21 (0.05 0.31 0.087
(0.002 0.016
0.012 <0.001
0.2 <0.002
0.53 (0.005 5.4 (0.006 7.1 0.012
0.051 0.008
1.3 0.002 <0.0002 <0.0002 0.074 0.43 0.59 0.032
10.002 <0.002 6.1 0.98 0.022 <0.002
5790 75 0 0.27 (0.09 4.7 19 25 0.007
(0.5 0.29
381 14
513 0.52
2710 17
335 5.5
10.1 110 1400
18 13 1.2 2 0.06
340 2200
3
' U n f i l t e r e d samplc, f i l t e r e d sample ana lys i s was e s s e n t i a l l y i d e n t i c a l t o u n f i 1 tered.
2Samples taken one and s i x teen hours i n t o wash episode.
2-18
If t h e f i r e s i d e i s cleaned o n l y w i t h water, t h e waste i s cons idered nonchemical
metal c l e a n i n g waste. The EPA has n o t e s t a b l i s h e d d ischarge requirements f o r
t h i s waste a t t h i s t ime.
Coponding w i t h h i g h volume wastes i s an acceptable t rea tment method a t c o a l - f i r e d
s t a t i o n s .
agents, successfu l t rea tment i s e a s i e r t o o b t a i n than w i t h some b o i l e r chemical
c l e a n i n g wastes. No coal generated f i r e s i d e washes were sampled i n t h i s program.
Since t h e waste stream does n o t c o n t a i n c h e l a t i n g o r complexing
BOILER CHEMICAL CLEANING WASTES
The chemical composit ions o f b o i l e r chemical c l e a n i n g wastes (BCCW) a r e d i f f e r e n t
from most o t h e r wastes generated a t power p lan ts .
p r i m a r i l y c o n t a i n t h e elements p resent i n ash hand l ing and FGD system wastes as
major spec ies (?.e., calcium. magnesium, sodium, carbonate. and s u l f a t e ) . BCCW,
however, c o n t a i n h i g h concent ra t ions o f heavy metals, p r i m a r i l y i r o n and copper,
and i n o r g a n i c o r o rgan ic s o l v e n t s n o t commonly p resent i n power p l a n t l i q u i d
wastes. Much of t h e developmental work on t rea tment of these types o f wastes has
been conducted i n t h e metal f i n i s h i n g i n d u s t r y f o r streams such as p i c k l e
l i q u o r s . p l a t i n g baths, and e t c h i n g so lu t ions .
Most low volume wastes
Yaste Sou r c e
Over t i m e , even w i t h p roper b o i l e r c y c l e water chemist ry c o n t r o l , t h e i n t e r n a l
sur faces o f b o i l e r tubes c o l l e c t deposi ts . These depos i ts increase t h e
r e s i s t a n c e t o heat t r a n s f e r from t h e h o t combustion gases t o t h e water and steam
i n s i d e t h e tubes, which reduces b o i l e r e f f i c i e n c y . I n extreme cases, depos i ts
r e s t r i c t t h e f low o f water s u f f i c i e n t l y t o cause overheat ing and subsequent
f a i l u r e o f t h e b o i l e r tubes.
B o i l e r c l e a n i n g and t h e mechanisms o f depos i t format ion a r e discussed i n d e t a i l
i n a recent EPRI p u b l i c a t i o n (U). formed by t h e r e a c t i o n of elemental i r o n and steam.
immediately a f t e r a chemical c l e a n i n g and cont inue t o grow s lowly throughout t h e
opera t iona l c y c l e of a b o i l e r . The r e s u l t i n g f i l m prevents excess ive m e t a l l i c
i r o n cor ros ion . Other contaminat ion i s caused by leakage i n t o t h e water system
(e.g., from condenser tube leaks) , poor feedwater treatment, and contaminat ion
d u r i n g outages. Since no means c u r r e n t l y e x i s t t o e f f e c t i v e l y p revent depos i ts
from forming, it i s necessary t o c lean t h e tube sur faces p e r i o d i c a l l y .
I n - s i t u depos i ts of magnet i te (Fe304) a r e
These dense depos i ts form
2-19
S e l e c t i o n of c l e a n i n g agents depends on t h e type o f depos i ts t o be removed,
b o i l e r t y p e and meta l lu rgy , and c l e a n i n g costs .
conducted t o h e l p de f ine t rea tment requirements.
commonly used. I n h i b i t e d h y d r o c h l o r i c a c i d i s t h e most p r e v a l e n t s o l v e n t f o r
drum type b o i l e r s o p e r a t i n g over 1800 p s i UD. before t h e h y d r o c h l o r i c a c i d i f copper depos i ts a r e heavy. Ethylenediamine
t e t r a a c e t i c a c i d (EDTA) i s t h e most cmmonly used organ ic so lvent . Both EDTA and
ammoniated c i t r i c a c i d can remove i ron and copper deposi ts . HydroxyaceticJform4c
a c i d (HAF) i s t h e most popular s o l v e n t f o r once-through b o i l e r s . These u n i t s
t y p i c a l l y have s t a i n l e s s s t e e l tubes t h a t cannot t o l e r a t e c l e a n i n g w i t h
h y d r o c h l o r i c ac id .
Laboratory t e s t s are u s u a l l y
F i v e types o f s o l v e n t s a r e
Ammonium bromate i s o f t e n used
v of GeneratiQn
The EPRI manual on chemical c l e a n i n g c o n t a i n s t h e r e s u l t s of a survey conducted
t o i d e n t i f y b o i l e r chemical c l e a n i n g waste p r a c t i c e s U). The r e s u l t s o f t h a t
survey are reproduced i n Table 2-8. These r e s u l t s show a range o f two t o f i v e
years between c leaning5 f o r h i g h e r pressure b o i l e r s t y p i c a l l y used i n t h e
e l e c t r i c u t i 1 i t y i n d u s t r y .
Table 2-8
SURVEY OF BOILER CHEMICAL CLEANING FREQUENCY (l.J.1
Years betwee n chemical c l e Boi 1 e r ty e W e r o f un i ts h avarssa w
Once-th rough Drum type: Over 1800 p s i 1201-1800 p s i 500-1200 p s i
150
467 3 15 228
0.5 2.66 5
1 1 3
3.95 10 4.96 20
10.18 30
2-20
The volume of BCCW wastes produced d u r i n g a c lean ing episode depends on t h e
b o i l e r s i z e and t h e number of r i nses requ i red t o remove a l l of t h e so lvent .
Based on l i m i t e d i n fo rma t ion gathered from p l a n t s sampled d u r i n g t h i s program, an
average b o i l e r volume i s approximately 125 g a l l o n s p e r MW o f genera t ing capac i ty .
B o i l e r volumes f o r these p l a n t s a r e l i s t e d i n Table 2-9. The volume f o r u n i t 3 of P l a n t I i s lower than t h e o t h e r un i t s ; it has a s u p e r c r i t i c a l , once-through
b o i l e r .
--mtiL B G H I, U n i t 1 I, U n i t 3 J L
Table 2-9
BOILER VOLUMES FOR BOILER CHEMICAL CLEANING WASTE
B o i l e r U n i t U n i t Vol u m Capaci ty Volume 0 M 0 30,000 30,000
One r i n s e i s t y p i c a l l y used f o r EDTA, c i t r a t e , HAF, and ammorlium bromate so lu -
t i o n s .
removal o f t h e c h l o r i d e ion .
f rom one c l e a n i n g episode may be several hundred thousand g a l l o n s a t l a r g e power
p lan ts . On an annual ized basis, t h i s volume represents o n l y a few ga l l ons per
minute; however, i n p rac t i ce , t h e volume 1s generated over a pe r iod of several
hours. producing f lows on t h e o rde r o f hundreds of ga l l ons per minute.
HC1 s o l u t i o n s a r e u s u a l l y r i nsed t h r e e o r f o u r t imes t o ensure complete
Based on these values, t h e BCO/ r e q u i r i n g t rea tment
!2bhemical Composit ions
The chemical composi t ions of 17 BCCW samples a r e presented i n Table 2-10. Four
EDTA, two c i t r a t e , two HAF. s i x HC1, and t h r e e ammonium bromate samples a re
presented. Exc lud ing ammonium bromate, t h e o t h e r four types of waste streams
c o n t a i n i m n a t l e v e l s o f 2,000 t o 10,000 mg/L.
p r e v a l e n t metal i n these four wastes, a t concen t ra t i ons up t o 300 mg/L. The
copper concen t ra t i on i n t h e P l a n t C ammonium bromate sample was analyzed a t 1,000
mg/L. Nickel , z inc , and vanadium a r e p resen t i n several of t h e wastes a t lower
Copper i s t h e second most
2-21
Table 2-10
BOILER CHEMICAL CLEANING WASTE COMPOSITIONS (mg/L)
P1 ant: AL J L U E P
Sample D e s c r i p t i o n : EDTA LDlL LELA Wu&i €&r.c&e
E l e m n t a1 Ana lys is Aluminum Antimony Arsenic Barium B e r y l 1 i um Boron Cadmium Cal c i um ChromIum Chromium V I Cobal t Copper I r o n Lead Magnesium Manganese Mercury Molybdenum Nicke l Pot ass i um Selenium S i l i c o n S i l v e r Sodium Thal 1 i um Vanadium Zinc
Water Q u a l i t y pH ( u n i t s ) 6.7 9.6 10.3 6.4 9.8 9.8 A c i d i t y (as CaCO ) 300 110 (10 (10 (10 < l o A l k a l i n i t y ( a s Ca303) 440 17000 19000 11000 19000 21000 Ammonia (as N) 520 6600 7560 6300 7380 8410 COD 6200 15000 32000 40000 14000 15000 Chl o r i de 280 60 (10 (10 F1 uor i de 2.3 0.19 0.67 1.9 0.06 620 N i t r a t e (0.1 20 120 11 N i t r i t e (as N) 1.01 840 0.21 800 1.2 370 S u l f a t e 2100 350 23 (20 TDS 9400 29000 43000 17000 25000 TOC 2500 16000 23000 20500 6900 7050
'D i lu ted about 1 : l O w i t h r inses.
2-22
P1 ant:
Sample Oescr i p t i o n :
Elemental Ana lys is Aluminum Antimony Arsen ic Barium B e r y l 1 i um Boron Cadmium Cal c i um Chromium Chromium V I Cobal t Copper I r o n Lead Magnesium Manganese Mercury Molybdenum Nicke l Potassium Selenium Si1 i c o n S i l v e r Sodium Thal 1 i um Vanadium Z i n c
Table 2-10 (cont inued)
BOILER CHEMICAL CLEANING WASTE COMPOSITIONS (mg/L)
BOILER CHEMICAL CLEANING WASTE COMPOSITIONS (mg/L)
P lan t :
Sample Descr ip t ion :
Elemental Ana lys is A1 uminum Antimony Arsenic Barium B e r y l 1 i um Boron Cadmium Cal c i um Ch r o m i urn Chrmium V I Cobal t Copper I r o n Lead Magnes i urn Manganese Mercury Mol ybden urn N icke l Potassium Selenium S i1 i con S i l v e r Sodium Thal 1 i um Vanadium Z inc
Water Q u a l i t y pH ( u n i t s ) A c i d i t y (as CaCO ) A1 ka l i n i t y (as Cb03) Ammonia (as N) coo Ch lor ide F l u o r i d e N i t r a t e N i t r i t e (as N ) S u l f a t e TDS TOC
concentrat ions. The ac tua l waste composit ion i s dependent upon several impor tan t
f a c t o r s which were n o t c o r r e l a t e d i n t h i s document. They inc lude t h e b o i l e r
meta l lurgy, t ime between chemical cleaning, l eng th o f c leaning. and p u r i t y o f t h e
so lvent . A l l o f these fac to rs a f f e c t t h e waste composit ion t o sane extent. The
reader i s r e f e r r e d t o t h e EPRI manual o f b o i l e r c lean ing f o r f u r t h e r i n fo rma t ion
(11).
Of t h e s i x t e e n concentrated BCCW samples, n ine may be RCRA hazardous because of
EP t o x i c i t y c h a r a c t e r i s t i c s . One EDTA waste, one c i t r a t e waste, one HAF waste,
and f o u r HC1 wastes tes ted as having t o t a l chromium concent ra t ions above t h e
regu la to ry l i m i t o f 5 mg/L. One EDTA waste t e s t e d as hav ing a l ead va lue above
t h e l i m i t of 5 mg/L. The s i x HC1 samples might a l s o be c l a s s i f i e d as RCRA
hazardous, cor ros ive , if t h e pH were n o t ra i sed above 2 i n an elementary
n e u t r a l i z a t i o n u n i t . The ana lys i s i n Table 2-10 shows t h a t chromium i s present
predominantly i n t h e t r i v a l e n t s ta te .
measured. Fu r the r d iscuss ion of t h i s issue i s presented i n Sec t ion 3.
No hexavalent l e v e l s above 5 mg/L were
Each o f t h e wastes has spec ia l c h a r a c t e r i s t i c s based on t h e so l ven t fo rmula t ion .
The EDTA streams con ta in high l e v e l s o f ammonia, which a t pH l e v e l s o f 8 t o 11
complex w i t h copper. Sodium n i t r i t e i s a l s o added t o t h e s o l u t i o n i n some
instances t o reduce o x i d a t i o n reac t i ons i n t h e b o i l e r . EDTA. c i t r a t e , and HAF
a l l have h igh TOC and COD values because o f t h e i r o rgan ic base. The HAF solu-
t i o n s con ta in very low l e v e l s of copper, r e f l e c t i n g t h e i r use i n once through
u n i t s where few copper components a re employed.
very low I n pH, r e f l e c t i n g an i n i t i a l HC1 concent ra t ion o f about f i v e weight
percent. Z inc and n i c k e l l e v e l s a r e a l s o somewhat h i g h e r i n t h e HC1 wastes than
t h e other, more a l k a l i n e so lu t i ons . Ammonium b i f l u o r i d e , th iourea , Cutain, and
Rodine a re a d d i t i v e s used t o prevent t h e p l a t i n g of s o l u b i l i z e d copper on c lean
metal surfaces. The presence of these i n h i b i t o r s i n hyd roch lo r i c a c i d wastes i s
i n d i c a t e d by h i g h TOC concentrat ions.
e x c l u s i v e l y fo r removing copper ox ide deposits.
d i s s o l v e t h e deposits, w h i l e t h e ammonia forms c u p r i c tetraamine, a very s t a b l e
i o n a t a l k a l i n e pHs.
The hyd roch lo r i c a c i d d ra ins a r e
Ammonium bromate s o l u t i o n s a re used
Sodium bromate i s used t o
Table 2-11 presents analyses of seven r i nses from b o i l e r chemical c lean ing
wastes. The f i r s t r i n s e a f t e r t h e s o l v e n t has been dra ined o f t e n conta ins l e v e l s
o f i r o n and copper g rea te r than 1 mg/L, and 5 t o 10 percent o f t h e so lvent .
2-25
P1 ant:
Sample Oescr i p t ion :
Elemental Ana lys is A1 urn i n um Antimony Arsenic Barium B e r y l 11 um Boron Cadmi um Calcium Chromium Cobal t Copper I r o n Lead Magnesium Manganese Mercury Molybdenum N i c k e l Potassium Selenium S i l i c o n S i l v e r Sodium T h a l l ium Vanadium Zinc
Water Qual i t y pH ( u n i t s ) A c i d i t y (as CaCO ) A l k a l i n i t y (as C k 0 3 ) COO Ch lor ide F l u o r i d e N i t r a t e N i t r i t e (as N) Su l fa te TOS
Table 2-11
BOILER CLEANING RINSE COMPOSITIONS (mg/L)
B
HC1 _BII15k
0.48 0.077
<0.002 0.051
(0.001 (0.05 0.002
21 0.045 0.013 1.7
86 0.7 5 0.9 0.0003 0.007 0.25 2.4
co.002 2.2 0.0038
13 (0.09 (0.003 0.14
P
C i t r a t e -Binsk
1.2 0.15 0.018 0.097
(0.01 4 0.04 6.3 0.77 0.09 8.5
(0.002 0.91 3.4
<0.0002 0.19 0.49
(0.05 (0.002 1.2
(0.02 85 (0.09 0.03 0.49
520
9.3 (10
1050
24 150 (1 12 (5
1700
U
EDTA _BFas8
(0.05 0.032 0.014 0.005 . ~ ~~
0.004 (0.05 (0.002 21
0.11 0.023 0.94
0.46 145
4.1 1.3
<o . 0002 0.098 0.64 1.3
<0.002 0.45
<0.002 25 (0.09 0.003 1.6
9.1 (10 530
1200 6 0.7
30 1.4
20 1400 460 TCC
2-26
Plan t :
Sample Desc r ip t l on :
Elemental Ana lys i s A1 umi num Antimony Arsenic Barium Bery l1 i um Boron Cadmium Cal c i um Chromium Chrmium V I Cobal t Copper I r o n Lead Magnesium Manganese Mercury Molybdenum N icke l Pot ass1 um Selenium S i l i c o n S i l v e r Sod i um Thal 1 i um Vanadium Zinc
Water Q u a l i t y pH ( u n i t s ) A c i d i t y (as CaCO ) A1 k a l i n i t y ( a s C a b 3 ) coo Ch lo r ide F l u o r i d e N i t r a t e N i t r i t e (as N) S u l f a t e TDS TOC
Table 2-11 (cont inued)
BOILER CLEANING RINSE COMPOSITIONS
B
Soda ash Rinse
0.51 (0.02 <0.002 0.019
(0.001 (0.05 0.022 0.64
(0.005
(0.006 0.39 4.6 0.64
(0.03 0.01 (0 .0002 0.022
(0.003 1.9
(0.02 0.94 0.011
2200 (0.09 (0 .003
0.09
(mg/L)
G
Water -Ehs.e-
<0.05 0.075 0.004 0.006
(0.001 0.23 0.007
0.011
(0.006 0.31 0.14
<0.002 6.2 0.004
0.033 0.031 3.2
(0.002 6.7 0.0063
18
35 (0.09 0.009 0.006
G
Hydrazine Au@s%-
(0.5 (0.2
(0.01 (0.01 (0.5 0.041 6.9 0.07 0.064
(0.06 0.98
<0.002 0.5 0.86
0.49 3
(0.5 (0 .002 1.1 0.028
0.015
120
1900 (0.9 (0.03 0.11
i
Phosphate Rinse
0.85 c0.02 0.01 0.009
(0.001 c0.05 (0.002 0.17 0.028 0.007
(0.006 0.29 0.24
(0.08 (0.03 (0.001 <0.0002 0.018
(0.003 0.34
(0.002 2.9
co.002
(0.09 1530
0.012 0.013
9.4 (10
2800 480 11
1.3 (2 (0.02 10
5600 53
2-27
Disoosal P r a c t i c e s
Cur ren t federa l d ischarge r e g u l a t i o n s f o r BCCW a r e s p e c i f i e d by t h e U.S.
Environmental P r o t e c t i o n Agency (EPA) (U). EPA as a metal c l e a n i n g waste and must meet t h e f o l l o w i n g requirements p r i o r t o
d ischarge under t h e NPDES program:
Th is stream i s r e f e r r e d t o by t h e
6 <pH (9;
e T o t a l suspended s o l i d s (30 mg/L;
O i l and grease- (20 mg/L; and
e I r o n and copper- cl mg/L each.
F u r t h e r d e t a i l s on r e g u l a t i o n s associated w i t h t h i s and o t h e r wastes a r e
conta ined i n Sec t ion 3.
The Best A v a i l a b l e Technology (BAT) de f ined by EPA f o r these wastes i s
phys ica l /chemical t rea tment us ing l i m e p r e c i p i t a t i o n (I). The u t i l i t y s i t e s
sampled used a v a r i e t y of t rea tment techniques f o r these wastes. Table 2-12 presents t h e d i s p o s i t i o n of t h e sampled waste streams.
t reatn lent i s t h e most f requent ly p r a c t i c e d technique, fo l lowed by coponding w i t h
f l y ash. As can be seen, t h e organ ic c lean ing s o l u t i o n s (EDTA and c i t r a t e ) a r e
the on ly wastes t r e a t e d by d i r e c t evaporat ion i n t h e b o i l e r .
Physical/chemical
Table 2-12
TREATWENT VETHODS CBSERVED FOR BOILER CHEMICAL CLEANING WASTE SAMPLES
B o i l e r Chenlical Cleaning
Waste Tvoe
EDTA C i t r a t e tiAF HC1 Ammonium bromate
Number o f 0-s
Evaporat ion P h v s i c a l K h i n B o i l e r CoDondlna
1 - 2 3 2
The performance e f fec t i veness and c o s t s of each of these processes i s discussed
i n Sec t ion 4 .
2-28
COOLING TOWER BASIN SLUDGE
A i rborne s o i l and dust and system debr is can be scrubbed from t h e a i r by t h e
c o o l i n g water d u r i n g c o o l i n g tower operat ion. T h i s m a t e r i a l . along w i t h
suspended s o l i d s i n t h e makeup water, c o l l e c t s i n t h e tower bas in and requ i res
i n f r e q u e n t d isposal . A p r i o r low volume waste survey determined t h a t t h e sludge
was ronioved over a frequency o f one t o f i v e years. Three samples were analyzed
and found t o c o n t a i n l a r g e f r a c t i o n s o f aluminum, calcium, i ron . and presumably
s i l i c a (1). wastes p r i o r t o l a n d f i l l i n g .
The waste was e i t h e r l a n d f i l l e d separa te ly o r mixed w i t h h igh volume
TREATMENT SLUDGES AND BRINES
Waste S ource
Sludges a r e produced from l i m e s o f t e n i n g and c l a r i f i c a t i o n o f raw p l a n t makeup
water; however, because raw water seldom conta ins de tec tab le l e v e l s of t o x i c
metals, these sludges a r e n o t t y p i c a l l y of concern under RCRA. The sludges t h a t
a r e o f g rea ter concern a r e those generated d u r i n g phys ica l /chemical t rea tment o f
v a r i o u s p l a n t waste streams.
Low volume wastes may be t r e a t e d i n d i v i d u a l l y o r m y be combined i n an
e q u a l i z a t i o n bas in p r i o r t o t reatment .
t rea tment i s g e n e r a l l y d i c t a t e d by t h e c h a r a c t e r i s t i c s of t h e low volume wastes
and t h e d ischarge requlrements f o r s p e c i f i c streams. Metal c l e a n i n g wastes
( b o i l e r chemlcal c l e a n i n g wastes and f i r e s i d e wastes) must meet more s t r i n g e n t
d ischarge c r i t e r i a than o t h e r low volume wastes, such as demineralizer
regenerant. dra ins, o r b o i l e r blowdown. As a r e s u l t , metal c l e a n i n g wastes a r e
o f t e n t r e a t e d separate ly .
The choice o f separate o r combined
Treatment of l a r g e r volume wastes a l s o r e s u l t s i n t h e produc t ion of sludges o r
b r ines .
s i o n evapora t ion a r e examples of h igh volume waste t reatments t h a t produce
sludges and br ines .
streams, t h e sludges from these processes a r e considered low volume wastes f o r
t h e purposes of t h i s manual.
Sidestream s o f t e n i n g of r e c i r c u l a t i n g c o o l i n g water and vapor compres-
Although they a r e t h e r e s u l t of t r e a t i n g l a r g e volume waste
b a u e n c v of Gene r a t i o n
Sludge o r b r i n e i s generated cont inuous ly when makeup water treatment, sidestream
sof ten ing, or vapor compression evaporat ion t rea tment i s requfred. Sludges from
2-29
t reatment o f b o i l e r chemical c lean ing wastes a r e produced a t r e l a t i v e l y
i n f r e q u e n t i n t e r v a l s .
f r a n b o i l e r c leanings annually, even though t h e l i q u i d c lean ing wastes a r e
generated and t r e a t e d several t imes a year.
t reatment i s i n s u f f i c i e n t t o j u s t i f y more frequent ope ra t i on of t h e dewater ing
equipment.
One u t i l i t y sampled d u r i n g t h i s program processes sludges
The sludge volume produced p e r
The sludge volumes produced a re dependent on stream f l ow rates, t h e amount of
p r e c i p i t a t e d s o l i d s formed, and t h e t ype of t reatment used.
a re removed from t h e waste stream, they must a l s o be inc luded i n t h e sludge
volume. Table 2-13 presents est imated volumes of sludges and b r i n e s f o r va r ious
low volume wastes.
I f suspended s o l i d s
Chemical ComDosi t i o a
The composi t ion o f sludges and b r ines depends p r i m a r i l y on t h e waste stream and
t h e t reatment procedure used.
employed, t h e sludge w i l l be predominant ly ca lc ium carbonate and metal
hydroxides. w i t h t h e remainder c o n s i s t i n g o f t h e o r i g i n a l suspended s o l i d s
con ten t of t h e waste.
i r o n and copper hydrox ide concentrat ions.
a h igh i n e r t s content, and i r o n and o t h e r metal hydroxides. Streams such as
deminera l izer regenerant. f l o o r and yard drains, and b o i l e r blowdown produce few,
i f any. s o l i d s d u r i n g t reatment .
Where cold-1 ime so f ten ing and c l a r i f i c a t i o n a r e
B o i l e r chemical c lean ing wastes produce sludges w i t h h igh
F i r e s i d e wastes produce a s ludge w i t h
Table 2-14 presents sludge composi t ions f o r e i g h t wastes; these inc lude four
f i r e s i d e and f o u r BCCW.
l i m a t reatment) i r on , magnesium ( u s u a l l y a f u e l o i l a d d i t i v e ) , n i cke l , sodium.
and vanadium as major c o n s t i t u e n t s ( g r e a t e r than one percent by weight ) . BCCU
waste sludges a r e sanewhat s i m i l a r , c o n t a i n i n g copper, s i l i c o n , and sodium a t
h i g h l e v e l s i n a d d i t i o n t o t h e above meta ls (except vanadium).
The f i r e s i d e t reatment sludges c o n t a i n ca lc ium (from
Table 2-15 presents composi t ions o f sludges and b r i n e s r e s u l t i n g from vapor
compresslon evaporat ion (VCE) of p l a n t wastewaters. Three power p l a n t s a r e
represented i n Table 2-15. Samples o f evaporat ion pond l i q u i d were obta ined from
two of t h e p l a n t s where t h e VCE r e j e c t s a r e disposed o f . The composi t ions of t h e
pond l i q u i d s show increased d i sso l ved i o n concentrat ions. Major c o n s t i t u e n t s
i n c l u d e sodium, magnesium. ch lo r i de . and su l fa te . The sludge s o l i d s produced by
vapor compression evaporat ion a r e almost e n t i r e l y ca lc ium based, presumably
2-30
- Coal p i l e runo f f
Oeniineral i z e r regenerant
B o i l e r blowdown
F l o o r 8 yard d r a i n s
F i r e s i d e waste
B o i l e r chml i ca l c lean ing waste
Water or wastewater t reatment sludge
( th i ckened)
Cool ing tower s ludge
P v r i t e s (b i tuminous)
Table 2-13
ESTIMATED VOLUMES OF SLUDGES AND BRINES
Suspended - 200
10
0
50
100
50
75,000
350,000
- (sub b i tumi nous 1 -
E s t i mated Slugge Volume
P o t e n t i a l (yd / m i l l i o n l
0 0.8
v _qsl l lons)
0 0.04
0 0
0 0.2
500 2
10,000 42
0 310
0 1460
- 0.02 cu yd/yr/MW
- 10 cu yd/yr/MW - 0.1 cu yd /y r /W
'Estimated sludge volumes generateg by one m i l l i o n g a l l o n s o f low volume waste. A s e t t l e d bu lk dens i t y of 75 l b / f t was assumed.
Elemental Ana lys is A1 uminum Antimony Arsenic Barium B e r y l l i u m Boron Cadmium Calcium Ch rom i um Cobal t Copper I r o n Lead Magnesl um Manganese Molybdenum Nicke l Potassium Selenium S i l i c o n S i l v e r Sod i um T h a l l i um Vanadium Zinc
Elemental Ana lys is A1 um i n um A n t i mony Arsenic Bar i urn B e r y l 1 I um Boron Cadnii um Calcium Chrom i urn Coba l t Copper I r o n Lead Magnesium Manganese Molybdenum N i c k e l Potass i um Sel en i um S i l i c o n S i 1 ver Sodium Thal 1 i um Vanadium Z inc
B
BCCW LmLdQe-
8900 200 330
73
510 57
118900 35 0 130
6800 255400
610 6000
65 0 8 1
2700 <50 250
17400 (2
15400 (90
3500 1900
4.1
(c1!3/9)
C
BCCW s.J-uQe
19000 670 870 150 (10
1500 160
7100 1400
150 44600
305500 <800 6300 1600
160 11000 <500 1200 6400
73 88700
1900 620
10700
F
BCCW .Sludae
2590 36
170
(1 610
12 49100
780 27
5 00 200000
36 128000
1100 340 290 150 150
3670
26200 18 63
120
7.9
2.9
G
BCCW Sludoe
3370 88
120 36
220 99
144900 430
62 11900
186900 290
10100 2740
3 1 6880
(50 210
11600 (2
7410 189 280
4440
1.6
2-33
Tab le 2-15
VAWR COMPRESSION EVAWRATION SLUDGES AND BRINES (mg/L)
P l a n t : M N 0 M 0
1
w
3.9
Sample D e s c r i p t i o n : B r i n e
Elemental Ana lys i s A1 um i n um Antimony 0.28 Arsen ic 0.27 Barium 0.1 B e r y l l i u m 0.003 Boron (0.05 Cadmium 0.03 Calcium 452 Chrom i um 0.31 Chrmium V I Coba l t 0.05 Copper 1.4 I r o n 10 Lead (0.002 Magnes i urn 3100 Manganese 1.7 Mercury 0.0003 Molybdenum 1.5 N i c k e l 0.37 Potassium 710 Selenium 0.027 S i l i c o n 69 S i 1 ver 0.03 Sodium 25800 Thal 1 i urn 0.19 Vanad i Lim 0.51 Z inc 4.1
Water Qual i t y Values pH ( u n i t s ) 4.9 A c i d i t y (as CaCO ) 570 A l k a l i n i t y (as C&03) 440 Ammonia (as N) coo 4400 C h l o r i d e 36000 F l u o r i d e 170 N i t r a t e (500 N i t r i t e (as N) 40 S u l f a t e 63000 TDS 104000 TOC 710
__ 'Reject from vapor conlpression evapora t ion u n i t .
'Evaporation pond water.
1.3
1.5
0.01
0.12 0.41 4.4
165
99
49300
4.6 5100
15
7400 4100
40 6400
43000 107000
180
0.02
2 Pond blouid
(0.05 0.12 0.14 0.15 0.003
56 0.003
353 0.025
0.047 0.076 0.39
(0.002 3620
1.8 (0 .0002 0.33 0.32
380 0.037
45 <0.002
7110 0.21 0.27 2.2
6.2 140 310
4200 7600
100 (1 3.9
66000 122000
1800
2-34
Table 2-15 (cont inued)
VAPOR COMPRESSION EVAPORATION SLUDGES AND BRINES ( W g )
P l a n t :
Sample D e s c r i p t i o n :
Elemental Ana lys is A 1 um i n um Antimony Arsenic Bar i uni B e r y l 1 i um Boron Cadmium Calcium Ch rom i um Coba l t Copper I r o n Lead Magnesium Manganese Molybdenum N i c k e l Potassium Selenium S i l i c o n S i l v e r Sodium T h a l l i um Vanadium Z inc
N
VCE Sludae
72 <21
(6 169 <0.1
146 10.2
247000 11
33 95 (8
2010
0.75
3.9 0.73 4
292 11
186 1.7
4160 <9
42 5.4
'VCE - vapor compression evapora t ion
0
VCE' S1 udge
705 (20
(6 165 <0.09 51 (0.19
226500 3.5
<0.6 14
418 <8
1840 16 <0.02 0.98
220 <8
3226
1450 <8
55
0.96
3.2
2-35
gypsum and some calc ium carbonate.
impoundments used t o s t o r e o r evaporate t h e VCE b r i n e s .
These sludges c o l l e c t a t t h e bottom of
D isoosa l P r a c t i c e s
Disposal p r a c t i c e s f o r t rea tment sludges and b r i n e s vary accord ing t o r e g u l a t o r y
requirements. Of p a r t i c u l a r concern i s t h e t o x i c i t y c h a r a c t e r i s t i c determined
us ing t h e E x t r a c t i o n Procedure (EP). According t o RCRA, t h e composi t ion o f a
s o l i d o r semi-so l id waste does n o t determine i f it i s t o x i c . The r e s u l t s o f t h e
EP, i n which t h e sludge i s mixed w i t h a l e a c h i n g f l u i d , which i s t h e n analyzed,
determines i f a waste i s t o x i c . L i q u i d wastes ( l e s s than 0.5 percent s o l i d s ) a r e
analyzed d i r e c t l y and compared t o t h e EP t o x i c i t y l i m i t s . These r e g u l a t o r y
issues and t h e r e s u l t s o f t h e EP and o t h e r types o f e x t r a c t i o n s a r e discussed i n
d e t a i l i n Sec t ion 3.
Non-hazardous sludges a r e g e n e r a l l y disposed o f by coponding o r c o l a n d f i l l i n g if
f a c i l i t i e s a r e a v a i l a b l e .
l a n d f i l l s , c o n t r a c t o r s a r e h i r e d t o dispose o f these sludges.
c l a s s i f i e d as hazardous, l a n d f i l l s o r ponds used f o r d isposal must meet RCRA
standards.
A t p l a n t s t h a t do n o t have e i t h e r ash ponds o r
For sludges
Consequently, hazardous s1 udges a r e o f t e n disposed o f by c o n t r a c t o r s .
SANITARY WASTE
San i ta ry wastes a r e produced a t a l l f a c i l i t i e s and a r e n o t unique t o power
s t a t i o n s . Est imated s a n i t a r y sewage f l o w s from i n d u s t r i a l f a c i l i t i e s range from
0 t o 25 g a l l o n s per day per c a p i t a . Disposal or t rea tment of t h i s stream depends
p r i m a r i l y on t h e p r o x i m i t y o f a mun ic ipa l t rea tment p l a n t . If no p u b l i c f a c i l i t y
i s a v a i l a b l e f o r in terconnect ion, small package systems may be purchased and
operated by u t i 1 i t i e s . I n remote regions, s imple systems such as f a c u l t a t i v e
lagoons o r s e p t i c tanks may be used.
sludge can be purchased as complete systems from vendors.
f o r s a n i t a r y waste a r e u s u a l l y s e t by l o c a l r e g u l a t i o n s and vary depending on t h e
f l o w and q u a l i t y of t h e r e c e i v i n g stream.
More advanced systems us ing a c t i v a t e d
E f f l u e n t requirements
WASTE O I L S
Waste o i l s a r e produced a t power p l a n t s by equipment maintenance opera t ions
(e.g., l u b r i c a t i o n o i l s , h y d r a u l i c f l u i d s . e t c . ) and by o i l / w a t e r separa t ion
processes w i t h i n waste t rea tment systems.
determine t h e d isposal requirements f o r these wastes. These standards may
address t h e p o l y c h l o r i n a t e d b iphenyl (PCB) and halogenated hydrocarbon
C u r r e n t l y proposed r e g u l a t i o n s w i l l
2-36
concent ra t ions of some waste o i l s . Waste o i l t rea tment and d isposal i s n o t
discussed f u r t h e r i n t h i s r e p o r t because gu ide l ines regard ing t h e i r r e g u l a t o r y
s t a t u s a r e forthcoming. S p e c i f i c i tems o f concern i n storage, disposal, and
combustion of waste o i l s i n c l u d e PCB and halogenated hydrocarbon concentrat ions.
SUMMARY
Table 2-16 summarizes severa l impor tan t ca tegor ies o f i n f o r m a t i o n about t h e low
volume waste streams discussed i n t h i s sec t ion . The i n f o r m a t i o n presented here
i s general and s p e c i f i c analyses should be performed p r i o r t o s e l e c t i o n of
appropr ia te d isposal op t ions . The r e g u l a t o r y fac to rs t h a t should be considered
i n a s p e c i f i c a n a l y s i s a r e discussed next i n Sec t ion 3.
2-31
N I w m
Tab le 2-16
SUMMARY OF LOW VOLUME WASTE CMPRACTERISTICS
Frequency o f Waste Source Generat ion
P y r i t e s Coal Can be cont inuous
Coal p i l e P rec i p i - Var ies r u n o f f t a t i o n
F l o o r and Pump seals, Continuous yard d r a i n s sumps, c lean-
ing, l a b analyses
Deminer- Raw water Continuous a l i z e r t rea tmen t regenerant
B o i l e r Steam c y c l e Continuous b l owdown con t am i n ants
F i res i de Furnace 1-6 annua l ly c lean ing sur faces
- Vol ume
Var ies s i g n i f i c a n t l y
Var ies s i gni f ican tl y
40 g p d / N
40-100 gpd/FM
150-290 gpd/MW
3-18 gpd/MW
Treatment/ Disposal
Composit ion P rac t i ces
I n e r t s , FeS2 Col andf i 1 1, coponding. 1 and f i 1 1
Can be a c i d i c N e u t r a l i z a t i o n , w i t h h i s h sedimentation, i ron 1 eve1 s
P o t e n t i a l l y O i l skimming, contaminated reuse, coponding, w i t h o i l , sus- discharge pended so l i d s
Var ies from Neu t ra l i za t i on , a c i d i c t o equa l i za t i on , bas i c coponding
High q u a l i t y Reuse, coponding, (<15 mg/L TSS) discharge
High metals. P h y s i c a l / c h m i c a l , suspended cop0 n d i ng so l i d s concen t ra t i on
coponding
' I ' I I ' I
Waste
B o i l e r chec ica l c lean ing
Coo l ing t c s e r bas in sludge
Sludges and t r i n e s
S a n i t a r y waste
Waste O i l s
' I ! I
Tab le 2-16 (cont inued)
SUNbiP,RY OF LW! VGLLINE WASTE CHARACTERISTICS
Source
E o i l e r t u b e i n t e r n a l s
D i r t , dust, d e b r i s
K a t e r and wastewater t rea tment
U t i l i t y personnel
Maintenance opera t ions
Frequency of Generat ion
Once every 2-5 yesrs
Every 1-5 y t a r s
Can be cont inuous
Continuous
I n t e r i x i t t e n t
Volume
125 g a l l o n s per 1%
Var ies
Var ies s i g n i f i c a n t l y
8-25 gpd/ person
Unkcown
. . Comcosit ion
High iron, copper, s c l - veri t l e v e l s
I n e r t s . a1 um- ina-s i1 i c a t e s
Hydrox i de, carbonate, s u l f a t e s a l t s c f c a t i o n s present
Crganic contan i n a n t s
Hydrocartons w i t h p c s s i b l e t r a c e meta ls
Treatment/ G i sposal
P r a c t i c e s
F h y s i c a l / c h m i c a l , copontiins, evapora t ion
L a n d f i l l . coland- fill, coponeing
C o l a n d f i l l . land- f i l l . evapora t ion ponds. c o n t r a c t d isoosa l
Discharge t o FCTW, s e p t i c systems, lagoons
Burnin5, con- t r a c t d isposa l
I ' I
Sect ion 3
ENVIRONMENTAL REGULATION OF LOW VOLUME WASTES
The major f ede ra l environmental regu la t i ons a f f e c t i n g t h e management of low
volume u t i l i t y wastes are t h e Resource Conservation and Recovery Act (RCRA) and
t h e Federal Water P o l l u t i o n Cont ro l Act (FWPCA). RCRA, as enacted i n 1976 and
amended i n 1984. regu la tes t h e storage, t rea tment and d isposal o f s o l i d waste.
It app l i es t o low volume wastes when they a r e d iscarded o r a re no longer used i n
t h e process. As amended i n 1984, RCRA a l s o regu la tes t h e s torage o f hazardous
substances and petroleum i n underground tanks.
Clean Water Act (CWA) of 1977, regu la tes t h e discharge o f i n d u s t r i a l waters t o
surface waters through t h e Nat iona l P o l l u t a n t Discharge E l i m i n a t i o n System
(NPDES). Any d i r e c t discharges o f low volume waste o r t rea tment o f low volume
waste fo r d ischarge a r e governed by NPDES regu la t i ons .
wastes t o p u b l i c l y owned t rea tment works (POW) i s governed by pret reatment
standards.
The FWPCA. as amended by t h e
Discharge o f low volume
The r e s p o n s i b i l i t y f o r admin i s te r i ng p a r t s of t h e federa l RCRA and NPDES
regu la to ry programs has, w i t h U.S. Environmental P r o t e c t i o n Agency (EPA)
approval, been assumed by many s ta tes . I n a d d i t i o n to, o r i n l i e u o f , t h e
federa l programs. most s t a t e s admin is te r wastewater d ischarge and so l id /hazardous
waste regu la to ry programs author ized under s t a t e law.
Th is review i s n o t in tended as a d e f l n i t i v e o r comprehensive d e s c r i p t i o n o f t h e
s o l i d waste r e g u l a t i o n s p o t e n t i a l l y app l i cab le t o management o f low volume
u t i l i t y wastes. It i s a summary o f r e g u l a t i o n s a t t h e time o f t h e r e p o r t and
inc luded as a re ference p o i n t f o r t h e issues be ing addressed and should on ly be
viewed as such. For c u r r e n t r e g u l a t o r y in format ion, t h e reader i s re fe r red t o
p r i n a r y sources such as t h e Federal Rea i s a o r t h e Code o f Federal R e o u l a t i u .
3-1
RESOURCE CONSERVATION AND RECOVERY ACT (RCRA)
As enacted by Congress i n 1916 and amended i n 1984, t h e Resource Conservation and
Recovery Act (RCRA) au thor izes EPA t o e s t a b l i s h a comprehensive program f o r
r e g u l a t i n g t h e generation, t r a n s p o r t a t i o n , treatment, storage, and d isposal of
s o l i d wastes (bo th hazardous and non-hazardous).
Under RCRA, a waste generator r e t a i n s r e s p o n s i b i l i t y f o r t h e hazardous waste
whether it i s disposed o f on s i t e or hauled t o an o f f - s i t e l o c a t i o n by a
cont rac tor . Therefore, l i a b i l i t y as w e l l as c o s t should be considered i n
s e l e c t i n g d isposa l methods. I n recent c o u r t r u l i n g s , a l l generators o f wastes
t rea ted , stored, o r disposed a t o f f - s i t e f a c i l i t i e s have been dec lared l i a b l e f o r
c o s t s o f remed ia t ing environmental damages which r e s u l t from improper treatment,
storage, o r d isposal . - F i g u r e 3-1 presents a dec is ion c h a r t for i d e n t i f y i n g RCRA-regulated hazardous
waste from u t i l i t y low volume wastes.
A m a t e r i a l i s a hazardous waste if it i s l i s t e d as hazardous, o r has t h e
c h a r a c t e r i s t i c s of a hazardous waste, i s discarded, and i s n o t express ly exempt
under RCRA. A "discarded m a t e r i a l " i s any m a t e r i a l which i s :
e Abandoned --disposed of, --burned or inc inerated, o r - -s tored o r t r e a t e d p r i o r t o being abandoned:
e Recycled --used i n a manner c o n s t i t u t i n g d isposal by be ing placed on t h e
--burned f o r energy recovery, --reclaimed, o r --accumulated s p e c u l a t i v e l y :
1 and,
a Accumulated f o r s p e c u l a t i v e sale: o r
e I n h e r e n t l y was te- l i ke as designated by EPA.
I f t h e waste i s t r e a t e d f o r d ischarge under CWA, t h e discharge i t s e l f i s n o t a
s o l i d waste and t h u s i s n o t regu la ted under RCRA: b u t a l l s torage i n impoundments
o r tanks b e f o r e d ischarge i s RCRA-regulated.
3-2
I
I - I I
RCRA r e g u l a t i o n s s p e c i f y t h e methods by which wastes a re c l a s s i f i e d as hazardous.
States, however, may l i s t a d d i t i o n a l wastes as hazardous o r may speci fy d i f f e r e n t
methods which a r e t o be used t o c l a s s i f y wastes as hazardous.
Although some low volume wastes may be considered hazardous according t o RCRA
c l a s s i f i c a t i o n , t h e i r codisposal o r cot reatment w i t h c e r t a i n u t i 1 i t y wastes i s
t e m p o r a r i l y exempt from RCRA regu la t i on .
l e g i s l a t l o n e n a c t i n g RCRA, t h e EPA prov ided an i n t e r i m exc lus ion of f o s s i l fue l
combustion wastes from hazardous waste r e g u l a t i o n s (U). The exc lus ion prov ides
t h a t t h e f o l l o w i n g s o l i d wastes a re n o t hazardous wastes:
As mandated by Congress i n t h e 1976
F l y ash waste, bottom ash waste, s l a g waste. and f l u e gas emission c o n t r o l waste generated p r i m a r i l y from t h e combustion of coal o r other f o s s i l f u e l s .
EPAfs O f f i c e o f S o l i d Waste has i n t e r p r e t e d t h e language o f t h e f o s s i l fue l
combustion waste exc lus ion t o mean t h a t t h e f o l l o w i n g s o l i d wastes a r e n o t
hazardous wastes (B) :
F l y ash, bottom ash, b o i l e r s l a g and f l u e gas emission c o n t r o l wastes r e s u l t i n g from: (1) t h e combustion s o l e l y o f coal , o i l . o r na tu ra l gas, (2) t h e combustion o f any m i x t u r e o f these f o s s i l fue ls , o r (3) t h e combustion o f any m i x t u r e o f coa l and o t h e r fue ls , up t o a 50 percent m i x t u r e o f such o the r fue l s .
Wastes produced i n con junc t i on w i t h t h e combustion of f o s s i l f ue l s , which a re n e c e s s a r i l y associated w i t h t h e product ion of energy, and which t r a d i t i o n a l l y have been, and which a c t u a l l y are, mixed w i t h and codisposed o r co t rea ted w i t h f l y ash. bottom ash, b o i l e r slag, o r f l u e gas emission c o n t r o l wastes from coal combustion.
T h i s p r o v i s i o n includes, b u t i s not l i m i t e d to , t h e f o l l o w i n g wastes:
B o i l e r c l e a n i n g s o l u t i o n s ;
B o i l e r blowdown;
Deminera l izer regenerant;
P y r i t e s ; and
Cool ing tower blowdown.
T h i s exc lus ion from hazardous waste r e g u l a t i o n app l i es o n l y u n t i l such t ime as
EPA s t u d i e s t h e environmental e f f e c t s from disposal of these wastes and deter-
mines how they should be regulated. I n A p r i l 1987. EPA i s scheduled t o produce a
r e p o r t o f i t s f i n d i n g s and recanmendations on f o s s i l f u e l combustion wastes t o
Congress. A t t h a t t ime , a recommendation f o r c o n t i n u a t i o n o r cessat lon o f t h e
3-4
exemption s t a t u s f o r u t i l i t y wastes w i l l be submi t ted by EPA.
low volume wastes which a re codisposed or cot rea ted a re regu la ted as s o l i d
wastes, sub jec t t o RCRA S u b t i t l e D c r i t e r i a ( S u b t i t l e D--State o r Regional S o l i d
Waste P1 ans) and s t a t e r e g u l a t i o n s adopted thereunder.
I n t h e meantime,
I f t h e low volume waste i s sub jec t t o RCRA r e g u l a t i o n and i s n o t express ly
exempted, then it i s c l a s s i f i e d as hazardous o r nonhazardous i n accordance w i t h
Subpart C of 40 CFR P a r t 261. l These r e g u l a t i o n s speci fy t e s t s f o r determin ing
if a waste i s i g n i t a b l e , cor ros ive , reac t i ve , o r E x t r a c t i o n Procedure (EP) t o x i c
by c h a r a c t e r i s t i c .
O f t h e f o u r Subpart C c h a r a c t e r i s t i c s o f hazardous w a s t e - - i g n i t a b i l i t y . reac-
t i v i t y , c o r r o s i v i t y , and t o x i c i t y - - o n l y t h e l a t t e r two usua l l y apply t o power
p l a n t low volume wastes.
t hus are n o n i g n i t a b l e ( i ,e., they have a f l a s h p o i n t o f g rea ter than 14OoF as
measured by EPA methods).
r e g u l a t i o n s (i.e.. they are no t explos ive, they do no t reac t v i o l e n t l y w i t h
water, and they a re n o t capable of generat ing t o x i c gases such as cyanide or s u l f i d e ) .
Most o f t h e streams are aqueous o r inorgan ic s o l i d s and
These streams are a l so no t r e a c t i v e as defined by RCRA
The waste streams r e s u l t i n g from t h e i n t e r n a l c lean ing o f b o i l e r tubes w i t h
i n h i b i t e d hyd roch lo r i c a c i d may be RCRA c o r r o s i v e because o f t h e i r low pH (12). However, these wastes are o f t e n n e u t r a l i z e d i n l i n e o r i n an elementary neu t ra l -
i z a t i o n u n i t .
t rea tment process regu la ted by RCRA if it i s performed t o n e u t r a l i z e wastes which
a re hazardous on ly because they are c o r r o s i v e by c h a r a c t e r i s t i c .
r e s u l t i n g n e u t r a l i z e d wastes RCRA regu la ted subsequent t o t h e i r n e u t r a l i z a t i o n .
Th is type of n e u t r a l i z a t i o n i s n o t considered a hazardous waste
Nor a re the
O f t h e t o t a l number of low volume waste samples t e s t e d du r ing RP2215-1, eleven
may be c l a s s i f i e d as hazardous on t h e bas i s of t h e E x t r a c t i o n Procedure (EP)
t o x i c i t y t e s t . Nine b o i l e r chemical c lean ing wastes, an evaporat ion pond
'A waste i s a l s o a RCRA-regulated hazardous waste i f it l i s t e d on one o f f o u r l i s t s conta ined i n Subpart 0. r e p o r t a re c u r r e n t l y l i s t e d .
None of t h e l o w volume wastes discussed i n t h i s
3-5
l i q u i d sample, and one sample of e l e c t r o s t a t i c p r e c i p i t a t o r (ESP) washwater
sludge fran an o i l - f i r e d p l a n t were p o t e n t i a l l y EP t o x i c .
r e s u l t s o f analyses o f t h e l i q u i d samples f o r EP t o x i c i t y .
waste t e s t e d as exceeding t h e EP t o x i c i t y l i m i t f o r lead; t h e o the r e i g h t had
h i g h chromium l e v e l s .
t h e c r i t e r i a was EP t o x i c due t o t h e presence o f selenium.
Table 3-1 presents t h e
One b o i l e r c lean ing
The one evaporat ion pond b r i n e which t e s t e d as exceeding
Several o f t h e low volume waste samples were sludges: f o r example. sludges from
t h e dredging o f wastewater ho ld ing ponds. fran t rea tmen t systems and from
dewater ing equipment.
t e s t . The r e s u l t s are presented i n Table 3-2, a long w i t h t h e minimum leach
concen t ra t i ons which c l a s s i f y t h e waste as hazardous. For a l l of t h e s ludge
samples tested, t h e EP produced on ly one value above t h e l i m i t f o r t h e e i g h t
regulated metals; cadmium exceeded t h e s t a t u t o r y l i m i t i n an ESP wash sludge from
an o i l - f i r e d p l a n t .
These sludge samples were e x t r a c t e d accord ing t o t h e EP
O f t h e eleven waste samples which exceeded t h e EP t o x i c i t y l eve l s , e i g h t d i d so
because o f t o t a l chranium leve ls . Wastes which exceed these l e v e l s may be
sub jec t t o RCRAls hazardous waste program. There i s , however, a regu la to ry
procedure by which any person, on behal f of an i n d i v i d u a l company o r on an
indust ry-wide basis, may p e t i t i o n EPA t o exempt any waste which exceeds t h e EP
l e v e l s f o r t o t a l chranium fran t h e d e f i n i t i o n of "hazardous waste" and t h e
corresponding regu la to ry c o n t r o l s . I n o rde r t o q u a l i f y f o r t h i s regu la to ry
exclusion. t h e p e t i t i o n e r must demonstrate t h e f o l l o w i n g t h r e e c r i t e r i a regard ing
t h e waste i n quest ion (U.2):
( A ) The chromium i n t h e waste i s e x c l u s i v e l y ( o r n e a r l y e x c l u s i v e l y )
t r i v a l e n t chranium; and
( 6 ) The waste i s generated from an i n d u s t r i a l process which uses t r i v a l e n t
chranium e x c l u s i v e l y ( o r n e a r l y e x c l u s i v e l y ) and t h e process does n o t
generate hexavalent chromium; and
( C ) The waste i s t y p i c a l l y and f requent ly managed i n non-ox id iz ing
environments.
I n a d d i t i o n t o p r o v i d i n g a case-by-case exemption f o r c e r t a i n chromium-containing
wastes, t h e RCRA r e g u l a t i o n s a l s o exempt several i n d u s t r y s p e c i f i c wastes from t h e d e f i n i t i o n of "hazardous waste" because such i n d u s t r i e s use t r i v a l e n t
chranium. as opposed t o hexavalent chromium, i n processing opera t i ons (i.e..
l e a t h e r tanning, T i02 pigment product ion, e tc . ) . I n t h e 1980 preamble t o t h i s
3-6
Class: P1 ant: Sample:
Arsenic Barium Cadmium C hrom i um Chromium V I Lead Mercury Selenium S i l v e r
pH ( u n i t s )
C1 ass: P1 ant: Sample:
Arsen ic Barium Cadmium C hrom i um Chranium V I Lead Mercury Selenium S i l v e r
pH ( u n i t s )
Table 3-1
EP TOXICITY TEST RESULTS FROM LIQUID LOW VOLUME WASTES (mg/L)
B o i l e r Chemical C1 eanina W aste A B C C E
RCRA EDTA HC1 Bromate HC1 C i t r i c w KaSix &d&eAias t !L lYs&..e
exclusion. t h e agency proposed t h a t t h e EP l i m i t f o r chromium o f 5 mg/L be based
on hexavalent c h r m i u m as opposed t o t o t a l chromium. T h i s change has never been
promulgated. With a c t i v i t y on t h e T o x i c i t y C h a r a c t e r i s t i c Leaching Procedure and
research on d e f i n i n g new Maximum Contaminant Leve ls (MCL's), it i s n o t known what.
form a f i n a l chromium regu la . t ion w i l l take. For t h e present, wastes w i t h t o t a l
chrc%ium l e v e l s i n excess o f 5 mg/L are genera l l y considered hazardous unless
c o n d i t i o n s A, B, and C above a re s a t i s f i e d and a generator o r indus t ry -w ide group
o f generators reques ts a temporary exc lus ion .
rdous Wa-
I f a s o l i d waste i s c l a s s i f i e d as nonhazardous, it may s t i l l be sub jec t t o
r e g u l a t o r y c o n t r o l by t h e s t a t c i n which t h e waste i s disposed. There i s no
p r o v i s i o n i n RCRA f o r a f e d e r a l l y operated regu la to ry tr pe rm i t program f o r
nonhazardous s o l i d wastes, a l though RCRA does encourage s t a t e s t o develop t h e i r
own regu la to ry programs i r . which t h e disposal o f s o l i d wastes i s t o be regulated.
EPA has developed c r i t e r i a f o r c l a s s i f i c a t i o n of nonhazardous s o l i d waste d i s -
posal s i t e s as "open dumps" o r as " san i ta ry l a n d f i l l s " (40 CFR P a r t 257). If a
d isposa l s i t e w e t s t h e c r i t e r i a . it i s c lassed as a s a n i t a r y l a n d f i l l , which
means t h a t it poses %o reasonable p r o b a b i l i t y o f adverse e f f e c t s on h e a l t h o r t h e environment."
and must be e v e n t u a l l y upgraded o r i r c l u d e f l o o d p l z i n and endangered species
s i t i n g r e s t r i c t i o n s , su r face water discharge c o n t r o l s , and groundwater con-
tam ina t ion c r i t e r i a .
cause c o n s t i t u e n t concent ra t ions i n underground d r i n k i n g water sources t o exceed
pr imary and secondary d r i n k i n g water standards beyond an a l t e r n a t e state-approved
boundary. Natura l concent ra t ions which a re above d r i n k i n g water standards may
n o t be increased.
S i t e s t h a t do n o t meet t h e c r i t e r i a a re c lassed as open dumps
The groundwater c r i t e r i a r e q u i r e t h a t a f a c i l i t y may n o t
The gu ide l i nes pub l lshed under Sec t ion 1008 o f RCRA a re app l l cab le t o s o l i d waste
d isposa l ope ra t i ons t h a t i n v o l v e t h e b u r i a l o f s o l i d waste, exc lud ing hazardous
wastes. The g u i d e l i n e s suggest p r e f e r r e d methods f o r t h e design and opera t i on of
these s o l i d waste d isposa l f a c i l i t i e s . Many o f t h e s t a t e regu la t i ons i nco rpo ra te
these and o t h e r gu ide l i nes as appropr ie te .
d e s c r i p t i o n s of a l t e r n a t i v e s i t i n g , design, l r a c h a t e c o n t r o l , cas con t ro l ,
sur face runoff c o n t r o l , and mon i to r i ng approaches and techno log ies t h a t may be
u t i l i z e d t o meet s i t e - s p e c i f i c l e v e l s o f environnlental p ro tec t i on . Fo l l ow ins i s
a very b r i e f summary cf t h e major sec t i ons of t h e proposed gu ide l i nes :
I n general, t h e gu ide l i nes p rov ide
3-13
The g u i d e l i n e s s t a t e t h a t s i t e s e l e c t i o n should be based on thorough cons ide ra t i on o f hydrogeologic, economic, and environniental f ac to rs . S i t e s e l e c t i o n should avo id env i ronmenta l l y s e n s i t i v e areas, i d e n t i f i e d as wetlands, f l o o d p l a i n s , permafrost areas, c r i t i c a l hab i ta t s , and recharge zones o f s o l e source aqui fers. zones o f a c t i v e f a u l t s and k a r s t t e r r a i n be avoided as l a n d f i l l s i t e s . S i t e eva lua t i ons should i nc lude cons ide ra t i on of poss ib le i n c o r p o r a t i o n i n t o e x i s t i n g o r f u t u r e reg iona l s o l i d waste d i s - posal systems.
The design sec t i on emphasizes t h a t design o f a f a c i l i t y should analyze t r a d e o f f s among environmental inipacts, economic cons idera t ions , f u t u r e use a l t e r n a t i v e s and t h e na tu re o f t h e wastes. The major goal o f ma in ta in ing ground- and surface water q u a l i t y can be a t t a i n e d by c o n t r o l l i n g leachate and gas as a prime o b j e c t i v e .
The gu ide l i nes a l s o suggest t h a t
The leacha te c o n t r o l s e c t i c n i s concerned w i t h c o n t r o l l i n g produc- t i o n of leachate and i t s escape from t h e s i t e and consequent impact on t h e environment. Syn the t i c and n a t u r a l c l a y l i n e r s a re techno log ies t h a t a re a v a i l a b l e t o c o n t r o l leachate produc t ion by r e s t r i c t i n g groundwater i n t r u s i o n i n t o t h e s i t e , and t o p revent l eacha te escape i n t o t h e environment. Leachate c o l l e c t i o n tech- niques a l s o a s s i s t i n n , in in l i z ing leachate escape from t h e s i t e , w h i l e l eacha te t reatnient and r e c y c l i n g techniques more d i r e c t l y min imize t h e impact of leachate on t h e surrounding environment.
e The gas c o n t r o l sec t i on i s concerned p r i m a r i l y w i t h reduc ing methane gas produc t ion by min in l i z ing mo is tu re i n f i l t r a t i o n , w i t h c o n t r o l l i n g escape o f gases i n t o t h e atmosphere and w i t h minimiz- i n g t h e m i g r a t i o n o f gases i n t o ad jacent s o i l s . These o b j e c t i v e s can be achieved by us ing va r ious combinat ions of v e r t i c a l imper- meable ba r r i e rs , v e r t i c a l p i p s vents. h o r i z o n t a l g rave l trenches, and o t h e r gas c o l l e c t i o n techno log ies .
e Recommended p r a c t i c e s i n t h e r u n o f f c o n t r o l sec t i on i nc lude d i v e r t i n g runoff through channel ing devices, such as d i kes o r o t h e r techniques, and inc reas ing r u n o f f from t h e l a n d f i l l sur face by t h e use of cover n:aterial, grading, and revegeta t ion . Ponding can be used t o remove eroded sediment o r o t h e r s o l i d m a t e r i a l s suspended i n runoff t h a t may o therw ise contaminate r e c e i v i n g waters.
The s e c t i o n on l a n d f i l l ope ra t i on encompasses t h e f u l l range o f l a n d f i l l i n g fran c o n s t r u c t i o n of waste c e l l s t o personnel s a f e t y on t h e s i t e . Compaction, shredding, and b a l i n g a re s p e c i f i c technology a l t e r n a t i v e s employed i n t h e c o n s t r u c t i o n of waste c e l l s . Other issues t h a t a r e discussed inc lude access c o n t r o l , sa fe ty , f i r e con t ro l , vec to r con t ro l , and 1 i t t e r c o n t r o l .
The monitor i l ;g s e c t i o n of t h e gu ide l i nes i n d i c a t e s t h a t m o n i t o r i n s o f leachate and gas produc t ion should con t inue du r ing c o n s t r u c t i o n and a f t e r comple t ion of a l a n d f i l l f a c i l i t y . Once base l i ne condi- t i o n s a r e es tab l i shed f o r groundwater suppl ies, leachate genera- t i o n and m i g r a t i o n should be monitored r e g u l a r l y . Exp los ive and t o x i c gas genera t ion and m i g r a t i o n should a l so be monitored r e g u l a r l y i n t h e ad jacent s o i l s and i n s t r u c t u r e s ad jacent t o t h e l a n d f 11 1.
3-14
Hazardous Waste
Hazardous waste genera tors who s t o r e t h e i r wastes i n con ta ine rs o r tanks f o r l e s s
than 90 days and who dispose of t h e i r wastes o f f s i t e i n accordance w i t h 40 CFR
P a r t 262 do n o t have t o o b t a i n a permi t from EPA. Llnless q u a l i f y i n g f o r t h e
small q u a n t i t y generator exemption ((100 ki lograms/month), generators do have t o
conlply w i t h numerous requirements p e r t a i n i n g t o l abe l i ng , man i fes t ing , and
reco rd keeping. S i m i l a r l y , t r a n s p o r t e r s who t r a n s p o r t hazardous waste do n o t
have t o have permits, b u t do have t o comply w i t h hand l i ng requirements d e t a i l e d
i n 40 CFR P a r t 263.
With few exceptions, RCRA requ i res pe rm i t s f o r new and e x i s t i n g hazardous waste
t reatment. storage', and d isposa l (TSD) f a c i l i t i e s from e i t h e r EPA or a s t a t e
au tho r i zed by EPA t o admin is te r t h e RCRA program.
standards, which became e f f e c t i v e January 26. 1983, supercede t h e P a r t 267
i n t e r i m standards a p p l i c a b l e t o new f a c i l i t i e s and w i l l r ep lace t h e P a r t 265
i n t e r i m s t a t u s r e g u l a t i o n s app l i cab le t o e x i s t i n g f a c i l i t i e s a f t e r t h e f a c i l i t i e s
a re perni i t ted. These standards i nc lude both general requirements and s p e c i f i c
standards a p p l i c a b l e t o each t ype o f TSD f a c i l i t y .
c o n s i s t p r i m a r i l y of t h r e e general t ypes o f performance standards:
The P a r t 264 permanent program
The P a r t 264 standards
General f a c i l i t y standards a p p l i c a b l e t o a l l types o f hazardous waste (HW) f a c i l i t i e s , i n c l u d i n g waste ana lys i s plans, s e c u r i t y procedures. personnel t r a i n i n g , emergency preparedness and preven- t i o n , cont ingency plans, i n s p e c t i o n schedules, and c l o s u r e plans;
a Groundwater p r o t e c t i o n standards f o r mon i to r i ng and c o r r e c t i v e a c t i o n a p p l i c a b l e t o f a c i l i t i e s t h a t t r e a t , s to re , o r dispose o f hazardous waste i n su r face impoundments, waste p i l es , l a n d t r e a t - ment u n i t s , o r l a n d f i l l s ; and
S p e c i f i c design and opera t i ng standards app l i cab le t o each o f t h e severa l t y p e s of hazardous wastes f a c i l i t i e s ( i .e., con ta iners , tanks, surface impoundments, waste p i l es , l and treatment, l a n d f i l l s , and i n c i n e r a t o r s ) .
Of a l l t h e P a r t 264 standards. t h e minimum techno log ica l and opera t i ng standards
f o r l a n d d isposa l f a c i l i t i e s , such as su r face impoundments and l a n d f i l l s , a re of
p a r t i c u l a r concern t o t h e u t i l i t y indus t ry , as they apply t o hazardous low volume
wastes produced by f o s s i l - f i r e d power p lan ts .
'Storage of o n - s i t e generated hazardous wastes f o r l e s s than 90 days i n con ta ine rs o r t a n k s does n o t r e q u i r e a RCRA permi t .
3-15
Fu tu re Trends
The c u r r e n t EP t o x i c i t y t e s t was developed by EPA as a means o f c l a s s i f y i n g s o l i d
waste as t o x i c or non-toxic.
because 1) it does n o t address t h e l e a c h a b i l i t y of o rgan ic c o n s t i t u e n t s and
2) it i s n o t very accurate i n p r e d i c t i n g leachate q u a l i t y from a codisposal
scenar io. Thus, i n t h e 1984 amendments t o RCRA (Hazardous and S o l i d Waste
Amendments of 1984), Congress mandated EPA t o develop an accurate method t o
a s c e r t a i n t o x i c i t y c h a r a c t e r i s t i c s . I n response, EPA developed and r e c e n t l y
proposed t h e T o x i c i t y C h a r a c t e r i s t i c Leaching Procedure (TCLP).
developed a f t e r t h r e e years o f l each ing research conducted a t Oak Ridge Na t iona l
Laboratory. As w i t h t h e EP, t h e TCLP s imu la tes codisposal i n a mun ic ipa l land-
f i l l .
a l l ows t h e de terminat ion o f o rgan ic chemical hazards as we l l as i no rgan ic
hazards.
The EP has l i m i t a t i o n s i n c l a s s i f y i n g t o x i c wastes
The TCLP was
The most s i g n i f i c a n t change i n t h e TCLP ove r t h e EP i s t h a t t h e TCLP
I f adopted as proposed, t h e TCLP may r e s u l t i n r e c l a s s i f i c a t i o n of some low
vol i !n~e wastes as hazardous. I n o t h e r words. t h e p o s s i b i l i t y e x i s t s t h a t wastes
t h a t were nonhazardous by EP t e s t c r i t e r i a might be hazardous by TCLP c r i t e r i a .
(It i s a l s o p o s s i b l e t h a t some EP hazardous wastes migh t be r e c l a s s i f i e d as non-
hazardous).
As proposed i n 5 1 Fed. Reg. 21648 (June 13, 19861, t h e TCLP l i s t s t h e contam-
i n a n t s and r e g u l a t o r y l e v e l s which w i l l r e s u l t i n a waste's being c l a s s i f i e d as
RCRA-toxic.
l e v e l s . The EPA niay even tua l l y cons ider any o r a l l of t h e contaminants i n t h e
EPA l i s t o f Hazardous Cons t i t uen ts (Appendix V I 1 1 o f P a r t 261 o f t h e CFR) as
p o t e n t i a l a d d i t i o n s t o t h e TCLP. A d d i t i o n a l l y , t h e maximum contaminant l e v e l s i n
Tab le 3-3 may be modif ied, a f f e c t i n g t h e regu la to ry s t a t u s o f wastes.
Tab le 3-3 1 i s t s t h e proposed TCLP conteminants and regu la to ry
Several of t h e samples c o l l e c t e d du r ing RP2215 were evaluated according t o t h e
TCLP.
As shown, t h e two e x t r a c t i o n procedures produced near l y i d e n t i c a l concen t ra t i ons
o f meta ls i n t h e i r e x t r a c t s .
TCLP r e s u l t s f rom t h r e e samples a r e compare< t o EP r e s u l t s i n Table 3-4.
Ana lys i s o f o rgan ic c o n s t i t u e n t s was n o t performed.
RCRA ImDact, --on L o r Vol u me Waste M a n w @ m ! n
Cur ren t ly , most. u t i l i t y low volume wastes a re nonhazardous under RCRA.
volume waste stream which has t h e g rea tes t p o t e n t i a l f o r being RCRA-hazardous i s
b o i l e r chemical c lean ing waste. Many a c i d c l e a n i n g wastes cou ld be
PROPOSED TOXICITY CHARACTERISTIC CONTAMINANTS AND REGULATORY LEVELS
Contaminants
A c r y l o n i t r i l e Arsenic Barium Benzene 81s (2 -ch lo roe thy l ) e ther Cadn ium Carbon d i s u l f l d e Carbon t e t r a c h l o r i de Chlordane Chlorobenzene Chloroform Chranium o-Cresol m-Cresol p-Cresol
1,Z-Di c h l orobenzene 1,4-Dichlorobenzene 1,2-Di ch 1 oroethane 1 , l -D i ch loroethy lene 2,4-Din i t ro to l uene Endr in Heptachlor (and i t s hydrox ide) Hexachlorobenzene Hexachlorobutadiene Hexachloroethane Isobutanol Lead Lindane Mercury Methoxychlor Methylene c h l o r i d e Methyl e thy l ketone Nitrobenzene Pentachlorophenol Phenol P y r i d i n e Selenium S i l v e r l,l,l,Z-Tetrachloroethane l,l,Z,Z-Tetrachloroethane Tet rach lo roe thy lene 2,3,4,6-Tetrachlorophenol To1 uene Toxaphene l,l, 1-Tr i c h l oroeth ane 1,1,2-Tr i c h 1 oroethane T r i ch lo roe thy lene 2,4,5-Tri ch 1 orophenol 2,4,6-Tr ich lorophenol 2,4,5-TP ( S i l v e x ) V iny l c h l o r i d e
2 ~ 4 - D
Hazardous waste numbers.
Leve l (ma/L)
5 .O 5 .O
100.0 0.07 0.05 1.0
14.4 0.07 0.03 1.4 0.07 5 .O
10.0 10.0 10.0
1.4 4.3
10.8 0.40 0.1 0.13 0. DO3 0.001 0.13 0.72 4.3
36.0 5 .O 0.06 0.2 1.4 8.6 7.2 0.13 3.6
14.4 5.0 1.0 5.0
10.0 1.3 0.1 1.5
14.4 0.07
30.0 1.2 0.07 5.8 0.30 0.14 0.05
3-17
Table 3-4
COMPARISON OF E P ~ AND T C L P ~ EXTRACTIONS (mg/L)
'EP - E x t r a c t i o n Procedure T o x i c i t y Test (6).
'TCLP - T o x i c i t y C h a r a c t e r i s t i c Leaching Procedure (14).
' I I I
F i r e s i d e Wash S1 udge from O i l - F i r e d P l a n t ( T ) EP TCLP
<0.002 <0.002 0.21 0.64 0.012 0.011 0.014 0.012
<o. 002 <0.002 <o. 0002 <0.0002 <O. 003 (0.003
0.011 0.011
I ' I
RCRA-hazardous because of t h e lcw pH ( c o r r o s i v i t y ) . However, most p l a n t s p revent
t h e a c i d wastes from becoming RCRA wastes by n e u t r a l i z i n g them i n - l i n e o r i n an
elementary n e u t r a l i z a t i o n u n i t . As p r e v i c u s l y discussed, some DCCN samples may
be considered RCRA hazardous due t o t o t a l chromium content.
t h r e e low volume waste types had samples which t e s t e d as EP t o x i c :
chemical c lean ing wastes, one sample of e l e c t r o s t a t i c p r e c i p i t a t o r (ESP)
washwator s ludge from an o i l - f i r e d p lan t , and a sample o f b r i n e i n an evapora t ion
pond.
if t h e l i m i t s a r e changed. Also, t h e f u t u r e s t a t u s o f t h e coa l ash exemption and
t h e codisposal exemption i s uncer ta in .
I n t h i s p ro jec t ,
n i n e b o i l e r
F u t u r e c l a s s i f i c a t i o n s under RCRA may change when t h e TCLP i s adopted o r
Hazardous waste genera tors who accumulate and s t o r e
t h e i r wastes i n con ta ine rs o r tanks f o r l e s s than 90 days and who dispose o f
t h e i r wastes a t o f f s i t e hazardous waste management f a c i l i t i e s i n accordance wi th
40 CFR P a r t 262 do n o t have t o o b t a i n a RCRA permit .
-Waste_Treatment. If hazardous low volume wastes a r e t r e a t e d f o r
discharge pursuant t o a Nat iona l P o l l u t a n t Discharge E l i m i n a t i o n System (NPOES)
wastewater d ischarge pe rm i t and t h e t rea tment system c o n s i s t s of tanks ( a s
de f ined under 40 CFR Sec t ion 260.1), then t h e waste t rea t r ren t f a c i l i t i e s a r e
exempt from RCRA p e r m i t t i n g requirements under 40 CFR Sec t ion 270.
NPDES-permitted d ischarge i s a l s o RCRA-exempt). A lso exempt from RCRA a re
pre t rea tment and d ischarge o f hazardous wastes t o p u b l i c l y owned t rea tment works
which a r e NPOES-pormitted.
(The
-. Regulat ions f o r i n c i n e r a t i o n of hazardous waste
a r e s t i l l evolv ing. U t i l i t y b o i l e r s used f c r evapora t ion of low energy hazardous
wastes (e.g., BCCW wastes t h a t a re hazardous because o f EP t o x i c i t y o r
c o r r o s i v i t y ) may r e q u i r e RCRA hazardous waste i n c i n e r a t o r permits. I f t h e DCCW
i s c l a s s i f i e d as hazardous o n l y because of c o r r o s i v i t y and con ta ins & minirrt&
l e v e l s o f Appendix V I 1 1 c o n s t i t u e n t s ( l e s s than 100 mg/L), then it may be
p o s s i b l e t o o b t a i n a RCRA perm i t which imposes few regu la to ry r e s p o n s i b i l i t i e s .
D iscuss lons l a t e r i n t h i s sec t i on expand on evapora t ion of low volume waste i n
boi 1 e rs .
STATE SOLID WASTE REGULATIONS
Norhazardous u t i l i t y low volume wastes a r e sub jec t t o regu la to ry c o n t r o l by t h e
s t a t e i n which t h e waste i s disposed. Nowever, most o f t h e s t a t e s have adopted
EPA r e g u l a t i o n s f o r nonhazardous s o l i d waste disposal . Primary areas most l i k e l y
3-19
t o be addressed i n s t a t e regu la t i ons f o r low volume wastes are s i t e se lec t ion ,
f a c i l i t y design, and f a c i l i t y operat ion. I n a few s ta tes , requirements
app l i cab le t o s o l i d waste d isposal f a c i l i t i e s a re as d e t a i l e d and s t r i n g e n t as
RCRA requirements.
Many s t a t e s c a r e f u l l y regu la te l o c a t i o n of d isposal s i t e s i n env i ronmenta l l y
s e n s i t i v e areas, such as f loodp la ins , wetlands. and recharge zones f o r s o l e
source aqu i fe rs .
requirements f o r t h e fo l low ing :
t h e seasonal h igh groundwater tab le ; p rox im i t y t o sur face waters; minimum
d is tance t o po tab le water suppl ies; 1 i n e r s p e c i f i c a t i o n s and p roper t y l i n e
cons t ra in t s .
From s t a t e t o s ta te , t h e d isposal f a c i l i t y designs d i f f e r i n
d is tance between t h e bottom o f t h e l a n d f i l l and
These requirements vary according t o waste t o x i c i t y . s o i l a t tenua t ion capaci ty .
evapot ransp i ra t ion cond i t ions . and ambient groundwater q u a l i t y .
The pr imary ope ra t i ng requirements may i n v o l v e s i t e moni tor ing, and leachate
mon i to r i ng and c o l l e c t i o n . p a r t i c u l a r l y i n a l and codisposal scenar io . Moni-
t o r i n g requirements a re dependent upon what t h e s t a t e regards as necessary t o
p r o t e c t t h e environment. Fur ther , i f low volume wastes a r e codisposed w i t h ash
o r o the r u t i l i t y h igh volume wastes, f a c i l i t y c losu re requirements p e r t a i n i n g t o
cap design and cover may apply. I n add i t ion , some s t a t e s may r e q u i r e pos tc losure
s i t e mon i to r i ng and f i n a n c i a l r e s p o n s i b i l i t y f o r env i ronmenta l l y acceptable s i t e
maintenance.
Texas and C a l i f o r n i a a r e two s t a t e s which have t h e i r own waste c l a s s i f i c a t i o n
procedures. These procedures a r e described below:
I!?xai The Texas Water Commission's (TWC) waste evaluation/classification system groups
wastes i n t o t h r e e c lasses:
0 Class I Wastes - any i n d u s t r i a l o r s o l i d waste o r m ix tu re o f wastes which i s t o x i c , cor ros ive , flammable. a s t rong s e n s i t i z e r , r e a c t i v e o r poses a t h r e a t t o human hea l th o r t h e environment. EPA hazardous wastes a r e a subset o f t h i s c lass.
0 Class I1 Wastes - any i n d u s t r i a l o r s o l i d waste which cannot be descr ibed as Class I o r 111.
Class I11 Wastes - i n e r t and e s s e n t i a l l y i n s o l u b l e s o l i d waste, i n c l u d i n g rock, b r ick , glass, d i r t , e tc .
3-20
Class I wastes i n c l u d e a l l hazardous waste and m a t e r i a l s which a r e t o x i c o r
carc inogenic , mutagenic, teratogenic , bioaccumulative, o r p e r s i s t e n t . Those low
volume wastes which f a i l t h e EP t o x i c i t y t e s t o r a r e c o r r o s i v e (h igh o r low pH)
and a r e n o t n e u t r a l i z e d would f a l l i n t h i s category.
Class I 1 wastes have p r o p e r t i e s such as c m b u s t i b i l l t y , b i o d e g r a d a b i l i t y . and/or
s o l u b i l i t y i n water.
c r i t e r i o n t o d i s t i n g u i s h between Class I1 and Class I11 ( i n e r t ) wastes. A Class
I1 waste might leach c o n s t i t u e n t s i n excess of t h e l i m i t s f o r d r i n k i n g water when
u s i n g t h i s t e s t .
d i s t i l l e d water leachate t e s t ( c o o l i n g tower bas in sludge, c i t r i c a c i d waters ide
wash, deminera l i zer regenerant, f i r e s i d e washwater). I n a l l four cases, a t l e a s t
one of t h e d r i n k i n g water elements exceeded t h e pr imary d r i n k i n g water s tandard
and t h e r e f o r e would be considered a Class I1 waste.
The TWC uses a d i s t i l l e d water leachate t e s t as one
Four low volume wastes were t e s t e d i n RP2215 (1) u s i n g t h e
Class I11 wastes a r e " e s s e n t i a l l y i n s o l u b l e " and do n o t leach c o n s t i t u e n t s i n
excess of t h e l i m i t s f o r d r i n k i n g water.
c l a s s i f i c a t i o n , a l though none of t h e four t e s t e d i n RP2215 met t h e c r i t e r i a (1). Some low volume waste may f i t t h i s
Q l i f o r n i a
The C a l i f o r n i a Department of Hea l th Serv ices (DHS) regu la tes t h e i d e n t i f i c a t i o n
o f hazardous waste. L i k e t h e f e d e r a l hazardous waste i d e n t i f f c a t i o n system, t h e
C a l i f o r n i a DHS i d e n t i f i c a t i o n system c l a s s i f i e s a waste based on i t s t o x i c i t y ,
c o r r o s i v i t y , i g n i t a b i l i t y . and r e a c t i v i t y . However. t h e t e s t procedures and
c r i t e r i a used t o eva lua te these c h a r a c t e r i s t i c s a r e very d i f f e r e n t from t h e EPA
t e s t s and c r i t e r i a .
For u t i l i t y l o w volume waste, t h e major d i f f e r e n c e between t h e C a l i f o r n i a and
federa l waste c l a s s i f i c a t i o n system i s t h e Waste E x t r a c t i o n Test (WET) used t o
assess t o x i c i t y .
b u t t h e e x t r a c t i n g media i s a 0.2 M c i t r a t e s o l u t i o n a t pH 5.0.
s t ronger e x t r a c t i n g media than t h e a c e t a t e s o l u t i o n used i n t h e EP t o x i c i t y t e s t .
As a r e s u l t , low volume waste c o u l d be t o x i c u s i n g t h e WET procedure b u t n o t
t o x i c us ing t h e EP. Table 3-5 presents WET r e s u l t s on 11 u t i l i t y low volume
sludges.
t rea tment o f f i r e s i d e washwater; one sample o f sludge from t h e t rea tment o f ESP
washwater; and two samples of sludge from t h e t reatment o f b o i l e r chemical
c l e a n i n g waste washwater.
T h i s i s an aqueous waste e x t r a c t i o n , l i k e t h e EP t o x i c f t y t e s t ,
T h i s I s a much
Six of t h e sludges t e s t e d as t o x i c : t h r e e samples of sludge from t h e
Cadmium, n i c k e l , and vanadium exceed t h e C a l i f o r n i a
3-21
Table 3-5
CALIFORNIA WASTE EXTRACTION TEST (WET) RESULTS ( mg/L )
Sample Desc r ip t i on
Arsenic Barium Bery l 1 ium Cadmium Chromium Chromium V I Cobal t Copper F l u o r i d e Lead Mercury Molybdenum Nicke l Selenium S i l v e r Tha l l i um Vanadium Zinc
Sample Desc r ip t i on
STII;l
5 100
0.75 1
560 5
80 25
180 5 0.2
350 20 1 5 7
24 25 0
Arsenic 5 Barium 100 Bery l 1 i urn 0.75 Cadmium 1 Ch rom i um 560 Chromium V I 5 Coba l t 80 Copper 25 F l u o r i d e 180 Lead 5 Me rcu r v 0.2
A-S4 F i r e s i d e
Wash Sludae
0.018 1.3 0.4 0.1 0.7
2.8 0.69 2.7 1.1 0.00084 0.08
34 <0.002 0.065
10.9 7.4
11
K-ESP1
c-s4 0 4 3 F-S3 g-53 Waterside F i r e s i d e Waterside Waterside
Wash Wash Wash Wash Sludae Sludae Sluda e Sludae
0.31 1.1
(0.1 1.5
27 0.13 1.3 1 0.06 0.26
<0.0002 2
100 <0.002
0.8 (9 9
100
M-S3
ESP Evaporation Wash Pond
a!Ld!E Sol i d s
1.3 0.052 0.21 0.08
<0.01 0.005 13 0.009 2.6 1.6 0.026
32 0.14 11 4.2 7.6 50 4.7 <0.002
<0.0002 0.0027 Molybdknum 350 20 0.11 N icke l 20 1100 0.37 Selenium 1 0.016 0.28 S i l v e r 5 0.24 0.02 T h a l l ium 7 4.5 <o .09 Vanadium 24 970 0.21 Z inc 25 0 59 0.44
0.33 2.6 0.029 1.5 1.2 0.037 1.6 2.2
10.01 2.4
<0.0002 2.9
10.002 0.26 4.2
110
1000 11
0.021 0.26 0.014 0.062 6.8 0.054 0.21 0.62 0.01
<0.002 <0.0002 3.1 2
<0.002 (0.02 10.9 0.44 1.1
0.17 1.2
<0.1 0.47 6.5
(0.6 0.29 0.21
10.002 <0.0002 10.2 79 <o .002 c0.2 19
1.9 56
N-S3 0 4 2 t-53 F i r e s i d e
Evaporation Evaporation Wash Pond Pond F i l t e r
‘STLC - So lub le Threshold L i m i t Concentrat ion.
3-22
s o l u b l e t h r e s h o l d l i m i t concent ra t ions . The EP t e s t does n o t i n c l u d e l i m i t s f o r
n i c k e l o r vanadium. Using RCRA EP, on l y t h e ESP washwater was EP t o x i c .
5 Most s t a t e s f o l l o w t h e fede ra l l e a d i n t h e i r procedures f o r i d e n t i f i c a t i o n of
hazardous waste. However, some s t a t e s (e.g., C a l i f o r n i a ) have s t r i c t e r c l a s s i -
f i c a t i o n c r i t e r i a and a g rea te r percentage o f low volume waste could. there fore .
f a l l i n t o t h e hazardous class. Hazardous low volume waste must be handled i n
accordance w i t h t h e s t a t e hazardous waste standards which must be as s t r i n g e n t as
RCRA standards.
I n most states. s t a t e and l o c a l s o l i d waste regu la t i ons have t h e g r e a t e s t impact
on t h e hand l i ng o f u t i l i t y low volume waste. S ta tes may impose r e s t r i c t i o n s on
s i t e se lec t ion , design o f d isposal f a c i l i t y , l eacha te con t ro l , runoff c o n t r o l ,
d isposa l s i t e opera t ion , and mon i to r ing .
EVAPORATION OF LOW VOLUME WASTES I N BOILERS
Wi th respect t o t h e f i r i n g or evaporat ion of low volume wastes i n u t i l i t y
b o i l e r s , t h e p r i n c i p a l regu la to ry issues a r i s e i f t h e wastes a re hazardous o r
w i l l cause t o x i c a i r emissions when f i r e d . I f t h e wastes are hazardous, t h e i r
on -s i t e s to rage and subsequent evapora t ion i n u t i l i t y b o i l e r s w i l l be regu la ted
under fede ra l and s t a t e hazardous waste management programs. Whether t h e wastes
a r e hazardous or nonhazardous. a i r emissions from t h e i r f i r i n g or evapora t ion i n
u t i l i t y b o i l e r s a re a l s o regu la ted through s t a t e and fede ra l a i r pe rm i t
processes.
b o i l e r s , t h e i r evapora t ion may be a sub jec t o f regu la to ry concern and. conse-
quent ly. a i r qual i t y regu la t i ons .
To t h e e x t e n t t h a t low volume wastes inc rease a i r emissions from
Three major regu la to ry i ssues may a r i s e from t h e evapora t ion of low volume wastes
i n u t i l i t y b o i l e r s :
a p p l i c a b i l i t y o f hazardous waste i n c i n e r a t o r regu la t ions ; and 3 ) a p p l i c a b i l i t y o f
a i r t o x i c s regu la t i ons .
1) a p p l i c a b i l i t y o f hazardous waste bu rn ing regu la t ions ; 2 )
Waste
Under t h e impetus o f t h e November 1984 Hazardous and S o l i d Waste Amendments
(HSWA) t o RCRAt EPA adopted regu la t i ons i n 1985 s e t t i n g standards app l i cab le t o
t h e l e g i t i m a t e use, reuse, recyc l i ng , and rec lamat ion o f hazardous wastes. These
r e g u l a t i o n s were adopted i n t h r e e separate rulemakings and were pub l ished i n 50
3-23
Fed. Reg. 614 (January 4, 19851, 50 Fed. Reg. 1690 (January 11, 1985), and 50 Fed. Reg. 49164 (November 29, 1985). The regu la t i ons have t h e f o l l o w i n g i m p l i -
ca t i ons f o r t h e burn ing of hazardous wastes fo r energy recovery i n u t i l i t y
b o i l e r s :
0 Recyc l ing a c t i v i t i e s which are regu la ted under RCRA i n c l u d e burn ing hazardous waste o r waste f u e l s f o r energy recovery i n u t i l i t y bo i l e rs , as def ined i n 40 CFR 260.10;
0 Recycled wastes w i l l be defined and regu la ted as s o l i d and hazardous wastes when recycled;
U t i l i t y b o i l e r opera tors burn ing n f f - z i t e aenerated hazardous waste o r waste fue l s w i l l be requ i red t o :
- - n o t i f y EPA ( o r t h e au thor ized s t a t e agency) regard ing t h e i r e x i s t i n g waste-as-fuel a c t i v i t i e s by January 29, 1986;
--submit a P a r t A o r rev i sed P a r t A pe rm i t a p p l i c a t i o n t o EPA or t h e au thor ized s t a t e agency by May 29, 1986 i n o rder t o o b t a i n o r preserve i n t e r i m s t a t u s f o r t h e i r e x i s t i n g hazardous waste o r waste f u e l s torage f a c i l i t i e s pending issuance o f a hazardous waste permi t ; and
--comply w i t h man i fes t and record keeping requirements and prov ide c e r t i f i c a t i o n no t i ces t o hazardous waste or waste f u e l s u p p l i e r s by March 31, 1986;
B o i l e r opera tors may begin s t o r i n g Qn-s i te a- hazardous waste and waste fue l s fo r l e s s than 90 days and burn ing those wastes i n t h e b o i l e r s any t ime p r i o r t o t h e e f f e c t i v e date of t h e yet-to-be proposed permi t standards fo r i n d u s t r i a l b o i l e r s , probably a f t e r January 1, 1988.
EPA in tends t o propose and l a t e r adopt subs tan t ive standards f o r u t i l i t y b o i l e r s
which burn hazardous waste o r waste f u e l s f o r energy recovery.
r e g u l a t i o n s f o r hazardous waste i nc ine ra to rs , t h e f u t u r e u t i l i t y b o i l e r pe rm i t
standards may r e q u i r e a d e s t r u c t i o n and removal e f f i c i e n c y (DRE) of 99.99 percent
f o r hazardous organ ic c o n s t i t u e n t s i n t h e fuels, as we l l as impose general
design, mon i to r i ng and inspec t i on standards.
L i k e t h e e x i s t i n g
EPA, however. i s cons ide r ing a procedura l approach f o r ob ta in ing a RCRA u t i l i t y
b o i l e r pe rm i t which would a l l ow a waiver o f a t r i a l burn p lan upon demonstrat ion
t h a t t h e b o i l e r s a re opera t i ng i n accordance w i t h 8 t o 10 spec i f i ed cond i t i ons
designed t o ensure t h e 99.99 percent DRE.
"permi t -by-ru leoo f o r b o i l e r s which operate i n . accordance w i th t h e s p e c i f i e d
r e g u l a t o r y cond i t ions . Some uncer ta in t y e x i s t s as t o whether a "permi t -by-ru le"
i s au tho r i zed under e x i s t i n g s t a t u t o r y language.
EPA i s a l so cons ider ing a l l ow ing a
3-24
It i s impor tan t t o emphasize t h a t t h e hazardous waste burn ing r e g u l a t i o n s w i l l
apply o n l y t o u t i l i t y b o i l e r s which a r e burn ing o r w i l l burn hazardous waste or hazardous waste fue l f o r " l e g i t i m a t e " energy recovery. What c o n s t i t u t e s
" l e g i t i m a t e " energy recovery i s genera l l y de f ined i n a 1983 EPA memorandum (40
Fed. Reg. 1157, March 16. 1983). I n general, b o i l e r s burn ing low energy wastes
( i .e . . hav ing l e s s than 5000 - 8000 E t u / l b hea t ing value as generated) a re
considered by EFA t o be i n c i n e r a t i n g t h e wastes and are, there fore , s u b j e c t t o
e x i s t i n g r e g u l a t i o n s f o r hazardous waste i n c i n e r a t o r s (40 CFR P a r t 264. Subpart
0) .
A l l o f t h e metal c lean ing wastes s tud ied under RP2215 have l i t t l e o r no hea t ing
value. For t h i s reason. i f metal c lean ing wastes are c l a s s i f i e d as hazardous
*waste, t h e burn ing o f such wastes may be regu la ted under t h e hazardous waste
i n c i n e r a t o r r u l e s r a t h e r than t h e e x i s t i n g and f u t u r e hazardous waste bu rn ing
ru les .
A D D l i c a b i l i t v of Hazardous Waz te -hc ine ra to r Reaulat i ons
Performance standards and a p p l i c a t i o n requirements f o r hazardous waste i n c i n -
e r a t o r s a r e s p e c i f i e d i n r u l e s 40 CFR P a r t 264, Subpart 0, and 40 CFR P a r t 270.
A RCRA permi t a p p l i c a t i o n f o r an i n c i n e r a t o r genera l l y c o n s i s t s o f t h e f o l l o w i n g
elements: 1) a F a r t A p e r m i t , a p p l i c a t i o n desc r ib ing t h e i n c i n e r a t o r and any
a n c i l l a r y f a c i l i t i e s (tanks, con ta ine r storage), as w e l l t h e wastes and waste
cenera t i ng processes: 2 ) a general d e s c r i p t i o n of a l l RCRA regu la ted u n i t s ; 3 ) a
d e s c r i p t i o n of s e c u r i t y procedures; 4 ) an inspec t i on schedule: 5) a personnel
t r a i n i n g plan; 6 ) cont ingency p lan documentation demonstrat ing preparedness f o r
and p reven t ion of emergencies; 7 ) procedures f o r addressing spec ia l requirements
a p p l i c a b l e t o t h e hand l i ng of i g n i t a b l e and r e a c t i v e wastes; 8) d e s c r i p t i o n o f
waste r o u t i n g t o and from t h e i n c i n e r a t o r ; 9) documentation p e r t a i n i n g t o
f a u l t i n g and f l o o d i n g o f t h e f a c i l i t y s i t e ; 1 C ) topograph ic map(s) showing a
d is tance of 1000 f e e t around t h e regu la ted u n i t s and t i r p i c t i n g a v a r i e t y of
d e t a i l s : 11) an i n c i n e r a t o r t r i a l burn p lan i n c l u d i n g a d e t a i l e d ens ineer ing
d e s c r i p t i o n of t h e i n c i n e r a t o r ; 12) eng ineer ing reports. plans, and
s p e c i f i c a t i o n s f o r any a n c i l l a r y f a c i l i t i e s such as storage tanks and waste
p i l e s ; 13) f a c i l i t y c l o s u r e p l a n ( s ) ; and 14) documentation of f i n a n c i a l assurance
f o r c l o s u r e and l i a b i l i t y coverage f o r sudden acc iden ta l occurrences assoc ia ted
w i t h t h e regu ls ted u n i t s .
An impor tan t RCRA a p p l i c a t i o n requirement f o r a hazardous waste i n c i n e r a t o r i s
p repara t i on of a t r i a l burn plan. App l i can ts f o r RCRA i n c i n e r a t o r permi ts a re
3-25
requ i red t o demonstraie by performing a t r i a l burn t h a t t h e i n c i n e r a t o r i s
capable o f t h e r m a l l y des t roy ing and removing 99.99 percent o f t h e hazardous
o rgan ic c o n s t i t u e n t s conta ined i n t h e wastes i nc ine ra ted . Performance standards
a r e a l s o spec i f l e d f o r hydrogen c h l o r i d e emissions and p a r t i c u l a t e s . The
i n c i n e r a t i o n of hazardous meta ls contained i n t h e waste i s presumed t o be
regu la ted under t h e p a r t i c u l a t e standard: 180 m i l l i g r a m s per dry standard cub ic
rrieter (0.08 g r a i n s per dry standard c u b i c f o o t ) when co r rec ted f o r t h e amount o f
oxygen i n t h e s tack gas.
A t r i a l burn p lan should be designed t o demonstrate compliance w i t h t h e
a p p l i c a b l e standards a t t h e process c o n d i t i o n s t h a t w i l l p rov ide t h e owner/
opera tor w i t h maxlmum opera t i ng f l e x i b i l i t y . Tria.1 burn p lan p repara t i on
genera l l y r e q u i r e s t h e f o l l o w i n g steps: 1) sampling and ana lys i s of t h e waste
f o r a l l Appendix V I 1 1 hazardous c o n s t i t u e n t s l i k e l y t o be present: 2) s e l e c t i o n
o f " p r i n c i p a l o rgan ic hazardous c o n s t i t u e n t s " (POHCs) which w i l l be sampled and
analyzed f o r du r ing and a f t e r t h e t r i a l burn: 3) prepara t i on o f a d e t a i l e d
ens inee r ing d e s c r i p t i o n o f t h e i n c i n e r a t o r : 4 ) prepara t i on o f a sampling and
a n a l y s i s p lan f o r mon i to r i ng t h e performance o f t h e i n c i n e r a t o r under severa l
t e s t cond i t i ons : and 5) prepara t i on of a q u a l i t y assurance/qual i t y c o n t r o l p lan
f o r ensur ing t h e accuracy o f t h e data produced.
EPA i n c i n e r a t o r r e g u l a t i o n s a l low t h e agency t o exempt a p p l i c a n t s from most RCRA
requireirents, i n c l u d i n g t r i a l burn p lan p repara t i on and implementation, p rov ided
t h e waste t o be burned:
e Is hazardous on ly for t h e c h a r a c t e r i s t i c o f c o r r o s i v i t y ( o r i g n i t a b i l i t y ) ;
e Conta ins " i n s i g n i f i c a n t " (& m in im is ) l e v e l s o f Appendix VI11 c o n s t i t u e n t s ( i n c l u d i n g hazardous metal 5 ) ; and
Otherwise does n o t pose a t h r e a t t o human h e a l t h and t h e environment when burned i n an i n c i n e r a t o r .
The EPA pe rn i i t wr i te r ' s guidance document e s t a b l i s h e s 100 mg/L as t h e l e v e l a t
which most c o n s t i t u e n t s become s i g n i f i c a n t f rom a regu la to ry s tandpo in t (U). If an a p p l i c a n t c a r r i e s t h e burden o f proof f o r t h i s exeniption, it w i l l not be
necessary t o perforn: a t r i a l burn. Nor w i l l t h e app l i can t be requ i red t o comply
w i t h o the r perfcrmance and opera t i ng requ i rement.s s p e c i f i e d i n Subpart 0, except
waste a n a l y s i s and c l o s u r e requirements.
e
3-26
As i n d i c a t e d above, u t i l i t y b o i l e r s used f o r evaporat ion o f low energy hazardous
wastes may r e q u i r e RCRA hazardous waste i n c i n e r a t o r permits.
c lean ing wastes a r e c o r r o s i v e and con ta in ' l e v e l s of hazardous
c o n s t i t u e n t s ( l e s s than 100 mg/L). it may be poss ib le t o o b t a i n a pe rm i t which
imposes few regu la to ry r e s p o n s i b i l i t i e s .
I f t h e rnetal
B p p l i c a b i l i t v of A i r Toxi-
The U.S. EPA regu la tes emissions of a i r contaminants from s t a t i o n a r y sources,
such as power p lants . through t h e Prevent ion of S i g n i f i c a n t D e t e r i o r a t i o n (PSD)
pe rm i t program. L i k e t h e RCRA permi t program, s t a t e agencies may be au thor ized
by EPA t o assume r e s p o n s i b i l i t y f o r admin is te r ing t h e PSD perm i t program.
addi t ion, many s t a t e s have separate s t a t e a i r programs which r e q u i r e permi ts f o r
even those emission sources which do n o t r e q u i r e PSD permits.
I n
P r i o r t o 1980. t h e pr imary focus o f bo th t h e federa l and s t a t e a i r programs was
c o n t r o l o f c r i t e r i a o r convent ional p o l l u t a n t s : s u l f u r ox ides ( s u l f u r d iox ide )
hydrocarbons, p a r t i c u l a t e matter, carbon monoxide, photochemical oxidants,
n i t rogen d i o x i d e and lead. The es tab l i shed regu la to ry c o n t r o l l e v e l s were
enforced by pe rm i t s con ta in ing emission. design, equipment, work place. o r
opera t iona l standards.
Since 1980, increased emphasis has been p laced on t o x i c a i r contaminants by
federal and s t a t e governmental leve ls . As of June 1986, EPA has l i s t e d as
hazardous a i r p o l l u t a n t s (under Clean A i r Act Sec t ion 112) asbestos, benzene,
bery l l ium, coke oven emissions. inorgan ic arsenic. mercury, rad ionucl ides, and
v i n y l ch lo r i de . EPA must develop n a t u r a l emission standards f o r a l l a i r
p o l l u t a n t s l i s t e d as hazardous under CAA 112.
i n t e n t t o 1 i s t cadmium, carbon t e t r a c h l o r i d e . chloroform, chromium, e thy lene
d i ch lo r i de , e thy lene oxide. and 1.3-butadiene. L i s t i n g dec is ions a r e expected i n
t h e near f u t u r e on d iox in , methylene ch lo r ide , n icke l , perchloroethylene, phenol,
and t r i c h l o r e t h y l e n e . F i n a l emission standards have been issued f o r asbestos,
benzene, b e r y l 1 ium, mercury, rad ionucl ides, and v i n y l ch lo r i de . Eventual ly, a l l
contaminants l i s t e d as hazardous a i r p o l l u t a n t s w i l l be regu la ted by EPA-issued
na t i ona l emission standards and enforced by EPA o r t h e s t a t e s through permits.
EPA has a l so issued no t i ces of
EPAls rev i sed a i r t o x i c s p o l i c y env is ions a pr imary r o l e f o r s t a t e s and l o c a l
agencies i n t h e c o n t r o l o f hazardous a i r emissions.
hazardous a i r p o l l u t a n t s t o t h e s t a t e s f o r s t a t e enforcement.
EPA in tends t o r e f e r some
Some s t a t e s have
3-21
al ready taken t h e lead on c o n t r o l l i n g sources o f t o x i c a i r p o l l u t a n t s .
June 1986. 19 s t a t e s and 21 l o c a l a i r p o l l u t i o n c o n t r o l agencies have a i r t o x i c s
programs i n place, and 23 s t a t e s and 4 agencies have regu la t i ons under
development.
As o f
Federal and s t a t e a i r t o x i c s p r o g r a m may be ( o r become) a p p l i c a b l e t o hazardous
emissions from u t i l i t y b o i l e r s evaporat ing metal c lean ing wastes, p a r t i c u l a r l y i f
t h e wastes con ta in c o n s t i t u e n t s n o t o therwise present i n t h e fue l .
poss ib le a t t h i s t i m e t o assess t h e i m p l i c a t i o n s of a i r t o x i c s r e g u l a t i o n f o r t h e
evaporat ion o f metal c lean ing wastes i n u t i l i t y b o i l e r s g i ven t h e evo lv ing s t a t e
of regu la to ry development.
It i s n o t
UNDERGROUND STORAGE TANKS
The most s i g n i f i c a n t new i n i t i a t i v e a f f e c t e d by t h e RCRA amendments o f 1984 i s
t h e underground storage tank (LIST) regu la to ry program. Th is program i s n o t
a c t u a l l y p a r t o f t h e Resource Conservation and Recovery Act ( S u b t i t l e C), b u t i s
an e n t i r e l y new s u b t i t l e ( S u b t i t l e I) o f t h e S o l i d Waste Disposal Act. The
program r e s u l t e d from Congress' percept ion t h a t EPA lacked sound s t a t u t o r y
a u t h o r i t y f o r r e g u l a t i n g underground tanks s t o r i n g hazardous m a t e r i a l s o r
products which may leak i n t o t h e environment i f n o t p roper l y designed and
maintained.
S u b t i t l e I es tab l i shes a bas i s f o r comprehensive r e g u l a t i o n o f underground
storage tanks through a s e r i e s o f mandatory n o t i f i c a t i o n s and EPA rulemakings.
Regulated tanks a re those which s t o r e " regu la ted substances" w i t h more than 10
percent o f t h e i r volumes ( i n c l u d i n g underground connect ive p ip ing ) beneath t h e
sur face of t h e ground. Tanks excluded from S u b t i t l e I r e g u l a t i o n include: 1) heat ing o i l tanks; 2 ) p i p e l i n e f a c i l i t i e s regu la ted under o the r laws; 3 ) stormwater and wastewater c o l l e c t i o n systems; 4) hazardous waste s torage tanks;
5) f low-through process tanks; and 6) t r a p s and ga the r ing l i n e s d i r e c t l y r e l a t e d
t o o i l and gas produc t ion and ga the r ing operat ions.
petroleum (crude o i l and re f i ned products) and hazardous substances designated
under Superfund.
Regulated substances i n c l u d e
It i s impor tan t t o emphasize t h a t t h e UST program under RCRA does n o t apply t o
s torage of hazardous wastes which a re regu la ted under EPA hazardous waste
r e g u l a t i o n s conta ined i n 40 CFR P a r t 264, Subpart J . and r e g i s t r a t i o n program requ i res a c t i o n s by bo th d i s t r i b u t o r s o f regu la ted
The S u b t i t l e I n o t i f i c a t i o n
3-28
substances and owners o f new and e x i s t i n g underground storage tanks as we l l as
tanks taken o u t o f ope ra t i on w i t h i n t h e l a s t 10 years.
The second h a l f o f t h e underground storage tank program invo lves EPA adopt ion of
re lease de tec t i on , prevent ion, and c o r r e c t i o n r e g u l a t i o n s designed t o p r o t e c t
human h e a l t h and t h e environment. For a l l underground storage tanks, EPA's
r e g u l a t i o n s must i nc lude requirements f o r : 1) ma in ta in ing a leak d e t e c t i o n
system, an i nven to ry c o n t r o l systeni c m b i n e d w i t h tank t e s t i n g , o r a comparable
system o r method designed t o i d e n t i f y releases; 2) implementing c o r r e c t i v e
ac t i on ; 3 ) recordkeeping; 4 ) r e p o r t i n g re leases and c o r r e c t i v e ac t i on ; 5) abandoning t h e tank; and 6) secur ing f i n a n c i a l assurance, as necessary o r
des i rab le, f o r c o r r e c t f v e a c t i o n and t h f r d - p a r t y l i a b i l i t y . For new underground
storage tanks, t h e performance standards must i nc lude requirements for design,
cons t ruc t i on . i n s t a l l a t i o n , re lease detect ion, and m a t e r i a l s c o m p a t i b i l i t y .
These r e g u l a t i o n s w i l l be adopted by EPA i n accordance w i t h a phased schedule:
0 9 February 1987 - date by which EPA must adopt r e g u l a t i o n s f o r e x i s t i n g petroleum tanks and performance standards f o r new petroleum tanks;
9 August 1987 - date by which EPA must adopt performance standards f o r new Superfund hazardous chemical product tanks; and
9 August 1988 - date by which EPA must adopt r e g u l a t i o n s f o e x i s t i n g Superfund hazardous chemical product tanks.
0
0
For t h e i n t e r i m pe r iod from 7 May 1985 u n t i l t h e e f f e c t i v e dates of new tank
performance standards, an underground storage t a n k ( s i n g l e o r double-walled) may
be i n s t a l l e d or brought i n t o use on ly i f : 1) it w i l l prevent releases due t o
c o r r o s i o n o r s t r u c t u r a l f a i l u r e f o r t h e opera t i ona l l i f e of t h e tank; 2) it I s
c a t h o d i c a l l y protected, cons t ruc ted of noncorros ive mater ia ls , s tee l - c lad w i t h a
noncorros ive ma te r ia l , or designed i n a manner t o prevent t h e re lease of t h e
s t o r e d substance; and 3 ) t h e m a t e r i a l used i n c o n s t r u c t i n g or l i n i n g t h e tank i s
compat ib le w i t h t h e substance stored.
CLEAN WATER ACT (CWA)
The U.S. EPA has developed e f f l u e n t l i m i t a t i o n s (40 CFR P a r t 423) f o r t h e steam
e l e c t r i c i n d u s t r y i n compliance w i t h t h e Federal Water P o l l u t i o n Contro l Act of
1972, as amended. These e f f l u e n t l i m i t a t i o n s apply t o several u t i l i t y i n d u s t r y
waste streams.
t h i s manual inc lude:
The streams t h a t correspond t o t h e low volume wastes discussed i n
3-29
"Low volume waste" - wastewater from a l l sources except those f o r which s p e c i f i c l i m i t a t i o n s are es tab l i shed. These low volume wastes would include, b u t a re n o t l i m i t e d to , wastewater from wet scrubbers, deminera l i zer regenerant. evaporator br ine, b o i l e r blowdown. c o o l i n g tower bas in sludge, and f l o o r drains.
"Metal c lean ing waste" - wastewater r e s u l t i n g from cleaning. w i t h o r w i thou t chemical add i t i ves , any metal process equipment i n c l u d i n g b o i l e r tube cleaning, b o i l e r f i r e s i d e cleaning, and a i r p reheater c lean ing .
For any e x i s t i n g f a c i l i t y , t h e e f f l u e n t l i m i t a t i o n s achievable th rough app-
l i c a t i o n of t h e "best a v a i l a b l e technology economical ly achievable" (BAT) a re
l i s t e d i n Table 3-6.
Table 3-6
BAT EFFLUENT LIMITATIONS
(mg/L)
Chem i ca l
Low V O l u me Waste Metal Cleaning Waste Coal P i l e Runoff Average Average
o f D a i l y o f D a i l y Values Values
Maximum f o r 30 Maximum f o r 30 Maximum f o r Any Consecutive f o r Any Consecutive f o r Any
Parameter 1 Dav Davs J-kdY- Davs LLiQEL
TS S 100.0 30.0 100.0 30.0 50 O i l and grease 20.0 15.0 20.0 15 .O NA Copper NA NA 1 .o 1.0 NA I r o n NA NA 1 .o 1.0 NA
- NA - Not app l i cab le .
I n add i t i on , t h e pH o f low volume waste and metal c lean ing waste discharges s h a l l
be w i t h i n t h e range of 6.0 t o 9.0. And, no discharge of po l ych lo r i na ted biphenyl
compounds i s al lowed.
New source performance standards (NSPS) m i r r o r t h e BAT e f f l u e n t l i m i t a t i o n s w i t h
a few except ions. Whereas. t h e BAT e f f l u e n t l i m i t a t i o n s f o r f l y ash and bottom
3-30
ash t r a n s p o r t water a re t h e same as f o r low volume waste, f o r a new source no
discharges a re al lowed from f l y ash t r a n s p o r t water. NSPS f o r bottom ash t r a n s -
p o r t water i s t h e same as t h e BAT.
c l e a n i n g wastes are, as yet, es tab l i shed on ly f o r chemical metal c lean ing wastes
( b o i l e r chemical c lean ing waste) and a re i d e n t i c a l t o t h e BAT. Nonchemical metal
c l e a n i n g wastes ( f i r e s i d e and a i r preheater waste) a re s t i l l under cons ide ra t i on
f o r e f f l u e n t l i m i t a t i o n g u i d e l i n e development.
Also, NSPS e f f l u e n t l i m i t a t i o n s for metal
The r e g u l a t i o n s developed under t h e FWPCA and t h e CWA a l s o s e t c r i t e r i a f o r d i s -
charges t o pub1 i c l y owned t rea tment works.
e x i s t i n g sources (PSNS) and new sources (NSPS) r e q u i r e t h e fo l l ow ing :
These pre t rea tment standards f o r
No discharge of p o l y c h l o r i n a t e d biphenol (PCB) compounds; and
a Chemical metal c lean ing wastes ( b o i l e r chemical c l e a n i n g wastes) s h a l l n o t exceed 1.0 mg/L i n copper as a d a i l y maximum.
L i m i t s f o r nonchemical metal c lean ing waste a r e n o t y e t es tab l i shed. Also, f o r
new sources, no discharge of wastewater from f l y ash t r a n s p o r t water i s al lowed.
3-31
Sect icn 4
LOW VOLUME WASTE TREATMENT METHODS
U t i l i t i e s have severa l a l t e r n a t i v e s f o r s to r ing . t r e a t i n g , and d ispos ing of low
volume wastes. Treatment methods a r e se lec ted based on t h e c h a r a c t e r i s t i c s o f
t h e waste, a p p l i c a b l e regu la t ions , t rea tment method e f f e c t i v e n e s s and cost, and
s i t e s p e c i f i c f a c t o r s i n v o l v i n g t h e i n t e g r a t i o n of t h e low volume waste nianage-
Kent s t r a t e g y w i t h t h e o v e r a l l p l a n t water and waste management plan.
s e c t i o n presents i n f o r m a t i o n on t h e t rea tment e f fec t i veness , conceptual designs,
and c o s t s of methods used t o store, t r e a t , and d ispose o f low volume wastes
(descr ibed i n S e c t i o n 2) i n accordance w i t h r e g u l a t o r y requirements (descr ibed i n
Sec t ion 3).
This
U t i l i t i e s use a v a r i e t y of n:ethods i n combination o r separa te ly f o r low volume
waste management and treatment. These inc lude:
a C o l a n d f i l l i n g ;
a Cont rac t d isposal ;
a Coponding;
a Evaporation;
N e u t r a l i z a t i o n ;
a O i l / w a t e r separation;
a Physica l /chemical t reatment ;
a Pond evaporation;
a Recycle/reuse; and
a Setiin,entation.
Not a l l of t h e t rea tment methods l i s t e d above a r e discussed i n t h i s sect ion.
Methods such as o i l and grease removal, s a n i t a r y waste t rea tment and disposal.
and l a b o r a t o r y waste t i isposal have been excluded s i n c e they a r e n o t unique t o t h e
u t i l i t y indus t ry .
u t i l i t i e s t o t r e a t power p l a n t - s p e c i f i c wastes.
The processes t h a t a r e discussed a r e those commonly used by
Many o ther t rea tment methods a r e
4-1
a v a i l a b l e t o t h e u t i l i t y indus t ry , although they a r e n o t w ide ly p rac t iced , and
i n n o v a t i v e processes a r e c u r r e n t l y under development. Several of these tech-
niques a r e discussed a t t h e end o f t h i s sec t ion .
APPROACH
The low volume waste t rea tment processes discussed i n t h i s s e c t i o n were se lec ted
based on t h e surveys and p l a n t t r i p s conducted d u r i n g RP2215 ( i n c l u d i n g
i n f o r m a t i o n from over 30 f o s s i l f u e l - f i r e d power p l a n t s ) , and o t h e r in fo rmat ion
ob ta ined from l i t e r a t u r e d e s c r i b i n g power p l a n t operat ions. The in fo rmat ion
presented f o r each t rea tment process inc ludes:
@
Treatment e f fec t i veness ;
Conceptual des ign(s) ; and
Treatment costs .
A p p l i c a b i l i t y t o s p e c i f i c low volume wastes;
- f h e streams considered f o r t rea tment by each process a r e presented i n F i g u r e 4-1.
It should be noted t h a t F i g u r e 4-1 does n o t i n c l u d e a l l p o s s i b l e combinations o f
t rea tment processes and streams. The a p p l i c a b l e streams and t h e t rea tment
processes a r e based on i n f o r m a t i o n ob ta ined from p l a n t t r i p s and l i t e r a t u r e data.
Jreatment F f fec t i veness
Treatment processes a r e discussed i n terms o f t h e i r e f f e c t i v e n e s s f o r p a r t i c u l a r
low volume wastes.
t rea tment a t many p l a n t s d u r i n g t h e course o f t h i s program.
c h a r a c t e r i z a t i o n r e s u l t s i n d i c a t e t h a t most o f t h e wastes cou ld be t r e a t e d us ing
convent ional t rea tment approaches. Some, however, were more d i f f i c u l t t o t r e a t
(i.e., spent che la ted b o i l e r chemical c l e a n i n g wastes) than others. Laboratory
s t u d i e s were a l s o conducted t o eva lua te t h e e f f e c t i v e n e s s of t rea tment and
d isposal techniques f o r s p e c i f i c low volume wastes.
t rea tment e f f e c t i v e n e s s data i s presented w i t h each process d e s c r i p t i o n .
Low volume waste streams were sampled be fore and a f t e r
The sampling and
An overview of these
v Conceptual designs used as t h e bas is f o r e s t i m a t i n g c o s t s a r e presented fo r each
t rea tment method.
a r e p r a c t i c e d a t many f o s s i l f u e l - f i r e d power p lan ts . D i f fe rences i n
It should be noted t h a t v a r i a t i o n s i n these conceptual designs
4-2
pyrites
Coal Pile Runoff
Raw Water Treatment Sludge I 0
Floor and Yard Drains
Demineralizer I Regenerant
I Boiler Blowdawn
FireSide I Wastes
Bolier Chemical
Cooling Tower Basin Sludge I 0
I. Treatment Sludges and Brines
0 0 0 0
0
0 0
0 0 0 0 0 0
0 0
0 0
0 0
0 0
0 0 0
0
Figure 4-1. Low Volume Wastes and Common Treatment Processes
4-3
s i t e - s p e c i f i c s i t u a t i o n s and i n processes a v a i l a b l e from equipment vendors o f ten
r e s u l t i n t h e use of a l t e r n a t i v e designs. Th is manual does n o t address a l l of
t h e p o s s i b l e design approaches; ra ther , it prov ides s u f f i c i e n t d e t a i l t o a l l o w
t h e user t o t a i l o r a design t o a s p e c i f i c s i t u a t i o n .
Several sources were used i n d e f i n i n g t h e design bases f o r these t rea tment
processes. Typ ica l stream flows. system capac i t ies , and s to rage requ i rements
were obta ined p r i m a r i l y from t h e EPRI Technical Assessment Guide (&I and from
t h e EPA e f f l u e n t g u i d e l i n e s document (5). sources was taken from t h e p l a n t survey data c o l l e c t e d d u r i n g t h i s p r o j e c t . The
design bases used i n t h i s study a r e presented i n Tab le 4-1. I n t h i s tab le , t h e
low volume waste stream f l o w s based on power generat ion c a p a c i t i e s a r e used t o
d e f i n e t h e range o f system s i z e s used f o r develop ing t rea tment designs and costs .
In fo rmat ion n o t a v a i l a b l e from these
- Estimated c a p i t a l , and opera t ing and maintenance (0 B M) c o s t s a r e presented f o r
each t rea tment method i n f i r s t q u a r t e r 1986 d o l l a r s .
sented accord ing t o t h e format g iven i n t h e EPRI Technica l Assessment Guide (&).
Leve l i zed c o s t s a r e n o t presented because t h e p r o j e c t and equipment l i f e may vary
g r e a t l y from p l a n t t o p lant . e s p e c i a l l y f o r r e t r o f i t s i t u a t i o n s . The est imates
presented i n t h i s manual should be considered accurate w i t h i n k 15-30 percent
(e.g., a Class I 1 p r e l i m i n a r y estimate. u s i n g vendor quotes f o r major equipment
i tems and f a c t o r s f o r o t h e r m a t e r i a l s and l a b o r ) .
These est imates a r e pre-
A worksheet showing t h e methodology used t o determine t o t a l c a p i t a l requirements
i s presented i n Tab le 4-2. Whenever possible, ac tua l vendor quotes were used f o r
equipment and i n s t a l l a t i o n costs; c o s t s presented by Richardson (I&) and Means
(39) were a l s o u t i l i z e d i n p r i c t n g equipment and s i tework. D e t a i l e d equipment
l i s t s and c o s t s f o r t h e t rea tment processes a r e presented i n Appendix E.
s torage and d isposal opt ions, design methodology and c o s t s a r e presented. These
l i s t s c o n t a i n s u f f i c i e n t d e t a i l t o a l low t h e user t o modify designs and cos ts t o
r e f l e c t d i f fe rences r e s u l t i n g from s p e c i f i c a p p l i c a t i o n s . Factors from t h e EPRI
Technica l Assessment Guide (19). from G u t h r i e (a), and from Peters and Timmer-
haus were used t o es t imate c o s t s o f o n - s i t e and o f f - s i t e f a c i l i t i e s .
On-site cos ts i n c l u d e t h e m a t e r i a l s and l a b o r f o r p ip ing, foundations. e l e c t r i -
cal, and I n s u l a t i o n , pa int , and cleanup. O f f - s i t e f a c i l i t i e s i n c l u d e bu i ld ings ,
storage. u t i l i t i e s , and o f f - s i t e p ip ing. The format and f a c t o r s f o r p r e s e n t a t i o n
o f i n d i r e c t c a p i t a l c o s t s were taken from t h e EPRI Technical Assessment Guide
(U).
For t h e
4-4
Table 4-1
DASES FOR CONCEPTUAL DESIGNS
Coal P i l e Runoff coal p i l e = 0.075 acres/MW (22 1
maximum weekly p r e c i p i t a t i o n : W i s c o n s i n / I l l i n o i s = 6.5 inches (Lz) Arizona/New Mexico = 4.0 inches (U)
t rea tment i n t e r v a l f o r r u n o f f o f maximum weekly p r e c i p i t a t i o n = 10 days
P v r i t e s - volume generated i s dependent on fue l type.
bituminous coa l = 10 cu yd/yr/MW ( P l a n t Surveys) subbituminous c o a l fue l supply = 0.1 c u yd/yr/MW ( P l a n t Surveys)
-t e r - produced i n batch opera t ions severa l t imes d a i l y .
c o a l - f i r e d p l a n t = 79 gpd/MW o i l - f i r e d p l a n t = 226 gpd/MW
batch regenera t ion frequency = 6 hrs
(51 (5)
b k e u D Water S o f t e ntna Sluda e - dependent on raw water q u a l i t y and s o l i d s concent ra t ion o f sludge.
Based on t h e f o l l o w i n g assumptions:
1) 2)
raw water requirement o f 15,000 gpd/MW, dry s o l i d s p roduc t ion o f 2100 lb/MG o f raw water t r e a t e d ,
average volumes f o r design are: 7.5 percent s o l i d s sludge = 48 gpd/MW 35 percent s o l i d s sludge = 9.R gpd/MW
and Y a r d 0 - ra F l o o r
= 30 gpd/MW (U)
B i l e r B l o w d m
c o a l - f i r e d p l a n t = 148 gpd/MW (5) o i l - f f r e d p l a n t = 287 gpd/MW (5)
4-5
Tab le 4-1 (cont inued)
BASES FOR CONCEPTUAL DESIGNS
B o i l e r Chem i c a l Cleanina Wastes - performed once every 2-5 years b o i l e r volume = 125 gal/MW ( P l a n t Surveys)
volume/cleaning = 1 b o i l e r volume (5) = 125 gal/MW
r i n s e volume/cleaning = 1 b o i l e r volume (5) = 125 gal/MW
( r i n s e volume/cleaning = 4 b o i l e r volumes (500 gal/MW) if HC1 wash)
F i r e s i d e Wastes - design based on combined f i r e s i d e and a i r p reheater wash
c o a l - f i r e d p l a n t : f i r e s i d e = 2.9 gpd/MW (5 ) a i r preheater = 14.5 aDd/ MW (5) t o t a l = 17.4 gpd/MW
o i l - f i r e d p l a n t : f i r e s i d e = 7.0 gpd/MW (5 ) a i r preheater = 17.6 aDd/ MY (5 ) t o t a l = 24.6 gpd/MW
Coo l ina Tower Basin Sludgg = 0.02 cu yd/yr/MW ( P l a n t Surveys)
eqsion B r i n g = 3 1 gpd/MW (5)
- dependent on t h e t y p e o f t rea tment and t h e t y p e of waste t r e a t e d .
For t rea tment o f s p e c i f i c wastes, designs were based on t h e f o l l o w i n g est imated s o l i d s p roduc t ion amounts. c a l c u l a t e d us ing average waste composit ions from Appendix C.
deminera l i zer regenerant: d ry s o l i d s = 1.2 lb /1000 g a l l o n s t r e a t e d f i r e s i d e c l e a n i n g waste: dry s o l i d s = 32 lb/1000 g a l l o n s t r e a t e d waters ide c l e a n i n g waste: d ry s o l i d s = 1 7 lb/1000 g a l l o n s t r e a t e d
These were
4-6
Table 4-2
TOTAL CAPITAL COST ESTIMATION METHODOLOGY
System Throughput, gpm:
D i r e c t Process and O f f - s i t e Cap i ta l CQ&
Major equipment i t e m 1 Major equipment item 2 Major equipment i tem 3 Major equipment i tem 4 Major equipment i t em 5
Vendor quotes f o r puchased equipment cost. Factored est imates f o r i n s t a l l a t i o n a r e inc luded i n t h i s number.
On-site Costs' (0.15 t o 0.45) X Purchased Equipment Cost
D i r e c t Process Cost
O f f - s i t e Costs'
Sum of t h e Above
(0.05 t o 0.30) X D i r e c t Process Cost
T o t a l D i r e c t C a p i t a l Cost (TDCC) Sum o f t h e above - Engineering and Home O f f i c e Fees (10%) 0.10 X TDCC
Process Contingency ( 5%) 0.05 X TDCC P r o j e c t Contingency (20%) 0.20 x mcc
TOTAL PLANT COST (TPC) Sum o f D i r e c t and I n d i r e c t Costs
Allowance fo r Funds During Construct ion $0 i f l e s s than 6 months
TOTAL PLANT INVESTMENT (TPI) Sum o f t h e above
Preproduct ion Costs
Inven to ry C a p i t a l
One month o f F ixed and Var iab le Operat ing Costs + 0.02 X TPI
Two month chemical i nven to ry
I n i t i a l Chemicals Charge Working volume
TOTAL CAPITAL REQUIREMENT (TCR) Sum o f t h e above
- 'On-site c o s t s i n c l u d e m a t e r i a l s and l a b o r for piping, foundations, e l e c t r i c a l , and i n s u l a t i o n , paint . and cleanup.
'Off-si te cos ts i n c l u d e m a t e r i a l s and l a b o r f o r bu i ld ings, storage f a c i l i t i e s , u t i l i t i e s , and o f f - s i t e p ip ing.
4-7
Operating and maintenance ( 0 8 M) cos ts were developed us ing t h e EPRI Technica l
Assessment Guide (&I and d e t a i l e d est imates of ope ra t i ng l a b o r requirements,
reagent consumption, and power usage.
es t ima t ion niethodology i s presented i n Table 4-3.
maintenance l a b o r and mater ia ls , and a d m i n i s t r a t i v e and suppor t l a b o r were s p l i t
between f i x e d and v a r i a b l e cos ts assuming a 65 percent p l a n t capac i t y f a c t o r
(16). Chemical p r i c e s were obta ined from t h e Chemical Market ing Repor ter (22) . E l e c t r i c a l and opera t ing l a b o r cos ts were based on t h e EPRI Technica l Assessment
Guide (&I.
A worksheet showing t h e 0 8 M c o s t
Costs f o r ope ra t i ng labor ,
Fo r each t rea tment process, curves i l l u s t r a t i n g t o t a l c a p i t a l requirement and
annual d i r e c t ope ra t i ng c o s t as a func t i on o f system throughput o r capac i ty a re
presented.
us ing t y p i c a l low volume waste f l ows (LI.6) f o r a wide range o f power s t a t i o n
c a p a c i t i e s (approx imate ly 100 t o 1,000 MW).
(i.e., impoundments. tanks, and l a n d f i l l s ) . c o s t curves a r e presented on a c o s t
per u n i t volume basis .
severa l o rders o f magnitude.
I n each case t h e range of t rea tment system s i zes was determined by
For t h e s torage and d isposal methods
T h i s approach was used because s i z e ranges spanned
For severa l processes, c o s t s e n s i t i v i t i e s t o s p e c i f i c v a r i a b l e s a r e presented.
Process mod i f i ca t i ons judged t o be t h e most useful t o u t i l i t y users were chosen
as v a r i a b l e s f o r s e n s i t i v i t y analyses. These inc luded design mod i f i ca t ions .
changes i n m a t e r i a l s of cons t ruc t ion , v a r i a t i o n s i n chemical feeds and dosages.
and changes i n ope ra t i on (e.g., cons tan t versus i n t e r m i t t e n t f l ow) . Unless
s p e c i f i c a l l y noted, a l l t reatment methods a r e assumed t o be f o r non-hazardous
wastes. I n most cases, t reatment of hazardous wastes would be s im i la r , except
t h a t RCRA p e r m i t t i n g c o s t s may be incurred.
Using t h i s methodology, f i v e t rea tment processes and s torage methods were
evaluated: n e u t r a l i z a t i o n . impoundments and tanks, phys ica l /chemical treatment,
l a n d f i l l s , and evaporation. Although e i g h t t reatment processes a r e shown i n
FISure 4-1, severa l processes a r e based on s i m i l a r technology. C o l a n d f i l l i n g and
c o n t r a c t o r d isposa l a r e bo th discussed i n t h e l a n d f i l l subsection. Coponding.
sedimentation, and pond evapora t ion a r e discussed i n t h e impoundments and tanks
subsection,
NEUTRALIZATION
N e u t r a l i z a t i o n i s a wastewater t rea tment technique i n which a c i d i c o r a l k a l i n e
wastes a r e t r e a t e d w i t h e i t h e r s t rong bases (e.g., caus t ic , l ime) o r ac ids (e.g.,
4-8
Table 4-3
OPERATING AND MAINTENANCE COST METHODOLOGY
System Throughput, gpm:
1 Fixed ODerat i n 0 Costs
Opera t ing Labor Maintenance Labor Maintenance Ma te r i a1 s A d m i n i s t r a t i v e 8 Support Labor
0.65 X $15.25/hr X h r s / y r
0.65 X 0.07 X TDCC X 0.60 0.30 X F ixed 0 8 M Labor
0.65 x 0.07 x TDCC x 0.40
ANNUAL FIXED 0 8 M COST
Y a r i a b l e ODerat i n a Costs
Opera t ing Labor Maintenance Labor Maintenance M a t e r i a l s A d m i n i s t r a t i v e 8 Support Labor
Consumables: Chemical s
E 1 e c t r i c i t y
Sum o f Fixed Costs
0.35 X $15.25/hr X h r s / y r 0.35 X 0.07 X TDCC X 0.40 0.35 X 0.07 X TUCC X 0.60 0.30 X Va r iab le 0 8 M Labor
$ / u n i t X u n i t / y r $0.04/kWh X kWh/yr
ANNUAL VARIABLE 0 8 M COST
ANNUAL DIRECT 0 8 M COST2
Sum o f Va r iab le Costs
Sum o f Fixed and Var iab le Costs
'Fixed c o s t s i n c l u d e 65 percent of o p e r a t i n g labor, maintenance costs, and a d m i n i s t r a t i v e and suppor t cos ts based on a 65 percent p l a n t c a p a c i t y fac to r . The remaining 35 percent o f these cos ts a re app l i ed t o v a r i a b l e costs.
' I n d i r e c t ope ra t i ng costs, such as deprec ia t ion . insurance. taxes, and general and a d m i n i s t r a t i v e cos ts a r e n o t included.
4-9
s u l f u r i c ac id ) . respec t i ve l y . t o produce a near n e u t r a l stream pH. Two s i t u a -
t i o n s r e q u i r f n g n e u t r a l i z a t i o n o f low volume wastes a re commonly encountered i n
t h e u t i l i t y i ndus t r y :
c Wastewater t h a t i s discharged under NPDES perm i t s must be w i t h i n a pH range o f 6.0 t o 9.0; and
0 The pH l s v e l s o f s t r o n g l y a c i d i c wastes must be ra i sed above a va lue of 2.0 and those of s t r o n g l y a l k a l i n e wastes must be decreased below a va lue o f 12.5 t o comply w i t h RCRA c o r r o s i v i t y l i m i t s .
Treatment methods o t h e r than those descr ibed here can a l s o be used t o n e u t r a l i z e
low volume wastes, such as coponding a c i d wastes i n an a l k a l i n e pond o r us ing t h e
n e u t r a l i z a t i o n c a p a b i l i t y o f a physical /chemical t rea tment system.
B p ~ l i c a b l e Streams
Three low vo l uine wastes t h a t may r e q u i r e n e u t r a l i z a t i o n t o meet NPDES requ i re -
ments a re :
Deminera l i zer regenerant;
Coal p i l e r u n o f f ; and
B o i l e r blowdown.
I n add i t ion , it may be necessary t o n e u t r a l i z e extremely a c i d i c demine ra l i ze r
regenerant t o avo id c l a s s i f i c a t i o n of t h i s waste as c o r r o s i v e under RCRA guide-
l i n e s . Hydroch lo r i c a c i d b o i l e r chemical c lean ing waste requ i res n e u t r a l i z a t i o n
t o avo id be ing c l a s s i f i e d as a RCRA c o r r o s i v e waste; a l l spent hyd roch lo r i c a c i d
c lean ing wastes analyzed d u r i n g t h i s study had an i n i t i a l pH below 2.0. Th is
n e u t r a l i z a t i o n s tep i s n o t considered t o be hazardous waste t rea tment under RCRA
when 1) t h e stream i s o n l y hazardous because o f t h e pH, and 21 t h e n e u t r a l i z a t i o n
occurs i n - l i n e o r i n a tank (a tank as defined under RCRA i s cons t ruc ted o f
non-earthen m a t e r i a l s and i s se l f - suppor t i ng ) .
If removal of o t h e r contaminants i s a l s o requ i red (e.g., suspended s o l i d s o r d i s -
so lved meta ls ) , o t h e r t rea tmen t methods may be necessary. such as sedimentat ion
o r phys i ca l /chemi ca l t reatment.
I r e a t m e n t F f f e c t i veness
Chemical n e u t r a l i z a t i o n t o a d j u s t t h e pH of low volume wastes i s s t r a i g h t f o r w a r d
s ince t h e streams considered do n o t possess s i g n i f i c a n t b u f f e r i n g capac i ty . For
4-10
example. n e u t r a l i z a t i o n of s t r o n g l y a c i d i c (pH < 2 ) h y d r o c h l o r i c a c i d wastewater
can be r e a d i l y achieved w i t h a s t r o n g base ( c a u s t i c o r l i m e ) i f t h e a d d i t i o n of
n e u t r a l i z i n g reagent i s p r o p e r l y c o n t r o l l e d and s u f f i c i e n t m i x i n g provided.
A secondary e f f e c t o f n e u t r a l i z a t i o n may be chemical p r e c i p i t a t i o n o f s l i g h t l y
s o l u b l e s a l t s and/or meta ls f rom s o l u t i o n . Al though a r e d u c t i o n i n metal con-
c e n t r a t i o n s i s n o t t h e o b j e c t i v e o f n e u t r a l i z a t i o n , it can be an impor tan t s i d e
r e a c t i o n because it may serve as a pre- t reatment s tep. Also, any s o l i d s which
form due t o p r e c i p i t a t i o n r e a c t i o n s may r e q u i r e removal t o meet suspended s o l i d s
l i m i t s . Table 4-4 p resents an example o f reduc t ions i n d i s s o l v e d meta ls concen-
t r a t i o n s a t a s i n g l e p l a n t as a r e s u l t o f n e u t r a l i z i n g h y d r o c h l o r i c a c i d b o i l e r
chemical c l e a n i n g wastes. I n t h i s case n e u t r a l i z a t i o n was accomplished i n a
rap id-mix t a n k system.
Table 4-4
REDUCTION OF DISSOLVED METALS CONCENTRATIONS I N A HYDROCHLORIC A C I D BOILER CLEANING WASTE
D i s s o l v e d M e t a l
Ch rom i um
Copper
I r o n
N i c k e l
Z inc
Concent ra t ion 0 Percent Reduct i o n &€Q.c.? AfLQL
6 0.85 86
182 32 83
4140 1450 65
26 9.8 62
30 6.4 79
m D t u a l Desian
Two types o f n e u t r a l i z a t i o n systems a r e commonly used. The f i r s t u t i l i z e s a
small, a g i t a t e d tank, t o which t h e reagent i s added as requ i red . T h i s system i s
d e s i r a b l e f o r batch o p e r a t i o n s and w i t h l a r g e f l o w v a r i a t i o n s . For streams w i t h
cons tan t f l o w and composi t ion, i n - l i n e n e u t r a l i z a t i o n i s o f t e n employed. I n t h i s
design. overdoses of reagents can occur i f t h e waste composi t ion changes r a p i d l y ,
s i n c e t h e m i x i n g occurs w i t h i n t h e t r a n s p o r t p i p i n g .
F igures 4-2 and 4-3 p r e s e n t conceptual designs f o r rap id-mix tank and i n - l i n e
n e u t r a l i z a t i o n systems, r e s p e c t i v e l y . I n a d d i t i o n t o t h e rapid-mix t a n k and
4-11
1 ------------- CHEMICAL NEUTRALIZATION SYSTEM I
' I I
CHEMICAL FEED PUMPS
I I
I TREATMENT I I I
FI - FLOW INDICATOR
LS - LEVEL SENSOR pH - pH SENSOR
INSTRUMENT AIR LINE _ _ _ - INSTRUMENT ELECTRICAL LEAD
F igu re 4-2. Conceptual Design for Rapid-Mix Tank N e u t r a l i z a t i o n
-------------
TO DISCHARGE OR FURTHER
WASTE TREATMENT STREAM
EHEMICAL NEUTRALIZATION SYSTEM
,-------- ------ FI - FLOW INDICATOR pH - pH SENSOR
7*L--*L INSTRUMENT AIR LINE ---- INSTRUMENT ELECTRICAL LEAD
Figure 4-3. Conceptual Design for In-Line Neutralization
I I
i n - l i n e mixer, each system inc ludes t r a n s f e r pumps and p r o v i s i o n s fo r chemical
feed o f bo th a c i d and a l k a l i n e reagents, pH c o n t r o l . and f l o w measurement.
I n many instances, m o d i f i c a t i o n s t o these bas i c designs may be approp r ia te for a
s p e c i f i c a p p l i c a t i o n . For example. a d d i t i o n a l f a c i l i t i e s f o r waste s to rage and
t r a n s p o r t i n g may be necessary ( these c o s t s a r e presented i n t h e impound-
ments/tanks d i scuss ion o f t h i s sec t i on ) . I n o t h e r cases, o n l y one reagent may be
needed f o r pH adjustment ( i .e., when any a c i d i c o r a l k a l i n e low volume waste i s
n e u t r a l i z e d i n t h e equipment). A d d i t i o n a l l y , when i n - l i n e n e u t r a l i z a t i o n i s used
t o t r e a t h y d r o c h l o r i c a c i d b o i l e r chemical c lean ing waste as it i s d ra ined from
t h e b o i l e r , s u f f i c i e n t head i s sometimes a v a i l a b l e so t h a t a t r a n s f e r pump i s n o t
requ i red .
l r e a t m e n t Costs
The design da ta used t o d e f i n e t h e range o f f low r a t e s and system c a p a c i t i e s f o r
developing t rea tment c o s t s were presented i n Table 4-1. Flow r a t e s of demine-
r a l i z e r regenerant, b o i l e r blowdown, coa l p i l e runo f f , and h y d r o c h l o r i c a c i d
b o i l e r chemical c l e a n i n g waste were considered i n s i z i n g n e u t r a l i z a t i o n systems.
Separate c o s t s were developed f o r rapid-mix tank and i n - l i n e n e u t r a l i z a t i o n
systems w i t h th roughputs of 50, 250, and 500 gpm. I n es t ima t ing c o s t s f o r these
systems, it was assumed t h a t t h e pr imary use o f t h e systems was f o r r a i s i n g t h e
pH o f a c i d i c streams. The second chemical feed system was inc luded i n t h e
designs t o p rov ide a c i d a d d i t i o n i n t h e event t h a t t h e upper pH l i m i t was
exceeded. Ac id feed r a t e s were assumed t o be one-tenth those o f t h e c a u s t i c feed
ra tes .
For bo th rapid-mix tank and i n - l i n e n e u t r a l i z a t i o n , t h e s e n s i t i v i t i e s o f c o s t s t o
t h e number of chemical feed systems and t o chemical dosage were determined. The
c a p i t a l and o p e r a t i n g c o s t s of two-feed systems were compared t o those f o r
systems hav ing o n l y t h e c a u s t i c feed over t h e throughput range o f 50 t o 500 gpm.
A c a u s t i c dosage of 0.5 gal lons/1000 g a l l o n s o f wastewater was assumed f o r t h i s
comparison.
range o f system s i zes w i t h c a u s t i c dosages rang ing from 0.02 ( f o r m i l d l y a c i d i c
coal p i l e r u n o f f ) t o 2.0 ga1/1000 ga l l ons ( f o r s t r o n g l y a c i d i c deminera l i zer
regenerant ) .
Costs as a func t i on of c a u s t i c dosage were a l s o compared f o r t h i s
RaD I d -Mix Tank N e u t r a l i z a t i on. I n t h i s conceptual design (shown i n F igu re 4-2)
low volume waste streams a r e routed t o a rapid-mix tank where s u l f u r i c a c i d o r
4-14
c a u s t i c i s added t o a d j u s t t h e pH. The equipment inc luded i n t h e c a p i t a l c o s t
es t imate inc ludes :
1 - conc re te sump w i t h g ra ted t o p and suppor ts f o r pump and a g i t a t o r ;
1 - s t a i n l e s s s t e e l a g i t a t o r ;
2 - chemical feed tanks ( f i b e r g l a s s r e i n f o r c e d p l a s t i c ) ;
2 - c e n t r i f u g a l sump pumps f o r system discharge (1 spare);
2 - a c i d meter ing pumps w i t h A l l o y 20 i n t e r n a l s (1 spare);
2 - c a u s t i c meter ing pumps w i t h s t a i n l e s s s t e e l i n t e r n a l s (1 spare);
1 - pH c o n t r o l system ( 2 t ransmi t te rs . 1 o p e r a t i n g probe, 1 spare probe);
1 - l e v e l c o n t r o l system; and
1 - f l o w i n d i c a t o r .
The rapid-mix tank systems evaluated had c a p a c i t i e s o f 2000 g a l l o n s (50 gpm),
10,000 g a l l o n s (250 gpm). and 20,000 g a l l o n s (500 gpm). Breakdowns o f t h e t o t a l
c a p i t a l requirement and annual d i r e c t o p e r a t i n g c o s t s f o r two-feed systems a t a
c a u s t i c dosage of 0.5 ga1/1000 gal a re presented i n Table 4-5 and Tab le 4-6,
respec t i ve l y . D e t a i l e d equipment l i s t s and u n i t c o s t s a re presented i n
Appendix E. The c a p i t a l cos ts i n Table 4-5 show t h a t i n c r e a s i n g t h e system s i z e
by a f a c t o r of 10 inc reases t h e t o t a l p l a n t investment (TPI ) by approximately 65
pe rcen t w h i l e i n c r e a s i n g t h e t o t a l c a p i t a l requirement ( T M ) by n e a r l y 100
percent. The 65 pe rcen t inc rease i n t h e TPI r e f l e c t s t h e increase i n t h e c o s t o f
purchased equipment f o r t h e l a r g e r system.
r e s u l t o f a t e n - f o l d increase i n i nven to ry c a p i t a l based on t h e requirement f o r
two months of chemical s to rage and on t h e c o n t r i b u t i o n o f annual chemical cos ts
t o t h e p rep roduc t i on charge.
f o u r - f o l d inc rease i n annual d i r e c t o p e r a t i n g c o s t as system throughput i s
increased from 50 t o 500 gpm; t h i s increase i s shown i n Table 4-6.
The l a r g e r inc rease i n TCR i s t h e
The c o s t o f chemical feed a l s o accounts f o r t h e
F igures 4-4 and 4-5 show t h e s e n s i t i v i t i e s of c a p i t a l and opera t i ng cos ts t o t h e
number of chemical feed systems inc luded i n t h e design. F igu re 4-4 shows t h a t
e l i m i n a t i o n of t h e a c i d feed system decreases t h e t o t a l c a p i t a l requirement by
15-25 percent . An o p e r a t i n g c o s t decrease o f approximately 5 percent i s shown i n
F igu re 4-5.
t h e c o s t of acid, l ower ing e l e c t r i c i t y usage, and us ing maintenance and adminis-
t r a t l v e c o s t s f a c t o r e d from a lower c a p i t a l cos t .
T h i s o p e r a t i n g c o s t decrease i s t h e combined r e s u l t o f e l i m i n a t i n g
4-15
Table 4-5
TOTAL CAPITAL COST ESTIMATE FOR RAPID-MIX TANK NEUTRALIZATION ( two chemical feed systems - 0.5 gal caust ic /1000 ga l l ons )
System Capacity, ga l lons:
System Throughput, gpm:
Uzxt Process and O f f - s i t e
CaDItall Rapid-Mix Tank A g i t a t o r Chemical Feed Tank (2) Discharge Pumps ( 2 ) Acid Feed Pumps (2) Caust ic Feed Pumps (2) pH Cont ro l System Level Cont ro l System Flow I n d j c a t o r On-site
O i r e c t Process Costs O f f - s i t e cos ts
To ta l D i r e c t Cap i ta l Cost
Engineer ing and Home Of f i ce Fees (10%) P r o j e c t Contingency (20%) Process Contingency (5%)
Allowance f o r Funds Dur ing Const ruc t ion 0 TOTAL PLANT INVESTMENT 71,900
Preproduct ion cos ts Inven to ry Cap i ta l I n i t i a l Chemicals Charge
TOTAL CAPITAL REQUIREMENT
3,700 1 I 700 400
$77,700
$6,800 $11,000 9,900 11,000 79100 10.000 7,200 8,600 5.500 5.500 5,300 5,400 4.200 4 I 200 5.700 6 9 700 1,300 1,300 m u 64,000 76,000 9 r l p a L L M a 73,500 87,000
7.300 8,800 15,000 18,000 l rLM4r4aQ 99,500 118,200
00 99.500 118,200
8,200 13,000 8.700 17,000 ~ 3 . 6 0 0
$118.000 $152,000
' I n s t a l l a t i o n , on-s i te f a c i l i t i e s , and o f f - s i t e f a c i l i t i e s cos ts have been factored i n t o t h e d i r e c t c a p i t a l costs . See Appendix E f o r a d e t a i l e d breakdown o f ac tua l purchase, i n s t a l l a t i o n . and o the r costs .
4-16
Table 4-6
ESTIMATED OPERATING AND MAINTENANCE COSTS FOR RAPID-MIX TANK NEUTRALIZATION (two chemical feed systems - 0.5 ga1/1000 ga l l ons )
System Capacity, ga l lons: System Throughput, gpm:
2,000 10,000 20,000 2 2 5 0 5 0 0
F ixed Operati-
Operating Labor B $15.25/hr $11,000 $14.000 $18,000 Maintenance Labor 1,000 1,300 1,600 Maintenance M a t e r i a l s 1,400 2,000 2.400 Admin i s t ra t i ve A Support Labor LL5!2.Q4.7005,900
ANNUAL FIXE0 0 A M COST 16,900 22,000 279900
v Operating Labor 8 $15.25/hr 5,800 7,800 99700 Maintenance Labor 500 700 900 Maintenance M a t e r i a l s 800 1,100 19300 Admin i s t ra t i ve A Support Labor 1,900 2,600 3,200
Consuma b l es : 66 Be S u l f u r i c B $0.62/gal 50% Caust ic @ S l . l d /ga l l on E l e c t r i c i t y B $0.04/kWh
ANNUAL VARIABLE o a M COST
5 00 2,600 5,300 9,900 50,000 99,000
"4rlM
23t100 69.400 1259700
ANNUAL DIRECT 0 8 M COST' $40,000 $91,400 6153.600
' Ind i r e c t opera t ing costs, such as deprec iat ion. insurance, taxes. and general and a d m i n i s t r a t i v e cos ts a r e n o t fncluded.
4-17
0
- 160 -
e - m = 160- 0" -
System Throughput, gpm
F i g u r e 4-4. Number of Chemical Feed Systems
S e n s i t i v i t y o f Rapid-Mix Tank N e u t r a l i z a t i o n Cap i ta l Cost t o t h e
G - 5 40-
20 - 0
.. e - -
I ~~~
i o 160 200 300 400 f System Throughput, gpm
F i g u r e 4-5. Number of Chemlcal Feed Systems
S e n s i t i v i t y of Rapid-Mix Tank N e u t r a l i z a t i o n Operating Cost t o t h e
4-18
The s e n s i t i v i t i e s of c a p i t a l and opera t i ng cos ts t o c a u s t i c dosage are shown i n
F igures 4-6 and 4-7. The curves i n these f i g u r e s c l e a r l y i l l u s t r a t e t h e impor-
tance o f chemical dosage t o t h e c o s t s o f a rapid-mix tank n e u t r a l i z a t i o n system.
Cap i ta l cos ts a re approx imate ly 65 percent h ighe r f o r a 500 gpm system than a 50
gpm system. w h i l e t h e c o s t s associated w i t h t h e r a t e o f chemical use inc rease i n
d i r e c t p ropor t i on t o t h e inc rease i n system size. Therefore, t h e l a r g e r t h e
throughput o f a n e u t r a l i z a t i o n system. t h e l a r g e r t h e f r a c t i o n of i t s o v e r a l l
c o s t t h a t i s determined by chemical dosage ra te . The t o t a l c a p i t a l requirement
i s a f f e c t e d by t h e r a t e of chemical usage because of t h e i n c l u s i o n o f chemical
i nven to ry cos t . Annual ope ra t i ng cos ts a r e af fected because of increased
chemical consumption,
& - l i n e Neut r a l i z a t i o n . The conceptual design f o r i n - l i n e n e u t r a l i z a t i o n was
i l l u s t r a t e d p rev ious l y i n F igu re 4-3. I n t h i s system, a reagent a c i d or base i s
added upstream o f a s t a t i c mixer. The major equipment inc luded i n e s t i m a t i n g t h e
caD i ta l cos ts a re :
1 - i n - l i n e s t a t i c mixer;
2 - chemical feed tanks ( f i b e r g l a s s - r e i n f o r c e d p l a s t i c ) ;
2 - c e n t r i f u g a l pumps f o r system d ischarge (1 spare);
2 - a c i d meter ing pumps w i t h A l l o y 20 i n t e r n a l s (1 spare);
2 - c a u s t i c meter ing pumps w i t h s t a i n l e s s s t e e l i n t e r n a l s (1 spare);
1 - pH c o n t r o l system ( 2 t ransmi t te rs . 1 opera t i ng probe, 1 spare probe); and
1 - f low i n d i c a t o r .
The est imated c a p i t a l cos ts f o r i n - l i n e n e u t r a l i z a t i o n systems w i t h throughputs
of 50, 250, and 500 gpm a re shown i n Table 4-7. These c o s t s a re f o r two-feed
systems w i t h a c a u s t i c dosage of 0.5 ga1/1000 ga l .
u n i t cos ts a re presented i n Appendix E. The est imated annual ope ra t i ng and
maintenance c o s t s f o r these systems a re presented i n Table 4-8.
f o r rap id-mix tank n e u t r a l i z a t i o n , t h e inc rease i n t o t a l p l a n t investment (TPI)
w i t h i nc reas ing system throughput was found t o be less dramatic than t h e increase
i n t o t a l c a p i t a l requirement (TCR), 45 percent as opposed t o 95 percent. Th is I s
again due t o t h e inc rease i n t h e c o s t o f i nven to ry c a p i t a l . as was expla ined i n
d e t a i l i n t he r a p i d - m i x tank d iscuss ion. Likewise, t h e increase i n ope ra t i ng and
maintenance c o s t w i t h system throughput r e s u l t s p r i m a r i l y from t h e l a r g e r annual
chemicals consumption.
De ta i l ed equipment l i s t s and
As was t h e case
4-19
280
240
$ 220
2 200 -
Caustic Dose Rate (ga1/1000 gal) -
g 180 --- 180 S G E S 140 $!ul '5 s 120 X= = t 100 a 'Z 80
- 60
40
20
0
- m
m
50 100 200 300 400 500
System Throughput, gpm
F i g u r e 4-6. Dosage
S e n s i t i v i t y of Rapid-Mix Tank N e u t r a l i z a t i o n Cap i ta l Cost t o Caust ic
'" 2 400-
Caustic Dose Rate (gal/lOOO gal) 2i
n a -
50 100 200 300 400 500
System Throughput, gpm
F i g u r e 4-7. Maintenance Cost t o Caust ic Dosage
S e n s i t i v i t y o f Rapid-Mix Tank N e u t r a l i z a t i o n Operating and
4-20
Table 4-7
TOTAL CAPITAL .COST ESTIMATE FOR IN-LINE NEUTRALIZATION (two chemical feed systems - 0.5 ga1/1000 ga l l ons )
System Throughput, gpm: 50
D i r e c t Process and O f f s i t e C a o i t d - 1$5ts1
I n - l i n e mixer Chemical Feed Tanks (2) Discharge Pumps (2) Acid Feed Pumps (2) Caust ic Feed Pumps (2) pH Contro l System Flow I n d i c a t o r On-site
$1,200 4 t 800 4,800 5,400 5,300 4,200 1,300
5 A X ! D i r e c t Process Costs 32,000
O f f - s i t e c o s t s AAQQ To ta l D i r e c t Cap i ta l Cost 36,800 Engineer ing and Home O f f i c e Fees (10%) 3,700 P r o j e c t Contingency (209%) 7,400
TOTAL PLANT COST 50,300
Allowance for Funds Dur ing Construct ion 0 TOTAL PLANT INVESTMENT 50,300
I nven to ry Cap i ta l 1,700
TOTAL CAPITAL REQUIREMENT $55,600
Process Contingency (5%) m
Preproduct ion cos ts 3,200
I n i t i a l Chemicals Charge 400
- 2 2 2
2.500 7,100 70200 5.500 5.300 4,200 1,300
49M 40,000
49M. 46,000 4,600 9,200 2&!Q 62,100
0 62,100 7,400 8.700 3
3
4,200 10,000 8,600 5,500 5,400 4,200 1,300 M 47,000
_LL(Lp
549100 5,400 11,000 2Lz!x! 73.500
0 73.500 12,000 17,000
3AQ.Q $80.000 $106,100
' I ns ta l l a t i o n , on -s i t e f a c i l i t i e s , and o f f - s i t e f a c i l i t i e s cos ts have been factored i n t o t h e d i r e c t c a p i t a l costs. See Appendix E f o r a d e t a i l e d breakdown o f actua l purchase, i n s t a l l a t i o n . and o t h e r costs.
4 -21
Table 4-8
ESTIMATED OPERATING AN0 MAINTENANCE COST FOR IN-LINE NEUTRALIZATION ( two chemical feed systems - 0.5 ga1/1000 ga l lons)
System Throughput. gpm: - Operating Labor @ $15.25/hr Maintenance Labor Maintenance M a t e r i a l s Admin is t ra t i ve 8 Support Labor
ANNUAL FIXED o a M COST
F Operat ing Labor 8 $15.25/hr Maintenance Labor Maintenance M a t e r i a l s Admin is t ra t i ve 8 Support Labor
Cons umabl es: 66 Be S u l f u r i c @ $0.62/gal 50% Caust ic @ $1.16/gallon E l e c t r i c i t y 8 $0.04/kWh
ANNUAL VARIABLE o a M COST
ANNUAL DIRECT o a M COST^
50
$11,000 700
1,000 -3mQ
16,200
5,800 400 5 00
1,900
5 00 9,900
_;tmn
22,300
$3 8,5 00
250500
$14,000 $18,000 800 1.000
1,300 1,500 _ 4 9 a P L d Q Q
20,700 26,200
7 I 800 9.700 450 500 700 800
2,500 3,100
2.600 5.300 50.000 99,000 _IrllLp4rdzlzI
67,750 123,000
$88,450 $149,200
' Ind i rect operat ing costs, such as depreciat ion. insurance, taxes, and general and a d m i n i s t r a t i v e costs a r e . n o t included.
4-22
Figures 4-8 and 4-9 compare t h e c a p i t a l and opera t i ng costs. respec t i ve l y , f o r
i n - l i n e n e u t r a l i z a t i o n systems having one o r two chemical feed systems.
F igu re 4-8, t h e t o t a l c a p i t a l requirement f o r a one-feed system i s shown t o be
25-35 percent lower than t h a t f o r a two-feed system o f t h e same s ize. The annual
d i r e c t o p e r a t i n g and maintenance c o s t s f o r a one-feed system a re shown, i n F igu re
4-9. t o be approximately 5 percent lower than those f o r s i m i l a r l y s ized two-feed
systems.
I n
Figures 4-10 and 4-11 i l l u s t r a t e t h e s e n s l t i v i t i e s o f i n - l i n e n e u t r a l i z a t i o n
cos ts t o c a u s t i c dosage.
of h i g h e r dosages increases d r a m a t i c a l l y as system s i z e i s increased. Th is
occurs because chemical cos ts increase i n p r o p o r t i o n t o increases i n system size,
w h i l e d i r e c t c a p i t a l and o t h e r o p e r a t i n g c o s t s a r e much l e s s s e n s i t i v e t o system
s i z e w i t h i n t h e throughput ranges presented.
t o t a l c a p i t a l c o s t i s magnif ied by t h e f a c t t h a t f o r these r e l a t i v e l y smal l
systems. c o s t s f o r i nven to ry c a p i t a l a t t h e h ighe r dosage r a t e s exceeds t h e
purchased equipment costs.
c o s t i s magnif ied by t h e f a c t t h a t chemical consumption i s t h e s i n g l e l a r g e s t
c o n t r i b u t o r t o t h i s cost . except a t very low dosages.
As was observed f o r rapid-mix tank systems, t h e e f f e c t
The e f f e c t o f chemical dosage on
Likewise, t h e e f f e c t of dosage on annual ope ra t i ng
SDeci 2- i ons - Ne r i i n a Waste
Treatment o f t h i s stream may r e q u i r e s u b s t a n t i a l m o d i f i c a t i o n t o t h e design b a s i s
f o r which c o s t s were estimated. The systems descr ibed above p e r t a i n p r i m a r i l y t o
a p p l i c a t i o n s where low t o moderate c a u s t i c dosages a re requ i red (e.g., 0.02 t o 2
ga1/1000 ga l ) .
i n d i c a t i n g cont inuous operat ion.
chemical c l e a n i n g waste r e q u i r e s much h i g h e r c a u s t i c dosages, and i s performed
over a p e r i o d of a few hours once every two t o f i v e years p e r b o i l e r .
t h e i n t e r m i t t e n t na tu re o f t h i s stream, i n c u r r i n g t h e c a p i t a l and annual
o p e r a t i n g c o s t s of a dedicated t reatment system may n o t be warranted.
instances, u t i l i t i e s employ c o n t r a c t o r s f o r b o i l e r c l e a n i n g and t h e c o s t of
n e u t r a l i z a t i o n i s inc luded i n t h e c o n t r a c t fee. I n o the r instances, temporary
equipment i s i n s t a l l e d f o r i n - l i n e n e u t r a l i z a t i o n of h y d r o c h l o r i c a c i d b o i l e r
c l e a n i n g waste.
f o r most o f t h e n e u t r a l i z a t i o n cost .
as a f u n c t i o n o f t h e volume o f b o i l e r chemical c lean ing waste t r e a t e d over a
range o f dosages from 5 t o 80 ga1/1000 gal . Based on data c o l l e c t e d from p l a n t
surveys, t h i s range was determined t o be a p p l i c a b l e t o n e u t r a l i z a t i o n of hydro-
c h l o r i c ac id b o i l e r chemical c l e a n i n g waste.
I n add i t i on , o p e r a t i n g c o s t s were presented on an annual bas is
N e u t r a l i z a t i o n of h y d r o c h l o r i c a c i d b o i l e r
Because of
I n many
I n t h i s app l i ca t i on , t h e c o s t of t h e c a u s t i c requ i red accounts
F igu re 4-12 i l l u s t r a t e s t h e c o s t of c a u s t i c
4-23
140 - e m - 120-
- - B
100-
- -- C Y I - ! i g 80- ': 2 - z s - m - One Chemical Feed System
60- - ._ 0
40;
20-
- m - - -
0 50 100 200 300 400
F i g u r e 4-8. Chemical Feed Systems
S e n s i t i v i t y o f In -L ine N e u t r a l i z a t i o n C a p i t a l Cost t o t h e Number o f
,
500
50 100. 200 300 400
System Throughput, gpm 0
F i g u r e 4-9. t o t h e Number of Chemical Feed Systems
S e n s i t i v i t y o f In -L ine N e u t r a l i z a t i o n Operating and Maintenance Cost
4-24
I I __. J
180 - 160 - 140 - 120 -
- - Caustic Dose Rate (gal11000 gal)
- -
40 - 20 - 0 ,
- - 50 100 200 300 400 500
System Throughput, gpm
F i g u r e 4-10. S e n s i t i v i t y of In -L ine N e u t r a l i z a t i o n Cap i ta l Cost t o Caust ic Dosage
S e n s i t i v i t y o f In -L ine N e u t r a l i z a t i o n Operating and Maintenance
4-25
15 I
14 - 13- 12 - 11 - 10 - 9- 8- 7 -
6-
Caustic Dose Rate (ga111000 gal)
10 30 50 70 90 110
Boiler Volume. Thousand Gallons
0
F i g u r e 4-12. N e u t r a l i z a t i o n as a Funct ion o f B o i l e r Volume
Caust ic Cost for Hydrochlor ic Acid B o i l e r Chemical Cleaning Waste
4-26
- N e u t r a l i z a t i o n i s used e i t h e r t o produce an e f f l u e n t s u i t a b l e f o r d ischarge (pH
6-91 or t o p revent c l a s s i f i c a t i o n o f a waste as RCRA hazardous because o f t h e pH
l i m i t s de f ined f o r c o r r o s i v i t y . Adjustment o f pH can r e s u l t i n t h e p r e c i p i t a t i o n
of d i sso l ved ions, thereby r e q u i r i n g t h e a d d i t i o n of sedimentation, f i l t r a t i o n ,
o r o the r s o l i d s separa t i on s teps p r i o r t o discharge.
For s i m i l a r l y s i zed systems c o n t a i n i n g t h e same number o f chemical feed systems
and opera t i ng a t equ iva len t chemical dosages, i n - l i n e n e u t r a l i z a t i o n i s l e s s
expensive than rapid-mix tank n e u t r a l i z a t i o n . The t o t a l c a p i t a l requirement
(TCR) f o r i n - l i n e systems i s approximately 70 percent o f t h e TCR f o r s i m i l a r l y -
s i zed rapid-mix tank systems; annual ope ra t i ng cos ts f o r i n - l i n e n e u t r a l i z a t i o n
a re approximately 95 percent of those f o r rapid-mix tank systems.
Although comparably s i z e d i n - l i n e systems a r e l e s s expensive, s i t e - s p e c i f i c and
s t ream-spec i f i c f a c t o r s may r e q u i r e t h a t t h e more f l e x i b l e rapid-mix tank
n e u t r a l i z a t i o n be employed. The rapid-mix tank system prov ides t h e volume
necessary f o r s e l f - n e u t r a l i z a t i o n t h a t can be ob ta ined by m ix ing a c i d i c and bas i c
streams ( i .e. , deminera l i zer regenerant streams from s t r o n g a c i d and s t rong base
i o n exchangers). I n add i t ion , rapid-mix systems can be operated i n a f i l l and
draw mode f o r use w i t h wastes produced i n batch operat ions, and e f f l u e n t pH can
be more e a s i l y c o n t r o l l e d because o f t h e system r e t e n t i o n t ime.
IMPOUNDMENTS AND TANKS
Impoundments and tanks a r e used for a v a r i e t y o f purposes i n low volume waste
management. An impoundment, as def ined i n t h i s manual, i s cons t ruc ted o f ear then
ma te r ia l s . It may be l i n e d w i t h low pe rmeab i l i t y s o i l s or f l e x i b l e membrane
l i n e r s . The impoundments a r e cons t ruc ted by us ing excavated m a t e r i a l t o form
dikes. Tanks i n t h i s manual a r e assumed t o meet t h e RCRA d e f i n i t i o n of tanks,
i.e., they a r e cons t ruc ted o f non-earthen m a t e r i a l s (concrete. s tee l , o r
f i b e r g l a s s re in fo rced p l a s t i c ) and p rov ide t h e i r own s t r u c t u r a l support.
Impoundments a r e canmonly used f o r h o l d i n g wastewater ( e i t h e r be fore o r a f t e r
t rea tmen t ) as p a r t of a t rea tment process ( f l o w equa l i za t i on . sedimentation, and
coponding). o r for f i n a l d isposa l (evapora t ion ponds and coponding). - A l l of t h e low volume waste streams i d e n t i f i e d i n F igu re 4-1 may r e q u i r e s to rage
i n a tank o r impoundment du r ing one o r more stages o f t reatment. The t rea tment
4-27
processes of coponding, i n c i n e r a t i o n , n e u t r a l i z a t i o n . physical /chemical
t reatment, evaporation, and sedimentat ion a l l r e q u i r e e i t h e r a tank o r an
impoundment.
addressed i n t h i s manual.
Tab le 4-9 p resents t h e use o f impoundments f o r wastes t h a t a r e
Tab le 4-9
LOW VOLUME WASTES STORED I N TANKS OR IMPOUNDMENTS
Low Volume W e
Coal p i l e r u n o f f
Sof tener s1 udge
F l o o r and yard d r a i n s
Demi n e r a l i z e r regene r a n t
B o i l e r blowdown
F i r e s i d e c l e a n i n g waste
B o i l e r chemical c lean ing waste
Coo l ing tower sludge
Treatment b r i n e
Trea ted water
Use o f I m p d m e n t
sedimentation, coponding
coponding
storage, coponding
storage, equa l i za t i on , coponding
storage, coponding
storage, coponding. evapora t ion
storage, coponding, evapora t ion
coponding
evapora t ion
s to rage
Jreatment Effect iveness
Impoundaents and tanks a re used i n t rea tment s teps f o r e q u a l i z i n g flows, evapc-
r a t i n g wastewater, coponding low volume w i t h h i g h volume wastes. and as sedimen-
t a t i o n bas ins f o r coal p i l e runo f f . Storage a p p l i c a t i o n s a re n o t discussed i n
terms o f t rea tment e f fec t i veness i n t h i s manual. However, t h e use o f
impoundments and tanks f o r t r e a t i n g low volume wastes a re discussed i n t h e
f o l 1 owing appl i c a t ions:
a Equa l i za t i on ;
a Evaporation;
a Coponding; and
a Sedimentation.
i z a t i o n . A c i d i c and a l k a l i n e demine ra l i ze r regenerant wastes can be f low-
and-concentrat ion-equal i z e d i n tanks, t h u s avo id ing pH extremes and c l a s s i f i c a -
t i o n as a RCRA t reatment. The bed r i n s e s can be c o l l e c t e d and mixed i n an
a g i t a t e d vessel . The purpose o f t h e m ix ing i s t o produce a non-corrosive (RCRA
non-hazardous) waste stream w i t h a pH between 2 and 12.5. Since regenera t ion i s
4-28
a batch process, a c i d i c and bas ic wastes a re produced d u r i n g each process ing
cyc le .
can be combined, p r o v i d i n g n e u t r a l i z a t i o n w i t h o u t chemical add i t i on . The stream
may then be routed t o f u r t h e r t reatment.
t h e b o i l e r chemical c lean ing wastes and f i r e s i d e c l e a n i n g wastes p r i o r t o
physical /chemical t rea tment t o improve t rea tment e f fec t i veness .
By p roper l y s i z i n g t h e e q u a l i z a t i o n vessel, c a t i o n i c and a n i o n i c wastes
Equa l i za t i on may a l s o be prov ided f o r
m o r a t i o n .
aqueous wastes.
amounts of l i q u i d s .
vapor compression evaporators and reverse osmosis systems generate h igh
concent ra t ion , lower volume waste streams. The concent ra ted waste b r i n e s f rom
these recovery processes can be sent t o evapora t ion ponds.
I n a r i d reg ions of t h e country, evapora t ion i s used f o r d isposa l o f
Evapora t ion ponds a r e used t o dispose of l a r g e and sma l le r
If maximum recovery and r e c y c l i n g of water i s p rac t i ced ,
The evapora t ion r a t e i s dependent on t h e surface area o f t h e pond, t h e s a l i n i t y
of t h e pond water. and c l i m a t o l o g i c a l in f luences (temperature, humidi ty.
p r e v a i l i n g wind d i r e c t i o n and speed, e t c . ) .
predominately i n reg ions w i t h 30 or more inches p e r year o f n e t evaporat ion.
Th is corresponds t o a processing r a t e of about 1.5 gpm per acre.
impoundments a r e g e n e r a l l y shal low, s ince t h e evapora t ive capac i t y i s su r face
area dependent. S u f f i c i e n t depth i s p rov ided i n t h e design t o c o n t r o l f l ow
surges as they occur, t o a l l ow f o r accumulat ion of sediment, and t o p rov ide
freeboard f o r h igh winds.
F igu re 4-13 shows t h e annual n e t
' evapora t ion across t h e c o n t i n e n t a l U.S. Evaporat ion ponds a re found
These
CODOndinS.
c u r r e n t l y exempt f rom RCRA hazardous c l a s s i f i c a t i o n (see Sect ion 3 ) ( 2 3 ) . If discharges occur from t h e ponds, t h e water q u a l i t y must meet NPDES requirements
f o r s p e c i f i c c o n s t i t u e n t s .
A c t (CWA), Bes t A v a i l a b l e Cont ro l Technology (BACT) must be used t o c o n t r o l t h e
p o l l u t a n t s o f concern (normal ly pH, suspended s o l i d s , i r o n , copper, and o i l and
grease).
f a c i l i t i e s (5 ) . requ i red t rea tmen t l e v e l .
shown t o be as e f f e c t i v e as t h e BACT technology.
is t h e s p e c i f i e d BACT f o r waters ide b o i l e r c lean ing wastes, w i t h e f f l u e n t l e v e l s
o f 1 mg/L f o r i r o n and copper.
coponded, it may be necessary t o per fo rm an equivalency demonstrat ion t o o b t a i n
t h e NPDES permi t .
Low volume wastes which a re coponded w i t h h i g h volume wastes a r e
A d d i t i o n a l l y , under t h e p r o v i s i o n s of t h e Clean Water
The CWA a1 lows t h e demonstrat ion of e q u i v a l e n t t rea tment i n e x i s t i n g
I n general, each waste stream has a s p e c i f i c BACT which s e t s t h e
For most of t h e low volume wastes, coponding has been
Lime o r c a u s t i c p r e c i p i t a t i o n
When b o i l e r chemical c lean ing wastes a r e
4-29
P
w 0
F i g u r e 4-13. Annual Net Evaporation i n t h e United States ( inches) (u8)
Three p l a n t s which dispose of spent b o i l e r chemical c l e a n i n g waste s o l u t i o n s i n
s l i g h t l y a l k a l i n e ash ponds were sampled (see Appendix A, P l a n t s I, J , and P I .
One p l a n t t r e a t s an ammoniated EDTA c lean ing s o l u t i o n i n a c losed- loop pond.
Th is p l a n t has s t a t e approval for disposal based on u l t r a v i o l e t degradat ion of
t h e EDTA and subsequent p r e c i p i t a t i o n of t h e i r o n and copper. Table 4-10 pre-
sents analyses of t h e pond water before and one week a f t e r c lean ing w i t h EDTA a t
t h i s s i t e . The d i l u t i o n i n t h i s pond was approximately 1500:lr t h i s r e s u l t s i n
an a d d i t i o n o f about 5.5 mg/L o f i r o n and less than 0.5 mg/L o f copper t o t h e ash
pond when b o i l e r chemical c lean ing waste i s introduced. The i r o n l e v e l measured
one week a f t e r a d d i t i o n of t h e b o i l e r chemical c lean ing waste was 4.8 mg/L, w h i l e
p r i o r t o adding b o i l e r chemical c lean ing waste t o t h e pond, i r o n l e v e l s of 2.2
mg/L were measured. Copper increased from 0.01 t o 0.18 mg/L. Since t h i s pond
water i s reused i n combined FGD-fly ash scrubbers, it i s poss ib le t h a t t h e normal
background l e v e l of i r o n i s a r e s u l t o f l each ing from t h e ash.
A second p l a n t uses c i t r i c acid, which i s discharged t o t h e ash pond. Table 4-11 presents t h e analyses o f t h e ash pond water f o r t h i s p lan t , p r i o r t o and a f t e r
a d d i t i o n o f t h e c i t r a t e b o i l e r chemical c lean ing waste. A t t h i s s i t e , e f f l u e n t
from t h e pond showed an e leva ted i r o n l e v e l two days a f t e r b o i l e r c lean ing waste
was introduced. Subsequent samples showed reduced i r o n l e v e l s . Th i s i n d i c a t e s
tha t , f o r t h i s case, a hold-up of about f o u r days i s requ i red f o r t h e pond
e f f l u e n t t o be reduced below one mg/L. The r a t i o o f pond volume t o b o i l e r
c l e a n i n g waste volume was approximately 500:l a t t h i s p l a n t .
concen t ra t i on of t h e b o i l e r chemical c lean ing waste, t h i s should have r e s u l t e d i n
an ash pond concen t ra t i on o f approximately 16 mg/L immediately a f t e r a d d i t i o n o f
t h e c l e a n i n g s o l u t i o n . A t t h e t ime of sampling, t h e u t i l i t y d i d n o t have an i r o n
o r copper discharge requirement; however, t h e pe rm i t was r e c e n t l y renewed w i t h an
i r o n and copper l i m i t of 1.0 mg/L f o r discharge. With t h e c u r r e n t b o i l e r
c lean ing procedures ( i .e. , d ischarge of c i t r a t e waste t o t h e ash pond) ash pond
water would n o t meet these discharge c r i t e r i a u n t i l f o u r days a f t e r i n t r o d u c t i o n
o f t h e b o i l e r c l e a n i n g waste.
Based on t h e i r o n
The t h i r d s i t e us ing coponding as t rea tmen t o f b o i l e r c lean ing wastes had p r e v i -
ous ly demonstrated t h e e f fec t i veness of us ing t h e i r ash ponds t o t r e a t ammonium
bromate and h y d r o c h l o r i c a c i d washwaters ( 3 ) . success fu l coponding f i e l d demonstrations, they have rece ived pe rm i t s f o r t h e i r
n ine p l a n t s t o use coponding f o r BCCW treatment.
f o l l o w s :
Based on t h e i r l a b o r a t o r y and
The p e r m i t requirements a re as
4-3 1
Table 4-10
METAL CONCENTRATIONS I N EDTA POND SAMPLES (mg/L)
w n t a l Analv s i s
Aluminum Antimony Arsenic Barium R e r y l l ium Boron Cadmium Calcium Chranium Cobal t Copper I r o n Lead Magnesium Manganese Mercury Molybdenum N i c k e l Pot ass i um Selenium S i l i c o n S i l v e r Sodium Thal 1 i um Vanadium Zinc
DH ( u n i t s )
NA- n o t analyzed
Pond Before EDTA D r a i n
24 0.29
<0.002 0.18
(0.01 170
450 0.054
0.037 0.17 0.01 2.2
NA 4590
34 0.0002 2.3 0.35
(0.05
19
420
NA
0.071
(0.09 0.69 0.46
NA
Pond A f t e r EDTA D r a i n
24 (0.2 (0.002 0.3
(0.01 177
460 0.046
0.3 0.13 0.18 4.8
(0.004 4270
32 0.0003 2.3 0.31
1 0 . 5 0.062
20
390 0.014
(0.9 0.52 0.41
7.6
4-32
Table 4-11
METAL CONCENTRATIONS I N CITRATE POND SAMPLES (mg/L)
Elemental A n w
A1 um i num A n t i m n y Arsenic Barium Bery l1 ium Boron Cadmium Calcium Chromi urn Cobal t Copper I m n Lead Magnesium Manganese Mercury Molybdenum N i c k e l Potassium Selenium S i l i c o n S i l v e r Sodium T h a l l ium Vanadium Zinc
B e f o r e w 0.54 0.12 <0.002 0.07 <0.001 8.5 <0.002
Large ash pond volumes p r o v i d i n g p o t e n t i a l d i l u t i o n r a t i o s of 1OO:l;
Wel l -def ined shal low ash d e l t a near t h e ash pond i n f l u e n t ;
Ash pond pH o f no l e s s than 6.5 p r i o r t o metal c l e a n i n g waste add i t ion ;
Four days r e t e n t i o n t i m e i n t h e ash pond a f t e r t h e f i r s t a d d i t i o n o f h y d r o c h l o r i c a c i d c l e a n i n g waste w i t h t h e e f f l u e n t f low v i r - t u a l l y stopped;
B o i l e r volume l e s s than 86,000 ga l lons ;
Chemicals f o r c l e a n i n g t o i n c l u d e one or more of t h e f o l l o w i n g :
a) Copper removal step- Sodium bromate (NaBrO ) ammonium carbonate and ammonium hydrox i d& NH40H;
H y d r o c h l o r i c acid, HC1; ammonium b i f l u o r i d e p r o p r i e t a r y i n h i b i t o r s ;
b ) I r o n removal step- NH4HF2; and
Maximum d i l u t i o n of 6:l w i t h r i v e r water before wastes e n t e r ash pond; and
A f t e r t rea tment of metal c l e a n i n g wastes, if m o n i t o r i n g of pond e f f l u e n t s as requ i red by p e r m i t r e v e a l s discharges o u t s i d e t h e l i m i t of t h e permit. t h e p l a n t w i l l c l o s e t h e pond and conduct such in-pond sampling as necessary t o determine t h e cause o f noncompliance, take a p p r o p r i a t e c o r r e c t i v e act ions, and f i l e a r e p o r t w i t h EPA i n c l u d i n g a l l p e r t i n e n t data.
I n t h e e l g h t years s ince t h e p e r m i t was issued. t h e u t i l i t y has had no problems
i n meeting t h e p e r m i t requirements u s i n g ammonium bromate and h y d r o c h l o r i c a c i d
i n b o i l e r c lean ings a t i t s o l d e r s t a t i o n s (hydroxyacet ic- formic a c i d i s used a t
t h e newer c o a l - f i r e d u n i t s ) . Table 4-12 presents analyses performed under t h i s
p r o j e c t f o r t h e most recent h y d r o c h l o r i c a c i d c l e a n i n g a t one p lan t .
analyses show t h e ash pond composi t ion p r i o r t o a b o i l e r d r a i n and f o r t h e f i r s t
f o u r days a f t e r e f f l u e n t flow was r e i n s t i t u t e d (which was four days a f t e r t h e
b o i l e r c lean ing) .
observed fo r copper.
1 mg/L.
The
As can be seen, o n l y a s l i g h t concent ra t ion increase i s
None o f t h e e f f l u e n t water has i r o n and copper l e v e l s above
Table 4-13 presents t h e r e s u l t s of l a b o r a t o r y experiments conducted t o eval uate
coponding o f b o i l e r c l e a n i n g washwaters w i t h f l y ash. Four types of f l y ash were
used as reagents. Each o f t h e ashes had a d i f f e r e n t e q u i l i b r i u m pH, rang ing from
about 4 t o 11. d l l u t i o n wi th an ash s l u r r y . Th is amount o f d i l u t i o n i s a conserva t ive simula-
t i o n o f what occurs i n an a c t u a l ash pond, because t h e d i l u t i o n a t a p l a n t i s
The experiments cons is ted of m i x i n g t h e waste streams i n a 1OO:l
4-3 4
Table 4-12
METAL CONCENTRATIONS I N ASH POND DISCHARGE SAMPLES (mg/L)
Elemental Anal v s i s
Aluminum Antimony Arsenic Barium Bery l 11 um Boron Cadmium Calcium Chromium Chranium V I Cobal t Copper I r o n Lead Magnesium Manganese Mercury Molybdenum N icke l Potassium Sodi um Selenium S i l i c o n Si1 ver T h a l l i um Vanadium 21 nc
'Ash s l u r r i e s w i thou t waste add i t ion , s t i r r e d f o r 24 hours *The waste i s d f l u t e d 1OO:l when added t o t h e ash s l u r r y 3A f te r be ing s t i r r e d w i t h t h e i n d i c a t e d ash s l u r r y fo r 24 hours
4-36
t y p i c a l l y h igher .
experiments u n t i l t h e pH remained s tab le. Shown on each t a b l e a r e t h e s t a r t i n g
concen t ra t i ons of i r o n and copper a f t e r t h e i n i t i a l waste add i t i on , and t h e
values measured a f t e r 24 hours o f mixing.
minimal e f f e c t on t h e metal concentrat ions, occas iona l l y r e s u l t i n g i n f i n a l
concen t ra t i ons h ighe r than those measured a t t h e s t a r t o f t h e t e s t .
a l k a l i n e ashes success fu l l y reduced i r o n and copper concentrat ions i n a l l o f t h e
wastes below t h e d e t e c t i o n l i m i t . Although t h i s i s n o t c o n s i s t e n t w j t h
e q u i l i b r i u m s o l u b i l i t y c a l c u l a t i o n s , it i s n o t s u r p r i s i n g . E q u i l i b r i u m
computations do n o t account f o r t h e extremely h i g h s o l i d s l o a d i n g i n t h e ash
coponding experiments. The ash p a r t i c l e s p rov ide considerable sur face area f o r
heterogeneous reac t i ons (such as adsorpt ion and c o p r e c i p i t a t i o n ) and c a t a l y t i c
reac t i ons t o occur on t h e ash surface.
A d d i t i o n a l ash was added du r ing t h e f i r s t few hours of t h e
As expected, t h e a c i d i c ash had a
The two
Based on these l i m i t e d f i e l d and l a b o r a t o r y resu l t s , coponding of b o i l e r c lean ing
s o l u t i o n s i n a l k a l i n e ash ponds can s u c c e s s f u l l y reduce t h e d i sso l ved metal
concen t ra t i ons i n t h e waste. The h i g h l y a l k a l i n e ash ponds were successful i n
t r e a t i n g a l l b o i l e r chemical c l e a n i n g wastes tested. Neutra l ash ponds have been
shown t o be e f f e c t i v e f o r a c i d c lean ing wastes ( h y d r o c h l o r i c a c i d ) b u t l e s s
successful i n s h o r t t i m e pe r iods w i t h chelated c lean ing wastes (EDTA and c i t r i c
ac id ) .
$edimentatPm.
drainage ( i .e., from a 10-year storm event) . These impoundments a r e designed t o
p rov ide adequate residence t i m e f o r sedimentat ion of suspended s o l i d s .
case o f a c i d i c coal p i l e runoff . i n - l i n e n e u t r a l i z a t i o n can be prov ided p r i o r t o
discharge. S o l i d s t h a t c o l l e c t i n t h e impoundment may be p e r i o d i c a l l y re turned
t o t h e coal p i l e or disposed o f i n a l a n d f i l l . No a n a l y t i c a l r e s u l t s were
obta ined on sedimentat ion e f fec t i veness of impoundments. a l though v i s u a l
i n s p e c t i o n o f several dry impoundments revealed s u b s t a n t i a l accumulations of coal
f ines. Back-up t reatment f o r suspended s o l i d s removal (e.g., c l a r i f i c a t i o n ) , can
be prov ided if high r a i n f a l l pe r iods reduce t h e ef fect iveness o f sedimentat ion
basins.
Coal p i l e runoff impoundments a re used t o c o l l e c t and h o l d
I n t h e
v Impoundments a r e requ i red f o r a wide range of c a p a c i t i e s and waste composit ions.
Table 4-14 presents s i x general types of impoundments and tanks t o demonstrate
t h e o p t i o n s a v a i l a b l e t o u t i l i t i e s when fo rmu la t i ng a low volume waste t reatment
4-37
scheme.
f o r which each may be used.
A lso shown a r e t h e range of volumes f o r each impoundment and t h e streams
Table 4-14
TANK AND IMPOUNDMENT CONCEPTUAL DESIGNS
ImDoundment Desc r io t i on
Clay l i n e d
S ing le f l e x i b l e membrane l i n e r
Double f l e x i b l e membrane l i n e r (meets RCRA Standards)
Concrete tank
Steel t anks
F iberg lass Reinforced P l a s t i c (FRP) tanks
Volume Range - 0.1 - 100
0.1 - 100
0.1 - 100
0.001 - 4
0.005 - 0.1
0.001 - 0.02
Low Yo1 ume Waste
coal p i l e runoff, i ntermedi ate-qual i t y water, h i g h - q u a l i t y water, d ischarge water
a l l streams
f i r e s i d e waste, b o i l e r s i d e waste, VCE b r i n e
in termediate-qual i t y water, b o i l e r chemical c lean ing waste, h i g h - q u a l i t y water
b o i l e r chemical c lean ing waste
deminera l i zer regeneran t
Numerous design v a r i a t i o n s may be associated w i t h each s p e c i f i c i n s t a l l a t i o n o f
these impoundments and tanks. The reader i s r e f e r r e d t o an EPRI Research r e p o r t
e n t i t l e d "Manual f o r Upgrading E x i s t i n g Disposal F a c i l i t i e s " (24) f o r d e t a i l e d
i n fo rma t ion on impoundment design and l i n e r se lec t i on . A few o f t h e p e r t i n e n t
f a c t o r s concern ing t h e impoundments inc luded i n Table 4-14 are discussed here.
w. Local s i l t y - c l a y s o i l s a re w ide ly used f o r impoundment cons t ruc t i on . The
pe rmeab i l i t y c o e f f i c i e n t s o f l o c a l c l a y s can be q u i t e low (lo-' cm/sec) i f
p roper l y compacted.
b e n t o n i t e can be used as an amendment t o l o c a l s o i l s f o r t h e l i n e r . Sodium
m o n t m o r i l l o n i t e i s t h e favored benton i te because it e x h i b i t s a h igh degree o f
swe l l ing , impermeabi l i ty . and h igh a t tenua t ing capac i ty f o r c a t i o n s and heavy
metals. Major canmercial ben ton i te deposi ts a r e l oca ted i n Wyoming.
If l o c a l s o i l s do n o t con ta in adequate l e v e l s o f c lays,
4-38
Clay l i n e r s can deform w i t h e a r t h se t t l emen t and movement. If these movements
exceed t h e p l a s t i c i t y o f t h e c lay, t h e l i n e r i n t e g r i t y can be breached, a l l ow ing
leakage. Clays should be kept wet a t a l l t imes t o p revent d r y i n g and subsequent
s h r i n k i n g and crack ing. Advantages o f c l a y l i n e r s i n c l u d e s imple i n s t a l l a t i o n
procedures. low permeab i l i t y , and long se rv i ce l i f e . Disadvantages i nc lude poor
weathering and chemical res is tance, and h igh t r a n s p o r t a t i o n c o s t s i f n o t l o c a l l y
ava i l ab le . A d d i t i o n a l l y , c l a y - l i n e d impoundments a r e n o t acceptable f o r s torage
o f wastes c l a s s i f i e d as RCRA hazardous.
F l e x i b l e Membrane I i n e r s (FML) . If proper l y se lec ted and i n s t a l l e d f o r s p e c i f i c app l i ca t i ons , these m a t e r i a l s o f f e r p r o t e c t i o n aga ins t permeation o f wastes. The
use of one or two l i n e r s i s dependent on t h e type o f waste i n t h e impoundment. A
double l i n e r design w i t h groundwater mon i to r i ng w e l l s and a leachate c o l l e c t i o n
system i s a requirement f o r RCRA hazardous wastes.
Two general types o f f l e x i b l e membrane m a t e r i a l s may be used i n t h e design of low
volume waste impoundments. These m a t e r i a l s a r e e i t h e r r e s i s t a n t o r non- res is tan t
t o ox idan ts such as ozone and u l t r a v i o l e t l i g h t . Among t h e r e s i s t a n t membranes
a r e ch lo rosu l fona ted po lye thy lene (Hypalon 1 and h igh dens i ty po lye thy lene
(HDPE). Examples of non - res i s tan t membranes a r e p o l y v i n y l c h l o r i d e (PVC) and low
dens i ty po lye thy lene (LDPE), The non- res is tan t membranes a r e covered w i t h a
l a y e r o f d i r t or c l a y a f t e r i n s t a l l a t i o n t o p revent UV degradation.
s e l e c t i o n o f a p a r t i c u l a r type of membrane i s dependent on t h e c o m p a t i b i l i t y of
t h e l i n e r w i t h i t s in tended serv ice . Many references f o r d isposal f a c i l i t y
design and upgrading p rov ide comprehensive check1 i s t s o f impor tan t f a c t o r s t o
consider i n l i n e r s e l e c t i o n (m).
The
Costs of l i n e r m a t e r i a l s a re dependent on t h e chemical fo rmula t ion and th i ckness
and s i z e o f t h e i n s t a l l a t i o n . Several common l i n e r m a t e r i a l s and u n i t p r i c e s are
Dresented i n Table 4-15.
4-3 9
Table 4-15
COSTS OF FLEXIBLE MEMBRANE LINERS - - W c h a s e Cost ( $ / f t 2 )
Hypalon 36 0.57
PVC 20 0.15 PVC 30 0.21
PV c 40 0.40 HDPE 40 0.24 HOPE 60 0.32
L;Qocrete. Steel . and FIT. Smaller impoundments a re o f t e n cons t ruc ted o f these
r i g i d m a t e r i a l s t o conform t o a v a i l a b l e space l i m t t a t i o n s , min imize sa fe ty
concerns, and meet regu la to ry requirements. Concrete bas ins have h ighe r volume
t o sur face area r a t i o s than ear then impoundments because of v e r t i c a l wa l l s .
waste temperatures j u s t i f y t h e use o f s t e e l tankage t o s t o r e b o i l e r chemical
c lean ing wastes. F ibe rg lass re in fo rced p l a s t i c tanks a re genera l l y used f o r
s t o r i n g small waste volumes o r f o r s to rage o f c o r r o s i v e wastes. I n t h e same
manner as l i n e r s e l e c t i o n v a r i e s f o r impoundments, t h e s e l e c t i o n o f a s p e c i f i c
r i g i d m a t e r i a l i s dependent on t h e waste and t h e purpose of t he tank.
C o m p a t i b i l i t y b e b e e n t h e m a t e r i a l s o f cons t ruc t i on and u t i l i t y wastes should be
determined p r i o r t o c o n s t r u c t i o n and use.
High
v The design data presented i n Table 4-1 were used t o d e f i n e t h e range o f capac-
i t i e s needed f o r each of t h e s l x conceptual impoundments. The methodology used
t o determine t h e d l r e c t i n s t a l l e d c o s t o f impoundments i s presented i n Appendix
E. ,
Impoundment c o s t s were developed fo r a capac i t y range from 0.1 t o 100 m i l l i o n
ga l l ons (0.3 t o 300 acre f e e t ) . Clay. s i n g l e f l e x i b l e membrane l i n e r , and double
l i n e d impoundments were costed. Concrete, s t e e l , and FRP tanks were cos ted over
slze ranges o f 0.001 t o 5 , 0.001 t o 0.1, and 0.001 t o 0.02 m i l l i o n gal lons,
respec t i ve l y . Cost curves i l l u s t r a t i n g t h e t o t a l c a p i t a l requirement f o r va r ious
impoundment and tank con f igu ra t i ons as a f u n c t i o n o f volume are presented on a
c o s t per g a l l o n bas is r a t h e r than i n terms o f t o t a l c a p i t a l requirement. Th is
4-40
approach was used because o f t h e f o u r o r d e r o f magnitude v a r i a t i o n i n s izes.
Th is a l s o makes t h e c o s t s e a s i e r t o apply t o user-speci f ic a p p l i c a t i o n s and bes t
i l l u s t r a t e s t h e f a c t t h a t as t h e volume increases, t h e c o s t p e r volume approaches
a cons tan t value. T h i s constant va lue a l l ows t h e user t o es t ima te t h e c o s t of
impoundments l a r g e r than those presented here. F i n a l l y , t h i s approach makes it
e a s i e r t o a l l o c a t e t h e incremental c o s t of a p o r t i o n of t h e volume o f an
impoundment t o a s p e c i f i c low volume waste stream.
Clav L i n e r. depths ( 5 and 15 f e e t ) over a volume range of four orders of magnitude us ing
several p r i c e s f o r d e l i v e r e d c lay.
s u i t a b l e for l i n i n g i s a v a i l a b l e on s i t e ; therefore, t h e on ly c o s t assoc iated
w i t h t h e c l a y was f o r e a r t h moving. The t h r e e remaining cases assumed an FOB
c o s t for b e n t o n i t e of $100 p e r t o n w i t h low, moderate, and h i g h t r a n s p o r t a t i o n
charges ($10, 50, and 100 p e r ton ) . Near ly a l l o f t h e l i ne r -g rade b e n t o n i t e
o r i g i n a t e s i n Wyoming, a l though t h e r e a r e l a r g e undeveloped resources i n Texas
and Georgia. Shipp ing cos ts t o some l o c a t i o n s can equal o r exceed t h e raw
m a t e r i a l c o s t of $100 p e r ton. Regional d i s t r i b u t o r s should be contacted t o
determine d e l i v e r e d c o s t s i n bu l k q u a n t i t i e s . The n a t u r a l l y occu r r i ng s o i l i s
assumed t o be d i sked and compacted i n t h e same manner as imported ben ton l te .
Other s p e c i f i c design cons ide ra t i ons f o r these ponds inc luded wa l l s lopes of 3:1,
a l i n e r t h i c k n e s s o f 18 inches ( b e n t o n i t e o r n a t i v e c l a y ) , a 2 - foo t freeboard
height , no l eacha te c o l l e c t i o n system, and no groundwater mon i to r i ng we l l s .
These design fea tu res a r e presented l a t e r and t h e c o s t s can be added t o these
est imates as des i red.
The c o s t s of c l a y - l i n e d impoundments were determined a t two water
One case assumed t h a t a s i l t y - c l a y s o i l
Table 4-16 presents est imated c a p i t a l cos ts f o r a vo lumet r i c s e r i e s of
impoundments w i t h a 5-foot l i q u i d depth and a d e l i v e r e d c l a y c o s t o f $110 per
ton.
impoundment. For t h e sma l les t impoundment (100,000 ga l l ons ) , t h e shal low depth
i s s l i g h t l y cheaper p e r g a l l o n than t h e deeper impoundment.
increases, t h e deeper impoundment becomes s i g n i f i c a n t l y more economical. Th i s i s
due t o a reduced acreage requirement ( 9 1 versus 26 acres f o r 100 m i l l i o n g a l l o n s
a t 5 and 15 f o o t water depths, r e s p e c t i v e l y ) and concurrent reduct ions i n t h e
amount o f c l a y requ i red f o r t h e l i n e r . Large, shal low impoundments a re t y p i c a l l y
used f o r evaporat ion s ince sur face area d i r e c t l y a f f e c t s evaporat ive capac i t y
(gpm evaporated p e r acre).
volumes of l i q u i d s and t o dispose o f ash and sludges, and a r e costed l a t e r i n
t h i s manual. The est imated t o t a l c a p i t a l requirements f w 5 and 15 f o o t deep
Table 4-17 presents t h e same t ype of in format ion f o r a 15 f o o t deep
As t h e s i z e
The deeper impoundments a r e used t o s t o r e l a r g e r
4-41
Table 4-16
ESTIMATED TOTAL CAPITAL REQUIREMENT FOR CLAY-LINE0 IMPOUNDMENTS ( L i q u i d Depth = 5 ft, D e l i v e r e d Clay Cost = $110 per t o n )
Impoundment Capacity. Gal lons: uL!NQ 1.000.000 10.000.00Q 100,000.000
D i r e c t Pr0ci-s and O f f - s i t e C a p i t a l
.€Q.sb
Land S i t e P r e p a r a t i o n L i n e r - B e n t o n i t e On-s i te Costs
D i r e c t Process Cost
O f f - s i t e Costs
To ta l D i r e c t C a p i t a l
Engineer ing and Home Of f i ce Fees P r o j e c t Contingency Process Contingency
TOTAL PLANT COST (TPC)
Allowance f o r Funds Dur ing Const ruc t ion
TOTAL PLANT INVESTMENT (TPI)
Preproduct ion Costs
TOTAL CAPITAL REQUIREMENT (TCR)
TCR, $/GALLON
$1,200 2,300 7.800 1,700
13,000
1,300
14,300
1,400 2,900
720
19,320
0
19,320
1,100
$20,420
$0.204
$5.100 9,800
31,000 6,100
52,000
5,200
57,200
59700 11,000 2,900
76,800
0
76.800
2,500
$79,300
$0.079
$3 7 9 000 71.000
210,000 36,000
350,000
35,000
385,000
39,000 78,000 19,000
525,000
___
0
525,000
14,000
$539,000
$0.054
$330.000 630,000
1.800,OOO 270.000
3 I 100,000
310,000
3t410,OOO
340,000 670,000 170,000
4,520,000
0
4,520,000
110,000
$4,630,000
$0.047
4-42
Table 4-17
ESTIMATED TOTAL CAPITAL REQUIREMENT FOR CLAY-LINED IMPOUNDMENTS ( L i q u i d Depth = 15 feet , D e l i v e r e d Clay Cost = $110 per t o n )
Impoundment Capacity. Gal lons:
D i r e c t Process and O f f - s i t e C a p i t a l
.c.Q.sh
Land S i t e Prepara t ion L i n e r - B e n t o n i t e On-si te Costs
D i r e c t Process Cost
O f f - s i t e Costs
T o t a l D i r e c t C a p i t a l
Engineer ing and Home O f f i c e Fees P r o j e c t Contingency Process Contingency
c l a y - l i n e d impoundments as a f u n c t i o n o f volume a r e shown i n F igures 4-14 and
4-15, r e s p e c t i v e l y . These f i g u r e s a l s o show t h e dependence of t h e u n i t c a p i t a l
requirement on t h e d e l i v e r e d c o s t of c l a y over a range of $0 t o $200 p e r ton.
both depths, t h e c o s t s of t h e impoundments cons t ruc ted w i t h $200 p e r t o n
d e l i v e r e d c l a y a r e double t h e p r i c e o f an impoundment b u i l t w i t h l o c a l l y
o c c u r r i n g m a t e r i a l .
A t
F l e x i b l e Me mbrane L i ' ne r (FMU . F l e x i b l e membrane-lined impoundments were a l s o
costed a t 5 and 15 f o o t l i q u i d depths. Costs were determined f o r volumes ranging
from 0.1 t o 100 m i l l i o n gal lons.
i nc luded w a l l s lopes of 3 : l . and a 2 - foo t f reeboard he igh t . Three c lasses of
impoundments were costed; a s i n g l e 1 i n e r impoundment w i t h o u t groundwater monitor-
i n g w e l l s o r l eacha te c o l l e c t i o n , a s i n g l e l i n e r impoundment w i t h w e l l s and a
leachate c o l l e c t i o n system, and a double l i n e r system w i t h w e l l s and leachate
c o l l e c t i o n . The t h i r d impoundment meets RCRA requirements f o r s t o r i n g hazardous
wastes.
i nc luded i n t h e TCR. It i s b a s i c a l l y independent o f t h e impoundment s i ze . An
est imated c o s t f o r a RCRA P a r t B perm i t i s about $200,000 (28) .
S p e c i f i c design cons ide ra t i ons f o r these ponds
The c o s t of o b t a i n i n g a pe rm i t f o r t h i s t h i r d impoundment was n o t
Table 4-18 p resen ts est imated c a p i t a l c o s t s f o r t h e vo lumet r i c s e r i e s of
impoundments a t t h e 5- foot depth f o r t h e double-1 i ned RCRA approved Impoundment.
Table 4-19 presents t h e same in fo rma t ion f o r t h e 15 f o o t deep impoundment.
F igures 4-16 and 4-17 present t h i s i n f o r m a t i o n g r a p h i c a l l y and a l s o show t h e
dependence o f c a p i t a l c o s t s on capac i t y f o r t h e s i n g l e l i n e r system w i t h and
w i thou t groundwater m o n i t o r i n g w e l l s and leachate c o l l e c t i o n systems. For t h e
sma l les t s i z e impoundment (100,000 ga l l ons ) , t h e c o s t o f a bas i c s i n g l e FML
system w i t h o u t w e l l s and leachate c o l l e c t i o n i s approximately 3 1 percent o f t h e
c o s t f o r a double FML system w i t h w e l l s and leacha te c o l l e c t i o n . S m a l l FML
impoundments w i t h w e l l s and leacha te c o l l e c t i o n c o s t approximately 10 t imes l e s s
than s i m i l a r l y s i z e d double FML systems. For l a r g e r capaci ty impoundments. cos ts
f o r these two s i n g l e FML systems a r e approximately 45 and 76 percent,
respec t i ve l y , o f those f o r double FML systems.
For both s i n g l e and double- l ined impoundments hav ing m o n i t o r i n g w e l l s and leach-
a t e c o l l e c t i o n , Figures 4-16 and 4-17 i l l u s t r a t e a very l a r g e u n i t c o s t i n t h e
sma l le r s i z e range.
w e l l s and l e a c h a t e c o l l e c t i o n c o s t s on t h e t o t a l cost .
cos ts remain r e l a t i v e l y cons tan t regard less of impoundment volume, t h e u n i t c o s t
( d o l l a r s p e r g a l l o n ) f o r designs t h a t i nc lude mon i to r i ng and leacha te c o l l e c t i o n
Th is i s t h e r e s u l t of t h e l a r g e c o n t r i b u t i o n o f m o n i t o r i n g
Because mon i to r i ng w e l l
4-44
0.40
0 : 1 I 1 I
- m 2 0.30
l
e c
0.40 - 0.35 -
0 , I 1 I
0.1 0.2 0.5 1 2 5 10 20 50 100
Pond Volume, Million Gallons
F i g u r e 4-15. Clay-Lined Impoundments w i t h a 15-Foot L i q u i d Depth
Effect of De l ivered Clay Cost on t h e C a p i t a l Requirement for
4-45
__ Table 4-18
ESTIMATED TOTAL CAPITAL REQUIREMENT FOR FLEXIBLE MEMBRANE-LINED IMPOUNDMENTS ( L i q u i d Depth = 5 ft. Double FML w i t h Mon i to r i ng Wel ls and Leachate C o l l e c t i o n )
Impoundment Capacity, Gallons: l!xLQQQ
P i r e c t Process and O f f - s i t e CaDital
GQZb
Land $720 S i t e Prepara t ion 1,400 Under1 i n e r - G e o t e x t i l e 1,300 Liners-36 m i l Hypalon/20 m i l PVC 6,400 Groundwater Moni tor i nq 9,700 - Leachate C o l l e c t i o n On-si te Costs
D i r e c t Process Cost
O f f - s i t e Costs
To ta l D i r e c t Cap i ta l
Engineer ing and Home Of f i ce Fees P r o j e c t Cont 1 ngency Process Contingency
ESTIMATED TOTAL CAPITAL REQUIREMENT FOR FLEXIBLE MEMBRANE-LINED IMPOUNDMENTS ( L i q u i d Depth = 15 ft.. Oouble FML w i t h M o n i t o r i n g Wel ls and leachate C o l l e c t i o n )
Impoundment Capaci ty, Gal lons: Lcxu2QQ
D i r e c t Process and O f f - s i t e C a p i t a l
€Q&s
Land $880 S i t e Prepara t ion 1,700 U n d e r l i n e r - G e o t e x t i l e 1,500 L i n e r s - 36 m i l Hypalon/20 m i l PVC 7,700 Groundwater M o n i t o r i n g 9,700 Leachate C o l l e c t i o n 11,000 On-s i te Costs 4,800
D i r e c t Process Cost 37,000
Of f -s i te Costs
T o t a l D i r e c t C a p i t a l
3 I 700
40,700
Engineer ing and Home O f f i c e Fees 4,100 P r o j e c t Contingency 8,200 Process Contingency 2,000
TOTAL PLANT COST (TPC) 55,280
Allowance f o r Funds Dur ing Const ruc t ion 0
TOTAL PLANT INVESTMENT (TPI) 55,280
Preproduct ion Costs 2,300
TOTAL CAPITAL REQUIREMENT (TCR) $57,580
TCR, $/GALLON $0.58
k000.000
$2,800 5,300 4,500
23,000 9,700
25,000 9,500
80,000
8,000
88,000
8,700 17,000 4,300
117,800
0
117,800
4,000
$121,800
$0.12
10,000.000
$15,000 28,000 22,000
110,000 9,700
110,000 36.000
330,000
33,000
363,000
37.000 73.000 18,000
491,700
0
100,000.000
$120,000 220,000 170,000 840,000
9.700 840,000 230,000
2,400,000
240,000
2,640,000
270,000 530,000 130,000
3,599,700
0
491,700
13,000
3,599,700
90,000
$504,700 $3,689,700
$0.05 $0.037
4-47
o'60 I
0.50 - - m : i! E 0.40 - 2 F 0.30 - a m
._ 3
- = a 2 0.20 - - m I e
0.10 -
0
' "9"w"llE i:vd:ndwater monitoring
(with groundwater monitoring and leachate collection)
I I I I
and leachate collection)
._ Single FML 3 F 0.30
U (with groundwater monitoring and leachate collection)
1 0.1 0.2 0.5 1 2 5 10 20 50
Pond Volume, Million Gallons
3
F i g u r e 4-16. Membrane-Lined Impoundments w i t h a Five-Foot L iqu id Depth
Ef fec t of Various L i n e r Systems on t h e Cost o f F l e x i b l e
0
Pond Volume, Million Gallons
F igure 4-17. Membrane-Lined Impoundments w i t h a 15-Foot L iqu id Depth
E f f e c t o f Various L i n e r Systems on t h e Cost o f F l e x i b l e
4-48
decreases r a p i d l y w i t h i nc reas ing volume. Above t h e 10 m i l l i o n g a l l o n l e v e l , t he
u n i t capac i t y c o s t i s e s s e n t i a l l y cons tan t f o r t h e t h r e e f l e x i b l e membrane l i n e r
designs i l l u s t r a t e d . As w i t h t h e c lay - l i ned impoundments, t h e smal les t s i zes a re
more econanical a t t h e 5-fOOt depth.
econanical a t volumes g rea te r than about 300,000 ga l lons .
The deeper impoundments become more
E L g j d Wall Tanks. R ig id -wa l l tank c o s t s a re presented f o r t h r e e m a t e r i a l types:
f i b e r g l a s s r e i n f o r c e d p l a s t i c (FRP), concrete, and epoxy- l ined carbon s t e e l .
Vary ing s i z e ranges were examined based on the assumed a p p l i c a t i o n s of each t ype
o f tank.
FRP tanks were costed over a s i z e range o f 1,000 t o 20,000 gal lons, r e f l e c t i n g
the volume requ i red as an e q u a l i z a t i o n tank f o r deminera l i zer regenerant. An
a g i t a t o r i s inc luded i n t h e system cost. Table 4-20 presents a summary of t h e
estimated t o t a l c a p i t a l requirement f o r these tanks.
Costs f o r epoxy-l ined s t e e l tanks were determined over a s i z e range of 5,000 t o
100,000 gal lons.
o rgan ic b o i l e r c lean ing wastes, such as EDTA and c i t r i c acid. p r i o r t o i nc ine ra -
t i o n . A l l o f these cos ts a r e f o r f i e l d e rec ted tanks. One t o four a g i t a t o r s a re
inc luded i n t h e design, depending upon t h e tank s ize .
est imated t o t a l c a p i t a l requirement f o r these tanks.
Th is s i z e range was se lec ted based on temporary s torage o f
Table 4-21 presents t h e
Concrete tank cos ts (no roo fs ) a re presented i n Table 4-22 f o r a s i z e range o f
one thousand t o f i v e m i l l i o n gal lons.
maximum depth of 20 feet.
w i t h a b i tuminous mois tu re b a r r i e r ,
non-hazardous waste l i q u i d s be fore and a f t e r processing.
used as a decant s t r u c t u r e f o r b r i n e s l u r r i e s and f o r sumps.
These tanks a r e a cub ica l design up t o a
Wal ls and s labs a r e 1-foot t h i c k r e i n f o r c e d concre te
These tanks a re used p r i m a r i l y f o r h o l d i n g
This design can a l s o be
F igu re 4-18 i l l u s t r a t e s t h e u n i t c a p i t a l cos ts f o r a l l t h r e e types of r i g i d w a l l
tanks as a func t i on o f volume. Note t h a t f o r each mater ia l . t h e h ighes t volume
p l o t t e d represents t h e p o i n t where t h e u n i t c a p i t a l cos t i s n e a r l y cons tan t w i t h
i nc reas ing volume.
w i thou t s i g n i f i c a n t e r ro r , a l though cos ts f o r systems s i g n i f i c a n t l y l a r g e r than
those presented should be ob ta ined from c o n t r a c t o r s and vendors.
Some e x t r a p o l a t i o n of cos ts f o r l a r g e r tanks can be done
ODeratina and Maintenance Costs . fo r impoundments and tanks a re n o t presented here.
De ta i l ed annual opera t ing and maintenance cos ts
These c o s t s a re h i g h l y
4-49
Table 4-20
ESTIMATED TOTAL CAPITAL REQUIREMENT FOR AGITATED FRP TANKS
Tank Capacity. Gallons:
D l r e c t Process and O f f - s i t e C a p i t a l
€QSb
Ho ld ing Tank A g i t a t o r On-s i te Costs
D i r e c t Process Costs
O f f - s i t e Costs
T o t a l D i r e c t C a p i t a l
Engineer ing and Home O f f i c e Fees P r o j e c t Contingency Process Contfngency
TOTAL PLANT COST (TPC)
Allowance f o r Funds Dur ing Const ruc t ion
TOTAL PLANT INVESTMENT (TPI)
Preproduct ion Costs
TOTAL CAPITAL REQUIREMENT (TCR)
TCR, $/GALLON
$3,200 $5,600 4.600 9,800 1,600 2,900
9.400 18,300
900 1,800
10,000 20.000
1,000 2,000 2,000 4,000
5 00 1,000
13,800 27,100
0 0
13.800 27,100
800 900
$14,600 $28.000
$15.0 $5.6
L!LQ!L?
$9,000 11,000 3,000
23,000
2,300
25,000
2,500 5,000 1,200
34,000
0
34,000
1,000
$35,000
$3.5
.2!UQQ
$17,000 13,000 3 200
33,000
3,300
36,000
3,600 7.200 1,800
48,900
0
48,900
1,300
$50,200
$2.5
4-50
Table 4-21
ESTIMATED TOTAL CAPITAL REQUIREMENT FOR AGITATED EPOXY-LINED STEEL TANKS
Tank Capacity, Gal lons:
D i r e c t Process and O f f - s i t e C a D i t a l
GQSLs
Ho ld ing Tank A g i t a t o r On-si te Costs
D i r e c t Process Costs
O f f - s i t e Costs
T o t a l D i r e c t Cap i ta l
Engineer ing and Home O f f i c e Fees P r o j e c t Cont i ngency Process Contingency
TOTAL PLANT COST (TPC)
Allowance f o r Funds Dur ing Cons t ruc t i on
TOTAL PLANT INVESTMENT (TPI)
Preproduc t ion Costs
TOTAL CAPITAL REQUIREMENT (TCR)
TCR, $/GALLON
$8,700 $10,000 9,800 11,000 2,700 2,900
219000 249000
2.100 2.400
23,000 26,000
2,300 2,600 4,600 5,200 1,200 1,300
31,400 35.400
0 0
31,400 359400
1,000 1 t 100
$32,400 $36,500
$6.5 $3.6
ULMa
$19,000 26,000 3,200
48,000
4.800
53,000
5,300 11.000 2,700
72,000
0
72,000
1,400
$73,400
$1.5
lsnssn
$37,000 53,000 3,500
94,000
9,400
103.000
10,000 20,000 5,100
138,000
0
138,000
2,100
$140,100
$1.4
4-51
Table 4-22
ESTIMATED TOTAL CAPITAL REQUIREMENT FOR CONCRETE TANKS
Tank Capacity, Gal lons:
D i r e c t Process and O f f - s i t e C-
c!asLs
Hold ing Tank On-slte Costs
D i r e c t Process Costs
O f f - s i t e Costs
To ta l D i r e c t Cap i ta l
Engineer ing and Home Of f ice Fees P r o j e c t Contingency Process Contingency
TOTAL PLANT COST (TPC)
Allowance f o r Funds During Construct ion
TOTAL PLANT INVESTMENT (TPI)
Preproduct ion Costs
TOTAL CAPITAL REQUIREMENT (TCR)
TCR, $/GALLON
$6,800 $29.000 400 1,700
7,200 31,000
700 3,100
7.900 34,100
800 3.400 1,600 6,800 400 1.700
10.700 45,700
0 0
10,700 45,700
900 1,700
$11,600 $47,400
$1.16 $0.47
J,LQwJm
$130,000 2,100
130,000
13,000
1439000
14,000 29,000 7.100
195.200
0
1959200
5.400
$200,600
$0.20
5.000.000
$430,000 2.600
430,000
43,000
473,000
48,000 96,000 24,000
643 3 600
0
643 t 600
17.000
$660.600
$0.13
4-52
13 -
12 -
Epoxylined Carbon Steel (with agitator)
2
concrete (no agitator) 1 - 1
. . 0.001 0.005 0.01 0.05 0 1 05 i 5
Tank Volume. Million Gallons
F igure 4-18. Estimated T o t a l C a p i t a l Requirement for FRP. Steel and Concrete Tanks
4-53
var iab le . depending n o t on l y on t h e system con f igu ra t i on , b u t a l s o on t h e
s p e c i f i c app l i ca t i on . For example, i f s o l i d s a re deposi ted i n t h e impoundment,
they can be p e r i o d i c a l l y removed ( f o r an increase i n ope ra t i ng expense) or t h e
impoundment can be designed t o s t o r e t h e s o l i d s over t h e opera t i ng l i f e of t h e
p l a n t ( f o r an increase i n c a p i t a l expense). The f a i l u r e frequency f o r l i n e r s and
d i ke w a l l s a l s o a f f e c t s ObM cos ts . Many o f these major c o s t s a r e dependent on
t h e i n i t i a l design of t h e impoundment, t h e q u a l i t y c o n t r o l exerc ised d u r i n g
c o n s t r u c t i o n and i n s t a l l a t i o n , and t h e u l t i m a t e type of se rv i ce f o r t h e
i mp ou ndmen t . To prov ide an es t ima te of annual opera t ing costs, t h e EPRI Technical Assessment
Guide (U) methodology was used as discussed i n t h e Approach d iscuss ion o f t h i s
sec t i on (Table 4-3). Other than opera t i ng labor , which was est imated as 1 hour
da i l y , t h e o t h e r annual ope ra t i ng c o s t components were expressed as a percentage
o f t h e t o t a l c a p i t a l requirement. Mon i to r i ng w e l l s were assumed t o r e q u i r e t h r e e
manhours pe r sample a long w i t h a $500 sample ana lys i s fee. Using t h i s approach,
t h e r e l a t i o n s h i p between opera t i ng cos ts and t o t a l c a p i t a l requirement i s nea r l y
l i n e a r f o r each impoundment and tank con f igu ra t i on . Therefore. es t imated annual
ope ra t i ng c o s t s can be obta ined by m u l t i p l y i n g t h e t o t a l c a p i t a l requirement
determined from t h e prev ious graphs by s i x percent and adding a cons tan t of
$89000.
on ly an es t imate based almost e n t i r e l y on t h e f a c t o r s i n Table 4-3 (ObM c o s t
methodology).
i n ope ra t i ng c o s t s c a l c u l a t e d by t h i s method. This c o s t can be est imated as $130
per year pe r 1,000 ga l l ons of t ank volume (0.5 HP/1000 ga l l ons a t $O.O4/kWh).
However, it i s impor tan t t o remember t h a t t h i s ope ra t i ng c o s t represents
E l e c t r i c a l cos ts f o r those tanks us ing a g i t a t o r s a r e n o t inc luded
Two p a r t i c u l a r a l t e r n a t i v e impoundment app l i ca t i ons , coponding low volume wastes
i n ash ponds and t h e use of a g i t a t o r s i n impoundments. may be o f spec ia l i n t e r e s t
and were eval uated separate ly .
-. The c o s t s of d ispos ing low volume wastes i n an ash pond can be
es t imated by determin ing t h e u n i t c o s t o f t h e ash pond and t h e incremental
a d d i t i o n a l capac i t y requ i red due t o coponding. Using t h e approach p rev ious l y
developed f o r impoundments, t h e cos ts of ash ponds were est imated over a s i z e
range of 100 t o 10,000 acre-feet, p r o v i d i n g f o r 30 year ope ra t i on o f both small
and l a r g e p l a n t s (100 t o 1,000 W ) .
w i t h l o c a l l y a v a i l a b l e clay, c lay purchased and shipped a t $110 pe r ton, a s i n g l e
f l e x i b l e membrane, and a double f l e x i b l e membrane.
F igu re 4-19 shows cos ts f o r ash ponds l i n e d
The x-ax is represents t h e
4-54
.- On-site clay .- On-site clay
0.1 0.2 0.5 1 2 5 10
Ash Pond Volume, Thousand Acre-Ft
F i g u r e 4-19. Estimated Tota l Cap i ta l Requirement for Ponding So l id Wastes
4-55
t o t a l pond volume i n acre-feet, w h i l e t h e est imated t o t a l c a p i t a l requirement
(y-ax is) i s expressed i n d o l l a r s per cub ic yard o f so l i ds . These u n i t s were
chosen t o correspond w i t h those cmmonly used f o r measurement of sludge and ash
pond volumes.
phys ica l parameters l i s t e d p rev ious l y f o r o t h e r impoundments. As can be seen,
t h e u n i t cos ts approach constant values f o r t h e l a r g e r s i zed ponds.
The ponds a r e assumed t o have a 25- foot working depth and t h e same
To determine t h e volume reduc t i on r e s u l t i n g from coponding low volume wastes, it i s necessary t o es t ima te t h e s o l i d s generat ing p o t e n t i a l of each stream. For
example, coal p i l e runoff conta ins suspended s o l i d s which w i l l s e t t l e and reduce
t h e amount of space a v a i l a b l e f o r f l y ash.
d i sso l ved metals which w i l l p r e c i p i t a t e as hydroxide sludges, occupying space i n
t h e pond.
one m i l l i o n g a l l o n s of each l o w volume waste stream (assuming a sludge b u l k
dens i t y o f 75 pounds per cub ic f o o t ) . For several waste streams these est imates
should be confirmed w i t h ac tua l measurements, i f ava i l ab le . Since t h e ash pond
i s s i zed f o r 30 year operat ion, t h e s o l i d s generated by each stream over t h e l i f e
of t h e pond should be c a l c u l a t e d t o determine t h e volume requ i red f o r t h e low
volume wastes.
B o i l e r c lean ing wastes con ta in
Table 4-23 presents est imated values of t h e sludge volume generated by
S t a r t i n g w i th a known ash pond volume (expressed i n ac re fee t ) , t h e u n i t c o s t p e r
c u b i c yard o f d isposal volume can be obta ined from F igu re 4-19. For example, t h e
u n i t c o s t o f coponding i n a 1000 a c r e foo t s i n g l e FML pond i s $2.00 per cub ic
yard, as shown on F igu re 4-19.
produced by low volume wastes a l l ows t h e c o s t of coponding t o be determined.
t h e annual coal p i l e r u n o f f f l o w i s 100 m i l l i o n gal lons, over a 30 year per iod,
t h e pond capac i t y would be reduced by t h e a d d i t i o n of 2400 c u b i c yards o f coal
f i n e s (as a 75 pounds per c u b i c f o o t sludge). Th i s has an equ iva len t cost, a t
62.00 p e r c u b i c yard, of 44,800.
necessary t o i n c l u d e t h e c o s t o f an equivalency demonstrat ion t o show t h a t
coponding o f f i r e s i d e and b o i l e r chemical c lean ing wastes i s equ iva len t t o bes t
a v a i l ab1 e c o n t r o l techno1 ogy.
Using Table 4-23 t o determine t h e sludge volume
I f
If ash pond water i s discharged, it may be
4-56
Table 4-23
ESTIMATED SOLIDS VOLUME FOR LOW VOLUME WASTE SLUDGES
Low Volume Waste
Coal p i l e r u n o f f
Oem i nera l i z e r regeneran t
B o i l e r blowdown
F l o o r and yard d r a i n s
F i r e s i d e waste
B o i l e r chemical c l e a n i n g waste
Water o r wastewater t rea tmen t s1 udge - th ickened
Coo l ing tower s ludge
P y r i t e s - b i tuminous - subbituminous
Suspended P o t e n t i a1 %2ludwu Prec i o i t a t es ( m u S1 udae Vol ume
200 0 0.8 c u y d / K
10 0 0.04 c u y d / K
0 0 0 c u y d / K
50 0 0.2 cu y d / K
100 500 2 c u y d / f f i
50 10,000 42 c u y d / K
15,000 0 310 c u y d / K
350,000 0 1460 cu yd/MG
- - 0.02 c u yd/yr/MW
- 10 cu yd/yr/MW - 0.1 cu y d / y r / W
Ag.iL&m. Surface f l o a t i n g mixers can be used i n con junc t i on w i t h impoundments
and concre te tanks t o equa l i ze concen t ra t i ons o f d i sso l ved and suspended s o l i d s .
A 50-HP ni ixer has an area of i n f l uence of about 16.000 square f e e t and has an
es t imated t o t a l c a p i t a l requirement of $65,000. I f mixers a re used i n a s p e c i f i c
design, t h e number r e q u i r e d i s ob ta ined by d i v i d i n g t h e impoundment su r face area
by t h e area of inf luence. Impoundments sma l le r than one- th i rd acre use sma l le r
horsepower mixers. F igu re 4-20 presents d i r e c t i n s t a l l e d c a p i t a l c o s t s f o r
f l o a t i n g a g i t a t o r s as a f u n c t i o n of impoundment sur face area. Annual ope ra t i ng
cos ts f o r e l e c t r i c i t y can be est imated by m u l t i p l y i n g t h e t o t a l horsepower by
6260 ($0.04 p e r kWh e l e c t r i c i t y c o s t ) .
approximately 7 percen t o f t h e t o t a l c a p i t a l requirement.
Maintenance and l a b o r c o s t s a r e
Process S u m m u
Impoundments and tanks a r e v i t a l components i n low volume waste s to rage and
t rea tment schemes. Almost a l l low volume wastes pass th rough an impoundment or tank i n sane stage o f t reatment. The u n i t c o s t s f o r these vesse ls range from
several d o l l a r s per g a l l o n fo r small volume r i g i d - w a l l e d tanks t o approximately
$0.02 p e r g a l l o n f o r l a r g e impoundments l i n e d w i t h l o c a l l y a v a i l a b l e c lays .
Se lec t i on o f an impoundment or t ank design w i l l depend on u n i t costs, t h e
4-51
0 : 1 , , 1 , , 1 , , , , , , , , , , , ,
0 0.2 0.4 0.6 0.8 1.0 1.2 1.4 1.6 1.8 2.0
Impoundment Surface Area, Acres
F lgure 4-20. Estimated D i r e c t I n s t a l l e d Cost f o r Impoundment Agi tators
4-58
v a r i a t i o n i n these c o s t s w i t h capaci ty. stream composit ions, and t h e planned
usage (i.e., evaporation, sedimentation, equa l i za t i on , o r storage). Costs f o r
o p e r a t i o n o f impoundments and tanks a r e p r i m a r i l y a f u n c t i o n o f t h e i r usage.
These c o s t s w i l l be based on f a c t o r s such as a g i t a t i o n and s o l i d s hand l i ng
requirements.
cos ts presented i n t h i s s e c t i o n of t h e r e p o r t a re p rov ided i n Appendix E. Th i s
procedure can be a l t e r e d t o a l l ow t h e user t o develop c o s t s f o r v a r i o u s design
mod i f i ca t i ons .
D e t a i l s o f t h e design methodology used t o develop t h e impoundment
PHYSICAL /CHEM ICAL TREATMENT
I n low v o l m e waste management, physical /chemical t rea tment systems a r e used
p r i m a r i l y f o r reduc ing and removing d i sso l ved and suspended contaminants from
aqueous streams. Although several design v a r i a t i o n s can be used t o achieve these
ob jec t i ves , those most p reva len t i n low volume waste t rea tment i nco rpo ra te pH
adjustment, p r e c i p i t a t i o n . f l o c c u l a t i o n , c l a r i f i c a t i o n , f i l t r a t i o n . and s o l i d s
concent ra t ion . T h i s combinat ion i s a t r a d i t i o n a l approach f o r t r e a t i n g waste-
water contaminated w i t h d i sso l ved metals. Other processes such as reverse
osmosis. vapor compression evaporation, e l e c t r o d i a l y s i s , etc.. a r e employed l e s s
f requen t l y f o r t h e s o l e purpose of t r e a t i n g low volume wastes i n t h e u t i l i t y
i n d u s t r y and a r e n o t considered here.
ADD1 i c a b l e Stream s
Four low volume waste streams a re o f t e n processed i n physical /chemical t rea tment
systems. They are:
8 B o i l e r chemical c lean ing waste;
e F i r e s i d e c l e a n i n g waste;
e Deminera l i zer regenerant; and
8 F l o o r and yard dra ins .
The f i r s t two streams a r e produced i n t e r m i t t e n t l y . B o i l e r chemical c leaning5 a r e
performed every two t o f i v e years. F i r e s i d e waste may be generated monthly f o r
o i l - f i r e d u n i t s and several t imes a year f o r c o a l - f i r e d u n i t s . Deminera l i zer
regenerant and d r a i n s a r e f r e q u e n t l y produced, low volume waste stroams.
4-59
Treatm e n t E f f e c t i veness
The t rea tmen t e f fect iveness o f physical /chemical systems i s dependent on t h e
composi t ion of t h e waste stream, reagent dose rates, design o f t h e system, and
o p e r a t i n g procedures. I n general, most o f t h e low volume wastes can be success-
f u l l y processed w i t h o u t d i f f i c u l t y i n a physical /chemical t reatment system.
Some o f t h e b o i l e r chemical c lean ing wastes may be d i f f i c u l t t o t r e a t and can
r e q u i r e spec ia l procedures o r m u l t i p l e passes through t h e system. F i e l d data
concerning t h e e f fec t i veness o f t r e a t i n g va r ious b o i l e r chemical c lean ing wastes
and f i r e s i d e wastes were obta ined and l a b o r a t o r y s t u d i e s were performed t o
examine t h e t rea tmen t of b o i l e r chemical c lean ing wastes.
No data were obta ined f o r t reatment o f deminera l izer regenerant o r d ra ins i n
physical /chemical systems; however, these two streams should r e q u i r e o n l y pH
adjustment and suspended s o l i d s removal t o meet e f f l u e n t requirements (d ischarge
requirements f o r these streams do n o t i nc lude i r o n and copper l i m i t s ) . O i l and
grease l i m i t s may r e q u i r e t h e use o f a phys ica l o i l removal device.
B o i l e r Chemical C1 eanina Was- , I n general, phys ica l /chemical systems c o n s i s t
o f a r e a c t i o n tank where t h e pH i s increased w i t h c a u s t i c o r l i m e , a c l a r i f i e r
and f i l t e r vessel f o r s o l i d s removal and a s o l i d s dewater ing device. The Clean
Water Ac t (CWA) requ i res t h a t these streams be t r e a t e d t o one mg/L i r o n and
copper l e v e l s . Table 4-24 l i s t s t h e waste stre.am types and t h e reduc t i on i n i r o n
and copper concen t ra t i ons achieved by t reatment a t f i v e s i t e s . As can be seen,
n o t a l l o f t h e e f f l u e n t s meet t h e one mg/L discharge c r i t e r i a .
s i t e s . t r e a t e d e f f l u e n t was h e l d i n bas ins and n o t discharged u n t i l a n a l y s i s
i n d i c a t e d successfu l t reatment.
l i m i t s . t h e e f f l u e n t was routed back through t h e t reatment system.
A t f o u r o f t h e
I f i r o n o r copper l e v e l s d i d n o t meet discharge
The f i r s t EDTA waste, even though d i l u t e d w i t h r inses, r e q c i r e d reprocess ing t o
meet t h e discharge l i m i t . Hyd roch lo r i c a c i d and hydroxyacet ic- formic a c i d wastes
were s u c c e s s f u l l y t rea ted . Combined hyd roch lo r i c a c i d and ammonium bromate waste
was s l i g h t l y above t h e l i m i t f o r i r o n a t two s i t e s and copper a t one s i t e . These
f i e l d r e s u l t s demonstrate t h e d i f f i c u l t y i n c o n s i s t e n t l y t r e a t i n g b o i l e r chemical
c l e a n i n g wastes t o one mg/L i r o n and copper l e v e l s .
4-60
Table 4-24
FIELD RESULTS OF PHYSICAL/CHEMICAL TREATMENT OF BOILER CHEMICAL CLEANING WASTES
SFtr: - A EDTA
( l i m e and c a u s t i c )
B Hydroch lo r ic a c i d ( l i m e )
F Hydroxyacet ic- fo rmic a c i d ( l i m e )
G H y d r o c h l o r i c a c i d and ammonium bromate ( l i m e )
Parameter
PH I r o n (mg/L) Copper (mg/L )
I i-on Copper Chrmium
PH
PH I r o n Copper Chromium
PH I r o n Copper Ch rom i um
Untreated
6.7
1.5
1.8
150
4140 182
6
3.8
0.9 3.6
1.5
795
1030 19 3.5
LEated
12.5 1.2 2.7
5.51 0.03 0.08 0.008
10.9 0.7 0.1 0.01
11.0 1.2 0.24 0.11
H H y d r o c h l o r i c a c i d and PH 1.5', 10.83 12.0 ammonium bromate I r o n 6960, (0.1 5.5 ( a e r a t i o n / c a u s t i c ) Copper 10.5, 325 2.4
Ch rom i um 5.7, (0.05 C0.005
'pH a f t e r f i n a l a d d i t i o n of a c i d t o c l a r i f i e d e f f l u e n t
2Hydrochlor ic a c i d composi t ion
3Ammon i um bromate compos it i o n
4-61
Table 4-25 presents t h e r e s u l t s o f l a b o r a t o r y experiments us ing physical /chemical
methods t o t r e a t b o i l e r c lean ing wastes.
t e s t s where waste samples were s t i r r e d f o r 24 hours a t a s p e c i f i e d pH. A l l f i v e
o f t h e major types of b o i l e r c lean ing waste s o l u t i o n s were t e s t e d us ing e i t h e r
l i m e o r c a u s t i c as t h e reagent t o r a i s e pH.
c i t r a t e wastes were conducted us ing sodium s u l f i d e and l i m e as reagents.
These exper iments cons is ted o f j a r
Two a d d i t i o n a l t e s t s on EDTA and
I n t r e a t i n g t h e ammonium bromate so lu t i on . copper was n o t p r e c i p i t a t e d below a
concen t ra t i on of one mg/L w i thou t d i l u t i o n .
ammonium i o n concen t ra t i on t o a l e v e l where h y d r o l y s i s o f t h e copper i o n can
occur before p r e c i p i t a t i o n begins. Th is requirement was f i r s t observed when
research i n t o t h e t rea tment mechanisms of coponding was performed ( 3 ) .
It 1s necessary t o d i l u t e t h e
Hydroch lo r i c a c i d c lean ing waste was n o t success fu l l y t r e a t e d under any condi-
t i o n s . By a d j u s t i n g t h e wastewater pH t o 12 w i t h caus t i c , i r o n l e v e l s o f 1 mg/L
were achieved; however, copper l e v e l s remained high, r e f l e c t i n g t h e complexing
power o f t h iou rea and ammonia. D i l u t i o n w i t h b o i l e r r i n s e water would be
adequate t o meet t h e i r o n l i m i t .
success fu l l y t r e a t e d by pH adjustment w i t h l i m e a t pH l e v e l s of 7 t o 10.
Hydroxyacet ic/ formic a c i d c lean ing waste was
Although both t h e i r o n and copper concent ra t ions o f t h e o rgan ic c h e l a n t c lean ing
wastes ( c i t r a t e and EDTA) were reduced s i g n i f i c a n t l y by t rea tmen t w i t h lime,
caus t ic , and s u l f i d e . one mg/L l e v e l s were n o t achieved i n t h e l a b o r a t o r y exper i -
ments. Thermodynamic data p r e d i c t t h a t i n t h e presence o f excess chelant, copper
concen t ra t i ons a re r e l a t i v e l y independent o f pH. However. t h e l a b o r a t o r y exper i -
ments d i d show s u b s t a n t i a l reduc t i ons f o r low i n i t i a l l e v e l s o f copper. Th is may
be due t o chemical processes which a r e n o t accounted f o r by t h e thermodynamic
data, such as c o p r e c i p i t a t i o n o f copper w i t h i r o n oxyhydroxide (29). A t h i g h e r
copper l e v e l s (200 mg/L i n EDTA s o l u t i o n ) , t h e reduc t i on w i t h t rea tment was
minimal.
The i r o n concen t ra t i on i n t h e c i t r a t e c lean ing waste near l y achieved t h e one mg/L
c r i t e r i a . The i r o n concen t ra t i on was reduced i n t h e experiments t o 2.3 mg/L a t
pH 12.3; t h i s may have r e s u l t e d from f e r r o u s i r o n be ing ox id i zed t o t h e f e r r i c
s t a t e and then p r e c i p i t a t e d . A l onger t rea tment p e r i o d and a e r a t i o n o f t h e waste
may have been s u f f i c i e n t t o achieve a 1 mg/L i r o n concent ra t ion .
4-62
Table 4-25
RESULTS OF LABORATORY TESTS OF PHYSICAL/CHEVICAL TREATMENT METHODS
Treatment None Lime Lime Lime Lime Caust ic Caust ic NH Br03 t Caust ic 1
4
Treatment None Lime Lime Lime
Treatment None Lime Lime
Treatment None Lime Lime
Treatment None Lime Lime Sodium S u l f i d e
I r e a t m e n t None Lime Sodium S u l f i d e
Treatment None Caust ic
Hvdroch lo r ic Ac id Cleanina Waste Comer (nia/L)
160 1.0 2,930 6.0 1,180 72 8.0 11.7 57
r2H l -cwhuu
10.0 12.0 8.0
12.0 12.0
1.5 1.1 5.2 0.5 9.3
28.7 11.6 36.9 42.e 43.2
HAF Ac id Cleanina Waste a I r o n ( m a / u Comer (ma/L) 3.7 03 0 (0.5 7.1 e. 0
<0.5 C0.5
(0.5 (0.5
9.8 C0.5 (0.5
Ammonium Bromate Cleanina Waste I r o n (ma/L) Comer (ma/L1
(0.5 120 r2H 10.6 11.0 (0.5 12.3 (0.5
1 . 4 3.4
Ammonium Bromat e D i l u t e d 1 : l O QH ) Comer (ma/L) 10.3 (0. 5 12 10.8 (0.5 c(1.5 12.2 (0.5 <0.5
C i t r i c Ac id Cleanina Waste
10.0 4,200 4 I r o n (ma/L) Coo Der (ma / L 1
11.1 12.3 12.0
140 2.3 2.3
0.7 0.8 0.14
Low CoDDer EDTA Cleanina Waste
9.7 3,200 1.7 QH I r o n (ma/L) Comer (ma/L )
12.0 62.7 12.0 544
(0.5 1.2
Hiah CoDDer EDTA Clean ina Waste QH I r o n (ma/L) &DDer (ma/L)
9.7 3,010 200 12.0 1.7 160
'The h y d r o c h l o r i c a c i d waste was mixed w i t h ammonium bromate waste and subsequent ly t r e a t e d w i t h caus t ic .
4-63
The i r o n c o n c e n t r a t i o n o f t h e t r e a t e d EDTA waste v a r i e d s i g n i f i c a n t l y w i t h t h e
t y p e of reagent used. S u l f i d e and l i m e a d d i t i o n were i n e f f e c t i v e , w h i l e c a u s t i c
a d d i t i o n s i g n i f i c a n t l y reduced i r o n l e v e l s . The EPA e f f l u e n t g u i d e l i n e s (5) conf i rm t h a t che la ted wastes a r e d i f f i c u l t t o t r e a t t o 1 mg/L l e v e l s .
suggestions such as d i l u t i o n of concentrated wastes w i t h r i n s e water and o t h e r
waste streams, ox ida t ion , s u l f i d e add i t ion , f i l t r a t i o n . and carbon adsorpt ion.
Of these, t h e most cmmon i n d u s t r y p r a c t i c e s a r e m i x i n g t h e concentrated c lean ing
waste and r inses, and f i l t r a t i o n o f t h e t r e a t e d e f f l u e n t s .
It o f f e r s
F i r e s i d e Wastes . C o a l - f i r e d b o i l e r f i r e s i d e c l e a n i n g waste i s genera l l y s i m i l a r
t o ash s l u i c i n g water i n composi t ion (1). Oi l -generated f i r e s i d e wastes c o n t a i n
severa l t r a c e meta ls a t concent ra t ions above one mg/L, no tab ly copper, i ron ,
n i c k e l . vanadium, and z inc . Most o f these meta ls have low s o l u b i l i t i e s i n t h e
hydrox ide form a t h i g h pHs (8 t o 12). Vanadium can be p r e c i p i t a t e d t o i t s lowest
c o n c e n t r a t i o n a t a n e u t r a l pH u s i n g f e r r o u s s u l f a t e (311). Several u t i l i t i e s use
t h i s procedure and s e l l t h e recovered f e r r o u s metavanadate t o s t e e l producers.
Table 4-26 presents t h e concent ra t ions o f se lec ted meta ls found i n f i r e s i d e
c l e a n i n g wastes from o i l - f i r e d u n i t s and i n t h e e f f l u e n t s from phys ica l /chemical
t reatment . I n t h r e e of t h e f o u r systems, i r o n and copper l e v e l s were reduced t o
l e s s than 1 mg/L.
ConceDtual Desian
F i g u r e 4-21 presents a conceptual design f o r convent ional phys ica l /chemical
t reatment . I n t h i s system, l i m e i s used t o a d j u s t pH. The design inc ludes a
l i m e s i l o , s laker , and s l u r r y mix tank. A smal l r e a c t i o n tank mixes t h e reagents
and t h e waste stream. A c l a r i f i e r w i t h a polymer a d d i t i o n u n i t i s used t o
p r o v i d e i n i t i a l s o l i d s separat ion. C l a r i f i e r over f low i s pH adjusted t o between
6 and 9 p r i o r t o g r a v i t y f i l t r a t i o n and discharge. C l a r i f i e r underf low i s pumped
t o a g r a v i t y th ickener ; underflow s o l i d s from t h e t h i c k e n e r a r e routed t o a
r o t a r y vacuum f i l t e r . The s o l i d waste produced i s c o l l e c t e d i n drums o r t rucks,
depending on t h e q u a n t i t y . and s e n t t o a d isposal s i t e .
Other processes and equipment may be incorpora ted i n t o phys ica l /chemical
t rea tment systems. A t one p lan t , an a d d i t i o n a l chemical feed system was used t o
add fe r rous s u l f a t e f o r vanadium removal. Other f a c i l i t i e s may use a p l a t e and
frame o r vacuum b e l t f i l t e r f o r sludge dewatering. Diatomaceous e a r t h o r o t h e r
f i l t e r a ids can a l s o be used. Several vendors market patented equipment designs
which i n c o r p o r a t e reagent mixing, f l o c c u l a t i o n , c l a r i f i c a t i o n , and sedimentation.
4-64
Table 4-26
FIELD RESULTS FOR PHYSICAL/CHEMICAL TREATMENT OF FIRESIDE WASTES (mg/L unless otherwise noted)
Site/fuel/Treatment
P l a n t A
( o i l and gas- f i red) ( c a u s t i c )
P l a n t D ( o i 1-f i red) ( f e r r o u s s u l f a t e / l ime)
P l a n t K ( o i 1 - f i red) ( c a u s t i c )
P l a n t T ( o i l - f i r e d ) ( l i m e )
'pH a f t e r f i n a l a d d i t i o n o f a c i d t o c l a r i f i e d e f f l u e n t
earameter pH ( u n i t s )
Copper I r o n
pH ( u n i t s ) Copper I r o n N icke l Vanadium Z inc
pH ( u n i t s ) Copper I r o n N icke l Vanadium
pH ( u n i t s ) Copper I r o n Vanadium Z inc
Untreated
6.5
0.12 8.6
3.3 0.63
87. 89. 180 4.3
3.9 0.33
6.5 6.8
36.
- 7.1
510 19 25
Irented 6.61 0.13 4.2
8.21 0.03 0.69 0.1 8.2 0.019
9.5 0.09 0.17 (0.003 1.9
11.2 0.014 0.27 8.8 <0.003
4-65
I
4-66
Treatnw n t Costs
The design bases f o r es t ima t ing f l ows of b o i l e r chemical c lean ing and f i r e s i d e
c lean ing wastes, deminera l i zer regenerant. and f l o o r and yard d ra ins were
presented i n Table 4-1. These flow ra tes were used t o de f ine t h e range of
t rea tment system c a p a c i t i e s f o r which c o s t s were determined.
Cap i ta l and opera t i ng and maintenance c o s t s were developed f o r t h e conceptual
design shown i n F igu re 4-21 w i t h system f low ra tes o f 50. 250, and 500 gpm. The
phys ica l /chemical t rea tment system i s assumed t o opera te e i g h t hours p e r day and
t o have an impoundment or t ank l oca ted upstream t o s t o r e low volume wastes t h a t
a r e produced cont inuously . Operat ion of t h i s system f o r d a i l y e ight -hour s h i f t s
r a t h e r than 24-hour ope ra t i on reduces l a b o r cos ts s i g n i f i c a n t l y .
The assumptions used i n c o s t i n g these systems inc lude:
0 A b o i l e r chemical c lean ing occurs annually;
0 Four f i r e s i d e washes a r e performed pe r year ( these may inc lude f i r e s i d e and a i r preheater washes);
Deminera l i zer regenerant and f l o o r and yard d r a i n s r e q u i r e a l i m e dose r a t e of 0.75 pounds pe r thousand gal lons, wh i l e b o i l e r chemical c lean ing wastes may r e q u i r e dosages as h igh as 70 pounds per thousand ga l lons ; and
underf low 1s 10 percent so l i ds , and f i l t e r cake i s 35 percent s o l i d s .
e
0 C l a r i f i e r underflow i s 3 percent suspended so l i ds , t h i ckener
Because deminera l i zer regenerant and d r a i n s con ta in very low concent ra t ions of
d isso lved and suspended so l i ds . sludge produc t lon w i l l be minimal d u r i n g most o f
t h e year.
sodes.
Sludge generat ion w i l l =cur p r i m a r i l y du r ing b o i l e r c lean ing ep i -
The equipment inc luded i n t h e c a p i t a l c o s t es t ima t ion i s as fo l l ows :
1 - l i m e feed system i n c l u d i n g a s torage s i l o , b i n a c t i v a t o r . b lower and baghouse. screw feeder, s laker , s l u r r y tank, a g i t a t o r , and feed pump w i t h spare;
2 - wastewater feed pumps (1 spare);
1 - r e a c t i o n tank w i t h a g i t a t o r ;
1 - c l a r i f i e r w i t h underf low pump;
4-67
0 1 - polymer feed system w i t h drum mixer, letdown tank w i t h a g i t a t o r .
0 1 - pH adjustment tank w i t h a g i t a t o r :
0 1 - a c i d feed system w i t h FRP tank and meter ing pump:
0 2 - g r a v i t y dual-media f i l t e r s w i t h automatic backwash c a p a b i l i t y :
0 1 - th i ckener vessel w i t h underf low pump; and
1 - r o t a r y vacuum f i l t e r system w i t h l i q u i d separa tor tank, and
meter ing pump;
conveyor b e l t .
For systems r e q u i r i n g l e s s than 200 pounds per hour o f l i m e (as i s t h e case f o r
t h e 50 gpm design), hydrated l i m e i s more econanical t o use than qu ick l ime and a
s laker .
o f t h e l o w sludge produc t ion ra te .
scraper i n drums.
The 50 gpm design a l s o does no t i nc lude a sludge conveyor b e l t because
So l i ds a re c o l l e c t e d from t h e vacuum f i l t e r
The est imated c a p i t a l cos ts f o r t h e t h r e e phys ica l /chemical t rea tment systems a r 0
presented i n Table 4-27. These cos ts show an increase o f 70 percent i n t o t a l
c a p i t a l requirement over a 10 - fo ld s i z e (gpm) d i f f e r e n t i a l , from $776.000 t o
$19320r000. systems a re shown i n Table 4-28. These cos ts increase by 36 percent over t h e
s i z e range examined. F igures 4-22 and 4-23 present p l o t s o f t h e c a p i t a l and OM
cos ts f o r these systems, respec t i ve l y .
The estlmated annual ope ra t i ng and maintenance cos ts f o r these t h r e e
v Physical/chemical t rea tment i s used t o produce e f f l u e n t q u a l i t y water f o r d is-
charge under NPDES and o the r requ i red permits. The continuous waste streams,
deminera l i zer regenerant and drains, a re e a s i l y t r e a t e d t o acceptable l eve l s .
B o i l e r chemical c lean ing and f i r e s i d e c lean ing wastes r e q u i r e h igher reagent
doses and occas iona l l y add i t i ona l processing t o meet discharge l i m i t s f o r metals.
The c a p i t a l cos ts of these systems a re o n l y moderately s i z e sens i t i ve , w i t h a
capac i ty exponent r a t i o o f about 0.4. Consequently. t o op t im ize c a p i t a l and
opera t i ng costs. it i s canmon p r a c t i c e t o s i z e a system t o process t h e average
d a i l y f low du r ing an 8-hour per iod.
can be operated i n t e r m i t t e n t l y w i thou t i n t e r r u p t i n g performance e f fec t i veness .
To ensure compl lance w i t h discharge c r i t e r i a , most p l a n t designs i nco rpo ra te
ho ld ing bas ins f o r t h e t r e a t e d water: t h i s a l lows ana lys i s p r i o r t o discharge.
The water can then be reprocessed i f it does no t meet s p e c i f i c a t i o n s .
The process equipment inc luded i n t h e design
4-68
Table 4-27
TOTAL CAPITAL REQUIREMENT FOR PHYSICAL/CHEMICAL TREATMENT
System Throughput, gpm: 5.Q
D i r e c t Process and O f f s i t e C- 1 - Lime Storage System Lime Slaker Lime S l u r r y Mix System Lime S l u r r y Feed Pump Raw Wastewater Pump Polymer Feed System Flash M ix System C l a r i f i e r C l a r i f i e r Underflow Pump pH Adjustment System G r a v i t y F i l t e r G r a v i t y Thickener Thickener Underflow Pump Rotary Vacuum F i l t e r B e l t Conveyer Ins t rumen ta t i on On-si te Costs
$30,0002
9.300 4,200 4,800 5,300 3,800
29,000 4,200 5,800
50,000 35,000
6,000 54,0002
24,000 180.000
---
---
D i r e c t Process Costs 440,000
O f f - s i t e Costs
To ta l D i r e c t Cap i ta l Cost
110,000
560,000
Engineer ing and Home Of f ice Fees (101%) 56,000
Process Contingency (5%) 28,000
TOTAL PLANT COST (TPC) 749,400
0
TOTAL PLANT INVESTMENT (TPI) 749,400
Preproduct ion cos ts 24,000 Inven to ry Cap i ta l 270
P r o j e c t Contingency (20%) 110,000
Allowance fo r Funds Dur ing Construct ion
I n i t i a l Chemicals Charge 1,100
TOTAL CAPITAL REQUIREMENT (TCR) $7 74,7 7 0
21ia
$41,000 30,000 17,000 4,200 7,200 6.100 8,000
50,000 13,000 7,500
87.000 63,000
9,200 80,000 9,300
30,000 170,000
630,000
130,000
750,000
75,000 150,000 38,000
1,025,500
0
1,025,500
31,000 1,200 7,200
$1,064,900
LaQ
$72,000 34,000 23,000 139000 8,600 7,000
13,000 63,000 13.000 8,400
97,000 84,000
9,500 100,000
9,300 30,000
210,000
800,000
140,000
930,000
93,000 190,000 47,000
1264,800
0
1,264,800
38,000 2,300
15,000
81,320r100
- ‘Insta l l a t i o n , on -s i t e f a c i l i t i e s , and o f f - s i t e f a d l i t i e s c o s t s have been factored i n t o t h e d i r e c t c a p i t a l costs. See Appendix A f o r a d e t a i l e d breakdown of actua l purchase, i n s t a l l a t i o n , and o t h e r costs.
2The 50 gpm system does no t i nc lude a l i m e s laker, as it i s more econ- omical t o use hydrated l ime i n t h i s s i z e range. gpm system does no t i nc lude a b e l t conveyer: t h i s was excluded because of t h e low sludge product ion rate.
I n addi t ion, t h e 50 gpm
4-69
Table 4-28
ANNUAL DIRECT 0 8 M COSTS FOR PHYSICAL/CHEMICAL TREATMENT
System Throughput, gpm: - Operating Labor @ $15.25/hr Maintenance Labor Maintenance M a t e r i a l s Admin i s t ra t i ve 8 Support Labor
TOTAL FIXE0 0 8 M COS1
v Operating Labor B $15.25/hr Maintenance Labor Maintenance Ma te r ia l s Admin i s t ra t i ve 8 Support Labor
Consumables: 66 Be S u l f u r i c ac id @ $0.62/gal Polymer 0 $1.00/lb Pebble Qu ick l ime @ $55/ton Hydrated Lime @ $%/ton E l e c t r i c i t y @ $0.04/kWh
TOTAL VARIABLE 0 8 M COST
5 4
$29,000 10,000 15,000 12,000
66.000
16,000 5,400 8,200 6,300
300 loo1 ---
1,300 2,000
39,600
m
$299000 14,000 21,000 13,000
77,000
16,000 7,400
11,000 6,900
1,000 500
5,5001
5,700
54,000
---
m
$29,000 17,000 26,000 14,000
86,000
16,000 9,200
14,000 7,400
2,000 1,000
ll,oool -_- 8,500
69,100
TOTAL DIRECT 0 8 M COST' $105,600 $131,000 $155,100
'The 50 gpm system u t i l i z e s hydrated l i m e because it i s more economical f o r t h i s small u n i t .
21nd i rec t opera t ing costs, such as deprec iat ion, insurance, taxes, and general and a d m i n i s t r a t i v e cos ts a re no t included.
The 250 and 500 gpm systems use qu ick l ime and a s laker .
4-70
G
P 3 0.7-
0.6-
c
IO
System Throughput, gpm
Figure 4-22. Systems
Estimated Tota l Cap i ta l Requirement f o r Physica lKhemical Treatment
100 50 100 200 300 400
System Throughput, gpm
IO
F i g u r e 4-23. P h y s i c a l K h e n i c a l Treatment Systems
Estimated Annual Direct Operating and Malntenance Cost for
4-71
LANDFILLS
L a n d f i l l s a r e commonly used i n t h e u t i l i t y i ndus t r y f o r d isposal of bottom and
f l y ash, and s t a b i l i z e d f l u e gas d e s u l f u r i z a t i o n sludge.
can a l s o be disposed o f i n l a n d f i l l s . Th is may i n v o l v e c o n s t r u c t i o n of a dedi-
cated l a n d f i l l f o r low volume wastes, or codisposal o f these wastes w i t h ash
and/or FGD sludge.
low volume wastes i n an o f f - s i t e l a n d f i l l .
Low volume s o l i d wastes
A l t e r n a t i v e l y , u t i l i t i e s may h i r e con t rac to rs t o dispose of
Pending and f u t u r e regu la t ions , a t both t h e fede ra l and l o c a l l e v e l s may a f fec t
s o l i d waste d isposal p r a c t i c e s i n t h e u t i l i t y indus t ry . The in fo rma t ion
presented he re inc ludes design and c o s t data a p p l i c a b l e t o t h e c u r r e n t p r a c t i c e
o f codisposal. and a l s o designs and c o s t s fo r d isposal o f l o w volume s o l i d wastes
under RCRA hazardous waste d isposal requirements.
L a n d f i l l i n g i s commonly used f o r t h e f o l l o w i n g low volume waste streams i n F igu re
4-1:
e Pyr i t es ;
e
e Cool ing tower bas in sludge; and
e
Thickened makeup water so f ten ing sludge;
Thickened wastewater t rea tment s1 udge.
The occurrence and volume of each o f these streams i s dependent on p l a n t type and
loca t i on .
severa l o rders o f magnitude depending on coal c h a r a c t e r i s t i c s . Makeup water
s o f t e n i n g sludge w i l l n o t be produced a t p l a n t s where a h igh q u a l i t y raw water
source i s ava i l ab le . I n most u t i l i t y a p p l i c a t i o n s where raw water sludge i s
produced and i s l a n d f i l l e d , t h e sludge w i l l be th ickened p r i o r t o d isposa l . Very
small volumes o f c o o l i n g tower bas in sludge a r e generated du r ing p e r i o d i c
dredging o f t h e tower basins.
ment of aqueous low volume wastes p r i o r t o d ischarge o r reuse, and a l so d u r i n g
h igh volume wastewater t rea tment (i.e., sidestream s o f t e n i n g o f r e c i r c u l a t i n g
c o o l i n g water) . Again, p l a n t type and l o c a t i o n w i l l be pr imary f a c t o r s i n
de termin ing t h e q u a n t i t y o f t h i s waste stream.
sludges, wastewater t rea tment sludges may be th ickened p r i o r t o l a n d f i l l i n g .
The volume of p y r i t e s generated du r ing coal p repara t ion may vary over
Wastewater sludges may be produced du r ing t r e a t -
As w i t h raw water s o f t e n i n g
4-72
- Since many low volume wastes have h ighe r concen t ra t i ons o f regulated c o n s t i t u e n t s
than coal ash, l a b o r a t o r y s t u d i e s were conducted t o est imate t h e e f f e c t i v e n e s s o f
codisposing s e l e c t low volume wastes w i t h coal ash i n l a n d f i l l s . A b e n e f i c i a l
d isposal o p t i o n would be created i f codisposal can reduce t h e p o t e n t i a l f o r these
c o n s t i t u e n t s t o leach from t h e low volume wastes. On t h e o t h e r hand, codisposal
i s undes i rab le if t h e h i g h volume waste becomes hazardous.
The f o l l o w i n g samples o f low volume waste and coal f l y ash were used i n t h e
l a b o r a t o r y codisposal study:
Low volume waste --EDTA b o i l e r chemical c lean ing waste - - c i t r a t e b o i l e r chemical c l e a n i n g waste --general p l a n t wastewater; and
F l y ash --southeastern bi tuminous --mi dweste r n bi tuminous --western subbituminous.
Although b o i l e r chemical c lean ing wastes a r e n o t genera l l y c o l a n d f i l l e d , they
were used i n these experiments t o o b t a i n t h e h i g h e s t poss ib le response.
volume waste was mixed w i t h f l y ash t o produce a compact ib le m a t e r i a l f o r
s i m u l a t i n g l a n d f i l l codisposal . Approximately 20 percent mois ture supp l i ed by
t h e l i q u i d low volume waste was requ i red t o produce a compact ib le ash.
compacted codisposal m i x t u r e s were cured f o r seven days and were then subjected
t o l each ing us ing t h e RCRA EP t o x i c i t y t e s t .
produced from ash w i t h and w i t h o u t low volume waste were used t o evaluate t h e
e f f e c t s of codisposal .
Low
The
Comparisons o f t h e EP e x t r a c t s
Tables 4-29 and 4-30 present t h e EP t o x i c i t y r e s u l t s f o r t h e low volume wastes
and f l y ashes i n d i v i d u a l l y .
t h e e f fec t i veness f o r codisposing of t h e wastes.
4-30, t h e low volume wastes g e n e r a l l y have h i g h e r EP concentrat ions than t h e coal
ashes.
These r e s u l t s were used as t h e standards t o evaluate
As shown i n Tables 4-29 and
Tables 4-31 through 4-33 present t h e EP t o x i c i t y r e s u l t s on t h e codisposal mix-
tu res . A l l of t h e codisposal m ix tu res were we l l below t h e RCRA maximum concen-
t r a t i o n l i m i t s . Therefore, one c r i t e r i a f o r successful codisposal was met; i.e.,
m i x i n g t h e low volume and h i g h volume waste d i d n o t c rea te RCEA-hazardous
mixtures.
4-73
Table 4-29
EP TOXICITY TEST RESULTS ON LOW VOLUME WASTES USED I N CODISPOSAL LAB STUDY (mg/L)
RCRA Maximum &stewat C i t r a t e Wa Concentrat i o n L i m i t
Elemental General Ana lvs i s EDTA Waste er s t e
Arsen ic 0.006 (0.003 0.21 5.0 Barium 0.76 1.2 1.6 100.0 Cadmium 3.0 o.ooa 0.64 1.0 Chromium 4.1 0.11 3.9 5.0 Lead 3.6 <0.002 ( 0 .002 5.0 Mercury <0.0002 <0.0002 <0.0002 0.2 Selenium (0.002 10.003 (0.003 l..O S i l v e r (0 . 002 0.009 0.006 5.0
Table 4-30
EP TOXICITY TEST RESULTS ON COAL FLY ASHES USED I N CODISPOSAL LAB STUDY (mg/L)
Southeastern Midwestern Western Elemental Analvs i s Bi tum inous Bituminous Subbituminous
Arsenic Barium Cadmium Chrcmium Lead Mercury Selenium S i l v e r
'F ixa t ion f a c t o r i s t h e ca l cu la ted l e a c h a b i l i t y o f t h e two components i n t h e n i i x tu re d i v i d e d by t h e measured l e a c h a b i l i t y o f t h e mixture. f a c t o r s g rea te r than 1.0 i n d i c a t e enhanced f i x a t i o n .
NA-Not analyzed
<OL-A11 measured concent ra t ions were l e s s than t h e a n a l y t i c a l de tec t i on l i m i t .
F i x a t i o n
4-76
One way t o eva lua te t h e e f fec t i veness o f codisposal i s t o compare t h e
l e a c h a b i l i t y of t h e m ix tu res w i t h t h e c a l c u l a t e d l e a c h a b i l i t y of t h e i n d i v i d u a l
components. The l e a c h a b i l i t y of t h e mix tu res i s s imply t h e measured
concen t ra t i ons from t h e EP e x t r a c t i o n s (Tables 4-31 th rough 4-33). The
c a l c u l a t e d l e a c h a b i l i t y i s t h e weighted sum of t h e l eacha te concent ra t ions
measured i n t h e EP e x t r a c t s of t h e ash and t h e low volume waste compr is ing t h e
codisposal mix tu re . T h i s c a l c u l a t e d l e a c h a b i l i t y i s an es t imate of t h e EP
concen t ra t i on i n t h e codisposal m i x t u r e i f no i n t e r a c t i o n s between t h e low volume
waste and f l y ash occurred. The r a t i o o f t h e c a l c u l a t e d l e a c h a b i l i t y over t h e
measured l e a c h a b i l i t y i s one i n d i c a t i o n o f t h e e f fec t i veness o f codisposal , and
i s r e f e r r e d t o as t h e f i x a t i o n f a c t o r (11).
Tab le 4-34 (see prev ious page) and Tables 4-35 and 4-36 present t h e f i x a t i o n
f a c t o r s f o r t h e codisposal mix tu res . A f i x a t i o n f a c t o r o f 1.0 i n d i c a t e s t h a t
t h e r e was no change i n l e a c h a b i l i t y from codisposing t h e wastes.
f a c t o r s g r e a t e r t han 1.0 i n d i c a t e t h a t m ix ing t h e wastes reduced t h e l e a c h a b i l i t y
o f t h e codisposed wastes over t h a t expected from t h e i n d i v i d u a l leachate
concen t ra t i ons of t h e two wastes.
enhanced t h e l e a c h a b i l i t y over t h a t expected i f no i n t e r a c t i o n occurred.
F i x a t i o n
Fac to rs l e s s than 1.0 i n d i c a t e t h a t t h e m ix ing
The codisposal w i t h t h e southeastern coa l f l y ash g r e a t l y reduced t h e leach-
a b i l i t y o f cadmium, chromium. and l e a d from EDTA waste. Chromium l e a c h a b i l i t y
from the c i t r a t e and wastewater m ix tu res was a l s o reduced th rough codisposal w i t h
t h e southeastern coal f l y ash. I n a few cases enhanced l e a c h a b i l i t y was ob-
served: selenium i n t h e EDTA mix tu re , selenium i n t h e c i t r a t e mix tu re , and
cadmium i n t h e wastewater mixture.
Codisposal of t h e low volume wastes w i t h t h e midwestern bi tuminous coal f l y ash
reduced l e a c h a b i l i t y f o r most elements i n c l u d i n g cadmium, chromium, and l e a d i n
t h e EDTA mixture; arsenic, barium, cadmium, chromium, and selenium i n t h e c i t r a t e
mix tu re : and barium, chromium, and selenium i n t h e wastewater mix tu re . Arsenic
showed enhanced l e a c h a b i l i t y i n t h e EDTA and wastewater mixtures.
Codisposal w i t h western subbituminous ash reduced t h e l e a c h a b i l i t y o f most
c o n s t i t u e n t s for t h e low volume wastes.
a s i g n i f i c a n t enhanced l e a c h a b i l i t y . w i t h a f i x a t i o n f a c t o r of 0.08. Cadmium,
selenium and s i l v e r showed s l i g h t enhancements i n l e a c h a b i l i t y (0.889 0.92 and
0.89 r e s p e c t i v e l y ) b u t these f i x a t i o n f a c t o r s were very near u n i t y .
Only a rsen ic i n t h e EDTA m i x t u r e showed
4-77
Table 4-35
Arsenic Barium Cadmium Chromium Lead Mercury Selenium S i l v e r
FIXATION FACTORS~ FOR LOW VOLUME WASTES CODISPOSED WITH MIDWESTERN BITUMINOUS COAL FLY ASH
CodisDosed w i t h Ash EDTA C i t r a t e General - W a s t e -
0.23 1.3 0.17 0.68 54 1.9 30 7.2 94 78 90 <OL
0.88 3.0 <DL
<DL <OL <OL 3.0 1.3 11 <DL <DL 0.89
'F ixa t ion f a c t o r i s t h e c a l c u l a t e d l e a c h a b i l i t y o f t h e two components i n t h e m i x t u r e d i v i d e d by t h e measured l e a c h a b i l i t y o f t h e mixture. F i x a t i o n f a c t o r s g r e a t e r than 1.0 i n d i c a t e enhanced f i x a t i o n .
<DL-A11 measured concent ra t ions were l e s s than t h e a n a l y t i c a l d e t e c t i o n l i m i t .
Table 4-36
FIXATION FACTOR$ FOR LOW VOLUME WASTES COOISPOSED WITH WESTERN SUBBITUMINOUS COAL FLY ASH
CodirpPSed w i t h Ash EDTA C i t r a t e General
Arsenic Barium Cadmium Chromium Lead Mercury Selenium S i l v e r
J Y a 5 h W a s t e W a s t e w a t e r
0.08 1 1.2 1.2 2.5 1.3
30 1.2 0.88 94 78 3 17 <OL <OL
<DL <OL <DL 1.1 1 <DL <OL
0.92 0.89
' F i x a t i o n f a c t o r i s t h e c a l c u l a t e d l e a c h a b i l i t y o f t h e two components i n t h e m i x t u r e d i v i d e d by t h e measured l e a c h a b i l i t y o f t h e mixture. F i x a t i o n f a c t o r s g r e a t e r than 1.0 i n d i c a t e enhanced f i x a t i o n .
<DL-All measured concent ra t ions were l e s s t h a n t h e a n a l y t i c a l d e t e c t i o n 1 i m i t .
4-78
In' summary. codisposal ( f o r a t l e a s t these s e l e c t low volume l i q u i d wastes)
appears b e n e f i c i a l . Concentrat ions o f c o n s t i t u e n t s i n EP e x t r a c t s o f codisposal
m ix tu res were w e l l below RCRA l i m i t s . And, i n nlost cases, t h e f i x a t i o n o f
leachab le c o n s t i t u e n t s i n t h e low volume wastes was improved r e l a t i v e t o separate
d isposa l .
QnceDtua l Desian
Several l a n d f i l l c o n f i g u r a t i o n s a r e commonly used i n t h e u t i l i t y i ndus t r y ; i n
a d d i t i o n , several t ypes of l i n e r and cap systems may be used w i t h each conf igura-
t i o n . L a n d f i l l s may be cons t ruc ted above ground on l e v e l t e r r a i n (heaped fill),
along t h e contours of a h i l l , o r w i t h i n a va l l ey , o r may be dug below grade and
d i ked (26). L ine r , cap, and leacha te c o l l e c t i o n system design a r e dependent on
t h e c l a s s i f i c a t i o n o f t h e waste t o be stored.
t h e disposal o f wastes c l a s s i f i e d as hazardous under RCRA.
l i n e s have been pub l ished t o suggest p re fe r red methods f o r t h e design of
l a n d f i l l s f o r non-hazardous wastes ( E ) . hydrogeologic c o n d i t i o n s a t t h e l a n d f i l l s i t e .
S p e c i f i c designs a r e requ i red f o r
I n add i t i on , guide-
These gu ide l i nes vary according t o t h e
Two l a n d f i l l design cases a re presented here. A schematic o f t h e f i r s t design i s
presented i n F igu re 4-24. Th is i s a c l a y - l i n e d l a n d f i l l w i t h a s i n g l e leachate
c o l l e c t i o n l aye r , and a c l a y cap system w i thou t l eacha te c o l l e c t i o n . Groundwater
mon i to r i ng w e l l s a r e provided. Th is design i s a t y p i c a l example f o r t h e disposal
o f u t i l i t y h igh volume wastes (ashes and FGO sludge). and. therefore, c o s t s
est imated f o r t h i s design can be used t o develop incremental cos ts f o r
cod ispos ing low volume wastes i n l a r g e ash l a n d f i l l s . Th is design was based on a
below-grade, d iked i n s t a l l a t i o n w i t h 3 : l w a l l slopes. Because of excavat ion
costs, t h i s c o n f i g u r a t i o n i s s l i g h t l y more expensive than heaped. s i d e - h i l l , o r
v a l l e y f i l l designs. As a r e s u l t , codisposal c o s t s developed us ing t h i s
conceptual design w i l l be h igher .
The second conceptual l a n d f i l l design i s i l l u s t r a t e d i n F igu re 4-25. Th is
design, a doub le- l ined l a n d f i l l , meets t h e requirements f o r storage o f wastes
c l a s s i f i e d as hazardous under RCRA.
a re fe rence i n t h e event t h a t a u t i l i t y must meet s t r i n g e n t s t a t e o r l o c a l
regu la t i ons . The design shown i n F i g u r e 4-25 i s a l s o a below-grade. d i ked
i n s t a l l a t i o n w i t h 3 : l w a l l slopes.
o v e r l a i n w i t h a f l e x i b l e membrane l i n e r , a I - f o o t p iped g ranu la r l eacha te
c o l l e c t i o n layer . another f l e x i b l e membrane. and a second 1- foo t leachate
c o l l e c t i o n l a y e r . The cap system f o r t h i s l a n d f i l l design i nc ludes a 3-fOOt c l a y
m i s design o p t i o n was inc luded t o serve as
The l i n e r systenl i nc ludes a 3 - foo t c l a y l a y e r
4-19
r 7 .r c U c 2
D W c _I I >I
m
.r
m G
e
E
L
c m ?
O 7
m 3 + a a, U c 0 0
N I -I
a, L 3 m .- U
4-80
P
cn c
2 FT TOPSOIL
1 FT. LEACHATE COLLECTION
MEMBRANE LINER
1 FT. LEACHATE COLLECTION (SAND WITH PVC DRAINS)
F i g u r e 4-25. Conceptual Design f o r Double-Lined L a n d f i l l s
' I I
l aye r , a f l e x i b l e membrane l i n e r , a 1- foot leachate c o l l e c t i o n l a y e r , and 2 f e e t
of t o p s o i l . Groundwater mon i to r i ng w e l l s a re a l s o included. - The design bases used t o es t ima te t h e cos ts f o r l a n d f i l l c o n s t r u c t i o n were pre-
sented i n Table 4-1. These stream data were used t o d e f i n e t h e volume range o f
low volume s o l i d wastes t o be considered f o r l a n d f i l l d isposal .
L a n d f i l l s , u n l i k e t h e o t h e r t reatment and disposal methods discussed, i n c u r
c o n s t r u c t i o n c o s t s du r ing each year o f t h e i r ope ra t i ng l i f e . Therefore,
l a n d f i l l s a r e s i zed accord ing t o t h e y e a r l y s o l i d s s torage requi red.
c a p i t a l requirement f o r a l a n d f i l l inc ludes t h e c o s t o f l and requ i red f o r 30
years of operat ion, t h e c o s t of road cons t ruc t i on , and t h e c o s t o f p repar ing
s torage f o r a one-year s o l i d waste volume.
cos ts i n c l u d e haul ing, p lac ing, and compacting o f a one-year waste volume, and
t h e c o s t of p repar ing a c e l l f o r s torage of another one-year volume (s torage t o
be used i n t h e f o l l o w i n g year) . Because annual c o s t s i n c l u d e c e l l cons t ruc t i on ,
ope ra t i ng and maintenance c o s t s f o r l a r g e r l a n d f i l l s may exceed t h e i r t o t a l
c a p i t a l requirement.
The t o t a l
The annual ope ra t i ng and maintenance
For t h e c l a y - l i n e d l a n d f i l l design depic ted i n F i g u r e 4-24. a range o f volumes
were se lec ted t o est imate c o s t s f o r codisposal of low volume wastes w i t h coal ash
and/or s t a b i l i z e d FGD sludge. Codisposal c o s t s can be based on t h e c u b i c yards
per year of low volume s o l i d waste produced and t h e c o s t per c u b i c yard f o r
c o n s t r u c t i n g and o p e r a t i n g h i g h volume waste l a n d f i l l s .
computed us ing t h e data presented i n Table 4-23.
were developed for annual l a n d f i l l capac i t y requirements from 10,000 t o 2,000,000
c u b i c yards.
Waste volumes can be
U n i t c o s t s fo r c o l a n d f i l l i n g
The range o f c a p a c i t i e s f o r e s t i m a t i n g t h e c o s t of double- l ined l a n d f i l l s (shown
i n F igu re 4-25) was based on t h e c o n s t r u c t i o n of dedicated s i t e s f o r d isposal o f
low volume s o l i d wastes. For t h i s reason. t h e annual l a n d f i l l requirements a r e
much sma l le r than those considered f o r t h e c l a y - l i n e d l a n d f i l l s .
double- l ined l a n d f i l l s , which meet t h e RCRA s p e c i f i c a t i o n s f o r disposal o f
hazardous waste, were developed f o r annual capac i t y requirements o f 50 t o 5,000
c u b i c yards.
Costs f o r
The c o s t s of these l a n d f i l l c o n f i g u r a t i o n s a r e presented as a f u n c t i o n o f annual
capaci ty . For impoundments, these c o s t s a r e presented on a u n i t volume basis.
4-02
T h i s approach was used because t h e s i z e range examined covers severa l orders of
magnitude, and because it best i l l u s t r a t e s t h e p o i n t a t which u n i t volume c o s t s
become cons tan t w i t h i nc reas ing capaci ty . I n add i t i on , t h i s approach i s useful
f o r e s t i m a t i n g t h e c o s t s of codisposal , as it al lows t h e c o s t s f o r incremental
vo l tunes t o be e a s i l y d e t e n i n e d .
- d L a n d f i l l s . Costs were est imated f o r below-grade, diked, c l a y - l i n e d
l a n d f i l l s w i t h 3 : l wa l l slopes, over a s i z e range o f 10,000 t o 2,000,000 c u b i c
yards p e r year.
t o 50 f e e t deep f o r t h e l a r g e s t i n s t a l l a t i o n s .
developed; one s e t assumes t h a t c l a y i s a v a i l a b l e o n - s i t e (no c o s t f o r m a t e r i a l
o r t r a n s p o r t a t i o n ) , w h i l e t h e o t h e r s e t assumes a d e l i v e r e d c l a y c o s t of $110 per
ton. The est imated t o t a l c a p i t a l requirement f o r 10,000, 50,000, 500,000, and
1,000.000 c u b i c yard p e r year c l a y - l i n e d l a n d f i l l s (assuming o n - s i t e c l a y ) a r e
presented i n Table 4-37. The TCR inc ludes t h e c o s t o f land associated w i t h a
30-year o p e r a t i n g l i f e , t h e c o s t of a one-half m i l e road t o t h e s i t e , and t h e
m a t e r i a l s and c o n s t r u c t i o n c o s t of a one-year ope ra t i ng volume.
annual d i r e c t o p e r a t i n g and maintenance c o s t s f o r these l a n d f i l l s are presented
i n Table 4-38.
yard, f ac to red maintenance and a d m i n i s t r a t i v e costs, and m a t e r i a l s and
c o n s t r u c t i o n of a one-year ope ra t i ng volume.
c o n s t r u c t i o n i s e q u i v a l e n t t o t h e TCR t h a t would be c a l c u l a t e d a f t e r exc lud ing
t h e c o s t o f land and roads from t h e d i r e c t process c o s t i n Table 4-37.
P e r m i t t i n g and r e g u l a t o r y compliance c o s t s a r e n o t inc luded i n e i t h e r t h e c a p i t a l
o r OBM costs .
and a r e more than adequately covered by t h e cont ingencies i nc luded i n t h e
est imate.
These l a n d f i l l s ranged from 25 f e e t deep f o r t h e sma l les t volume
Two s e t s o f c o s t data were
The est imated
The annual OBM c o s t inc ludes sludge hand l i ng a t $4 p e r cub ic
Th is annual c o s t f o r m a t e r i a l s and
For non-hazardous waste d isposal these c o s t s a r e n o t s i g n i f i c a n t
The c a p i t a l and OAM c o s t s f o r t h i s c l a y - l i n e d l a n d f i l l design a re presented
g r a p h i c a l l y i n F igu res 4-26 and 4-27, respec t i ve l y . These p l o t s c l e a r l y i l l u s -
t r a t e t h e decreasing u n i t c o s t of s o l i d s d isposal w i t h i nc reas ing l a n d f i l l
capaci ty . As a r e s u l t , t h e incremental c o s t of codisposing low volume wastes
w i t h h igh volume wastes i s a f u n c t i o n of t h e s i z e of p l a n t ash l a n d f i l l . Co-
disposal cos ts can be obta ined from Figures 4-26 and 4-27 us ing a known ash
l a n d f i l l capac i t y and Table 4-23 t o es t ima te low volume waste s o l i d s q u a n t i t i e s .
For a power p l a n t w i t h a 10,000 c u b i c yard per year l a n d f i l l , t h e annual c o s t o f
codisposing low volume waste w i l l be $30-40 p e r c u b i c yard (assuming a waste bu lk
densi ty o f approximately 75 l b p e r f t
Th is es t ima te can vary depending on t h e c o s t and a v a i l a b i l i t y o f c lay .
3 so t h a t one c u b i c yard weighs one ton ) .
For a
4-03
Table 4-37
ESTIMATED TOTAL CAPITAL REQUIREMEM FOR CLAY-LINE0 LANDFILLS (Waste Depth = 25-50 ft, L o c a l l y A v a i l a b l e Clay)
L a n d f i l l Capacity, c u b i c yards: 10,000 Waste Depth, ft: 25
D i r e c t Process and O f f - s i t e C a p i t a l
I;pzts
Land S i t e P repara t l on L i n e r and Leachate C o l l e c t i o n L a n d f i l l Cap System Groundwater Mon i to r i ng Roads On-site Costs
D i r e c t Process Cost
$190,000 42,000 47,000 21,000
9,700 28,000 20,000
357,700
O f f - s i t e Costs 36,000
To ta l D i r e c t Cap i ta l 393,700
Engineer ing and Home O f f i c e Fees 39,000 P r o j e c t Contingency 79,000 Process Contingency 20,000
TOTAL PLANT COST (TPC) 531,700
Allowance f o r Funds During Construct lon 0
TOTAL PLANT INVESTMENT (TPI) 531,700
Preproduct ion Costs 11,000
100,000 50
$640,000 300,000 190,000 83,000 9,700
28,000 83,000
1,333.700
130,000
19463 9700
150,000 290,000
73.000
ln97 6,700
0
1,9769700
39,000
500,000 1,000,000 50 50
82,100,000 $3 9 600,000 1,300,000 2,600,000
5 60 P 000 950,000 300,000 53 0,000
9.700 9,700 28,000 28,000
290,000 510,000
4,587 9700 8.227,700
460,000 820,000
5r047r700 9,047,700
510.000 910,000 1.000,000 1,8009000
260,000 450,000
6.8179700 12,207>700
0 0
6,817,700 12,207,700
140,000 240,000
TOTAL CAPITAL REWIREMEM (TCR) $5429700 $29015,700 $6,957,700 $12,447,700
$/CUBIC YARD (on -s i t e c l a y ) $54.00 $20.00 $14.00 $12.00
4-84
Tab le 4-38
ANNUAL 0 8 M COST FOR CLAY-LINE0 LANDFILLS (Waste OeDth = 25-50 ft. L o c a l l y A v a i l a b l e Clay)
L a n d f i l l Capacity, c u b i c yards: Waste Depth, ft: - Construc t i on Labor Cons t ruc t i on M a t e r i a l s Operat ing Labor Maintenance Labor Maintenance M a t e r i a l s A d m i n i s t r a t i v e 8 Support Labor
ANNUAL FIXE0 0 8 M COST
Y a r i a b l e ODeratina Costs
Cons t ruc t i on Labor Cons t ruc t i on M a t e r i a l s Operat ing Labor Maintenance Labor Maintenance M a t e r i a l s A d m i n i s t r a t i v e 8 Support Labor
ANNUAL VARIABLE 0 A M COST
ANNUAL DIRECT 0 8 M COST
$/CUBIC YARD (on -s i t e c l a y )
10,000 25
$83,000 55,000 27,000 3,400 5.100 34,000
207,500
44,000 30,000 15,000 1,800 2,700 18.000
111,500
$319,000
100,000 50
$390,000 260,000 260,000 14,000 21,000 200,000
1,145,000
210.000 140,000 140,000 7,400 11,000 110,000
618,400
$11763 9400
$30.00 $17 .OO
500,000 50
$1 9500,000 980,000
1,300,000 51,000 76,000 85 0,000
4 9 757,000
790,000 530,000 7 10,000 27,000 41,000 460.000
2,558,000
$7 9 3 15 9 000
$14 .OO
1,000,000 50
$2,700,000 1,800,000 2,600,000
92,000 140.000
1,600,000
8,932,000
1,500,000 970.000
1,400,000 50,000 75,000 870,000
4,865,000
$13,797,000
$14 .OO
4-85
0 0.01 0.02 0.05 0.1 0.2 0.5 1
Landfill Capacity, Million Cubic Yards/Year
F igure 4-26. Estimated T o t a l C a p i t a l Requirements for Clay-Lined L a n d f i l l s
50
E ' 40 s u
3
2
3
g 30 0 0
0 + 20 e! 0
._ 0 m = - c 10 I
0
1 I
0.01 0.62 0.05 0.1 0.2 0.5 1 I I I
Landfill Capacity, Million Cubic Yardslyear
I
Figure 4-27. Estimated Annual D i r e c t Operating and Maintenance Cost f o r Clay-Lined L a n d f i l l s
4-56
p l a n t w i t h a 500,000 c u b i c yard p e r year ash l a n d f i l l , t h e codisposal c o s t i s
reduced t o $15-17 p e r ton. Note t h a t these annual c o s t s i n c l u d e both y e a r l y
c o n s t r u c t i o n m a t e r i a l s and labo r , as w e l l as o p e r a t i n g and maintenance l a b o r
assoc iated w i t h s o l i d waste hand' l ing.
Double - l i n e d La n d f i l l g . Th is design meets t h e requirements f o r s torage of wastes
c l a s s i f i e d as hazardous under RCRA. The est imated t o t a l c a p i t a l requirement and
annual d i r e c t ope ra t i ng and maintenance c o s t s f o r double- l ined l a n d f i l l s ranging
from 50 t o 5,000 c u b i c yards p e r year a r e presented i n Tables 4-39 and 4-40,
r e s p e c t i v e l y . These c o s t s a r e f o r below-grade, d iked i n s t a l l a t i o n s w i t h 3 : l w a l l
slopes, hav ing t h e l i n e r and cap system designs depic ted i n F igu re 4-25. The
depths o f these l a n d f i l l s range from 4 f e e t f o r t h e 50 c u b i c yard f a c i l i t y t o 10
f e e t fo r those w i t h c a p a c i t i e s of 1000 c u b i c yards o r greater . The c o s t s i n
Tables 4-39 and 4-40 assume t h a t no c o s t s a r e i n c u r r e d f o r c l a y purchase o r
f r e i g h t .
l i f e , a one-half m i l e mad, and t h e c o s t of c o n s t r u c t i n g a one-year ope ra t i ng
volume. The annual o p e r a t i n g and maintenance c o s t assumes a waste handl ing
charge of $4 p e r c u b i c yard and inc ludes t h e c o s t assoc iated w i t h c o n s t r u c t i o n of
a one-year o p e r a t i n g volume.
The TCR inc ludes t h e c o s t of acreage r e q u i r e d f o r a 30-year o p e r a t i n g
Cap i ta l and annual ope ra t i ng c o s t curves f o r t h e double- l ined l a n d f i l l s a r e shown
i n F igures 4-28 and 4-29, respec t i ve l y . The two curves i n each f i g u r e i l l u s t r a t e
s e n s i t i v i t y t o c l a y cost . The lower curve i n each case assumes t h a t c l a y i s
a v a i l a b l e o n - s i t e (no purchase o r f r e i g h t c o s t ) and t h e upper curve assumes a
d e l i v e r e d c l a y c o s t of $110 p e r ton. The s e n s i t i v i t y o f u n i t d isposal c o s t t o
l a n d f i l l volume t h a t was apparent f o r c l a y - l i n e d s i t e s i s even greater over t h i s
s i z e range of double- l ined i n s t a l l a t i o n s . The annual u n i t c o s t f o r a 50 c u b i c
yard p e r year double- l ined l a n d f i l l ranges from $1.500-$1,700 p e r cub ic yard
depending on c l a y a v a i l a b i l i t y . For 5,000 c u b i c yard p e r year l a n d f i l l s , t h i s
c o s t i s $90-$110 p e r c u b i c yard.
F igures 4-28 and 4-29 can be used t o es t ima te t h e cos ts f o r hazardous s o l i d waste
disposal ; however, several impor tan t f a c t o r s should be considered i n t h e i r use.
F i r s t , t h e requi r m e n t s f o r a RCRA hazardous waste d isposal f a c i l i t y are sub jec t
t o change. Furthermore, l o c a l r e g u l a t i o n s may impose d i f f e r e n t o r more s t r i n g e n t
design requi r m e n t s f o r hazardous waste l a n d f i l l i n g . Another impor tan t f a c t o r
t h a t must be considered i s t h a t p e r m i t t i n g c o s t s a r e n o t inc luded i n e i t h e r t h e
c a p i t a l o r o p e r a t i n g and maintenance c o s t s presented. For hazardous waste
d isposal s i t e s , t hese cos ts can be s i g n i f i c a n t . An est imated c o s t f o r p repar ing
4-87
Table 4-39
TOTAL CAPITAL REQUIREMENT FOR DOUBLE FML LANDFILLS (Waste Depth = 4-10 ft, L o c a l l y A v a i l a b l e Clay)
L a n d f i l l Capacity, c u b i c yards: Waste Depth, ft
D i r e c t P r o c w u n d O f f - s i t e C a p i t a l
cQ&i Land S i t e Prepara t ion L i n e r s and Leachate C o l l e c t i o n L a n d f i l l Cap System Groundwater Mon i to r i ng Fence Roads On-s i te Costs
D i r e c t Process Cost
O f f - s i t e Costs
To ta l D i r e c t Cap i ta l
Engineer ing and Home O f f i c e Fees P r o j e c t Contingency Process Contingency
TOTAL PLANT COST (TPC)
50 4
$38,000 2,500 9,700 8,900 9,700 4,500
28,000 5,300
106,600
11.000
1179600
12,000 24,000
5,900
159,500
Allowance of Funds Dur ing Const ruc t ion 0
TOTAL PLANT INVESTMENT (TPI) 159,5 00
Preproduct ion Costs 3.200
TOTAL CAPITAL REQUIREMENT (TCR) $162,700
$/CUBIC YARD ( o n - s i t e c l a y ) $3,200
500 -3
$67,000 6,500
21,000 21,000 9,700 5,600
28,000 9,000
167,800
17,000
184,800
18,000 37,000
9,200
249,000
0
249,000
5,000
$254,000
1,000 10
$84,000 9,500
29,000 28,000
9,700 6,100
28,000 11,000
205,300
21,000
2269300
23.000 45,000 11.000
305,300
0
305,300
6,100
$3 11 I 400
$510 $310
5,000 10
$190,000 29.000 71,000 78,000 9,700 8,600
28,000 25,000
439,300
44,000
483,300
48,000 96,000 24,000
651,300
0
65 1,300
13.000
$664 9300
$130
4-86
Table 4-40
ANNUAL DIRECT 0 8 M COSTS FOR DOUBLE FML LANDFILLS (Waste Depth = 4-10 ft, L o c a l l y A v a i l a b l e Clay)
L a n d f i l l Capacity, c u b i c yards: Waste Depth, f t
F ixed O D e r a t i w
Const ruc t ion Labor Const ruc t ion M a t e r i a1 s Operat ing Labor Maintenance Labor Maintenance M a t e r i a l s A d m i n i s t r a t i v e 8 Support Labor
ANNUAL FIXED 0 8 M COST
V a r i a b l e Operat ing Costs
Const ruc t ion Labor Const ruc t ion M a t e r i a l s Operat ing Labor Maintenance Labor Maintenance M a t e r i a l s A d m i n i s t r a t i v e 8 Support Labor
F igu re 4-28. To ta l Estimated Cap i ta l Requirement f o r Double-Lined L a n d f i l l s
o ! 1 I 1 I I
0.02 0.05 0.1 0.2 0.5 1 2 5
Landfill Capacity, Thousand Cubic Yardslyear
I
Figure 4-29. Est imated Annual D i r e c t Operat ing and Maintenance Cost f o r Doub l e - L i ned Landf i 11 s
4-90
a RCRA P a r t B p e r m i t i s $200,000 p e r s i t e (28); t h i s does n o t i n c l u d e t h e
p e r m i t t i n g c o s t s associated w i t h s a t i s f y i n g s t a t e and l o c a l r e g u l a t i o n s .
SDeci a1 Consi d e r a t i m
Cont rac tor disDosal.
s o l i d wastes t o o f f - s i t e l a n d f i l l s . Th is i s a common p r a c t i c e f o r o i l - f i r e d
u t i l i t i e s t h a t do n o t have l a r g e ash l a n d f i l l s f o r codisposal .
c o n t r a c t o r d isposa l a r e p r i m a r i l y a f u n c t i o n o f s o l i d s content, general
geographic l o c a t i o n . and p r o x i m i t y t o d isposal s i t e s . E s t i m t e d c o n t r a c t o r c o s t s
f o r o f f - s i t e l a n d f i l l d isposal ranged from $80 t o $350 p e r c u b i c yard; o f f - s i t e
i n c i n e r a t i o n c o s t s ranged from $500 t o $1,600 per c u b i c yard (3.2,31,2,35). Disposal c o s t s a t t h e low end o f these ranges apply t o sludges w i t h a very low
mois tu re c o n t e n t (i.e.. l e s s than 10 percent) ; as mois tu re conten t increases,
d isposa l c o s t s increase.
be added t o these d isposal cos ts .
c o s t s o f o n - s i t e d isposa l t o determine whether economlcs f a v o r c o n s t r u c t i o n of
o n - s i t e f a c i l i t i e s o r t h e use of con t rac ted o f f - s i t e d isposal .
Many u t i l i t i e s h i r e c o n t r a c t o r s t o t r a n s p o r t low vo l ufne
Costs f o r
T r a n s p o r t a t i o n costs, a t $3 t o $4 p e r loaded mi le , must
These u n i t c o s t s can be compared w i t h t h e
Under RCRA, a waste generator r e t a i n s r e s p o n s i b i l i t y f o r t h e waste whether it i s
disposed o f on s i t e or hauled t o an o f f - s i t e l o c a t i o n by a c o n t r a c t o r .
fore, l i a b i l i t y as w e l l as c o s t should be considered i n s e l e c t i n g d isposal
methods. U t i l i t i e s may be l i a b l e for mishandl ing o f wastes by a c o n t r a c t o r . I n
a d d i t i o n , o f f - s i t e f a c i l i t i e s may c o n t a i n wastes from severa l generators. Under
j o i n t and severa l l i a b i l i t y r u l i n g s , a l l generators of hazardous wastes s to red a t
a p a r t i c u l a r s i t e have been dec lared l i a b l e f o r remediat ion costs , These c o s t s
were d i s t r i b u t e d among a l l generators, regard less o f whether o r n o t t h e i r waste
was respons ib le f o r environmental damage.
There-
process Sum ma ry
The D i e t r i c h memorandum c u r r e n t l y a l lows codisposal o f a l l low volume wastes,
regard less of r e g u l a t o r y c l a s s i f i c a t i o n , i n l a n d f i l l s w i t h ash and/or FGD sludge
prov ided s t a t e and l o c a l s o l i d waste r e g u l a t i o n s permi t such p r a c t i c e s . Eecause
t h i s d isposal o p t i o n does n o t r e q u i r e c o n s t r u c t i o n o f a separate f a c i l i t y , and
because t h e volume occupied by these wastes i s small compared w i t h t h a t requ i red
f o r ash d isposal , codisposal i s very c o s t e f f e c t i v e . Codisposal can a l s o prov ide
environmental benef i t s . The a l k a l i n i t y i n h e r e n t i n some coal ash he lps t o
n e u t r a l i z e a c i d s formed from p y r i t e decomposition, and a lso a ids i n immobi l i z ing
heavy meta ls .
4-91
Several f a c t o r s may in f luence t h e dec i s ion t o c o n s t r u c t small, dedicated land-
f i l l s f o r low volume waste disposal . The t y p e of waste, t h e volume generated,
and t h e p rox in l i t y t o o f f - s i t e disposal f a c i l i t i e s w i l l a f f e c t t h e cos ts o f
on -s i t e c o n s t r u c t i o n r e l a t i v e t o c o n t r a c t o r disposal . I n add i t ion , l i a b i l i t y
issues must be considered.
d isposa l c o s t s i n c l u d e s i t e remediat ion, genera tors a r e respons ib le f o r these
costs.
Although n e i t h e r t h e es t imated o n - s i t e o r o f f - s i t e
EVAPORATION
ADD1 i c a b l e Wast e Streams
A l l f i v e t ypes o f b o i l e r chemical c lean ing wastes have been evaporated i n power
p l a n t b o i l e r s . The i r o n l e v e l s i n t h e t h r e e organ ic s o l u t i o n s and t h e
h y d r o c h l o r i c a c i d range f rom 5.000 t o 10,000 m g / L depending on the concen t ra t i on
o f t h e c lean ing agent. The ammonium bromate s o l u t i o n i s used e x c l u s i v e l y f o r
copper removal and con ta ins copper l e v e l s o f 300 t o 1,000 mg/L. Copper l e v e l s i n
t h e o the r s o l u t i o n s vary from a few mg/L t o several hundred.
p resent a t f a i r l y low l e v e l s ((10 mg/L). Nickel , vanadium, and z i n c a r e
occas iona l l y p resent a t h ighe r l e v e l s .
conipositton, they a l l possess. e leva ted concen t ra t i ons o f d i sso l ved heavy metals.
Other metals a r e
Although t h e c lean ing wastes vary i n
The major d i f f e r e n c e i n t h e waste composi t ion i s t h e anion o r solvent. C i t r a t e ,
EDTA. and HAF a r e a l l water s o l u b l e o rgan ic compounds con ta in ing carbon, hydro-
gen, and oxygen, which form carbon d i o x i d e and water upon combustion. T y p i c a l l y
t h e c lean ing wastes c o n t a i n 3 t o 5 percent o f t h e organ ic compound by weight.
The remainder o f t h e waste i s wate,r. The h y d r o c h l o r i c a c i d stream i s about 5
percent HC1. Dur ing evaporation. hyd roch lo r i c a c i d vapor i s 1 i be ra ted along
w i t h oxides o f t.he nietals p resent ( i r on , copper, etc.) The anin!onium bromate
waste produces both
EDTA and c i t r a t e wastes may a l so con ta in s u b s t a n t i a l l e v e l s o f ammonia. and NOx and copper compounds upon combustion. The
Treatment E f f e c t i v w
A recen t study (16) c a l c u l a t e d t h e e f f e c t o f evapora t ing EDTA, c i t r a t e , and HAF
wastes i n a u t i l i t y b o i l e r . The concen t ra t i on o f t h e e i g h t RCRA metals (a rsen ic .
barlum, cadmium, chromium, lead, niercury, selenium, and s i l v e r ) du r ing evapora-
t i o n were compared t o base l i ne l e v e l s .
basis, t h e a d d i t i o n a l metals c o n t r i b u t e d by evapora t ion were inconsequent ia l
compared t o t h e amount c o n t r i b u t e d by t h e coal . On an instantaneous basis, t h e
waste elemental pass r a t e s were measurable. No d iscuss ion o f t h e e f f e c t of
The f i n d i n g s showed t h a t on an annual ized
4-92
evapora t ion of HC l o r ammonium bromate s o l u t i o n s was presented.
po in ted o u t t h a t v a r i a b i l i t y i n t h e t r a c e element conten t of t h e f u e l was s i g n i f -
i c a n t l y g r e a t e r than t h e mass amount c o n t r i b u t e d by evaporat ion.
T h i s study a l s o
Another study b r i e f l y descr ibed t h e r e s u l t s of evapora t ing ammonium bromate and
HAF wastes (31). t e r e d du r ing t h e burn.
which was e i t h e r sorbed on to t h e f l y ash o r removed by a wet scrubber.
and i r o n l e v e l s were found t o be s l i g h t l y e leva ted i n t h e ash s l u i c e water. No free halogens were measured i n t h e s tack gas.
t h a t evapora t ion i s an opera t i on sinipla t o perform w i t h minimal environmental
impacts (18. 32, 411, 41).
T h i s paper i n d i c a t e d t h a t no opera t i ona l problems were encoun-
The bromate was e v i d e n t l y converted t o sodium bromide
Copper
Several o the r a r t i c l e s i n d i c a t e
B o i l e r chemical c lean ing wastes f rom t h r e e p l a n t s i n Appendix B were evaporated.
A c i t r a t e c l e a n i n g waste f rom P l a n t E and EDTA c lean ing wastes front P l a n t s L and
U were evaporated w i t h o u t any repo r ted opera t i ona l o r environmental problems.
P l a n t E i s a gas-f i red b o i l a r , w h i l e L and U a re c o a l - f i r e d u n i t s .
v Evaporat ion of b o i l e r c lean ing wastes i s an i n f requen t l y performed task.
i n - l i n e n e u t r a l i z a t i o n and o the r assoc ia ted procedures, it occurs Only when t h e
b o i l e r i s chemica l l y cleaned, t y p i c a l l y once every two t o f i v e years. Evapor-
a t i o n frequency inc reases a t m u l t i - u n i t s ta t i ons . Other than s to rage f a c i l i t i e s ,
t h e equipment r e q u i r e d f o r evapora t ing wastes i nc ludes a pump, piping, and a
nozz le r e t r o f i t t o an e x i s t i n g b o i l e r .
As w i t h
A t y p i c a l evapora t ion r a t e of about 10 gpm per 100,000 pounds per hour o f steam
f low r e q u i r e s a p e r i o d of 1-4 days f o r evapora t ion of t h e b o i l e r chemical
cleaning waste produced du r ing a s i n g l e b o i l e r c lean ing episode.
requ i red f o r s to rage o f t h e wastes p r i o r t o evapora t ion may range from 50,000 t o
200,000 gal lons, depending on b o i l e r s ize.
dedicated s to rage tank o r by r e n t a l tankage t h a t can be niade a v a i l a b l e f o r s h o r t
t in ,e pe r iods du r ing b o i l e r c lean ing episodes. I n e i t h e r case, a pump and p i p i n g
from t h e s to rage l o c a t i o n t o t h e b o i l e r a re required.
b o i l e r c lean ing waste must be considered i n t h e s e l e c t i o n o f me ta l l u rgy o r o the r
m a t e r i a l s o f c o n s t r u c t i o n f o r t h e tank, pump, and p ip ing .
The volume
T h i s volume niay be prov ided by a
The c o r r o s i v i t y o f t h e
B o i l e r evapora t ion r e q u i r e s tha t . t h e b o i l e r con ta in a s u i t a b l e a tomiz ing nozzle.
T h i s may r e q u i r e r e t r o f i t of a nozzle, o r rcay i n v o l v e t h e use o f an e x i s t i n g
4-93
b o i l e r nozzle. Nozzles used f o r atomizing b o i l e r c lean ing wastes i n a b o i l e r
must be capable of w i ths tand ing t h e combined e f fec ts of h i g h temperature and t h e
c o r r o s i v i t y of t h e spent s o l u t i o n .
m e n t Cos&
Est imated c a p i t a l and opera t i ng and maintenance cos ts f o r evapora t ing b o i l e r
c lean ing s o l u t i o n s a r e presented i n Tables 4-41 and 4-42, respec t i ve l y .
cos ts a r e i nc luded f o r a system con ta in ing a 200,000 g a l l o n conc re te sump, a punip
w i t h a capac i t y of 50 gpm, 300 f e e t of f l e x i b l e piping, and a nozzle, and a l s o
f o r t h e same system w i t h t h e s to rage tank. The c o s t f o r ope ra t i ng l a b o r i s based
on t h r e e manhours per day f o r f o u r days per b o i l e r c lean ing episode (one b o i l e r
c lean ing per year was assumed).
f ac to red from t h e c a p i t a l cost es t imate f o r t h e system c o n t a i n i n g t h e s to rage
tank.
inc luded (see Sec t ion 3 f o r r e g u l a t i o n s a f f e c t i n g evaporat ion).
C a p i t a l
Maintenance and a d m i n i s t r a t i v e cos ts were
Labor c o s t s assoc ia ted w i t h o b t a i n i n g any necessary pe rm i t s a r e n o t
The energy pena l t y assoc ia ted w i t h evapora t ing a b o i l e r c lean ing waste and a l s o
t h e energy c r e d i t assoc ia ted w i t h combustion o f t h e associated organ ic con ten t
a re inc luded as o p e r a t i n g costs. The hea t of combustion f o r wastes w i t h a f i v e
percent o rgan ic con ten t was es t imated a t 350 B tu / l b .
Btu/ lb. t h i s r e s u l t s i n a n e t energy pena l t y o f 650 B t u / l b f o r evapora t ion of
spent b o i l e r c lean ing wastes.
steam flow, t h i s i s equ iva len t t o approximately s i x m i l l i o n Btu/hr. T h i s pena l ty
was est imated a t $3 per m i l l i o n Btu; f o r a four day t rea tment i n t e r v a l a t 20 gpm
(approximately 125.000 ga l lons) , t h e n e t energy pena l t y c a l c u l a t e d us ing t h i s
method i s approximately $1,900.
Using a l a t e n t hea t o f 1000
A t a feed r a t e of 20 gpm per 100,000 l b / h r o f
The est imated c a p i t a l cos ts presented i n Tab le 4-41 show t h a t t h e s to rage vessel
accounts f o r a l a r g e percentage of t h e d i r e c t process c o s t f o r evapora t ing spent
c lean ing wastes i n a power p l a n t b o i l e r . Therefore, decreasing t h e s to rage
volume requ i red w i l l decrease t h e t o t a l c a p i t a l requirement f o r evapora t ion
p ropor t i ona te l y . Lesser volumes o f s o l u t i o n s w i l l a l s o decrease t h e energy
penal ty.
chemical wastes. I f t h e me ta l l u rgy i s compat ib le w i t h t h e waste, t h i s cou ld be
an economical a l t e r n a t i v e t o b u i l d i n g a ded ica ted tank. P o r t a b l e tanks, o f t e n
used i n t h e o i l f i e l d s e r v i c e and r e f i n i n g indus t ry , can ho ld up t o 20,000
g a l l o n s and may be ren ted on a weekly or monthly basis.
As an a l t e r n a t i v e , a u t i l i t y may cons ider l e a s i n g tankage t o s t o r e
4-94
Tab1 e 4-41
ESTIMATED TOTAL CAPITAL REQUIREMENT FOR EVAPORATION OF BOILER CLEANING WASTE
System Throughput: Storage:
and O f f - s i t e CaDi ta l C-1
Concrete Sump - 200,000 g a l l o n Feed Pump F l e x i b l e P i p e - 300 f e e t I n j e c t i o n Nozzle On-si t e Costs
D i r e c t Process Costs
O f f - s i t e Costs
T o t a l D i r e c t C a p i t a l Cost (TPC)
Engineer ing and Home O f f i c e Fees (10%) P r o j e c t Contingency (20%) Process Contingency (5%)
TOTAL PLANT COST
Allowance f o r Funds Dur ing Const ruc t ion
TOTAL PLANT INVESTMENT (TPI)
Preproduct i on c o s t s
TOTAL CAPITAL REOUIREMENT (TCR)
20 gpm a i t h s to raae
$72,000 3 I 000
900 500
7.600
84 9 000
8,400
92,000
9,200 18,000 4,600
124,200
0
124,200
2,500
$1269700
---2 $3,000
900 500 400
4,800
500
5,300
500 1,100
300
7,200
0
7,200
100
$7,300
1 I n s t a l l a t i o n . o n - s i t e f a c i l i t i e s , and o f f - s i t e f a c i l i t i e s c o s t s have been fac to red i n t o t h e d i r e c t c a p i t a l costs.
2This case excludes c o s t s f o r storage. f a c i l i t i e s i s assumed.
Use of a v a i l a b l e s torage
4-95
Tab le 4-42
ANNUAL DIRECT o a w COSTS FOR EVAPORATION OF BOILER CLEANING WASTE
Opera t ing Labor 6 $15.25/hr Maintenance Labor Maintenance M a t e r i a l s AdK, in i s t ra t i ve 8 Support Labor1
TOTAL FIXED 0 8 M COST
Y a r i a b l e Ouer-
Operat ing Labor @ $15.25/hr Maintenance Labor Maintenance M a t e r i a l s A d m i n i s t r a t i v e 8 Support Labor
Consumabl es: Energy Pena l ty
TOTAL VARIABLE 0 8 M COS1
$100 1,700 2,500
500
4,800
100 900
1.400 300
1,900
4,600
TOTAL OIRECT 0 8 W COST 2, 3 $9.400
-_ 1Labor cos ts f o r o b t a i n i n g any necessary pe rm i t s a re n o t included.
2 I r i d i r e c t upe ra t i ng costs, such as deprec ia t ion , insurance, taxes, and general and a d m i n i s t r a t i v e cos ts a re n o t n o t included.
3These c o s t s apply t o systenis w i t h or w i thou t dedicated s to rage f a c i l i t i e s . I n e i t h e r case, a s to rage area i s used and c o n t r i b u t e s t o ope ra t i ng and maintenance costs.
4-96
Specia l Consider-
Besides t h e u t i l i t i e s us ing evaporat ion i d e n t i f i e d i n Appendix B ( P l a n t s D, E,
and L ) , two b o i l e r manufacturers were a l s o contacted (42,U). One manufacturer
discouraged t h e evaporat ion of any substance i n a b o i l e r due t o t h e p o t e n t i a l
econoniic r i s k t o a u t i l i t y (i.e., inimediate and long-terni e f f e c t on b o i l e r l i f e ) .
He a l s o quest ioned whether a t y p i c a l b o i l e r design mee!ts requirements f o r c o n t a c t
tin,e, teniperature, and turbulence. A second manufacturer had t h e oppos i te
o p i n i o n and was a c t i v e l y working w i t h a u t i l i t y demonstrat ing t h e evaporat ion o f
h y d r o c h l o r i c a c i d chemical c lean ing wastes.
Other c o n s i d e r a t i o n s should a l s o be examined p r i o r t o evaporat ing a b o i l e r
chemical c l e a n i n g waste. Systems equipped w i t h wet scrubbers may i n c u r
a d d i t i o n a l r i s k s by evaporat ing b o i l e r c l e a n i n g wastes.
evaporated. t h e scrubber w i l l remove niost o f t h e acid. The c h l o r i d e i o n i s
capable o f caus ing s t r e s s c o r r o s i o n ( e s p e c i a l l y of s t a i n l e s s s tee ls ) . and
affects the "2 removal and t h e q u a l i t y o f market grade gypsun..
If h y d r o c h l o r i c a c i d i s
Other types of c l e a n i n g s o l u t i o n s c o u l d produce h igher t r a c e metal concent ra t ions i n
t h e scrubbing 1 i q u o r which may cause opera t ing and/or d isposal problems.
Process Sunimary
Evaporat ion i s an e f f e c t i v e means of d ispos ing of b o i l e r cheniical c lean ing wastes
and i s e s p e c i a l l y a t t r a c t i v e f o r EDTA and c i t r i c a c i d wastes. which a r e d i f f i c u l t
t o t r e a t w i t h convent ional physical /chemical systenis.
The energy l i b e r a t e d by evaporat ion of t h e organ ics i n b o i l e r c l e a n i n g wastes i s
overshadowed by t h e energy requ i red t o evaporate t h e i r water content, thereby
c r e a t i n g a n e t energy penal ty . T h i s energy pena l ty i s not, however, a niajor
disadvantage s i n c e evaporat ion of b o i l e r c l e a n i n g wastes i s performed i n f r e -
quent ly and f o r per iods of s h o r t durat ion.
w i t h evapora t ion o f p a r t i c u l a r types o f wastes.
evaporat ion has p o t e n t i a l r isks because of t h e p o s s i b i l i t y of downstrean, a c i d
condensation. A t reasonable i n j e c t i o n rates. however. vapor phase c h l c r i d e
concent ra t ion may n o t exceed those r e s u l t i n g from combustion of a fue l c o n t a i n i n g
moderate c h l o r i d e l e v e l s .
Other disadvantages a r e associated
For example, h y d r o c h l o r i c a c i d
ALT€RNATIVE/INNOVATIVE TECHNICUES
T h i s subsect ion b r i e f l y discusses severa l t rea tment and d isposal o p t i o n s f o r low
volume wastes which a r e under development o r n o t w ide ly used. Most o f these
4-97
processes a r e used f o r b o i l e r chemical c lean ing wastes, t h e most d i f f i c u l t t o
t r e a t low volume waste produced a t a u t i l i t y .
a p p l i c a b l e t o o the r low volume waste streams.
Other methods a r e p o t e n t i a l l y
- am B o i l e r Chemical Cleaning
Recent work by t h e Saskatchewan Power Corpora t ion has determined t h a t on-stream
c lean ing o f b o i l e r tubes w i t h sodium p o l y a c r y l a t e i s a c o s t - e f f e c t i v e a l t e r n a t i v e
t o t h e t r a d i t i o n a l c lean ing procedure (44). This procedure i nvo l ves i n j e c t i n g
s u f f i c i e n t sodium p o l y a c r y l a t e i n t o t h e b o i l e r feedwater t o o b t a i n a
concen t ra t i on of 400 mg/L.
pe r iod t o p revent sodium car ryover i n t o t h e dry stream.
The t e s t b o i l e r s were derated d u r i n g t h e c lean ing
Process DeSCriDtiOQ. The a d d i t i v e e v i d e n t l y removes t h e ou te r l a y e r s of l oose ly
bound magnet i te which causes t h e g rea tes t heat t r a n s f e r res is tance.
magnet i te l a y e r which p r o t e c t s t h e tube wa l l f r an co r ros ion i s n o t removed,
u n l i k e t h e t r a d i t i o n a l c lean ing methods. A d d i t i o n a l l y , t h e i r o n concen t ra t i on
does n o t inc rease i n t h e b o i l e r water, i n d i c a t i n g t h a t a p u r e l y phys ica l form of
removal i s occur r ing .
i r o n i s present i n a s o l i d phase.
The i n n e r
Th is s i m p l i f i e s t rea tment o f t h e blowdown stream s ince t h e
Measurements o f t h e e f fec t i veness ( i n terms o f weight removed) range from 14 t o
80 percent of t h e magnet i te present.
s t a b l e c a r b o x y l i c ac ids f a i r l y q u i c k l y and b o i l e r blowdown can be s t a r t e d w i t h i n
severa l hours o f t h e chemical add i t i on . Treatment t imes range from one t o two
days.
The p o l y a c r y l a t e begins decomposing t o
A ~ K L B & E and Disadvant-. On-stream c lean ing has severa l major advantages
r e l a t i v e t o t h e t r a d i t i o n a l method. Since t h e b o i l e r i s opera t iona l , a l though
perhaps derated, it i s s t i l l producing power d u r i n g a c leaning. It appears t h a t
t h e l eng th o f time requ i red fo r a c lean ing i s reduced also.
chemicals used a r e much l e s s hazardous t o personnel than t h e t r a d i t i o n a l
compounds. The b o i l e r blowdown i s much s imp le r t o t r e a t than o the r b o i l e r
chemical c lean ing wastes s ince it does n o t c o n t a i n h igh concent ra t ions o f
d isso lved i m n .
A d d i t i o n a l l y , t h e
The process i s n o t as e f f e c t i v e i n c lean ing depos i t s as t h e t r a d i t i o n a l methods.
The resu l t s , i n terms o f e f fect iveness, a re f a i r l y scat tered, although no
c o r r e l a t i o n w i t h u n i t heat r a t e versus c lean ing was presented i n t h e c i t a t i o n .
Also, t h e paper d i d n o t d iscuss t h e method's performance w i t h respect t o copper
4-98
removal. Another disadvantage i s t h e p o t e n t i a l f o r i n t r o d u c i n g contaminants i n t o
t h e tu rb ine .
Lhzkz. t r a d i t i o n a l method, a re $25,000 t o $30,000 on an annual basis. The paper
est imates t h e t r a d i t i o n a l method cos ts about $100.000 which i n d i c a t e s on-stream
c lean ing cos ts $10,000 t o $25,000 over t h r e e years.
Estimated savings f o r a 300 Mw u n i t . cleaned every t h r e e years by t h e
&&a1 Recovery
I n general, t h e concept of metal recovery i s no t cos t e f f e c t i v e f o r low volume
waste t reatment .
i r o n and 500 pounds o f copper. Since b o i l e r s a re cleaned in f requen t l y , annual
r a t e s a re o n l y f r a c t i o n a l q u a n t i t i e s o f these amounts. A d d i t i o n a l l y , t h e c o s t o f
conve r t i ng metal hydrox ide sludges ( t h e form produced du r ing water t rea tment )
i n t o a recyc lab le ma te r ia l i s p r o h i b i t i v e , based on t h e low salvage p r i ce .
B o i l e r chemical c lean ing wastes con ta in up t o 5,000 pounds of
The on ly metal recovery opera t ion p rac t i ced r e g u l a r l y i s done on f i r e s i d e wastes
from o i l - f i r e d p lan ts . Depending on t h e vanadium conten t of t h e fue l , f i r e s i d e
waste sludge may be economical ly recyc led as a s t e e l add i t i ve . Treated w i t h
fe r rous s u l f a t e , t h e s ludge formed con ta ins econanic l e v e l s o f f e r rous
metavanadate, used i n making s t a i n l e s s s t e e l . A t l e a s t one u t i l i t y disposes o f
i t s t rea tment s ludge i n t h i s manner (45).
Solidlflcatlon
S o l i d i f i c a t i o n o f low volume waste sludges has been inves t i ga ted p rev ious l y i n an EPRI s tudy (46). Th is work examined e i g h t s o l i d i f i c a t i o n processes w i t h e i g h t
s ludge or s o l i d low volume wastes.
i d e n t i f i e d a p p l i c a b l e processes f o r decreasing t h e l e a c h a b i l i t y o f t h e var ious
wastes. Organic polymers n o t based on urea-formaldehyde and sur face
encapsulat ion were deemed app l i cab le f o r a l l o f t h e wastes.
conducted before in fo rmat ion was a v a i l a b l e showing t h a t these wastes are no t RCRA
hazardous. Consequently, t h e r e i s l i t t l e j u s t i f i c a t i o n f o r implementing these
techn i q u es .
The r e s u l t s o f t h i s l i t e r a t u r e survey
Th is work was
Some s i m i l a r research described e a r l i e r ( c o l a n d f i l l i n g ) addressed mix ing f l y ash
w i t h l i q u i d low volume wastes. The a n a l y t i c a l r e s u l t s o f these t e s t s i n d i c a t e d
t h a t t h e r e s u l t a n t ma te r ia l was n o t a hazardous waste.
4-99
Bas.?
Reuse i s a common p r a c t i c e f o r many low volume wastes, e s p e c i a l l y i n water
l i m i t e d reg ions of t h e country .
blowdown, yard d ra ins ) can be used w i thou t t rea tment i n c o o l i n g towers, ash
hand l ing systems, and scrubbers. Other streams may r e q u i r e t reatment such as
sof ten ing, reverse osmosis, o r vapor compression evapora t ion before reuse. A
recent paper has examined t h e cos ts and b e n e f i t s of reus ing va r ious low volume
waste streams (a). This paper a l s o presents a methodology f o r determin ing i f
reuse i s economical.
blowdown was est imated a t $10,000 per megawatt.
Many of t h e l e s s contaminated streams ( b o i l e r
A present va lue c o s t pena l t y fo r n o t reus ing b o i l e r
Reuse may a l so be performed as an a l t e r n a t i v e t o t reatment .
chemical c lean ing wastes may be added t o f l u e gas d e s u l f u r i z a t i o n systems f o r
u l t i m a t e d isposa l .
Many o f t he b o i l e r
Research i n t h i s area i s being sponsored by EPRI.
I n n o v a t i v e Tre&ue& Methods
The che la ted b o i l e r chemical c lean ing wastes are o f t e n d i f f i c u l t t o t r e a t t o
requ i red l e v e l s w i t h convent ional l i m e p r e c i p i t a t i o n techniques. Several
d i f f e r e n t r e a c t i o n mechanisms may be a p p l i c a b l e f o r these s p e c i f i c wastes.
Processes suggested f o r f u r t h e r research inc lude:
e Decarboxy la t ion by - - e l e c t r o l y s i s --chemical o x i d a t i o n - - f ree r a d i c a l a t tack ;
Adsorpt ion on to a c t i v a t e d carbon o r o t h e r media; and
Biodegradation.
Techniques used i n o t h e r i n d u s t r i e s may be a p p l i c a b l e t o low volume waste t r e a t -
ment. EPRI i s a l so i n v e s t i g a t i n g t h i s t o p i c f u r t h e r .
J r r i a a t i o n and Land Treatme&
Other a l t e r n a t i v e s f o r d ispos ing of low volume wastes i nc lude i r r i g a t i o n and land
app l i ca t i on .
of o i l y wastes. Th is p r a c t i c e i s based on t h e m ic rob ia l s o i l organisms
conver t i ng t h e organ ic subs t ra te i n t o C02 and water.
aqueous, m i c r o b i a l a c t i o n would have no b e n e f i c i a l e f fec t . The metal
contaminants would n o t be immobi l ized t o any degree.
Land a p p l i c a t i o n has rece ived cons iderab le i n t e r e s t f o r t reatment
Since l o w volume wastes are
4-100
I r r i g a t i o n of grasses has been proposed f o r d ispos ing of wastewater from power
p lan ts . However, d i sso l ved s o l i d s concent ra t ions i n t h e water can cause
b i o l o g i c a l s t r e s s i n p lan ts , I n general. it has been found t h a t evaporat ion
ponds a r e more e f f e c t i v e on a c o s t pe r acre bas i s f o r d ispos ing of wastewater
(48). The p o t e n t i a l contaminat ion o f subsurface waters i s a l so a damaging
l i a b i l i t y f o r i r r i g a t i o n d isposal .
4-101
Sect ion 5
INTEGRATION OF LOW VOLUME WASTE TREATMENT WITH
PLANT WATER AND WASTE MANAGEMENT - CASE STUDIES
Several power p l a n t case s t u d i e s a r e presented i n t h i s sect ion. The purpose o f
these case s t u d i e s i s t o i l l u s t r a t e t h e use o f t h e in fo rmat ion presented i n t h e
prev ious s e c t i o n s t o develop e f f e c t i v e low volume waste management systems.
The case s t u d i e s presented a r e modeled a f t e r p l a n t s descr ibed i n Appendix A.
However, i n o r d e r t o i n c l u d e a v a r i e t y o f waste types and t rea tment approaches.
t h e case s t u d i e s of ten incorpora te features from severa l p lants . I n a l l cases,
t h e wastes and t rea tment systems se lec ted a r e c o n s i s t e n t w i t h c u r r e n t u t i l i t y
p r a c t i c e and e x i s t i n g environmental regu la t ions .
T h i s s e c t i o n a l s o serves t o i l l u s t r a t e s t r a t e g i e s f o r i n t e g r a t i n g t h e low volume
waste management system w i t h t h e o t h e r power p l a n t a i r , water. and waste
management systems.
volume wastes i n t h e p lan t . S t r a t e g i e s a r e a l s o presented t h a t w i l l a s s i s t
u t i l i t i e s i n avo id ing t h e c l a s s i f i c a t i o n of low volume wastes as hazardous under
RCRA guide1 ines.
These s t r a t e g i e s can h e l p reduce t h e c o s t o f t r e a t i n g low
APPROACH
The m a j o r i t y of u t i l i t y s t a t i o n s do n o t generate a l l o f t h e low volume waste
streams i d e n t i f i e d i n t h i s manual. P l a n t con f igura t ion , f u e l type, geographic
l o c a t i o n , age, and many o t h e r f a c t o r s in f luence t h e low volume wastes produced.
C h a r a c t e r i s t i c s of p l a n t s descr ibed i n Appendix A, the model p l a n t s i n t h e EPRI
Technical Assessment Guide (I&). and o t h e r l i t e r a t u r e were used t o s e l e c t speci-
f i c low volume wastes and t h e t rea tment techniques used f o r t h e case s tud ies.
The major f a c t o r s t h a t determine which wastes a r e generated and which t rea tment
op t ions a r e employed are:
e Al lowab le discharges;
e Fuel t y p e (coal , o i l o r gas);
5-1
F l y ash t r a n s p o r t method (wet o r d r y ) ;
0 Use o f f l u e gas desu l fu r iza t ion , and if so, t h e type of process; and
a Geographic l o c a t i o n .
Although o t h e r f a c t o r s may a l s o have a bear ing on t h e t y p e and volume of low
volume wastes produced a t a s t a t i o n , t h e f a c t o r s l i s t e d above a r e t h e most
impor tan t i n terms of s e l e c t i n g t rea tment opt ions.
p l a n t s a r e presented i n Table 5-1. These p l a n t c o n f i g u r a t i o n s were se lec ted t o
represent a v a r i e t y of common t rea tment opt ions. Two eastern and two western
c o a l - f i r e d p lants . and one eas tern o i l - f i r e d p l a n t were se lected. Two of t h e
c o a l - f i r e d p l a n t s were b u i l t p r i o r t o t h e promulgation o f t h e August 11. 1979 New
Source Performance Standards (NSPS) f o r s team-elect r ic power p l a n t s (49). The
o t h e r two c o a l - f i r e d s t a t i o n s a r e requ i red t o meet t h e 1979 NSPS us ing f l u e gas
d e s u l f u r i z a t i o n systems f o r SO2 c o n t r o l .
C h a r a c t e r i s t i c s of f i v e model
Table 5-1
MODEL PLANT CONFIGURATIONS
Model Pl.& 1
2
3
4
5
Approximate Locatlon F3e.l -LMl" FGD
Limestone W i s c o n s i n / I l l i n o l s Coal NPDES D r Y
W i s c o n s i n / I l l i n o i s Coal NPDES Wet (pond) None
Arizona/New Mexico Coal None D r Y Spray d r y e r
Arizona/New Mexico Coal None Wet (pond) None
Eastern Seaboard O i l NPDES None None
P l a n t l o c a t i o n may be t h e s i n g l e most impor tan t i n f l u e n c e on low volume waste
management, s i n c e it of ten determines f u e l c h a r a c t e r i s t i c s (low volume waste
composit ion). water q u a l i t y (pret reatment requi rements) and a v a i l a b i l i t y (water
recyc le/ reuse) , t rea tment technology s e l e c t i o n (evaporat ion ponds), l o c a l
by-product markets (d ry ash handl ing) , and environmental requirements (zero
discharge, FGD systems).
Model p l a n t s 1 and 2 a r e l o c a t e d i n t h e W i s c o n s i n / I l l i n o i s area (EPRI
East-Central data reg ion) . Model p l a n t 1 i s t h e base model p l a n t s p e c i f i e d i n
t h e EPRI Technica l Assessment Guide; t h i s p l a n t meets t h e 1979 NSPS (u). Model
5-2
p l a n t s 1 and 2 burn h i g h - s u l f u r I l l i n o i s No. 6 coal w i t h t h e f o l l o w i n g
c h a r a c t e r i s t i c s : heat ing va lue = 10,100 Btu/ lb , 16 percent ash, 4 percent
s u l f u r . Model p l a n t 2 i s t y p i c a l of many o l d e r p l a n t s i n t h i s reg ion which
s l u i c e f l y ash and do n o t have FGD systems. Model p l a n t s 3 and 4 a r e l o c a t e d i n
t h e Southwestern U.S. (Arizona/New Mexico) and burn subbituminous coal (heat ing
va lue = 8.020 Btu / lb , 6.4 percent ash, 0.48 percent s u l f u r ) . Model p l a n t 3 i s a
new p l a n t u s i n g a spray dryer and baghouse t o comply w i t h t h e 1979 NSPS.
p l a n t 4 i s an o l d e r western u n i t us ing an ash pond w i t h e i t h e r wet s l u i c i n g or a
scrubber f o r p a r t i c u l a t e c o n t r o l . Model p l a n t 5 i s an o i l - f i r e d u n i t loca ted on
t h e eastern seaboard t h a t employs once-through c o o l i n g water.
Model
The remainder of t h i s s e c t i o n discusses each case s tudy i n d e t a i l .
addressed i n c l u d e t h e major equipment and processes used, t h e low volume wastes
generated and t h e i r amount, and t h e t rea tment methods selected. Low volume waste
c h a r a c t e r i s t i c s presented i n Sec t ion 2 and r e g u l a t i o n s reviewed i n Sect ion 3 were
used as t h e bases f o r determin ing low volume waste t rea tment requirements.
c a p i t a l and annual opera t ing and maintenance ( O B M ) c o s t s f o r t h e low volume waste
t rea tment processes a r e developed u s i n g t h e in fo rmat ion presented i n Sect ion 4.
Areas
Both
CASE 1. EASTERN COAL PLANT WITH DRY ASH HANDLIM;
F i g u r e 5-1 i s a diagram of t h e Case 1 p l a n t . T h i s s t a t i o n has two 500 MW base
l o a d s u b c r i t i c a l b o i l e r s burn ing eas tern h igh-su l fu r b i tuminous coal . It i s
s u b j e c t t o t h e 1979 NSPS and c u r r e n t NPOES requirements f o r aqueous discharges.
Mechanical d r a f t c o o l i n g towers produce a blowdown stream a t four cyc les of
concent ra t ion t o meet M i s s i s s i p p i r i v e r e f f l u e n t g u i d e l i n e s f o r d isso lved s o l i d s
w i t h o u t f u r t h e r t reatment . An e l e c t r o s t a t i c p r e c i p i t a t o r i s used f o r p a r t i c u l a t e
removal and wet l imestone scrubbers a r e used f o r SO2 c o n t r o l .
chemica l l y f i x e d and disposed of w i t h f l y ash i n a l a n d f i l l . Coal p i l e runof f i s
d ischarged f o l l o w i n g sedimentat ion and n e u t r a l i z a t i o n , w h i l e t h e o ther aqueous
low volume wastes a r e routed through phys ica l /chemical t reatment . The s o l i d low
volume wastes are c o l a n d f i l l e d w i t h t h e h i g h volume wastes.
FGD sludge i s
Low Volume Wastes a nd T r &&?I&
F i g u r e 5-2 p resents t h e low volume waste streams, f low rates, and t rea tment
processes f o r t h i s case study. Nine low volume waste streams and n i n e t reatment
u n i t s a re inc luded.
The sedimentat ion impoundment i s designed t o h o l d 10 m i l l i o n g a l l o n s o f coal p i l e
runof f . The coa l p i l e r u n o f f f low i s based on a 10-year storm event o f 5.5
5-3
BLOWDOWN MECHANICAL
DRAFT COOLING TOWERS
WATER
GENERATOR
cn P
LIMESTONE -
F i g u r e 5-1. Handl ing and Limestone FGD
Block Diagram of t h e Case 1 Plan t : Eastern Coal-Fired S t a t i o n w i t h Dry Ash
1 t T ELECTROSTATIC FG D PRECIPITATOR SYSTEM COAL BOILER
Figure 5-2. Low Volume Waste Flowsheet for t h e Case 1 P l a n t
inches per 24 hour pe r iod (U) . r e l a t i o n s h i p given i n Sec t ion 2, Coal P i l e Runoff. The coa l p i l e i s s i zed f o r
90-day opera t i on a t 100 percent load and covers 75 acres. A c l a y - l i n e d
impoundment w i t h a 15 f o o t water depth ( a l l impoundment designs i n c l u d e two fee t
of freeboard, i.e., t o t a l pond depth i s seventeen f e e t ) i s used t o s t o r e t h e
runo f f volume. Local s o i l i s adequate f o r use as l i n e r ma te r ia l . The pH o f t h e
r u n o f f i s ad jus ted as needed us ing a 500 g a l l o n s p e r minu te i n - l i n e
n e u t r a l i z a t i o n u n i t w i t h a c a u s t i c feed r a t e o f 0.02 g a l l o n s per thousand
ga l lons . Th is n e u t r a l i z a t i o n u n i t inc ludes o n l y one ( c a u s t i c ) chemical feed
system.
The r u n o f f volume was computed us ing t h e
A 55 gal lon-per-minute rapid-mix tank n e u t r a l i z a t i o n system i s used t o t r e a t
demine ra l i ze r regenerant t o avo id t h e s to rage of RCRA-corrosive wastes i n an
impoundment.
a f i l l -and-draw mode. T h i s ope ra t i on u t i l i z e s m i x i n g o f t h e c a t i o n and anion bed
regenera t ion wastes t o p rov ide t h e bu lk of t h e n e u t r a l i z a t i o n .
consumption r a t e o f 0.5 g a l l o n s per thousand g a l l o n s was assumed, and t h e system
inc ludes two chemical feed u n i t s .
Deminera l i zer regenerant i s pH ad jus ted i n a mix tank opera t i ng i n
A c a u s t i c
Because o f d i f f e r e n c e s i n t h e e f f l u e n t standards f o r s p e c i f i c low volume wastes,
two impoundments a r e used f o r temporary s to rage p r i o r t o physical /chemical
t reatment; one i s f o r h o l d i n g h ighe r q u a l i t y water (such as f l o o r and yard
d ra ins ) , and one i s f o r h o l d i n g b o i l e r c l e a n i n g wastes (waters ide and f i r e s i d e ) .
F l o o r and yard dra ins , a f t e r be ing t r e a t e d t o remove o i l , a re mixed w i t h
n e u t r a l i z e d demine ra l i ze r regenerant and b o i l e r blowdown i n t h e cont inuous waste
impoundment. ( O i l sepa ra t i on was n o t addressed i n t h i s manual ; however, c a p i t a l
and o p e r a t i n g c o s t es t imates were ob ta ined from a vendor f o r an a p p r o p r i a t e l y
s i zed coa lesc ing p l a t e separa tor (la).) Design f l ow r a t e s t o t h i s impoundment
t o t a l 180 g a l l o n s per minute. The impoundment i s s i zed f o r a 5-day r e t e n t i o n
t ime a t design f low f o r bo th u n i t s (1.3 m i l l i o n g a l l o n s ) . Th is provides a 10-day
ho ld ing t i m e when one b o i l e r i s o f f - l i n e f o r c lean ing .
f e e t deep. has a s i n g l e f l e x i b l e membrane l i n e r (FML). and does n o t have leacha te
c o l l e c t i o n o r a groundwater mon i to r i ng system.
The impoundment i s 15
The i n t e r m i t t e n t waste impoundment i s a conc re te sump w i t h a volume of 2 m i l l i o n
g a l l o n s f o r f i r e s i d e and b o i l e r chemical c l e a n i n g waste. F i r e s i d e washes
generate approximately 1.6 m i l l i o n g a l l o n s o f wastewater f o u r t imes a year.
B o i l e r chemical c l e a n i n g waste washes generate about 125,000 ga l l ons every year
and a ha l f . Th i s r i g i d - w a l l e d vessel meets t h e RCRA d e f i n i t i o n f o r a tank.
5-6
Ef f l uen ts from bo th t h e i n t e r m i t t e n t waste tank and cont inuous waste impoundment
a re processed i n t h e same physical /chemical t rea tment system. However, t h e
wastes a re t r e a t e d separately, s ince they must meet d i f f e r e n t NPDES l i m i t s and
r e q u i r e s u b s t a n t i a l l y d i f f e r e n t chemical doses. The wastewater f rom t h e
cont inuous waste impoundment r e q u i r e s o n l y minor pH adjustment and suspended
s o l i d s removal t o meet NPDES l i m i t s . The b o i l e r c lean ing wastes, however.
r e q u i r e s i g n i f i c a n t pH adjustment t o p r e c i p i t a t e i r o n and copper, fo l lowed by
s o l i d s separa t ion and a f i n a l a c i d a d d i t i o n f o r n e u t r a l i z a t i o n t o meet discharge
requirements.
of water; t h i s s i z e a l l ows t h e system t o operate an average o f 0 t o 10 hours per
day when t r e a t i n g t h e cont inuous waste streams, and a l l ows t rea tment o f t h e
volume generated du r ing b o i l e r c lean ing i n 2 t o 3 days. To ensure compliance
w i t h discharge requirements. t r e a t e d e f f l u e n t i s he ld i n one of two discharge
impoundments u n t i l a n a l y t i c a l measurements a re completed. These impoundments
have a s i n g l e f l e x i b l e membrane l i n e r and a l i q u i d depth o f 15 fee t ; each
impoundment has a volume o f 360,000 gal lons, equ iva len t t o a 24-hour f low.
Groundwater mon i to r i ng and leachate c o l l e c t i o n a re n o t provided.
Th is t rea tment system i s s ized t o t r e a t 500 g a l l o n s p e r minute
Wastewater t rea tment sludge, py r i t es , and c o o l i n g tower sludge are c o l a n d f i l l e d
w i t h h i g h volume wastes ( f l y ash and s t a b i l i z e d FGD sludge).
method complies w i t h codisposal c u r r e n t l y exempt from RCRA-hazardous c l a s s i f i c a -
t i o n , as d e t a i l e d by t h e EPA (2.31). The incremental c o s t associated w i t h
l a n d f i l l i n g these wastes i s based on t h e i r reduc t i on of t h e l a n d f i l l capac i t y by
10,500 cub ic yards per year. The ash l a n d f i l l capac i t y a t t h i s p l a n t i s 400,000
c u b i c yards p e r year.
Th i s t rea tment
sy&ac&&
Table 5-2 p resents t h e est imated cos ts associated w i t h t h e t rea tment processes
f o r low volume wastes i d e n t i f i e d i n F i g u r e 5-2. Cap i ta l and 08M cos ts were
ob ta ined us ing t h e design f low ra tes and system s izes presented above, and t h e
data i n Sec t i on 4. Approximately 55 pe rcen t of t h e t o t a l c a p i t a l c o s t f o r low
volume waste t rea tment equipment i n t h i s p l a n t i s f o r t h e physical /chemical
t rea tment system.
l a n d f i l l i n g a re n e a r l y equal, each being about one- th i rd of t h e t o t a l annual
ope ra t i ng cos t .
The c o s t f o r ope ra t i on o f t h i s t rea tment system and t h a t f o r
CASE 2. EASTERN COAL PLANT WIM WET ASH HANDLING
F i g u r e 5-3 i s a diagram o f t h e Case 2 p lan t .
l oad s u b c r i t i c a l b o i l e r s burn ing Eastern h igh s u l f u r b i tuminous coal . It i s
The s t a t i o n has two 500 MW base
5-7
Table 5-2
ESTIMATED TREATMENT SYSTEM COSTS FOR CASE 1 PLANT
Ln
m
Treatment U n i t
Sedimentation impoundment
In-1 i n e n e u t r a l i z a t i o n
O i l separat ion
Rapid-mix tank n e u t r a l i z a t i o n
Continuous waste impoundment
I n t e r m i t t e n t waste impoundment
Phys ica l /chemical t reatment
Discharge impoundments ( 2 )
L a n d f i l l
Tot a1
__
Waste Design' Stream Bas is
coal p i l e 10 MG, 15-f00t, c lay - runo f f 1 ined, 1 oca1 mater i a1
coal p i l e 500 gpm, one feed runo f f 0.02 ga1/1000 gal
f l o o r and yard 21 gpm d r a i n s
demine ra l i ze r 55 gpm, two feed regenerant 0.5 ga1/1000 gal
h igh q u a l i t y 1.3 ffi, 15- foot wastewater s i n g l e FML
b o i l e r clean- Z E conc re te sump i n g wastes
a l l wastewaters 500 gpm systan except runoff
t r e a t e d 2-360,000 g a l l o n water 15-foot. s i n g l e FML
1 ow v o l ume 400,000 c u y d / y r s o l ids, (10,500 c u yd /y r s1 udges i ncrenent )
To ta l Annual Reference Cap i ta l Operat ing 8
F i g u r e Reauirement Maintenance
4-15 $200.000 $20.000
4-89 4-9 $104,000 $47.000 4-10, 4-11
R e f (50) - $10,000 $1,000
4-4, 4-5 $80,000 $42.000
4-17 $52.000 $11.000
4-18 $400,000 $3 1,000
$150.000 4-22. 4-23 6 1 ~ 3 0 0 ~ 0 0 0
4-17 $58,000 $19,000
4-26, 4-27 $157.000 $157,000
$2,361,000 $478,000
l l h e design bas i s for each t reatment system was used w i t h t h e c o s t i n f o r m a t i o n i n Sect ion 4 t o est imate c a p i t a l requirement and OBM cos ts ( f i r s t q u a r t e r 1986 d o l l a r s ) .
I I I
BLOWDOWN DRAFT COOLING TOWERS
WATER
COAL BOILER
n PARTICULATE SCRUBBER
v FLY
f BOTTOM
ASH
POND
F igure 5-3. Block Diagram of t h e Case 2 Plant : Eastern Coal-Fired w i t h Wet Ash Handling
I I I I '
s u b j e c t t o t h e c u r r e n t NPDES requirements f o r aqueous discharges; however,
because t h e p l a n t i s n o t c l a s s i f i e d as a new source, f l y ash s l u i c e water
discharge i s a1 lowed.
a t f o u r cyc les o f concentrat ion, which meets M i s s i s s i p p i r i v e r e f f l u e n t
g u i d e l i n e s f o r d i sso l ved s o l i d s w i thou t t reatment.
system inc ludes a s l u i c i n g system t o t r a n s p o r t t h e f l y ash and bottom ash t o a
d isposa l pond. No water i s recyc led from t h e ash pond. Ash s l u i c e water i s
discharged w i thou t treatment, meet ing pH. suspended so l ids, and i r o n and copper
requirements.
ash pond.
Mechanical d r a f t c o o l i n g towers produce a blowdown stream
The p a r t i c u l a t e c o n t r o l
The low volume wastes produced a t t h i s p l a n t a re codisposed i n t h e
Low Volume Wastes and Treatmen i
F i g u r e 5-4 presents t h e low volume waste streams, flow rates, and t rea tment
processes fo r t h i s case. E i g h t streams were inc luded i n t h i s model p lan t . Use
o f coponding f o r disposal of low volume wastes i n t h e ash pond dominates t h e low
volume waste management plan.
Runoff from a 75 ac re coa l p i l e , s i zed for 90 days opera t i on a t 100 percent load,
i s coponded w i t h f l y ash. The runoff f low r a t e was based on an average annual
r a i n f a l l o f 35 inches. Coponding e l im ina tes t h e need f o r a sedimentat ion bas in
and f o r runoff n e u t r a l i z a t i o n . Assuming a runoff suspended s o l i d s l e v e l of
200 ppm and an ash pond sludge b u l k d e n s i t y o f 75 l b per cub ic foo t , approxi-
mately 1700 c u b i c yards o f a d d i t i o n a l ash pond s to rage are requ i red t o accommo-
da te s o l i d s from coal p i l e runof f over a 30-year p l a n t l i f e .
Deminera l i zer regenerant i s t r e a t e d i n a 55 g a l l o n s p e r minute rapid-mix tank
n e u t r a l i z a t i o n system opera t ing i n a f i l l -and-draw mode t o avo id r o u t i n g a
p o t e n t i a l l y RCRA- c o r r o s i v e waste t o t h e f l y ash pond.
m ix ing t h e c a t i o n and anion bed regenera t ion wastes t o p rov ide t h e bu lk of t h e
n e u t r a l i z a t i o n . Two chemical feed systems a r e provided; c a u s t i c and a c i d dose
r a t e s were assumed t o be 0.5 and 0.05 g a l l o n s per thousand gal lons, respec t i ve l y .
Th is ope ra t i on i nvo l ves
F l o o r and yard d r a i n s a re t r e a t e d i n o i l separators and a re then coponded w i t h
t h e f l y ash. B o i l e r blowdown, f i r e s i d e washes. c o o l i n g tower bas in sludge, and
p y r i t e s a re a l s o coponded w i t h t h e f l y ash i n accordance w i t h t h e EPA low volume
waste exemption (23). Using t h e sludge volumes presented i n Table 4-23 and t h e
stream f lows shown i n F igu re 5-4, t h e t o t a l volume o f sludge s to rage requ i red f o r
these streams over a 30-year p l a n t l i f e i s about 187,000 c u b i c yards.
coal p i l e runo f f so l i ds , t h e t o t a l coponded low volume waste s ludge volume f o r 30
I n c l u d i n g
5-10
M A L PILE (MAXIMUM) RUNOFF
21 GPM YARQ DRAINS SEPARATION
RAPID-MIX TANK 55 GPH REGENERANT
103 GPM
1.6 MILLION GALWNS 4 TIMESIYEAR
IN-LINE NELITRALlZPITlON
5m.W GALWNS TWICE I3 YEARS
BASIN SWDOE
l0.m CU. YQS. I YEAR
F igure 5-4. Low Volume Waste Flowsheet for t h e Case 2 P l a n t
I i I
years of ope ra t i on i s approximately 303,000 c u b i c yards ( p y r i t e s to rage accounts
f o r 300,000 c u b i c yards o r 99 percent of t h i s t o t a l ) . Th i s volume i s s to red i n a
25-footP 295 ac re (7380 a c r e - f t ) f l y ash pond, s ized f o r 30-year ope ra t i on o f t h e
1000 MW s t a t i o n .
Th is p l a n t uses hyd roch lo r i c a c i d and ammonium bromate f o r b o i l e r chemical
c leaning.
c l a s s i f i e d as a RCRA-corrosive waste. N e u t r a l i z a t i o n i s accomplished us ing
t e m p o r a r i l y i n s t a l l e d equipment p rov ided by t h e b o i l e r c lean ing con t rac to r . The
a d d i t i o n a l cost, ove r t h a t f o r a b o i l e r c lean ing episode n o t r e q u i r i n g n e u t r a l -
i z a t i o n , i s t h e c o s t o f c a u s t i c requ i red t o n e u t r a l i z e 62,500 ga l l ons /yea r (one
500 MW b o i l e r volume) of h y d r o c h l o r i c a c i d s o l u t i o n .
dosage requ i red was 30 g a l l o n s per thousand g a l l o n s o f spent acid.
The a c i d stream must be n e u t r a l i z e d p r i o r t o coponding t o avo id being
The est imated c a u s t i c
Svstem cos ts
Table 5-3 p resents t h e cos ts associated w i t h low volume wastes f o r each t rea tment
process shown i n F i g u r e 5-4. Cap i ta l and O&M cos ts were ob ta ined by us ing t h e
design f low ra tes and system s i zes presented above and t h e data i n Sec t ion 4.
The incremental c o s t f o r coponding i s t h e major p o r t i o n of t h e c a p i t a l c o s t s f o r
low volume waste t rea tment and disposal a t t h i s p lan t . Because a l l of t h e low
volume wastes a r e coponded, 08M cos ts a r e minimal.
CASE 3. WESTERN COAL PLANT WITH DRY ASH HANDLING
F igu re 5-5 i s a diagram o f t h e Case 3 p lan t .
l oad s u b c r i t i c a l b o i l e r s burn ing Western low-sul fur . subbituminous coa l , It i s
s u b j e c t t o t h e 1979 NSPS f o r a i r emissions.
Raw water requ i res so f ten ing p r i o r t o use as p l a n t makeup. Mechanical d r a f t
c o o l i n g towers opera te a t t e n c y c l e s o f concen t ra t i on t o reduce water consumption
and t h e degree o f blowdown t rea tment requ i red t o operate t h e zero discharge
system.
p a r t i c u l a t e c o n t r o l . A l a n d f i l l i s used f o r disposal o f h igh volume wastes and
s o l i d low volume wastes.
as makeup water. Deminera l i zer regenerant and f i r e s i d e c lean ing wastes a re
impounded w i t h c o o l i n g tower blowdown p r i o r t o t rea tment by vapor compression
evapora t ion (VCE).
b o i l e r chemical c l e a n i n g waste.
T h i s s t a t i o n has two 500 MW base
No aqueous discharges are permi t ted .
A l i m e spray d rye r w i t h a baghouse i s used f o r s u l f u r d i o x i d e and
High q u a l i t y low volume wastes a re impounded t o recyc le
Separate evapora t ion ponds a re prov ided f o r VCE b r i n e and f o r
5-12
Treatment U n i t
O i l separat ion
In-1 i ne n e u t r a l i z a t i o n
cn Rapid-mix tank r n e u t r a l i z a t i o n w
Copondi ng
Tota l
Table 5-3
ESTIMATED TREATMENT SYSTEM COSTS FOR CASE 2 PLANT
Waste Stream
f l o o r and yard d r a i n s
waterside waste
deminera l izer regener ant
a1 1 wastes
1 Design Basis
2 1 gpm
500 gpm; dose r a t e o f 30 ga1/1000 gal
55 gpm. two feed; dose r a t e o f 0.5 and 0.05 g a l / 1000 gal
7380 acre-f t c l a y - l i n e d ash pond ( l o c a l ma te r ia l 1 (303,000 cub ic yard low volume waste ( increment 1
Reference F i a u r e
Ref (So)
4-12
4-4, 4-5
4-19
To ta l Annual Cap i ta l Operat ing 8
Reauirement Maintenance
$10,000 $1,000
- $2,000
$80,000 $42.000
$379.000 522.000
$469,000 $67,000
'The design bas i s f o r each t reatment system was used w i t h t h e cos t in format ion i n Sect ion 4 t o est imate c a p i t a l requirement and 08M c o s t s ( f i r s t qua r te r 1986 d o l l a r s ) .
' I ~I
0)
c1 .- r m c I Lz u) U m
2
2
xi a
L:
3
L
U
I
.r
r
m
0" c
L
a, +
In a, 3
.. + c m
m
m
a' a, u)
0
a, r
+
u- 0
E L 0) m
a
.- Y
8 Ez;
ln I
VI
al L 11 0)
U
.r
5-14
Low Volume Wastes and Treatment
F i g u r e 5-6 presents t h e low volume waste streams, f low rates, and t rea tment
processes f o r t h i s case. Ten low volume waste streams a r e produced i n t h e p lan t .
The sedimentat ion impoundment bas in f o r coal p i l e runoff i s designed t o ho ld 5.5
m i l l i o n g a l l o n s based on a 10-year storm event of 3 inches per 24 hour p e r i o d
(U) . The coal p i l e i s s ized fo r 90-day opera t ion a t 100 percent load and covers
75 acres. A c l a y - l i n e d impoundment w i t h a 15-foot water depth i s used t o s t o r e
t h e 24-hour runoff volume.
l i n e r mater ia l . No pH adjustment i s performed on t h e runof f . When t h e s o l i d s
have s e t t l e d , t h e overf low i s routed t o a h i g h q u a l i t y impoundment along w i t h
b o i l e r blowdown, skimmed f l o o r and yard drains, and d i s t i l l a t e recovered from
vapor compression evaporat ion (VCE). Water from t h i s impoundment i s reused as
c o o l i n g tower makeup water.
l i n e r , does n o t r e q u i r e groundwater mon i to r ing o r leachate c o l l e c t i o n , and has a
15- foot water depth.
s torage o f coal p i l e runoff, b o i l e r blowdown, drains, and VCE product w i t h a
combined f low of 1600 g a l l o n s per minute. An increment o f 4.7 m i l l i o n g a l l o n s o f
t h i s t o t a l a r e used f o r low volume waste s torage (VCE product i s n o t considered a
low volume waste).
A d e l i v e r e d c o s t of $ l lO/ ton was assumed f o r t h e c l a y
Th is impoundment has a s i n g l e f l e x i b l e membrane
It has a volume o f 12 m i l l i o n gal lons, s ized f o r 5 days
The deminera l i zer regenerant e q u a l i z a t i o n tank i s an epoxy-1 ined carbon s t e e l
tank equipped w i t h an a g i t a t o r .
u t i l i z i n g t h e mix ing of c a t i o n and anion bed regenera t ion wastes t o p rov ide t h e
bulk of t h e n e u t r a l i z a t i o n necessary t o meet RCRA c o r r o s i v i t y requirements.
25,000 g a l l o n tank prov ides an 8-hour residence t ime based on an average flow of
55 g a l l o n s per minute. No chemical a d d i t i o n i s prov ided t o f u r t h e r a d j u s t pH
s ince t h e water i s blended f o r recyc le/ reuse i n t h e p l a n t and i s n o t discharged.
T h i s system operates i n a f i l l -and-draw mode,
T h i s
The in te rmed ia te q u a l i t y impoundment i s used t o s t o r e deminera l i zer regenerants
f i r e s i d e wash water, and c o o l i n g tower blowdown p r i o r t o processing i n a vapor
compression evaporator (VCE).
normal c o o l i n g tower blowdown and deminera l i zer regenerant f low (assumed t o be
1000 and 55 g a l l o n s per minute, r e s p e c t i v e l y ) . and an a d d i t i o n a l 1.6 m i l l i o n
g a l l o n s of f i r e s i d e c lean ing waste produced from a s i n g l e b o i l e r c lean ing
episode.
and does n o t i n c l u d e groundwater m o n i t o r i n g o r leachate c o l l e c t i o n systems.
volume wastes account f o r o n l y 2.4 m i l l i o n g a l l o n s of t h e t o t a l impoundment
T h i s impoundment i s s i z e d t o handle 10 days of
T h i s 17 m i l l i o n g a l l o n impoundment has a s i n g l e f l e x i b l e membrane l i n e r
Low
5-15
OIL SEPAPATION
COOLING TOWER BLOWOOWN 1.mO GPM
W
L 1.6 MILLION GALWNS
I TIMESIVEAR
HIGH QUALIN TO COOLING IMPOUNDMENT TOWERS
INTERMEDIATE QUALIN
125.mO GALLONS
CLEANING WASTES
EVAPOPATION POND
22 GPM
1M CU. YDS.IYEAR
1 LANDFILL
TOBRINE CONCENTRATOR
Figure 5-6. Low Volume Waste Flowsheet f o r the,Case 3 P l a n t
volume: the re fo re t h e c o s t of low volume waste s to rage i s based on t h e c o s t
assoc ia ted w i t h t h a t incremental volume (i.e., 14 percent o f t h e t o t a l
imoundment c o s t ) .
The b o i l e r c lean ing waste impoundment i s a double- l ined evapora t ion pond which
meets RCRA requirements f o r hazardous waste s to rage (groundwater mon i to r i ng and
leacha te c o l l e c t i o n a re provided). B o i l e r chemical c lean ing wastes generate
about 125,000 g a l l o n s o f spent s o l v e n t and r i n s e s o l u t i o n every year and a h a l f .
Th i s evapora t ion pond has a volume o f 200,000 gal lons, w i t h a water depth o f 5
f e e t and an area of approximately 0.12 acres. Assuming an average n e t
evapora t ion r a t e of 2 g a l l o n s per minute per acre (40 inches per year) , l e s s than
one year i s requ i red t o evaporate 125,000 g a l l o n s of b o i l e r chemical c lean ing
waste.
A second evapora t ion impoundment i s used f o r u l t i m a t e disposal of VCE b r ine .
Although samples (Appendix B ) i n d i c a t e t h i s t o be a nonhazardous waste according
t o RCRA; an impoundment w i t h a s i n g l e f l e x i b l e membrane l i n e r and groundwater
mon i to r i ng and leachate c o l l e c t i o n systems i s provided. The impoundment i s s i zed
f o r a h i g h l y s a l i n e flow of 22 ga l l ons per minute w i t h an evapora t ion r a t e o f 1.5
g a l l o n s per minu te per acre ( 2 g a l l o n s p e r minu te per acre reduced by 25 percent
because of s a l i n i t y ) . T h i s r e s u l t s i n a 15 ac re evapora t ion impoundment; us ing a
5 f o o t l i q u i d depth, approximately 24 m i l l i o n ga l l ons o f s to rage i s provided.
C o l a n d f i l l i n g i s used f o r d ispos ing o f t h e low volume s o l i d wastes ( p y r i t e s ,
th ickened l i m e so f ten ing sludge, and c o o l i n g tower basin s ludge) w i t h coa l ash
and FGD waste. The incremental c o s t assoc ia ted w i t h c o l a n d f i l l i n g these wastes
i s based on i n c r e a s i n g t h e volume of a 203,000 c u b i c yard per year ash l a n d f i l l
by 3620 cub ic yards p e r year.
Svstem Cost5
Table 5-4 p resents t h e est imated cos ts associated w i t h t h e t rea tment processes
i d e n t i f i e d i n F igu re 5-6.
for c o o l i n g tower blowdown which i s n o t a low volume waste. However, an
evapora t ion pond f o r t h e VCE b r i n e i s f o r a low volume waste and i s inc luded i n
t h e cost.
system s i z e s presented above and t h e data i n Sec t ion 4 .
both t h e c a p i t a l and opera t ing cos ts i s t h e evapora t ion impoundment f o r VCE
b r ine . Therefore, reduc t ions i n t h e f l o w r a t e of t h i s stream would s i g n i f i c a n t l y
VCE cos ts a re n o t inc luded because t h e VCE i s requ i red
Cap i ta l and OAM cos ts were obtained by us ing t h e design f l ow ra tes o r
The major element of
5-17
Ln
r m
Treatment U n i t
Sedimentation impoundment
O i l separa t ion
High q u a l i t y impoundment
In te rmed ia te qual - i t y impoundment
Equa l i za t i on tank
Evaporat ion impoundment
Evaporat ion impoundment
L a n d f i l l
To ta l
Table 5-4
ESTIMATED TREATMENT SYSTEM COSTS FOR CASE 3 PLANT
Waste Stream
coal p i l e r u n o f f
f l o o r and yard d r a i n s
h igh q u a l i t y wastewater
recoverab le wastewaters
deminera l i zer regenerant
waters ide wastes
VCE b r i n e
so l ids. s1 udges
1 Design Bas is
5.5 ff i . 15-fOOtt c lay- l i n e d ( $ l l O / t o n )
21 gpm
12 f f i , 15-fOOt (4.7 ff i increment) s i n g l e FML l i n e r
17 MG, 5-fOOt (2.4 ffi increment) s i n g l e FML
25,000 gal epoxy-1 i ned carbon s tee l tank
200,000 gal. 5-fOOt double FML
24 MG. 5 - f O O t s i n g l e FML ( w i t h GW mon i to r and leachate c o l l e c t i o n )
zo3.000 cu yd /y r (3620 cu yd /y r i nc ranen t )
Reference F iau re
4-15
Ref (a)
4-17
4-16
4-18
4-16
4-16
4-26, 4-27
Tota l Annual Cap i ta l Operat ing 8
Reauirement Maintenance
$165,000 $18,000
$10.000 $1,000
$94.000 $8.000
$120.000 $8.000
$62,000 $12.000
$67,000 $12,000
$1,680,000 $1 04,000
$72,000 872.000
$2~270.000 $235 9 000
‘The design bas i s fo r each t rea tment system was used w i t h t h e cos t in fo rmat ion i n Sec t ion 4 t o es t imate c a p i t a l requirement and OBM cos ts ( f i r s t qua r te r 1986 d o l l a r s ) .
impact t h e o v e r a l l c o s t o f low volume waste t rea tment and d isposa l f o r t h i s
p l a n t .
doub le- l ined evapora t ion impoundment would be requ i red and t h e c o s t would
If t h e VCE b r i n e i s determined t o be a RCRA hazardous waste, a
~ increase accord ing ly .
CAS€ 4. WESTERN COAL PLANT W I T H WET ASH HANDLING
F i g u r e 5-7 i s a diagram of t h e Case 4 p lan t . Th i s s t a t i o n has two 5@@-MW base
load s u b c r i t i c a l b o i l e r s burn ing low s u l f u r sub-bituminous coal . It was b u i l t
p r i o r t o t h e 1979 NSPS f o r a i r emissions, and c o n t r o l s p a r t i c u l a t e s w i t h a wet
scrubber. No aqueous discharges a re permit ted. Raw water requ i res so f ten ing
p r i o r t o use as makeup.
stream a t t e n cyc les o f concen t ra t i on t o reduce water consumption and t h e degree
o f blowdown t rea tment requ i red t o opera te t h e ze ro discharge system. An impound-
ment i s used f o r disposal o f t h e ash and most o f t h e low volume wastes. High
q u a l i t y low volume wastes a re impounded t o r e c y c l e as makeup water. S u f f i c i e n t
area i s a v a i l a b l e f o r ponding; t he re fo re , water recovery processes, such as VCE
o r reverse osmosis, a r e n o t used. S o l i d and aqueous low volume wastes, and
c o o l i n g tower blowdown, a r e routed t o t h e f l y ash pond. An evapora t ion
impoundment i s p rov ided as u l t i m a t e d isposa l f o r wastewaters n o t consumed i n t h e
ash hand l i ng or wet p a r t i c u l a t e scrubber processes.
Mechanical d r a f t c o o l i n g towers produce a blowdown
I ow Vol u me Wast es and Treat-
F igu re 5-8 presents t h e low volume waste streams, f l o w rates, and t rea tment
processes se lec ted f o r t h i s case. Nine low volume waste streams a re produced i n
t h i s p lan t .
The sedimentat ion impoundment f o r coa l p i l e r u n o f f i s designed t o ho ld 5.5
m i l l i o n g a l l o n s based on a 10-year storm event o f 3 inches per 24-hour pe r iod
( l l z ) . The coa l p i l e i s s ized f o r 90-day opera t i on a t 100 percent load and covers
75 acres. A c l a y - l i n e d impoundment w i t h a 15- foo t water depth i s used t o s t o r e
t h e 24-hour r u n o f f volume. A d e l i v e r e d c o s t of $ l lO / ton was assumed f o r t h e
l i n e r ma te r ia l . No pH adjustment i s performed on t h e runo f f . When t h e s o l i d s
have s e t t l e d , t h e over f low i s rou ted t o a h i g h q u a l i t y impoundment along w i t h
b o i l e r blowdown, and skimmed f l o o r and yard drains. Water from t h i s impoundment
i s reused as c o o l i n g tower makeup water. Th is impoundment has a s i n g l e f l e x i b l e
membrane l i n e r , does n o t r e q u i r e groundwater mon i to r i ng or l eachate c o l l e c t i o n ,
and has a 15- foo t water depth. Sized f o r 10 days storage o f coal p i l e runof f ,
b o i l e r blowdown, and d r a i n s w i t h a combined f low of 624 g a l l o n s per minute, it
has a volume o f 9 m i l l i o n gal lons.
5-19
DRAFT COOLING BLOWDOWN
TURBINE/
WATER
n I I I \
ELECTROSTATIC PRECIPITATOR COAL BOILER I
1 BO+OM
ASH
1 FLY ASH
+ DISCHARGE
STACK
F i g u r e 5-7. Block Diagram of t h e Case 4 P l a n t : Western Coa l -F i red w i t h Wet Ash Handl ing
The deminera l i zer regenerant e q u a l i z a t i o n tank i s an epoxy-1 ined carbon s t e e l
t ank equipped w i t h an a g i t a t o r . Th i s system operates i n a f i l l -and-draw mode,
u t i l i z i n g t h e m i x i n g o f c a t i o n and anion bed regenera t ion wastes t o p rov ide t h e
bu lk o f t h e n e u t r a l i z a t i o n necessary t o meet RCRP c o r r o s i v i t y requirements. Th is
25,000 g a l l o n tank prov ides an eight-hour residence t i m e based on an average f l o w
of 55 g a l l o n s per minute. No chemical a d d i t i o n i s p rov ided t o f u r t h e r a d j u s t pH
s ince t h e water i s coponded and i s n o t discharged.
Deminera l i zer regenerant, f i r e s i d e and b o i l e r chemical c lean ing waste wash
waters, p y r i t e s , c o o l i n g tower bas in sludge, and s o f t e n i n g sludge a re coponded i n
a 25-fOOt deep. 150 ac re (3750 a c r e - f t ) f l y ash pond. The ash pond s i z e was
based on 30-year ope ra t i on of t h e 1000 Mw s t a t i o n w i t h 6.4 percent ash
subbituminous coa l . Coo l ing tower blowdown i s a l s o routed t o t h e ash pond.
Assuming a c o o l i n g tower blowdown f l ow o f 1000 g a l l o n s per minute, and
annua l i z ing t h e f i r e s i d e and b o i l e r chemical c lean ing waste wash volumes
produced, t h e t o t a l wastewater f low t o t h e f l y ash pond was est imated t o be 1100
g a l l o n s per minute. Using Tab le 4-23 and t h e stream f lows shown I n F i g u r e 5-8, t h e ash pond s to rage requ i red f o r t h e s o l i d s deposi ted by t h e low volume wastes
over a 30-year p l a n t l i f e i s about 115,000 c u b i c yards.
An evapora t ion impoundment i s p rov ided f o r u l t i m a t e d isposa l o f t he wastewater
n o t consumed by t h e ash hand l ing and wet scrubber systems (over f low from t h e f l y
ash pond).
impoundment. Based on a 2 g a l l o n s per minute per acre evapora t ion rate, a
30-acre impoundment was selected. Th is impoundment i s 5 f ee t deep w i t h a s i n g l e
f l e x i b l e wmbrane l i n e r and does n o t have groundwater mon i to r i ng o r l eacha te
c o l l e c t i o n systems.
low volume waste streams ( t h e remainder be ing c o o l i n g tower blowdown); therefore,
10 pe rcen t of t h e cos t of t h i s 30-acre evapora t ion impoundment was a t t r i b u t e d t o
low volume wastes.
A f l o w of 60 g a l l o n s p e r minu te was assumed as t h e i n f l u e n t t o t h i s
Ten percent of t h e f l o w t o t h e f l y ash pond i s made up of
Svstem Costs
Table 5-5 p resents t h e est imated c o s t s associated w i t h t h e low volume waste
management scheme shown i n F igu re 5-0. Cap i ta l and 0BM cos ts were obtained by
us ing t h e design flow ra tes o r system s i zes presented above and data i n Sec t ion
4. I n t h i s p lan t , t h e c o s t of impoundments make up t h e e n t i r e c a p i t a l and OBM
c o s t s assoc ia ted w i t h low volume waste t rea tment and d isposa l .
5-22
vl
N w
Treatment U n i t
Sedimentation impoundment
O i l seDaration
High q u a l i t y impoundment
Equa l i za t i on tank
Evaporat ion impoundment
Copondi ng
Tot a1
Table 5-5
ESTIMATED TREATMENT SYSTEM COSTS FOR CASE 4 PLANT
Waste Stream
coal p i l e r u n o f f
f l o o r and yard d ra ins
h igh q u a l i t y water
deminera l izer regener an t
excess s1 u i ce water
a l l o ther low volume wastes
1 Oesi gn Bas is
5.5 ffi, 15-f00t, c lay- l i n e d ( $ l l G / t o n )
2 1 SPm
9 ffis 15-foot s i n g l e FML
25.000 gal epoxy-1 ined carbon s tee l tank
49 m, 5-fOOt (4.9 MG increment) s i n g l e FML
3750 a c r e - f t pond (115.000 cub ic yard increment)
Reference F iau re
4-15
Ref (N)
4-17
4-18
4-16
4-19
To ta l Annual Cap i ta l Operat ing &
pea u i rement Maintenance
$165,000 $18,000
$10,000 $1.000
$180,000 $19,000
$62.000 $12,000
$245.000 $15.000
$144,000 $8,000
$806,000 $73,000
'The design bas i s f o r each t reatment system was used w i t h t h e cos t i n fo rma t ion i n Sec t ion 4 t o est imate c a p i t a l requirement and O&M cos ts ( f i r s t qua r te r 1986 d o l l a r s ) .
' I i I 1 '
CASE 5. EASTERN OIL PLANT
F igu re 5-9 i s a diagram o f t h e Case 5 p lan t .
l oad s u b c r i t i c a l b o i l e r s burn ing res idua l f u e l o i l . It i s sub jec t t o t h e c u r r e n t
NPOES requirements fo r aqueous discharges.
c o o l i n g water. An e l e c t r o s t a t i c p r e c i p i t a t o r i s used f o r p a r t i c u l a t e removal.
A l l aqueous low volume wastes are processed i n a phys ica l /chemical t rea tment
system. S o l i d wastes are disposed o f by a c o n t r a c t o r i n an o f f - s i t e l a n d f i l l .
Th is s t a t i o n has two, 250-MW base
Seawater i s used f o r once-through
Low Volume Wastes and T r e m
F igu re 5-10 presents t h e low volume waste streams, f low rates. and t rea tment
processes f o r t h i s p lan t .
s i x t rea tmen t u n i t s .
The p l a n t inc ludes s i x low volume waste streams and
An e q u a l i z a t i o n tank i s prov ided for f l o o r and yard drains, deminera l i zer
regenerant. and b o i l e r blowdown. One 2 m i l l i o n g a l l o n concre te sump i s designed
t o handle a f l ow o f 250 g a l l o n s per minute w i t h a res idence t ime o f 5 days.
E f f l u e n t from t h i s tank i s rou ted t o a 500 g a l l o n s per minute phys ica l /chemical
t reatment system; these streams r e q u i r e on ly minor pH adjustment and suspended
s o l i d s removal t o meet NPDES l i m i t s .
8-10 hours per day; however. ope ra t i ng t imes can be va r ied (which a f f e c t s
opera t ing l a b o r c o s t s and chemical i nven to r ies ) . E f f l u e n t from t h e t rea tment
system i s s to red i n one of two d ischarge impoundments u n t i l analyses i n d i c a t e
t h a t it meets pe rm i t requirements.
360,000 g a l l o n s w i t h a s i n g l e f l e x i b l e membrane l i n e r .
water depth of 15 fee t and are n o t equipped w i t h groundwater mon i to r i ng o r
leachate c o l l e c t i o n systems.
The t reatment system i s designed t o operate
Each d ischarge impoundment has a volume of
These impoundments have a
F i r e s i d e c lean ing wastes a r e s to red i n a separate e q u a l i z a t i o n tank p r i o r t o
phys ica l /chemical t reatment . These wastes r e q u i r e s i g n i f i c a n t pH adjustment and
s o l i d s separation, and must meet a s t r i c t e r s e t o f d ischarge requirements;
therefore, they a r e rou ted through t rea tment separately. The tank i s a 600,000
g a l l o n concre te sump. Spent chemical c lean ing wastes a r e a l s o s to red i n t h i s
impoundment p r i o r t o evaporat ion i n t h e b o i l e r . Operating c o s t s associated w i t h
t h i s tank were based on one-half of t h e normal annual expense because t h e systenl
i s used on ly du r ing b o i l e r c lean ing episodes.
Wastewater t rea tment sludge, produced by phys ica l /chemical t reatment of t h e low
volume wastes, i s c o l l e c t e d by a c o n t r a c t o r and taken t o an o f f - s i t e l a n d f i l l .
5-24
TURBINE I GENERATOR
1 t
I LANDFILL I
-
F i g u r e 5 4 . Block Diagram of t h e Case 5 P l a n t : Eastern O i l - F i r e d w i t h Once-Through Cool ing
ELECTROSTATIC OIL BOILER PRECIPITATOR -
I i I I I
EOUALIZATION TANK
BOILER BLOWDOWN -
FIRESIDE 4500W GALLONS WASTES 10 TIMES1 YEAR 1 W I
DISCHARGE PHYSICAL1
CHEMICAL IMPOUNDMENTS DISCHARGE TREATMENT
I
EVAPORATION 4-TzT-l
Figure 5-10. Low Volume Waste Flowsheet f o r the Case 5 Plant
I I I I I
Approximately 440 c u b i c yards per year of t h i s 35 percent s o l i d s sludge i s
generated: d isposal cos ts were est imated t o be $100 per cub ic yard.
& $ e m Cos&
Table 5-6 presents t h e estimated cos ts associated w i t h each low volume waste
t rea tment process i d e n t i f i e d i n F igu re 5-10. Cap i ta l and OAM cos ts were obta ined
by us ing t h e design f low ra tes o r system s izes presented above and i n Sec t ion 4.
The phys ica l /chamical t rea tment system i s t h e major c o s t component a t t h i s p lan t .
SUMMARY
A summary o f t h e est imated low volume waste management cos ts fo r t h e f i v e case
study p l a n t s i s presented i n Table 5-7. Th is t a b l e inc ludes t h e t o t a l c a p i t a l
requirement and annual d i r e c t opera t ing and maintenance cos ts fo r treatment,
storage. and d isposa l of t h e low volumes wastes generated a t each p lant . The
t o t a l c a p i t a l c o s t i s a l s o shown on a c o s t per k i l o w a t t bas is t o r e f l e c t t h e
generat ing capac i t y of t h e model p lants .
(Cases 1 through 4 ) a r e 1000-MW s t a t i o n s (two, 500-MW u n i t s ) , w h i l e t h e eastern
o i l - f i r e d s t a t i o n (Case 5) i s a 500-W s t a t i o n (two, 250-MW u n i t s ) . Annual
ope ra t i ng cos ts a re n o t presented on a per k i lowat t -hour bas is because t o t a l
annual c o s t s a r e l e s s than 0.1 mil/kWh i n a l l f i v e cases.
Note t h a t t h e four c o a l - f i r e d p l a n t s
Cases 1 and 2 a r e p l a n t s t h a t use a h igh-su l fu r Eastern b i tuminous coal and have
NPDES discharge pe rm i t s f o r aqueous wastes. The two western p lants , Cases 3 and
4, burn subbituminous coal and a r e zero discharge un i t s . The f i n a l model p lant .
Case 5, i s an eas te rn o i l - f i r e d s t a t i o n t h a t uses seawater as once-through
c o o l i n g water.
S i m i l a r i t i e s i n low volume waste management cos ts f o r these models. as shown i n
Table 5-7. are n o t a f u n c t i o n of pe rm i t requirements (NPDES versus zero d i s -
charge).
low volume waste management costs. The two ze ro d ischarge cases show a three-
f o l d cos t d i f f e rence . For these model cases, t h e pr imary fac to r a f f e c t i n g low
volume waste management cos ts i s t h e t ype of ash hand l ing employed.
procedures a f f e c t t h e cos ts because o f t h e a b i l i t y t o use coponding as a t r e a t -
ment/disposal o p t i o n f o r p l a n t s w i t h wet s l u i c i n g systems. The c a p i t a l and OAM
cos ts fo r t h e p l a n t s us ing coponding. Cases 2 and 4, were s i g n i f i c a n t l y lower
than those f o r t h e remain ing p lan ts . I n t h e t h r e e o the r p l a n t s t e i t h e r
phys ica l /chemical t rea tment p r i o r t o discharge o r ex tens ive evaporat ion pond area
was requi red.
The two discharge p lants , Cases 1 and 2. show a f i ve - fo ld d i f f e r e n c e i n
Ash hand l ing
5-27
Table 5-6
ESTIVATED TEEfiTVEhT SYSTEM COSTS FOR CASE 5 PLANT
L n
N m
T r e a t m n t . .
O i l separat ion
E q u a l i z a t i o n tank
Equal i z a t i c n waste impoundment
Fhysical /chen, ical t reatment
Discharge impoundmnt
L a n d f i l l
Evaporat ion
Tot61
Ir!aste Stream f l o o r and yard d r a i n s
cont inuous streams
b o i l e r c lsan- i n g wastes
a l l except waters ide
t r e a t e d water
so l ids, 51 udges
waters ide wastes
1 Design Gasis
2 1 gpn
2 kP. concrete sunp
600.000 g a l concrete sump
500 gpm system
two-360.000 g a l
s i n g l e FNL
440 cu yd/yr o f f - s i t e . %100/ton
15-foCt
20 gpN. (no storage)
Reference F i m
Ref EQ)
4-18
4-18
4-22, 4-23
4-11
4-26, 4-27
Table 4-42 Table 4-43
T o t a l Annual C a p i t a l Operat ing 8
Reouirement Maintenance
$10,000 $1,000
$400,000 531.000
%132.000 68,000
$1,300,000 $150.000
$58,000 $20.000
- $44,000
57.000 $5,000
$1,907,000 $262,00Q
'The design bas i s f o r each t reatment systenl was used w i t h t h e c o s t i n fo rma t ion i n Sec t i on 4 t o est imate c a p i t a l requiren,ent and O W cos ts ( f i r s t q u a r t e r 1986 d o l l a r s ) .
Ln I N (D
Table 5-7
SUMMARY OF ESTIMATED LOW VOLUME WASTE MANAGEMENT COSTS FOR FIVE CASE STUDY PLANTS
Model P l a n t
No. 1. Eastern Coal
- Two 500-Md u n i t s - Wet l imestone FGD system - Dry ash-handling - Nine LVW streams - NPDES discharge
No. 2. Eastern Coal - Two 500-Mw u n i t s
- Wet ash s l u i c i n g - E i g h t LVW streams - NPDES discharge
No. 3. Western Coal - Two 500-Mw u n i t s - Spray dryer/baghouse - Ten LVW streams - Zero discharge
No. 4. Western Coal - Two 500-Mw u n i t s - Wet p a r t i c u l a t e scrubber
- Nine LVW streams - Zero discharge
No. 5. Eastern O i l
- No FGD system
- NO FGD system
- Two 250-Mw u n i t s - ESP p a r t i c u l a t e c o n t r o l - once-through c o o l i n g - NPDES discharge
T o t a l Cap i ta l To ta l C a p i t a l Operat ing and
$ 2,360,000 2.4 $ 478,000
Reuui rement Reauirement ($/kw) Maintenance Cost
$ 4 7 0 ~ 0 0 0
$ 2,270,000
$ 806,000
$ 1.900,000
0.47
2.3
0.87
3.8
$ 67.000
$ 235,000
$ 73.000
$ 262.000
Since c u r r e n t Federal e f f l u e n t g u i d e l i n e d ischarge l i m i t s r e q u i r e zero d ischarge
o f f l y ash s l u i c e water, most new p l a n t s use dry f l y ash hand l ing systems.
Because t h e c o s t o f t h e f l y ash hand l ing system must be considered i n t h e
s e l e c t i o n o f t h e o v e r a l l p l a n t waste management system, savings represented by
u s i n g a wet ash hand l ing system a t a new p l a n t must be balanced by t h e r e s u l t i n g
c o s t s t o meet e i t h e r e f f l u e n t or zero discharge requirements f o r f l y ash s l u i c e
water.
The f i v e case s tud ies presented i l l u s t r a t e t h e use o f t h e desigh and economic
data inc luded i n Sec t ion 4. I n add i t ion . however, they i l l u s t r a t e two d i s t i n c t
approaches f o r low volume waste management. The f i r s t o f these invo lves con-
s t r u c t i o n of dedicated t rea tment o r d isposal f a c i l i t i e s f o r t h e low volume wastes
(as r e f l e c t e d i n cases 1, 3, and 5).
The second method employs codisposal o f low volume wastes w i t h h i g h volume
wastes.
aqueous wastes (such as c o o l i n g tower blowdown) o r c o l a n d f i l l i n g low volume
s o l i d s w i t h ash and/or s t a b i l i z e d FGD sludge.
c o s t s associated w i t h low volume waste management a r e assumed t o be an increment
o f those r e q u i r e d f o r c o n s t r u c t i o n and o p e r a t i o n of t h e h i g h volume waste t r e a t -
ment o r d isposal f a c i l i t i e s . Th is increment i s based on t h e f r a c t i o n of t h e
t o t a l volume or f low r a t e a t t r i b u t e d t o t h e low volume wastes. As a r e s u l t o f
t h e economies o f sca le and t h e small increments a t t r i b u t a b l e t o low volume
wastes, codisposal c o s t s a r e g e n e r a l l y much lower than t h e c o s t s f o r dedicated
t rea tment o r d lsposal . Consequently, t h i s approach i s economical ly a t t r a c t i v e i n
s i t u a t i o n s where h i g h volume waste d isposal methods a r e a p p l i c a b l e and codisposal
meets r e g u l a t o r y requirements.
T h i s may i n v o l v e coponding w i t h f l y ash, evaporat ion w i t h h igh volume
When t h i s approach i s used, t h e
The i n f o r m a t i o n i n t h i s s e c t i o n i s inc luded p r i m a r i l y as a gu ide t o t h e use o f
Sec t ion 4 and t o i l l u s t r a t e t h e two low volume waste management approaches
addressed above. I n add i t ion , s u f f i c i e n t d e t a i l i s prov ided i n Appendix E t o
a l low t h e user t o eva lua te a l t e r n a t i v e s t o t h e designs presented i n Sec t ion 4.
The o v e r a l l c o s t s presented f o r these model p l a n t s should n o t be used t o
determine t h e low vol ume waste t rea tment c o s t s associated w i t h s p e c i f i c p l a n t
types (e.g.. l o c a t i o n , f u e l supplies, d ischarge requirements, FGD requirements).
Rather, t h e c o s t e s t i m a t i n g methods i l l u s t r a t e d i n t h i s s e c t i o n should be used as
a gu ide t o e s t i m a t i n g c o s t s f o r i n d i v i d u a l s i t e - s p e c i f i c low volume waste
management c o n f i g u r a t i o n s .
5-30
Sect ion 6
GLOSSARY OF TEFW
Bppendix V I I I - - L i s t o f t larardous C o n s t w e n t s i n t h e
Regulat ions f o r I d e n t i f y i ng Hazardous Waste.
Ivironmental P r o t e c t i o n Agency
m - - E f f l u e n t l i m i t a t i o n s g u i d e l i n e s represent ing t h e degree o f e f f l u e n t reduc t ion
a t t a i n a b l e by t h e a p p l i c a t i o n of t h e bes t a v a i l a b l e technology economical ly
achievable.
CodisDoSt--Disposal o f two o r more s o l i d wastes i n t h e same f a c i l i t y . I n t h i s
repor t , t y p i c a l l y r e f e r r i n g t o codisposal of low volume waste and h i g h volume waste.
.€QI andf 11 1--Codisposal i n a 1 andf 11 1 . b p m l - - C o d i s p o s a l i n an impoundment (pond o r lagoon).
Corros iv i ty- -One o f t h e c h a r a c t e r i s t i c s f o r i d e n t i f y i n g a hazardous waste. A s o l i d
waste i s c o r r o s i v e i f it i s aqueous and has a pH l e s s than or equal t o 2 o r g r e a t e r
than o r equal t o 12.5.
GKA--Clean Water Act.
i o n unit--A dev ice used f o r n e u t r a l i z i n g wastes t h a t a r e
hazardous o n l y because they e x h i b i t t h e c h a r a c t e r i s t i c of c o r r o s i v i t y , and meets t h e
RCRA d e f i n i t i o n of tank, t r a n s p o r t v e h i c l e or vessel.
E h x M i y - - O n e of t h e c h a r a c t e r i s t i c s f o r i d e n t i f y i n g hazardous waste.
waste i s EP t o x i c if it i s ex t rac ted accord ing t o t h e procedure descr ibed i n
Appendix I1 of P a r t 261 of t h e Environmental P r o t e c t i o n Agency Regulat ions f o r
I d e n t i f y i n g Hazardous Waste, and t h e e x t r a c t c o n t a i n s contaminants l i s t e d i n Table 1
of P a r t 261 i n excess of t h e maximum concent ra t ion .
A s o l i d
EHKA--Federal Water P o l l u t i o n Contro l Act.
6-1
-dous waste--As defined i n Sect ion 261.3 of t h e Environmental P r o t e c t i o n Agency
Regulat ions f o r I d e n t i f y i n g Hazardous Waste.
L g n i t a b i l ity--One o f t h e c h a r a c t e r i s t i c s f o r i d e n t i f y i n g hazardous waste. A s o l i d
waste i s i g n i t a b l e i f it i s aqueous s o l u t i o n c o n t a i n i n g l e s s than 24 percent a lcoho l
by volume and has a f l a s h p o i n t l e s s than 60 degrees Cels ius, o r it i s a s o l i d and
capable of causing f i r e o r burn ing spontaneously.
- n---A p i p e i n which a c i d i c waste i s n e u t r a l i z e d . T h i s m e t s t h e
d e f i n i t i o n o f t o t a l l y enclosed t rea tment f a c i l i t y under t h e Environmental P r o t e c t i o n
Agency General Regulat ions f o r Hazardous Waste Management.
low volume w a s t e - - U t i l i t y wastes which a r e t reated, s t o r e d o r disposed o f and a r e
n o t h igh volume wastes such as ash (coal o r o i l ) o r sludges o r s o l i d s r e s u l t i n g from
f l u e gas c leaning.
L-me waste lre&oei&-The t rea tment descr ibed i n t h i s manual c o n s i s t i n g o f
methods t r e a t i n g low volume wastes i n an env i ronmenta l l y acceptable manner as
de f ined by c u r r e n t regu la t ions . The r e g u l a t o r y c r i t e r i a t h a t def ine environmental
a c c e p t a b i l i t y i n c l u d e e f f l u e n t l i m i t a t i o n s f o r t h e steam e l e c t r i c p o i n t source
category. federa l hazardous waste regu la t ions , and s t a t e s o l i d waste regu la t ions .
E R E - - N a t i o n a l P o l l u t a n t Discharge E l i m i n a t i o n System.
---A s o l i d waste d isposal f a c i l i t y t h a t does n o t p r o t e c t t h e environment
and which does n o t comply w i t h t h e Environmental P r o t e c t i o n Agency C r i t e r i a f o r
C l a s s i f i c a t i o n of S o l i d Waste Disposal F a c i l i t i e s and P r a c t i c e s (40 CFR P a r t 257).
.&&-Resource Conservation and Recovery Act.
React iv i ty - -One of t h e c h a r a c t e r i s t i c s f o r i d e n t i f y i n g hazardous waste.
waste i s r e a c t i v e i f it i s unstable and can undergo v i o l e n t change, r e a c t s v i o l e n t l y
w i t h water, generates t o x i c gases when mixed w i t h water i n a q u a n t i t y s u f f i c i e n t t o
present a danger t o human heal th . o r i s explos ive.
A s o l i d
- ~~
Santhry 1andfULcr-A s o l i d waste d isposa l f a c i l i t y which poses no reasonable - p r o b a b i l i t y o f adverse e f f e c t s on h e a l t h and t h e environment as def ined by t h e
Environmental P r o t e c t i o n Agency C r i t e r i a f o r C l a s s i f i c a t i o n o f S o l i d Waste Disposal
F a c i l i t i e s and P r a c t i c e s (40 CFR P a r t 257).
6-2
S o l i d wasts--As de f ined i n Sect ion 261.2 o f t h e Environmental P r o t e c t i o n Agency
Regulat ions f o r I d e n t i f y i n g Hazardous Waste.
S u b t i t l e C--Statutes on Hazardous Waste Management under RCRA.
S u b t i t l e D--Statutes on Sta te or Regional S o l i d Waste Plans under RCRA.
X E - - T o x i c i t y C h a r a c t e r i s t i c Leaching Procedure.
!da.b--A m a t e r i a l which i s discarded, served i t s intended purpose, or i s a
manufactur ing o r min ing by-product.
i n wastewater e f f l u e n t s .
Does n o t i n c l u d e s o l i d s or d isso lved m a t e r i a l s
W a t e r - - A q u e o u s waste: t y p i c a l l y r e f e r r e d t o when t h e waste i s t r e a t e d i n a
wastewater t rea tment u n i t f o r discharge.
i k & w a t e r s l u & ~ - The semi-so l id m a t e r i a l s r e s u l t i n g from t rea tment o f wastewaters
i n a wastewater t rea tment u n i t ,
6 - 3
Sect ion 7
REFERENCES
1.
2.
3.
4.
5 .
6.
7.
8.
9.
10.
11.
12.
13.
E l e c t r i c Power Research I n s t i t u t e . o f U t i l i t v Low Volunw &&a?. CS-3737, Radian Corporation, May 1985.
L.J. Holcombe. G.P. Behrens, and R. Komai. "Treatment and Disposal of Low Volume U t i l i t y Wastes." F o s s i l Power P l a n t Water Management. Orlando, F lo r ida . February 1986.
G.P. Behrens, J.E. Harwood. and D.P. Roche. "Ash Pond Equivalency fo r Trea t ing B o i l e r Cleaning Wastes." Presented a t t h e EPRI Symposium on Advances i n F o s s i l Power P l a n t Water Management. Orlando, F lo r ida , February 1986.
L.J. Holcombe, G.P. Eehrens, and W.C. M i c h e l e t t i . "Comparison of Treatment Methods f o r U t i l i t y Metal Cleaning Wastes." Summer Nat ional Meeting, Boston, Massachusetts, August 1986.
Environmental P r o t e c t i o n Agency. D-
w. EPA 440/1-80/029-br September 1980.
Code o f Federal Regulat ions, 40 CFR P a r t 261. Hazardous Waste. J u l y 1. 1985.
TRW. Inc. from Steam - F l e c t r i c Power P l a n k - I b B P r e c i s i o n and B ias of MethQds f o r Cheuical Andy.&.. CS-3744. E l e c t r i c Power Research I n s t i t u t e , November 1984.
J.K. Rice and S.D. Strauss. "Water-Pol lut ion Contro l i n Steam Plants. l f m. 120 (4). A p r i l 1977.
Babcock and Wilcox Company. York: The Babcock and Wilcox Company, 1972.
Code of Federal Regulat ions, 40 CFR P a r t 423. Generating P o i n t Source Category. Revised as o f J u l y 1, 1985.
E l e c t r i c Power Research I n s t i t u t e . M a w a l on C h S ! & a l Cleaning-Qf F o s s i l - Fueled Shxa G e n e r v . CS-3289, Sheppard T. Powell Associates. January 1984.
Code o f Federal Regulat ions, 40 CFR P a r t 261. Hazardous Waste. P a r t 261.4, Exclusions.
Presented a t t h e EPRI Symposium on Advances i n
Presented a t the AIChE 1986
t i o n s Guidel ines a n d a r d s f o r t h e Steam F k L r i c P-
I d e n t i f i c a t i o n and L i s t l n g of Appendix II - EP T o x i c i t y Test Procedure, Revised as o f
Stsam/Its Generation ami.!kQ . New York, New
Steam E l e c t r i c Power
I d e n t i f i c a t i o n and L i s t i n g o f
, Gary D i e t r i c h . L e t t e r addressed t o Mr . Paul Emler o f t h e U t i l i t y S o l i d Waste A c t i v i t i e s Group on January 13, 1981.
7-1
14. Environmental P r o t e c t i o n Agency. T o x i c i t y C h a r a c t e r i s t i c Leaching Procedure
Th is procedure i s a l s o presented (TCLP). Revised d r a f t procedure dated October 4, 1985, Method 13xx ( i nc ludes cho ice o f two e x t r a c t i o n media). i n t h e January 14, 1986 Federal Register.
=CT P e r m i k . SW-966, Prepared by t h e O f f i c e o f S o l i d Waste and M i t r e Corp., J u l y 1983.
15. Environmental P r o t e c t i o n Agency. G u i d a n c e u a l f o r Hazardcu%U&
16. E l e c t r i c Power Research I n s t i t u t e . I s c h i c a l . P-2410-SR9 1981 E d i t i o n .
17. Uni ted S ta tes Department o f Commerce. " R a i n f a l l Frequency A t l a s of t h e Uni ted States." Technical Paper No. 40, May 1961.
18. Richardson Engineer ing Services, Inc. Process P l a n t C o m l z u t i o n Fs- Standards. Vol 1-4, Richardson Engineer ing Services, Inc., 1986.
19. R.S. Means Company, Inc. i$?.ms S i t e WQrk Cost Data 1986 . R.S. Means Company, Inc., 1985.
. Solana 20. K.M. Guthr ie . m c e s s P l a n t F s t w Fval- and C W Beach, C a l i f o r n i a : Craftsman Book Company of America. 1974.
21. M.S. Peters and K.D. Timmerhaus. -anics for C h e m i d b a i n e e r s . New York, New York: McGraw-Hill Book Company. 1980.
22. h i c a l . Schnel l Pub l i sh ing Company. February, 1986.
23. Memorandum from S t e f f e n W . Olehn, Deputy Ass i s tan t EPA Admin i s t ra to r f o r S o l i d Waste, and R. Sarah Compton, Deputy A s s i s t a n t EPA Admin i s t ra to r f o r Water Enforcement t o Regional D i r e c t o r s - A i r and Hazardous M a t e r i a l s D iv i s ion , "EPA Regulat ion of U t i l i t y Wastestt, February 189 1981.
F a c i l i t i e s . CS-2557, SCS Engineers, August 1982. 24. E l e c t r i c Power Research I n s t i t u t e . M a u a l f o r UD~.L&&!. F x i s t i n g Disoosal
. . 25. W.B. Kayes. € c u h & t i o n of L i n i w f o r Reservoirs. T a m and P o l l u t i a n
Con t ro l F a c i l i t i e s . Wiley, 1977.
26. E l e c t r i c Power Research I n s t i t u t e . &l Ash R m o s a l Manud. . FP-1257. G A I Consultants, Inc.. December 1979.
27. J . Rossof and R.C. Rossi. Disposal o f By-Products from Non-Regenerable F lue Gas D e s u l f u r i z a t i o n Systems. EPA-650/2-74-037-a, The Aerospace Corporation, May 1974.
28. Personal Communication w i t h L.L. Zimmerman, Radian Corp., September 3, 1986.
29. E l e c t r i c Power Research I n s t i t u t e . -ion of Trace s w i t h Iron. CF-1513, Brown and Caldwell , September
1980.
30. R.G. Kunz, J.F. G ianne l l i , and H.D. Stensel. Vanadium Removal from I n d u s t r i a1 Wastewaters." Presented a t t h e 30 th I n d u s t r i a l Waste Conference, Purdue Un ive rs i t y , May 1975.
7-2
31.
32.
33.
34.
35.
36.
37.
38.
39.
40.
41.
42.
43.
4 4 .
45.
46.
41.
Nor th Dakota M in ing and Minera l Resources Research I n s t i t u t e . S o l i d Wastc &disposal Screening-5t& . D r a f t r e p o r t for Gas Research I n s t i t u t e , May 1986.
Personal Communication, S.J. Galegher (Radian Corpora t ion) w i t h CECOS I n t e r n a t i o n a l , June 16, 1986.
Personal Communication. S.J. Galegher (Radian Corpora t ion) w i t h American Waste Processing (Chicago), June 16, 1986.
Personal Communication, S.J. Galegher (Radian Corpora t ion) w i t h ENSCO ( L i t t l e Rock, Arkansas), June 16, 1986.
Personal Communication. S.J. Galegher (Radian Corpora t ion) w i t h Chem-Met Services (Michigan). June 16, 1986.
Report and Technical S tud ies on t h e Disposal and U t i l i z a t i o n o f F o s s i l Fuel Combustion By-Products. Submitted by t h e U t i 1 i t i e s Sol i d Waste A c t i v i t i e s Group, t h e Edison E l e c t r i c I n s t i t u t e , and t h e Na t iona l Rural E l e c t r i c Cooperat ive Assoc ia t ion t o t h e Un i ted Sta tes Environmental P r o t e c t i o n Agency, Volume 11, Appendix E. October 26, 1982.
C.W. Jones, e t . a l . "Disposal of Waste Ammoniacal Bromate and Ammonium B i f l u o r i d e So lu t i ons by Evaporation." Presented a t t h e 3 7 t h Annual Meeting. I n t e r n a t i o n a l Water Conference, P i t t sburgh, PA, October 1976.
A.V. Sisson and G.V. Lee. " I n c i n e r a t i o n Safely Disposes o f Chemical Cleaning Solvents." Proc. Am. Power Conf . 34, Chicago, IL, 1972.
E.C. Wackenhuth, e t a l . "Use and Disposal o f B o i l e r Cleaning Solvent." Power Fngine 77(11), November 1973.
A.J. OfNeal. Jr., e t a l . "Experimental I n c i n e r a t i o n o f B o i l e r I n t e r n a l Cleaning So lvent a t Long I s l a n d L i g h t i n g Co." 1971.
T.F. Ha l l a ren . " I n c i n e r a t i o n o f B o i l e r Cleaning Chelate Wastes." Materials Per formane, NACE 21(4) , A p r i l 1982.
Personal Communication, G.P. Behrens (Radian Corpora t ion) w i t h Ambrose Selker, Combustion Engineering, Nov. 21, 1985.
Personal Communication. G.P. Behrens (Radian Corpora t ion) w i t h A1 Banweg, Babcock and Wilcox, Nov. 12, 1985.
P.J. Champange and B.K. Faker. "On-Stream Chemical Cleaning of B o i l e r Tubes." Presented a t t h e EPRI Symposium on Advances i n F o s s i l Power P l a n t Water Management, Orlando, F lo r i da , February 1986.
P.P. Lalena. "Waste Treatment f o r a P r o f i t . " Water - 1971 . AICHE Symposium Series, 178, Vol. 74, Gary F. Bennett. e d i t o r , 1978.
- Power P l a n t S l u d w . N.E. B e l l , e t a l . S o l i d i f i c a t i o n o f Low Volume CS-2171, RP 1260-20, December 1981.
R. Chiesa and D. Sloat. "Recycle and Reuse o f Power P l a n t Low-Volume Wastewaters." Presented a t t h e EPRI Symposium on Advances i n F o s s i l Power P l a n t Water Management, Orlando. F lo r i da . February 1986.
49(4). October
. . .
7-3
48. S.J. Galegher and G.P. Behrens. h a p o r a t i o n F n h u e m e n t Study . Prepared
49. Code of Federal Regulat ions, 40 CFR P a r t 60. New S ta t i ona ry Sources Performance Standards; E l e c t r i c U t i l i t y Steam Generating Un i t s . o f June 11, 1979.
for WEST Associates, Radian Corp., May 23, 1986.
Revised as
50. Personal Communication, G.P. Behrens (Radian Corpora t ion) w i t h John Davis, Rowan and Associates, r e : Coalescing P l a t e Separator c a p i t a l and opera t i ng costs, Aug. 22, 1986.
.
7-4
Appendix A
SAMPLING AND ANALYSIS OF LOW
VOLUME WASTES AT FOSSIL FUEL-FIRED POWER PLANTS
i
CONTENTS
Summary Table A-1
P l a n t : A
Plant : 8
P lan t : C
P l a n t : D
P lan t : E
P l a n t : F
P l a n t : G
P l a n t : H
P lan t : I Plant : J
Plant : K
P lan t : L
P lan t : M P l a n t : N
P lan t : 0
P l a n t : P
P l a n t : Q
Plant : R Plant : S P l a n t : T
P l a n t : U
Ease A-2
A-6
A-11
A-15
A-19
A-24
A-26
A-30
A-35
A-39
A-44
A-49
A-53
A-56
A-59
A-62
A-64
A-67
A-68
A-69
A-70
A-74
A-iii
SAMPLING AND ANALYSIS OF LOW VOLUME
WASTES AT FOSSIL FUEL-FIRED POWER PLANTS
Dur ing 1985 and 1986, 21 e l e c t r i c - g e n e r a t i n g s t a t i o n s were v i s i t e d .
waste samples were c o l l e c t e d and analyzed. and i n s i g h t i n t o t h e management o f low
volume wastes was s o l i c i t e d from p l a n t personnel. The a n a l y t i c a l r e s u l t s and
in fo rma t ion ob ta ined from i n t e r v i e w s w i t h p l a n t personnel were compiled i n t o
sampling and a n a l y s i s r e p o r t s f o r each p lan t . Table A-1 summarizes t h e waste
streams cha rac te r i zed d u r i n g these v i s i t s .
p rov ides d e t a i l s f o r each p l a n t concerning t h e low volume waste management plan,
sampling and a n a l y s i s r e s u l t s and b r i e f d iscuss ions o f t h e r e s u l t s .
con ta ins a complete t a b u l a t i o n o f t h e a n a l y t i c a l resu l t s .
Low volume
The remainder o f t h l s appendix
Appendix B
A- 1
EFRI Data m Rec i on
A West
B
C
D
E
F
Northeast
Table A-1
Lmi VOLUKE WASTES COLLECTED AND ANALYZED
w Gas
O i l
West Gas
Nor theast O i l
South Cent ra l Gas
West. O i l
SaKiDl€
f i r e s i d e waste t r e a t e d f i r e s i d e e f f l u e n t EDTA waste t r e a t e a EDTA e f f l u e n t combined s o l i d s
H C l waste n e u t r a l i z e d HC1 r i n s e water soda ash r i n s e sludbe from bas in t r e a t e d HC1 e f f l u e n t
ammonium broclate waste HC1 waste pond water pond s o l i &
f i r e s i d e waste c l a r i f i e r supernate sludge s o l i d s c l a r i f i e r underflow
c i t r a t e waste
HAF composite waste t r e e t e d HAF e f f l u e n t c l a r i f i e r under f low
.I&$!!?
A- F A-F A-V A-V A-S
E-HC1 B-HC1 6-R €-SA 6-S E-Ef
C-E r C-HC1 c-P c-s
E-F 0-TkO E-S D-TkU
E-C
F-HAF F-Ef F-S
Comments
c a u s t i c t rea tment p reopera t iona l c l e a n i n g 1 ime and c a u s t i c t rea tment from t rea tments
b o i l e r cherrical c l e a n i n g pH 6 f i r s t water r i n s e
taken a f t e r l a s t waste f i l t e r e d e f f l u e n t
t o i l e r chemical c l e a n i n g b o i l e r c h e s i c a l c l e a n i n g combined washwaters sludge from pond
f e r r o u s s u l f a t e , 1 ime t reat tvent vaccurli f i l t e r percent s o l i d s on ly
evaporated
hydroxyacet ic / fo rmic and r i n s e s l i m e a d d i t i o n t rea tment s ludge
Table A-1 (Continued)
LOW VOLUME WASTES COLLECTED AND ANALYZED
EPRI Data EEiLLL Reoion €!El Samole G West
J
O i l composite waste t r e a t e d e f f l u e n t t rea tment sludge HC1 waste ammonium bromate waste water r i n s e hydraz ine r i n s e
Southeast Coal ammonium bromate waste HC1 waste n e u t r a l i z e d HC1 pond water
Southeast Coal HC1 waste HC1 waste t r i s o d i u m phosphate r i n s e coal p i l e r u n o f f ash pond water ash pond water ash pond water ash pond water ash pond water ash pond water
Coal EDTA waste t h i c k e n e r be fore th i ckener a f t e r pond be fore pond a f t e r coal p i l e r u n o f f
West Cent ra l
€Q&
G-Cmp G-E f G-S G-HC1 G-Br G-R G-Hy
H-Br H-HC1 H-HC1 -N H-P
I-HC11 I-HC13 I-TSP
I-CPR I-P-1 I - P t .2 I - P t l I -P t2 I-P+3 I -P t4
J-V J-TkU-1 J-TkUt1 J-P-1 J - P t l J-CPR
Comments Bromate, HC1 and r i n s e s l ime a d d i t i o n
b o i l e r chemical c lean ing b o i l e r chemical c lean ing
p a s s i v i z a t i o n step
b o i l e r chemical c lean ing b o i l e r chemical c lean ing i n - l i n e c a u s t i c a d d i t i o n mixed wastes and r i nses
from u n i t 1 from u n i t 3 from u n i t 1
from c o l l e c t i o n bas in p r i o r t o a c i d waste 2 hours a f t e r discharge 1 day a f t e r d ischarge 2 days a f t e r discharge 3 days a f t e r discharge 4 days a f t e r discharge
b o i l e r chemical c lean ing p r i o r t o EDTA a d d i t i o n a f t e r EDTA a d d i t i o n be fo re EDTA a d d i t i o n one week a f t e r EDTA a d d i t i o n from c o l l e c t i o n bas in
EhKt
K
L
M
N
0
P
EPRI Data Reoion
Nor theas t
East Cent ra l
West
West
West
East Cent ra l
Table A-1 (Continued)
LW VOLUME WASTES COLLECTED AND ANALYZED
w O i l
Coal
Coal
Coal
Coal
Coal
-- a i r preheater waste’ K-APr t r e a t e d a i r preheater K-TkO pond e f f l u e n t K-P th i ckener underf low K-TkU ESP wash s o l i d s K-ESP
EDTA waste L-V coa l p i l e r u n o f f L-CPR
b r i n e concent ra te r e j e c t M-BCR evaporat ion pond l i q u i d M-P evaporat ion pond s o l i d s M-S
wastewater N-WW product water N-Prod b r i n e concent ra te r e j e c t N-BCR b r i n e concent ra te r e j e c t N-S p y r i t e s N-Py
b r i n e concent ra te r e j e c t GBCR evaporat ion pond l i q u i d 0-P evaporat ion pond s o l i d s 0-S p y r i t e s 0-PY
c i t r a t e waste P-c f i r s t r i n s e P-R ash pond water P-P-1 ash pond water P-P+2 ash pond water P-P+4 ash pond water P-P+7 ash pond water P-F+14
- f i l t e r e d and u n f i l t e r e d c a u s t i c a d d i t i o n th i ckener over f 1 ow
evaporated Powder R i v e r coa l
l i q u i d phase
feed t o b r i n e concent ra to r b r i n e concent ra to r product l i q u i d phase concent ra to r s o l i d s
s l u r r y
b o i l e r chemical c lean ing waters ide p r i o r t o c i t r a t e waste 2 days a f t e r d ischarge 4 days a f t e r d ischarge 7 days a f t e r d ischarge 14 days a f t e r d ischarge
I I I
EPRI Data ElaZ EUel Q Northeast Coal
R Nor theast Coal
Table A - 1 (Continued)
LCW VOLUME KASTES COLLECTED AND ANALYZED
S Nor theast Coal
T Nor theast Gas/o i l
U East Cent ra l Coal
S a m o l e G Q L k
moistened f l y ash (1-FA p y r i t e s from p u l v e r i z e r Q-Py
f l y ash from pond R-FA bottom ash from pond R-BA p y r i t e s from p u l v e r i z e r R-Py
f l y ash from s i l o s S-FA p y r i t e s from p u l v e r i z e r S-Py
Comments
f i r e s i d e waste T-F+I c o l l e c t e d a f t e r 1 hour f i r e s i d e waste T-F+16 c o l l e c t e d a f t e r 16 hours c l a r i f i e r over f low T-TkO 16 hour sample f i l t e r so l i d s T-S
EDTA waste u-v evaporated r i n s e water U-R waters ide r i n s e hydroxy a c e t i c / f ormic U-HAF b o i l e r chemical c lean ing
' I I / I , I
PLANT A
Samples o f raw and t r e a t e d f i r e s i d e wastewater, e thy lene d iam ine te t raac id i c a c i d
(EDTA) s o l u t i o n (raw and t r e a t e d ) f rom b o i l e r chemical cleaning, and a combined
sludge from t h e t rea tment process were ob ta ined i n March o f 1985 o f P l a n t A.
PLANT OESCRIPTIOM
The u t i l i t y s i t e i s l o c a t e d i n t h e West EPRI Data Region and has f o u r o i l and gas
b o i l e r s which c u r r e n t l y burn gas. Low volume wastes a re t r e a t e d on s i t e us ing
c a u s t i c and l i m e i n a u t i l i t y owned f a c i l i t y .
f i r e s i d e wastewater was being processed.
an EDTA b o i l e r c lean ing s o l u t i o n from another p l a n t which does n o t have a t r e a t -
ment f a c i l i t y .
Dur ing t h e sampling period,
One o f t h e f o u r h o l d i n g ponds contained
F i r e s i d e washing occurs about t w i c e a year, producing up t o 150,000 g a l l o n s per
100 MI cleaned. The waters ide o f t h e b o i l e r tubes a r e cleaned every f o u r years
and generate approximately 80,000 g a l l o n s o f wastewater per b o i l e r .
WASTE MANAGEMENT
F igu re A-1 p resents a general schematic of t h e t rea tment system a t P l a n t A.
i n d i c a t e d i n t h e f i g u r e a re t h e sampling p o i n t s around t h e system. The gas s i d e
of t h e b o l l e r and t h e a i r preheater a re washed w i t h h igh pressure water which i s
c o l l e c t e d i n t renches around t h e furnace bottom, and conveyed v i a i n t e r n a l and
ex te rna l sumps t o h o l d i n g ponds. There are f o u r ponds: two dedicated t o metal
c lean ing wastes and two f o r o t h e r low volume wastes.
l y 700,000 g a l l o n s each and have a s p h a l t i c l i n e r s .
A l so
The ponds ho ld approximate-
Wastewater f rom t h e ponds i s pumped t o t h e t rea tment system where t h e pH i s
ad jus ted i n a r a p i d mix tank. The pH i s ra i sed t o 10.5 w i t h c a u s t i c f o r gas s ide
washes, and t o 13 w i t h c a u s t i c and l i m e f o r waterside chemical washes. The
e leva ted pH p r e c i p i t a t e s d i sso l ved metals as hydroxides.
chelates, an a d d i t i v e may be used t o break t h e metal-chelate bond. WL 1218 frcm
Dowel1 i s c u r r e n t l y be ing used. The pH-adjusted stream en te rs t h e r e a c t i v a t o r
where t h e p r e c i p i t a t i o n r e a c t i o n s occur fo l l owed by polymer a d d i t i o n t o e f fec t
f l o c c u l a t i o n and then c l a r i f i c a t i o n . The r e a c t i v a t o r volume i s approximately
30.000 g a l l o n s w i t h a f l o w r a t e between 25 and 40 gpm.
For wastes w i t h
Excess sludge i s pumped from t h e r e a c t i v a t o r t o t h e th i ckener and then f i l t e r e d
i n a press p r i o r t o disposal . The sludge i n t h e system i s a r e s u l t o f numerous
A-6
CAUSTIC
ANTHRACITE
BOILER CLEANING
WASTE
LOW VOLUME WASTE
E THICKENER
SAMPLING -0 POINT
FILTER PRESS
80% F I L T E ~ CAKE TO HAZARDOUS LANDFlLl
F igure A - I . P l a n t A Low Volume Waste Treatment System
I i I
cleansings. I n d i v i d u a l c leansings do no t war ran t opera t ing t h e th i ckener o r
f i l t e r press.
t h e l i q u i d waste being processed.
con t rac to r as a s t a t e hazardous waste.
Consequently, t h e s o l i d s composit ion i s n o t d i r e c t l y comparable t o
The sludge i s drummed and disposed o f by
The overf low from t h e r e a c t i v a t o r i s pH ad jus ted t o near neut ra l , f i l t e r e d
through a n t h r a c i t e t o a t u r b i d i t y of l e s s than 1 NTU, and then routed t o a
ho ld ing pond.
l e s s than one m i l l i g r a m per l i t e r (mg/L), t o t a l suspended s o l i d s (TSS) l e s s than
30 mg/L. and o i l and grease l e s s than 20 mg/L), t h e water I s reprocessed. When
t h e l i m i t s a r e met, t h e water i s discharged i n t o t h e ocean. For wastes w i t h
chelates, an a d d i t i v e MY be used t o break t h e meta l -chelate bond. DWL 1218 from
Dowel1 is c u r r e n t l y be ing used.
If t h e q u a l i t y does no t meet t h e discharge l i m i t s ( i r o n and copper
SAMPLES COLLECTED
Samples were c o l l e c t e d on March 15. 1985. A t t h a t time, f i r e s i d e wastewater was
being processed from t h e c lean ing of a gas u n l t .
p o i n t s 2, 3, 4, and 5 as shown i n F igu re 1. Samples 2, 4, and 5 were analyzed
ex tens i ve l y as they represent t h e raw waste, t rea tment sludge. and t r e a t e d
discharge, respec t i ve l y . They were coded as A-F2. A-F4, and A-F5, fo r P l a n t A.
Sample 3 was n o t analyzed.
Samples were obta ined f rom
A separate ho ld ing pond conta ined approx imate ly 700,000 g a l l o n s o f waters ide
wastewater from another p lan t .
c lean ing o f a b o i l e r and had a h igh o i l and grease l e v e l along w i t h che la ted
meta ls i n an EDTA s o l u t i o n . A sample o f t h e un t rea ted waste was c o l l e c t e d from
t h e ho ld ing pond. sampling p o i n t 1. A t a l a t e r date, p l a n t personnel c o l l e c t e d a
t r e a t e d sample a t p o i n t 3.
The wastewater was from t h e preopera t iona l
DISCUSSION OF RESULTS
The sample r e s u l t s from t h e P l a n t A t rea tment system are presented i n Appendix B.
It should be emphasized t h a t a l l o f these samples were taken as grabs; therefore,
t hey do n o t represent an average e f f l u e n t q u a l i t y .
e f f l u e n t i n t h e f i n a l ho ld ing bas in t o check on t h e water q u a l i t y before d is -
charge.
The u t i l i t y moni tors t h e
Samples A-F2 and A-F5 a r e t h e raw and t r e a t e d f i r e s i d e wastewaters. The raw
f i r e s i d e wastewater conta ins i r o n and n i c k e l a t l e v e l s above one mg/L. Most o f
t h e t r a c e meta ls a re removed. t o sane extent, by t h e c a u s t i c treatment. S l i g h t
A-8
increases o f vanadium, lead, and molybdenum concentrat ions i n t h e t r e a t e d water
may be due t o t h e nature o f t h e grab samples s ince they were obta ined near t h e end o f t h e t reatment process; o r t h e increase may be due t o imprec is ion i n t h e
a n a l y t i c a l procedures. The sodium l e v e l increase i s due t o c a u s t i c add i t i on ,
w h i l e h igher s u l f a t e l e v e l s a r i s e from pH n e u t r a l i z a t i o n .
The i r o n concen t ra t i on i n t h e t r e a t e d f i r e s i d e waste (A-F5) i s above t h e d i s -
charge l i m i t . T h i s cou ld be due t o an upset i n t h e t reatment system; however,
t h e r e a c t i v a t o r overf low, t h e f i r s t sampling p o i n t f o l l o w i n g c a u s t i c add i t i on ,
had a pH o f 10.6 which i s adequate f o r e f f e c t i v e i r o n removal. The h igh i r o n
l e v e l c o u l d a l s o be due t o s o l i d s c a r r y over from t h e r e a c t i v a t o r and a n t h r a c i t e
f i l t e r . The copper l e v e l i n both samples i s q u i t e low. N icke l hydroxide i s
f a i r l y s o l u b l e as evidenced by t h e r e l a t i v e l y poor n i c k e l removal.
Samples A-V1 and A-V3 a re t h e raw and p a r t i a l l y t r e a t e d EDTA c lean ing so lu t i ons .
Fu r the r t reatment o f t h i s stream occurs when t h e pH i s ad justed t o near n e u t r a l
p r i o r t o discharge. Dur ing pr imary t reatment o f these wastes, l i m e and c a u s t i c
a r e both used t o ma in ta in a h i g h pH (12-13). The t r e a t e d sample has a g r e a t l y
reduced i r o n l e v e l . The copper concen t ra t i on shows an increase w i t h t reatment
and i s above t h e discharge l i m i t . T h i s i s probably due t o d i s s o l u t i o n o f copper
s o l i d s i n t h e r e a c t i v a t o r sludge as a r e s u l t of t h e h igh l e v e l o f f ree EDTA l e f t
a f t e r t h e i r o n has been removed.
The t o t a l organic carbon (TOC) and chemical oxygen demand (COD1 of t h e t r e a t e d
EDTA decreased by 80 percent, i n d i c a t i n g e i t h e r a s i g n i f i c a n t reduc t i on i n o i l
and grease and/or EDTA l e v e l s . Since t h i s waste was produced du r ing t h e pre-
ope ra t i ona l c l e a n i n g o f a new b o i l e r , it i s probable t h a t t h i s reduc t i on i s due
t o o i l and grease removal r a t h e r than EDTA degradat ion. Molar charge balances
a l s o suppor t t h i s conclusion.
SOLID WASTE
The s o l i d wastes sampled inc lude r e a c t i v a t o r sludge, f i r e s i d e wastewater, and
EDTA wastewater.
discharge, t hey are def ined as s o l i d wastes under RCRA (40 CFR P a r t 261.2.
D e f i n i t i o n o f s o l i d waste).
Al though t h e l a t t e r two samples are l i q u i d s and a re t r e a t e d f o r
The ana lys i s o f t h e sludge from t h e bottom of t h e r e a c t i v a t o r (A-S4) i s shown i n
Appendix 6. Conversat ions w i t h p l a n t personnel i n d i c a t e t h a t t h i s sludge i s a
m i x t u r e o f several past t reatments. Due t o t h e r e l a t i v e l y low volume of metals
A-9
removed i n any s i n g l e c leaning, t h e s ludge produced does not war ran t immediate
processing.
concent ra t ion . As needed, sludge i s pumped t o t h e th ickener , where it i s e i t h e r
s to red f o r r e c y c l e t o t h e r e a c t i v a t o r , o r e v e n t u a l l y processed i n t h e p l a n t
f i l t e r presses. Th is f i n a l f i l t e r i n g and sludge d isposa l s tep i s u s u a l l y per-
formed annual ly. As seen i n the analysis, t h e s ludge c o n s i s t s p r i m a r i l y of
calcium. magnesium. and i r o n .
The sludge b lanke t i s maintained w i t h i n a s p e c i f i e d suspended s o l i d s
Three types of e x t r a c t i o n procedures were performed on t h e sludge: t h e EPA
E x t r a c t i o n Procedure (EP), t h e proposed T o x i c i t y C h a r a c t e r i s t i c Leaching Proce-
dure (TCLP), and t h e C a l i f o r n i a Assessment Manual (CAM) Waste E x t r a c t i o n Test.
The TCLP was a s l i g h t l y modif ied ve rs ion i n t h a t a l l o f t h e QA/W requirements
were n o t performed s ince these t e s t s were n o t f o r r e g u l a t o r y compliance.
The r e s u l t s of t h e EP, TCLP. and CAM So lub le Threshold L i m i t concen t ra t i ons
(STLC) a n a l y s i s a r e presented i n Appendix C along w i t h t h e RCRA and CAM maximum
a l l owab le concent ra t ions . None of t h e e x t r a c t s exceed t h e RCFA l i m i t s . N i c k e l
exceeded t h e STLC va lue f o r t h e CAM t e s t . General ly, t h e CAM e x t r a c t i o n i s much
more aggressive than t h e o t h e r two procedures. Fo r several of t h e metals, t h e
CAM e x t r a c t d i sso l ved c l o s e t o 100 percent o f t h e metal present.
ness o f t h e CAM t e s t i s due t o t h e c i t r a t e b u f f e r . t h e l eng th o f t h e e x t r a c t i o n
and t h e r e l a t i v e l y low l i q u i d - t o - s o l i d r a t i o . The TCLP e x t r a c t i o n r e s u l t s a re
t y p i c a l l y o n l y 10 percent of t h e EP values. T h i s cou ld be due t o l e s s v igorous
a g i t a t i o n i n t h e TCLP than i s used i n t h e EP: r o t a t i o n as opposed t o s t i r r i n g .
The lower values ob ta ined from t h e TCLP compared t o t h e EP cou ld a l s o be a r e s u l t
of t h e way a c i d i s in t roduced i n t h e t e s t . I n t h e TCLP, t h e a c i d i s d i l u t e d
w i t h i n t h e e x t r a c t s o l u t i o n p r i o r t o c o n t a c t w i t h t h e s o l i d s . Dur ing t h e EP
e x t r a c t i o n t h e a c i d i s added d i r e c t l y t o t h e so l id -water mixture. c r e a t i n g
l o c a l i z e d low pH reg ions u n t i l t h e a c i d i s f u l l y dispersed.
The aggressive-
A l so presented i n Appendix C i s a comparison of t h e f i r e s i d e and waters ide washes
t o s o l i d waste r e g u l a t o r y l i m i t s . I n bo th cases. s ince t h e wastes a re l i q u i d s
w i t h l e s s than 0.5 percent so l i ds , they a re analyzed d i r e c t l y and compared t o
RCRA o r s t a t e concen t ra t i on l eve l s . As shown. bo th streams a re below t h e
a l l owab le concen t ra t i on l i m i t s . It should be noted t h a t t h e EDTA s o l u t i o n sample
represents t h e composite of t h e i n i t i a l waste. and a l l t h e associated d ra ins and
r i nses . The EDTA waste by i t s e l f would be more concentrated.
A-10
PLANT B
Samples were ob ta ined i n A p r i l 1985 du r ing d r a i n i n g and t rea tment o f an HC1 a c i d
c lean ing o f a b o i l e r a t P l a n t B. Samples of raw and n e u t r a l i z e d so lu t i ons , a
water and soda ash r i n s e and sludge s o l i d s were analyzed.
PLANT DESCRIPTION
The o i l - f i r e d b o i l e r , l o c a t e d i n t h e Nor theas t EPRI Data Region, generates 300 MW
and i s cleaned every four years f o r t u b e deposi ts. The b o i l e r volume i s about
30,000 ga l lons . The c lean ing procedure i nvo l ved an i n i t i a l wash w i t h hydro-
c h l o r i c a c i d (HC1) maintained a t a f i n a l concen t ra t i on of f i v e percent. Th i s i s
an i n h i b i t e d s o l u t i o n con ta in ing Cutain, ammonium b i f l u o r i d e (0.25%), and Rodine
(0.2%). Th is f o r m u l a t i o n i s s p e c i f i e d by t h e u t i l i t y . The s o l u t i o n temperature
i s kep t a t 15OoF.
o f i r o n and copper removed by t h e acid.
The e f f i c i e n c y of c lean ing i s c a l c u l a t e d based on t h e amount
The f i r s t stage o f c lean ing i nvo l ved soaking t h e b o i l e r w i t h HC1 f o r f o u r hours.
A f t e r soaking, t h e a c i d was dra ined t o a conc re te p i t and simultaneously n e u t r a l -
i zed w i t h c a u s t i c . The b o i l e r was r e f i l l e d w i t h s e r v i c e water, which was a l s o
dra ined and n e u t r a l i z e d . Two more r i n s e s a re u s u a l l y conducted, f o l l owed by a
5-10 percent soda ash soak t o n e u t r a l i z e any pockets of a c i d remaining i n t h e
b o i 1 e r . WASTE MANAGEMENT
F igu re A-2 presents a general schematic of t h e t rea tment system a t P l a n t E f o r
a l l p l a n t wastewaters.
A c i d i c b o i l e r d r a i n s a re rou ted f i r s t t o t h e concre te ash p i t where i n i t i a l
n e u t r a l i z a t i o n occurs ( t o pH 5-6). When t h e d r a i n i s complete, t h e s o l u t i o n i s
pumped t o a r a p i d mix tank where l i m e and c a u s t i c a re used t o r a i s e t h e pH.
stream i s sent t o a dedicated p o r t i o n o f t h e s e t t l i n g basin which i s used f o r
metal c lean ing wastes. A l l o f t h e r i nses and t h e soda ash s o l u t i o n a re sent t o
t h i s basin.
A lso i n d i c a t e d on t h e f i g u r e a re t h e sampling l oca t i ons .
Th is
The b o i l e r c lean ing wastewaters are al lowed t o reac t and s e t t l e i n t h e bas in f o r
one-two weeks. Polymers may be added t o promote s e t t l i n g . The supernate from
t h e bas in i s then pumped back th rough t h e r a p i d mix tank where t h e pH i s lowered
t o 6-9 w i t h acid. T h i s stream i s sent th rough a g r a v i t y sand f i l t e r (100-150
gpm) and s to red i n an e f f l u e n t h o l d i n g tank. I f t h e i r o n and copper l e v e l s a re
A- 11
P
A - 1 2
below 1 mg/L, t h e water i s discharged. If not, it i s reprocessed i n t h e
t rea tment system.
SAMPLES COLLECTED
Samples were c o l l e c t e d on A p r i l 2, 3, and 4, 1985 a t t h e p o i n t s i d e n t i f i e d i n
F igu re A-2. Table A-2 l i s t s t h e samples taken and t h e i r desc r ip t i on .
Table A-2
SAMPLES FROM PLANT B BOILER CLEANING
2CaQ.Le
8-HC11
B-HC12
B-1R1
B-SA1
B-S3
B-Ef4
DISCUSSION OF RESULTS
Sample €TAL&
1
2
4
Sample Descr iDt ion
Composite sample taken over 1 hr . d r a i n per iod o f i n i t i a l a c i d waste
Grab sample taken a t feed t o s e t t - l i n g bas in du r ing d r a i n of i n i t i a l a c i d waste. L ime/caust ic added t o pH about 6
Grab sample from d r a i n o f f i r s t water r i n s e
Composite sample taken over 1 h r . d r a i n pe r iod o f soda ash waste
Grab sample o f sludge on s e t t l i n g bas in bottom. Taken a f t e r soda ash d r a i n
F i n a l discharge o f t r e a t e d water- s ide wastewater a f t e r f i l t e r s
A n a l y t i c a l r e s u l t s o f t h e samples obta ined from t h e P l a n t B t reatment system are
presented i n Appendix B. The unt rea ted HC1 dra ined from t h e b o i l e r (B-HC11)
con ta ins t h e f o l l o w i n g meta ls a t l e v e l s above 1 nig/ l : A l , Cot Cr, Cut Fe, Mn,
N i , Pb. Sb, and Zn. Due t o p r e c i p i t a t i o n and d i l u t i o n . t h e p a r t i a l l y neu t ra l i zed
waste HC1 (B-HC12) conta ined fewer meta ls above 1 mg/L: now only A l , Cu, Fe, Mn,
N i . Sb and Zn. The t a p water r i n s e o f t h e b o i l e r ( E - R l ) conta ins on ly copper and
i ron . While t h e soda ash r i n s e o f t h e b o i l e r (B -SA l ) has on ly an i r o n l e v e l
above 1 mg/L. Sample B-Ef4 i s t h e t r e a t e d e f f l u e n t which was obta ined by p l a n t
A-I3
personnel approximately two weeks a f t e r t h e c lean ing . A l l o f t h e t r a c e meta ls
a r e below 1 mg/L.
The sludge from t h e bottom o f t h e s e t t l i n g bas in (6-53) i s p r i m a r i l y ca l c ium and
i ron , w i t h sodium and s i l i c a a t lower l e v e l s . Almost a l l o f t h e metals analyzed
were detected a t some low l e v e l . Due t o t h e t rea tment process employed, most of
t h e metals a r e p resent as hydroxides. The low pH o f t h i s sample (5.5) i s a
r e s u l t of a c i d a d d i t i o n t o t h e bas in supernate t o lower t h e pH p r i o r t o discharge
and i s n o t t h e ac tua l pH o f t h e s e t t l i n g basin.
SOLID WASTE
The s t a t u t o r y s o l i d wastes i nc lude t h e s e t t l i n g bas in sludge and t h e n e u t r a l i z e d
feed streams t o t h e basin.
t r e a t e d f o r discharge. t hey a re de f ined as s o l i d wastes under RCRA (40 CFR P a r t
261.2, D e f i n i t i o n o f a s o l i d waste). The n e u t r a l i z a t i o n o f t h e HC1 d r a i n i n t h e
ash p i t i s n o t considered t o be hazardous waste t rea tmen t under RCRA.
Even though these l a t t e r streams a re l i q u i d s be ing
The sludge s o l i d s were t e s t e d us ing t h e EPA E x t r a c t i o n Procedure.
q u a n t i t i e s of sample were a v a i l a b l e t o perform t h e TCLP and CAM t e s t s on P l a n t B
s o l i d s . The r e s u l t s of t he EP analyses f o r t h e sludge a re presented i n Appendix
C. The four RCRA l i q u i d stream analyses a r e a l s o shown: s ince these streams a re
l i q u i d s w i t h l e s s than 0.5 percent suspended s o l i d s t h e i r analyses a re compared
d i r e c t l y t o t h e RCRA l i m i t s .
EP l e v e l s f o r t o t a l chromium.
a p p l i c a b l e EP l e v e l s .
I n s u f f i c i e n t
The waste h y d r o c h l o r i c a c i d stream exceeded RCRA's
The sludge and t h r e e o t h e r wastes were below a l l
A-14
PLAE!T C
Samples c o l l e c t e d by p l a n t personnel i n A p r i l and June o f 1985 a t P l a n t C
inc luded ammoniated bromate b o i l e r c l e a n i n g wastewater, i n h i b i t e d h y d r o c h l o r i c
a c i d wastewater, pond supernate a f t e r i n i t . i a 1 t rea tment o f t h e combined
wastewaters, and sediment from t h e h o l d i n g pond.
PLANT DESCRIPTION
P l a n t C i s l o c a t e d i n t h e West EPRI Data Region and has s i x g a s - f i r e d b o i l e r s .
Low volume wastes a r e h e l d i n ponds on s i t e f o r t rea tment o r evaporat ion.
Chemical c l e a n i n g wastes, such as t h e ammoniated bromate and h y d r o c h l o r i c a c i d
wastewaters, a r e h e l d i n a dedicated pond f o r separate t reatment. As t h e b o i l e r
i s d ra ined t o t h e pond d u r i n g a chemical c leaning, c a u s t i c i s added simultane-
ous ly t o r a i s e t h e pH above 2. T h i s s o l u t i o n i s s t o r e d i n t h e pond u n t i l it can
be t rea ted , e i t h e r by t h e u t i l i t y o r by an o u t s i d e cont rac tor .
WASTE MANAGEMENT
F i g u r e A-3 presents a s i m p l i f i e d schematic of t h e chemical c leaning, hand l ing and
s to rage system a t P l a n t C.
waters from b o i l e r c l e a n i n g a r e h e l d i n a separate bas in from t h e r i n s e s and
o t h e r p l a n t low volume was-te. Whi le t h e h y d r o c h l o r i c a c i d i s be ing dra ined t o
t h e pond, c a u s t i c i s added t o keep t h e PI-i of t h e pond l i q u o r above 2. Dur ing
t h i s p a r t i c u l a r c lean ing episode, two t a n k t r u c k s o f c a u s t i c were added t o t h e
pond.
p r i o r t o discharge.
The animoniated bromate and h y d r o c h l o r i c a c i d waste-
The s l i g h t l y a c i d i c wastewaters a r e h e l d on s i t e f o r f u r t h e r t rea tment
SAMPLES COLLECTED
The bromate and h y d r o c h l o r i c a c i d samples were c o l l e c t e d from t h e d r a i n l i n e
l e a d i n g from t h e b o i l e r t o t h e h o l d i n g pond,
s ludge frooi t h e pond bottoni were c o l l e c t e d one week a f t e r t h e wastewzters were
dra.ined t o t h e pond. The week interva.1 al lowed f o r m i x i n g o f t h e wastewaters and
c a u s t i c and f o r chemical r e a c t i o n s t o occur i n t h e pond.
Supernate from .the ho ld ing pond anti
A-15
t 6 I-' In A v)
cn C
v C
1 m I-' w r 0 C
c
.r r
m
m
c
m m 6 L m
0
0 I-' C
r.- .r
m
m z
a: m
0 L
0 .- LL
A-16
DISCUSSION OF RESULTS
Resu l t s o f t h e analyses a r e presented i n Appendix B f o r t h e waste bromate and
waste HC1. The
waste HC1 c o n t a i n s h i g h concentrat ions o f i r o n (5,100 mg/L) and copper (290 mg/L)
and e levated concen t ra t i ons o f several o t h e r elements, i n c l u d i n g chromium,
manganese, n i c k e l and z inc. The pH o f t h e bromate d r a i n was 10.4 and t h e ac id
d r a i n had a pH of 1.05.
The waste bromate conta ins h i g h d i sso l ved copper a t 1.050 mg/L.
The concen t ra t i on o f metals and water q u a l i t y parameters i n t h e pond supernate
one week a f t e r t h e wastewater and c a u s t i c were commingled i n t h e pond were a l s o
determined. The purpose o f adding c a u s t i c t o t h e pond was t o r a i s e t h e pH above
t h e r e g u l a t o r y t h r e s h o l d o f 2. T h i s was accomplished w i t h a measured pH o f 3.5.
A t t h e s l i g h t l y h ighe r pH. severa l metals a r e l e s s s o l u b l e than they a r e i n t h e
hyd roch lo r i c ac id s o l u t i o n , a l though t h e d i l u t i o n e f f e c t o f t h e a d d i t i o n a l b o i l e r
r i n s e s i s probably respons ib le f o r most of t h e concen t ra t i on decrease.
whose concen t ra t i ons were s i g n i f i c a n t l y reduced i n c l u d e aluminum, antimony,
barium, chromium, coba l t , copper, i r on . manganese, n i cke l , and z inc. A c i d i t y ,
c h l o r i d e , and f l u o r i d e were a l s o s i g n i f i c a n t l y reduced from t h e ac id drainage
composit ion. The a c i d i t y was reduced by a d d i t i o n of t h e caus t i c . Both c h l o r i d e
and f l u o r i d e reduc t i ons a r e probably a r e s u l t o f d i l u t i o n o f t h e hyd roch lo r i c
a c i d d r a i n by t h e bromate d ra in . Cadmium, calcium. hexavalent chromium, magna-
sium, molybdenum, potassium, s i l i c o n , and vanadium a l l have concentrat ions h ighe r
i n t h e pond than e i t h e r o f t h e b o i l e r dra ins. These r e s u l t s may be due t o wastes
i n t h e pond b e f o r e t h e d r a i n s were added.
Metals
SOLID WASTE
The o n l y s o l i d sample c o l l e c t e d was t h e pond sediment.
d e f i n i t i o n s , t h e two wastewater d r a i n s a r e a l s o considered as s o l i d wastes. The
pond sludge was ex t rac ted t o determine t o x i c i t y us ing t h r e e separate procedures:
t h e EPA E x t r a c t i o n Procedure (EP), t h e proposed T o x i c i t y C h a r a c t e r i s t i c Leaching
Procedure (TCLP), and t h e C a l i f o r n i a Assessment Manual (CAM) Waste E x t r a c t i o n
Test. The analyses o f t h e t h r e e e x t r a c t i o n s a r e presented i n Appendix C, a long
w i t h t h e RCRA maximum a l l owab le concen t ra t i ons and t h e CAM Soluble Threshold
L i m i t Concentrat ions (STLC). Ne i the r t h e EP n o r TCLP e x t r a c t has concentrat ions
above t h e RCRA l i m i t s . Cadmium and n i c k e l exceed t h e STLC f o r t h e CAM t e s t .
Concentrat ions of a r s e n i c and chromium a r e h i g h e r i n t h e EP than i n t h e TCLP
e x t r a c t s . The concen t ra t i ons of t h e o the r RCRA meta ls a r e comparable i n t h e two
e x t r a c t s .
However. under RCRA
A-17
Appendix C a l s o presents a comparison of t h e elemental concent ra t ions found i n
t h e bromate and hyd roch lo r i c a c i d wastewaters t o so l i d waste regu la to ry l i m i t s .
I n bo th cases. s ince t h e wastes a re l i q u i d s w i t h l e s s than 0.5 percent s o l i d s .
they a re analyzed d i r e c t l y and compared t o RCRA o r s t a t e concen t ra t i on l e v e l s .
Both streams exceed t h e CAM l i m i t s fo r copper, and t h e hyd roch lo r i c ac id d r a i n
exceeds t h e CAM l i m i t f o r n i c k e l . The hyd roch lo r i c ac id d r a i n a l s o exceeds t h e
EP t o x i c i t y l i m i t f o r t o t a l chromium.
A-18
PLANT D
Samples o f raw and t r e a t e d f i r e s i d e wastewater and sludge were ob ta ined from
P l a n t D.
PLANT DE SCRIPTION
P l a n t tJ has f o u r o i l - f i r e d 385 W u n i t s and i s l o c a t e d i n t h e Nor theast EPRI Data
Region. The f i r e s i d e of each u n i t i s genera l l y c leaned every spr ing. U n i t 2 was
be ing cleaned d u r i n g t h e sampling per iod. The b o i l e r . a i r heater. ductwork.
p r e c i p i t a t o r s , and s tack were c leaned on t h i s u n i t .
day of c lean ing were p r i m a r i l y from t h e b o i l e r and a i r heater.
Samples taken on t h e f i r s t
Washing i s done by spray ing a s o l u t i o n of soda ash over t h e equipment surfaces
us ing t h e soot blowers. Th is takes about s i x hours and i s fo l lowed by a water
r inse . The s tack and duc ts a r e sprayed w i t h f i r e hoses. Washwater f a l l s t o t h e
b o t t a n of t h e b o i l e r and f lows through f l o o r t renches t o a c o l l e c t i o n sump. The
water i s pumped t o a Hypalon l i n e d h o l d i n g pond p r i o r t o t reatment.
WASTE MANAGEMENT
F i g u r e A-4 presents a general schematfc of the f i r e s i d e washwater t reatment
system a t P l a n t D. e s s e n t i a l l y no l i q u i d .
r e s i d u a l s o l i d s from prev ious cleanings.
f u t u r e t o make r e p a i r s on t h e l i n e r .
c u b i c yards o f s o l i d s accumulate i n two years o f c leaning.
A t t h e s t a r t o f t h i s wash t h e h o l d i n g pond conta ined
However, it d i d c o n t a i n about 5000 c u b i c yards of The pond i s t o be dredged i n t h e near
P l a n t personnel i n d i c a t e d t h a t about 9000
From t h e h o l d i n g pond t h e wastewater i s pumped t o t h e t rea tment system.
major c o n s t i t u e n t o f t h e o i l ash i s washed from t h e bo i le rs , fer rous s u l f a t e i s
i n j e c t e d i n t h e l i n e between t h e h o l d i n g pond and t h e t rea tment system t o
p r e c i p i t a t e fe r rous metavanadate. Lime i s added t o r a i s e t h e pH and p r e c i p i t a t e
a d d i t i o n a l metals. Lime i s used r a t h e r than c a u s t i c because it i s more econmi -
c a l and it prov ides p a r t i c l e sur faces f o r p r e c i p i t a t i o n .
Since a
Lime i s added i n t h e r e a c t i o n tank, which prov ides a b r i e f residence t i m e p r i o r
t o s o l i d s separa t ion i n t h e c l a r i f i e r .
i n vacuum f i l t e r s t o 17.4 percent s o l i d s and s t o r e d i n a concrete basin.
s o l i d s a r e s o l d f o r t h e vanadium conten t which i s used i n t h e produc t ion of
s t a i n l e s s s t e e l s . Due t o t h e reduced demand f o r s t a i n l e s s s t e e l and h i g h
Underflow from t h e c l a r i f i e r i s dewatered
The
A-19
-LINE IN-LINE PH r i m nF AnnmnM ns ADJUSTMENT
IN ADD I'..... -. . . . -, . -, FeSOI R LIME POLYMER
900
GRAVITY SAND FILTERS (4)
SUMP LINED 1 m 1 HOLDING POND
2 25 MMG r L) DISCHARGE 30-40 I 5.7:
VACUUM SLUDGE HOLDING PIT
_ _ _ _ _ )NCRETE-LINED
I -0 SAMPLING POINT - . cc ' FILTERS (2)
F igure A-4. P l a n t D F i r e s i d e Washwater Treatment System
I ~l I I
t r a n s p o r t a t i o n costs, t h e u t i l i t y does n o t make a p r o f i t on t h i s t ransac t ion , b u t
does n o t i n c u r any d isposal costs .
C l a r i f i e r over f low i s s t o r e d i n a surge pond. When a s u f f i c i e n t q u a n t i t y i s
accumulated, t h e supernate i s pH adjusted, f i l t e r e d , and discharged.
SAMPLES COLLECTED
Sarilpling was performed on May 28, 1985. Washwater accumulated d u r i n g t h e
prev ious 24 hours was being t reated. Sampling p o i n t s (See F i g u r e A-4) and
d e s c r i p t i o n s a r e g iven i n Table A-3.
Table A-3
PLANT D SAMPLING POINTS AND DESCRIPTIONS
Sample D e s c r i p t i o n . . Sample
sr7mFle eeint
0-F1 1 F i r e s i d e wastewater c o l l e c t e d from a g i t a t e d h o l d i n g pond. Represents c l e a n i n g o f f i r e s i d e o f b o i l e r , a i r heater, and ductwork.
D-F2 2
D-S3 3
C l a r i f i e r supernate c o l l e c t e d from end o f p i p e i n t o surge pond.
Vacuum f i l t e r sludge from conveyor b e l t l e a d i n g t o s ludge s to rage basin.
D-F4 4 C l a r i f i e r underflow from zero-point o f u n i t .
SUMMP.RY
The un t rea ted f i r e s i d e wastewater i s a RCRA nontox ic waste because t h e d isso lved
metal concent ra t ions a r e below t h e maximum al lowed l i m i t s f o r t h e RCRA E x t r a c t i o n
Procedure (EP). The s o l i d s generated by t h e t rea tment process a r e nontox ic based
on t h e RCRA EP t e s t .
The t rea tment process adequately removes vanadium as fe r rous metavanadate and t h e
o t h e r meta ls present.
operat ion: f e r r o u s s u l f a t e a d d i t i o n a t a neut ra l pH w i t h s o l i d s separa t ion
f o l l o w e d by l ime a d d i t i o n t o remove t h e remaining metals.
f e r r o u s s u l f a t e i s enhanced a t a n e u t r a l pH, w h i l e a l k a l i n e pH reduces t h e
c o n c e n t r a t i o n o f f e r r o u s i o n because of hydrox ide s o l u b i l i t y cons t ra in ts .
The vanadium removal cou ld be increased by a two stage
Vanadium removal w i t h
A-21
DISCUSSION OF RESULTS
A n a l y t i c a l r e s u l t s o f t h e samples obta ined from t h e P l a n t D t rea tment system are
presented i n Appendix B. Sample D-F1 i s t h e raw f i r e s i d e wastewater p r i o r t o any
treatment. It conta ins t h e f o l l o w i n g heavy meta ls a t concent ra t ions above 1
mg/L: A l , Fe, Mo, Ni, T1, V, and Zn. As descr ibed e a r l i e r . t h e u t i l i t y s e l l s t h e
t r e a t e d waste sludge for i t s vanadium content. D-FZ i s t h e supernate from t h e
c l a r i f i e r . A l l of t h e above l i s t e d metals, except aluminum and vanadium, have
been reduced i n c o n c e n t r a t i o n t o l e s s than 1 mg/L by t h e f e r r o u s s u l f a t e and l i m e
treatment. The sludge cake from t h e vacuum f i l t e r (D-S3) i s composed l a r g e l y o f
i r o n and vanadium from t h e waste, ca lc ium from t h e l ime, and magnesium from a
fue l a d d i t i v e . The c l a r i f i e r underflow was n o t analyzed i n d e t a i l s ince it
should be i d e n t i c a l i n l i q u i d phase composi t ion t o t h e over f low. It had a f a i r l y
low suspended s o l i d s concent ra t ion o f 3 weight percent.
SOLID WASTE
The s o l i d wastes i n c l u d e t h e vacuum f i l t e r sludge and t h e f i r e s i d e wastewater.
Although t h e wastewater i s a l i q u i d and t r e a t e d f o r discharge, it i s de f ined as a
s o l i d waste under RCRA (40 CFR P a r t 261.2, D e f i n i t i o n of s o l i d waste).
Appendix B presented t h e analyses o f t h e f i l t e r cake s o l i d s .
e x t r a c t i o n procedures were performed on t h e sludge; t h e EPA E x t r a c t i o n Procedure
(Et'). t h e proposed T o x i c i t y C h a r a c t e r i z a t i o n Leaching Procedure (TCLP), and t h e
C a l i f o r n i a Assessment Manual (CAM) Waste E x t r a c t i o n Test. The r e s u l t s of these
analyses a r e presented i n Appendix C a long w i t h t h e RCRA maximum a l lowab le
concent ra t ions and t h e CAM Soluble Threshold L i m i t Concentrat ions. N e i t h e r t h e
EP nor t h e TCLP y i e l d e d va lues above t h e regu la ted l i m i t f o r t h e e i g h t RCRA
regu la ted metals. Under t h e CAM procedure, cadmium, n icke l , and vanadium were
above t h e STLC values.
Three types of
A lso shown i n Appendix C i s t h e comparison o f t h e f i r e s i d e wastewater t o t h e
r e g u l a t o r y l i m i t s .
it i s analyzed d i r e c t l y and compared t o RCRA or s t a t e concent ra t ion l i m i t s .
of t h e elemental concent ra t ions exceeds t h e RCRA l i m i t s .
S ince t h e waste i s l i q u i d w i t h l e s s than 0.5 percent s o l i d s ,
None
CHEMICAL PRECIPITATION OF VANADIUM
The removal of vanadium from t h e l i q u i d phase r e q u i r e s a d i f f e r e n t approach
compared t o most o t h e r metals. S ince vanadium can e x i s t i n f o u r valence s tates,
t h e r e a r e numerous r e a c t i o n p o s s i b i l i t i e s . I n t h e o x i d i z i n g atmosphere o f a
A-22
b o i l e r , most vanadium should be present i n t h e t5 o x i d a t i o n s ta te . Th is forms
t h e s o l i d vanadium pentoxide (V205) and t h e an ion V03
hydroxide compound which can be p r e c i p i t a t e d i s i n a +4 s ta te , (VO(OH)2).
compound i s f a i r l y i n s o l u b l e ( K
t o t5 i n water f a i r l y q u i c k l y .
- i n s o l u t i o n . The o n l y
Th is
= 7 .4~10- ’~ ) ; however, t h e +4 s t a t e i s ox id i zed SP
Kunz e t a l . determined t h e s o l u b i l i t y cons tan t f o r f e r r o u s metavanadate i n a
s tudy examining t r e a t m n t methods o f vanadium-containing waters (1). r e s u l t s i n d i c a t e t h a t a 4:l weight r a t i o o f f e r r o u s i r o n t o vanadium a t a pH o f
6-10 reduces t h e vanadium l e v e l t o l e s s than 5 mg/L. Above pH 7. f e r r o u s
hydroxide can beg in p r e c i p i t a t i n g , which increases t rea tment costs. As t h e pH
r i s e s f u r t h e r , t h e f r e e fe r rous i r o n concen t ra t i on begins dropping r a p i d l y ,
reduc ing t h e t rea tmen t e f fec t i veness .
i o n which i s r a p i d l y p r e c i p i t a t e d .
T h e i r
The f e r r o u s i o n can a l s o o x i d i z e t o f e r r i c
Untreated f i r e s i d e wastewater samples a t P l a n t D contained 180 and 87 mg/L o f
vanadium and i ron , r e s p e c t i v e l y . When t h e f e r r o u s s u l f a t e i s i n j e c t e d p r i o r t o
l i m e t reatment. t h e i r o n l e v e l i s much h igher . The low pH and t h e presence of
f ree f e r r o u s i r o n reduces t h e vanadium s o l u b i l i t y l e v e l t o about 2 mg/L, based on
e q u i l i b r i u m c a l c u l a t i o n s .
hydroxide pe rm i t s a h i g h e r l e v e l of vanadium i n s o l u t i o n .
supernate pH of 8.2 produces a c a l c u l a t e d e q u i l i b r i u m vanadium concen t ra t i on of
7.5 mg/L. T h i s i s very c l o s e t o t h e measured vanadium concen t ra t i on i n t h e
c l a r i f i e r supernate (8.2 mg/L).
a l s o i s about 8 mg/L.
i s p robab ly due t o o x i d a t i o n o f i r o n t o t h e f e r r i c s t a t e and p r e c i p i t a t i o n .
As t h e pH increases, t h e lower s o l u b i l i t y o f fe r rous
Using t h e c l a r i f i e r
The e q u i l i b r i u m l e v e l of f e r r o u s i r o n a t t h i s pH
The measured i r o n va lue was 0.69 mg/L. T h i s discrepancy
A s l i g h t l y lower vanadium l e v e l m igh t be achieved us ing a two stage process.
Under c u r r e n t operat ion. f e r r o u s s u l f a t e i s added t o t h e water i n a t r a n s f e r l i n e
p r i o r t o e n t e r i n g t h e c l a r i f i e r where l i m e i s added.
t h e pH, which i s de t r imen ta l t o t h e vanadium removal. An in te rmed ia te c l a r i f i c a -
t i o n s tep would a l l o w the f e r r o u s metavanadate t o s e t t l e p r i o r t o the pH ad jus t -
ment needed t o remove t h e o t h e r metals.
The l i m e a d d i t i o n r a i s e s
REFERENCE
1. R.G. Kunz, J.F. G i a n n e l l i , and H.D. Stensel . - t r i a l Wastewaters. Presented a t t h e 3 0 t h I n d u s t r i a l Waste Conference, Purdue U n i v e r s i t y , May 1975, Ann Arbor Science.
A-23
PLANT E
A composite sample of t h e f i r s t d r a i n from a c i t r i c a c i d c lean ing o f t h e b o i l e r
was ob ta ined i n May 1985 from P l a n t E.
PLANT DESCRIPTION
The p l a n t i s l o c a t e d i n t h e South Cent ra l EPRI da ta region.
ob ta ined from t h e c lean ing o f a gas- f i red b o i l e r .
The sample was
WASTE MANAGEMEN1
The u t i 1 i t y c u r r e n t l y evaporates t h e b o i l e r c lean ing s o l u t i o n .
t rea tment f a c i l i t i e s a re used. The waste i s s to red i n a tank and pumped t o an
opera t i ng b o i l e r f o r d isposal a t 20-100 g a l l o n s p e r minute.
observed any inc rease i n p a r t i c u l a t e l e v e l s d u r i n g evaporation.
Consequently. no
The u t i l i t y has n o t
SAMPLES COLLECTED
Four samples of t h e d r a i n were c o l l e c t e d by u t i l i t y personnel and composited
equa l l y p r i o r t o ana lys is . The b o i l e r c lean ing was performed on A p r i l 24, 1985.
SUMMARY
The a n a l y s i s o f t h e c i t r i c a c i d c lean ing s o l u t i o n i n d i c a t e s t h a t it i s n o t a
hazardous waste. based on RCRA. Even though t h i s i s a l i q u i d stream, it i s
considered an RCRA s o l i d waste (40 CFR P a r t 261.2, D e f i n i t i o n o f a s o l i d waste).
Since t h i s waste i s a l i q u i d w i t h l e s s than 0.5 percent s o l i d s , it i s canpared
d i r e c t l y t o t h e maximum a l l owab le meta ls concen t ra t i ons r a t h e r than performing
t h e EPA E x t r a c t i o n Procedure (EP). The a n a l y t i c a l r e s u l t s and t h e RCRA l i m i t s
f o r s p e c i f i c me ta l s a re shown i n Appendix E.
EVAPORATION OF CITRIC A C I D
The c i t r i c a c i d waste has predominant ly i r o n and copper i n s o l u t i o n w i t h sane
zinc, n i cke l , and vanadium. Other metals a re p resent a t f a i r l y low concentra-
t i o n s . Typ ica l volumes of b o i l e r wastes range from 30,000 t o 100,000 ga l lons .
If t h i s c lean ing produced 50,000 g a l l o n s of waste, evaporat ion would
t h e o r e t i c a l l y l i b e r a t e 950 pounds o f i ron , 93 pounds of copper. 25 pounds of
z inc, 5 pounds of n i c k e l and 5 pounds o f vanadium. respec t i ve l y . Since these a re
r e l a t i v e l y h i g h b o i l i n g p o i n t metals, they may condense o r c o l l e c t on downstream
equipment. An es t imate of t h e hea t ing va lue of t h e so lu t i on , based on t h e TOC
A-24
l e v e l and t h e s t r u c t u r e o f c i t r i c acid, i n d i c a t e s a va lue of about 700 B t u per
ga l lon . Th is i s a minimal c o n t r f b u t i o n to the p l a n t heat ra te .
A-25
PLANT F
Samples of hydroxyacet ic / fo rmic a c i d b o i l e r c l e a n i n g waste and t r e a t e d e f f l u e n t
were ob ta ined from P l a n t F d u r i n g May 1905.
PLANT DESCRIPTION
The p l a n t i s 1ocat.ed i n t h e EPRI West Data Region and has s i x u n i t s w i t h a n e t
genera t ing capac i t y of 1,620 &I. O i l i s t h e pr imary fuel , b u t na tu ra l gas i s
a l s o used.
The volume o f t h e u n i t cleaned was 125,000 ga l lons . A c o n t r a c t o r cleaned t h e
b o i l e r w i t h a four s-tep procedure. The f i r s t s tep was i n j e c t i o n of hydroxy-
a c e t i c f f o r m i c a c i d w i t h a f o u r - s i x hour r e c i r c u l a t i o n . The b o i l e r was dra ined
i n t o a demine ra l i ze r sump and c a u s t i c was added as needed t o r a i s e t h e pH above
2.
The second s tep was a c i t r i c a c i d c i r c u l a t i o n f o r one hour.
ammonia,/hydrazine r i n s e s were conducted as t h e f i n a l two s teps f o r pass iva t ion .
A l l r i n s e s were c o l l e c t e d i n t h e s m e ho ld ing basin.
The waste was then pumped t o an aspha l t - l i ned metal c lean ing waste basin.
Hydrazine and
WASTE MANAGEMENT
F i g u r e A-5 presents a general schematic of t h e -treatment system at, P l a n t F. The
t rea tment o f t h e f o u r b o i l e r c l e a n i n g d r a i n s occurred on s i t e by an o u t s i d e
vendor us ing a p c r t a b l e l ime/polymer t rea tment u n i t .
70,000 gal lons/day. Lime s l u r r y was i n j e c t e d i n t o t h e waste l i q u i d i n t h e
r e a c t i o n tank.
f l o c c u l a t o r .
l i q u i d was t r a n s f e r r e d th rough a surge tank t o a mult i -media f i l t e r composed of
sand. gravel, and diatomaceous earth. The e f f l u e n t w2s pumped i o a s e t t l i n g
bas in where t h e pH and i r o n concen t ra t i ons were nioni tored be fo re discharge t o t h e
ocean. Sludge from t h e c l a r i f i e r was t rucked t o a Class I l a n d f i l l f o r d isposal .
The u n i t can t r e a t up t o
L iqu ic l #as f l a s h n:ixed, mixed w i t l i polymer and t r a n s f e r r e d t o t h e
The waste was pumped t o a c l a r i f i e r where t h e s o l i d s s e t t l e d . The
SAMPLES COLLECTED
Samples were c o l l e c t e d on h y 6 and 7, 1985 a i t h e p o i n t s shown on F i g u r e A-5.
They a re descr ibed i n Tab le A-4.
A-26
i 0
0
5s x: a -
4 v)
P
A-27
Table A-4
PLANT F SAMPLES FROM MAY 6-7, 1985
F-HAF1 1
F-Ef2 3
F-S3 L
Composite sample taken o f each of t h e f o u r b o i l e r d r a i n s (5 gal. each).
Post- t reatment e f f l u e n t .
Post- t reatment sludge.
'See F i g u r e A-5 . for sampl ing p o i n t l o c a t i o n
SUMMARY
The un t rea ted waters ide wastewater i s a RCRA nontox ic waste because t h e d isso lved
metal concentratTons a r e below t h e rnaxinium a l lowed l i m i t s f o r t h e E x t r a c t i o n
Frocedure (EP).
wastewater were nontox ic by t h e RCRA EP. The proposed T o x i c i t y C h a r a c t e r i s t i c
Leaching Procedure (TCLP) was a l s o perforoied on t h e s o l i d s and t h e r e s u l t a n t
e x t r a c t showed concent ra t ion l e v e l s we1 1 below t h e curren.t RCRA t o x i c i t y 1 i m i t s .
When subjected t o a more aggressive s t a t e e x t r a c t i o n procedure ( C a l i f o r n i a
Assessment Manual, o r CAM. t e s t ) . none o f t h e regu la ted c o n s t i t u e n t s exceeded t h e
s o l u b l e t h r e s h o l d l i n i i t concentrat ions.
The so l i d s generated d u r i n g t reatment. of t h e waters ide
The mob i le t rea tment u n i t used a t P l a n t F reduced a l l metal concent ra t ions below
1 mg/L.
hydroxyacet ic a c i d complex w i t h i ron . However, t h e o p e r a t i n g pH of t h e t rea tment
system (10.9) was s u f i i c i e n l t o p r e c i p i t a t e i ron hydroxide.
Other RCRA meta ls were a l s o reduced i n concentrat ion. Both formic and
DISCUSSION OF RESULTS
Appendix B p resents r e s u l t s of t h e samples obta ined from t h e mobi le system used
a t P l a n t F. SarnFle F-HAF1 i s a composite o f t h e c lean ing s o l u t i o n s and r i n s e s
dra ined from t h e b o i l e r . Th is sample represents t h e average composi t ion of t h e
l i q u i d i n t h e h o l d i n g basin. Several meta ls a r e present i n t h e composite waste
i n concent ra t ions over 1 mg/L, i n c l u d i n g aluminum, boron, chromiurn ( t o t a l 1, i ron ,
mancanese, and z inc . Sample F-Ef2 i s t h e e f f l u e n t f o l l o w i n g t reatment of t h e
A-za
wastewater. A l l o f t h e metals have been reduced t o below 1 mg/L. The sludge
from t h e c l a r i f i e r underflow (Sample F-S3) was composed l a r g e l y o f i r o n and
calcium.
SOLID WASTE
The RCRA s o l i d wastes i n c l u d e t h e sludge from t h e l i m e t rea tment process and t h e
i n d i v i d u a l b o i l e r drains.
f o r discharge, they a re def ined as s o l i d wastes under RCRA (40 CFR P a r t 261,
D e f i n i t i o n o f s o l i d waste).
Al though t h e h o l l e r d ra ins a r e l i q u i d s and a re t r e a t e d
Three t ypes o f waste e x t r a c t i o n procedures were performed on t h e t rea tment
sludge: t h e EPA E x t r a c t i o n Procedure (EP), t h e proposed T o x i c i t y C h a r a c t e r i s t i c
Leaching Procedure (TCLP), and t h e C a l i f o r n i a Assessment Manua.1 (CAM) Waste
E x t r a c t i o n Test. The r e s u l t s o f t h e EP and TCLP e x t r a c t i o n s a re presented i n
Appendix C a long w i t h t h e RCRA niaxlnium a l l owab le concent ra t ions .
produce values above t h e l i m i t f o r t h e e i g h t regu la ted metals.
been proposed y e t for t h e TCLP.
above t h e So lub le Threshold L i m i t Concentrat ions (STLC).
The EP d i d n o t
No standards have
None o f t he c o n s t i t u e n t s i n t h e CAM e x t r a c t were
Appendix C a l s o compares t h e analyses o f t h e wastewater t o RCRA l i m i t s .
t h i s waste i s a l i q u i d w i t h l e s s than 0.5 percents so l i ds . it i s analyzed d i -
r e c t l y and compared t o RCRA o r s t a t e concen t ra t i on l i m i t s .
concen t ra t i ons exceed t h e RCRA 1iniit.s.
Since
None of t h e elemental
A-29
PLANT G
Samples o f un t rea ted and t r e a t e d b o i l e r chemical c l e a n i n g waste (ammonium brornzte
and hyd roch lo r i c a c i d c lean ing s o l u t i o n s ) and sludge froni t h e t rea tment process
were ob ta ined i n May 1985 from P l a n t C.
PLANT DESCRIPTION
The p l a n t i s l o c a t e d i n t h e West EPRI Data Region and has t h r e e u n i t s w i t h a n e t
genera t ing capac i t y o f 760 Mw. O i l i s t h e priniary fue l , b u t n a t u r a l gas i s also used.
Uni t . #1 was cleaned du r ing t h e sampling event.
ga l lons , which i nc ludes 2,000 ga l l ons i n t h e economizer. A c o n t r a c t o r c leaned
t h e b o i l e r w i t h a four step procedure:
Th is u n i t has a volume of 30,000
1. B o i l e r f i l l e d w i t h a bromate s o l u t i o n and al lowed t o
soak for f o u r hours;
2. B o i l e r r i n s e d f o r 30 minutes w i t h water;
3. B o i l e r f i l l e d w i t h an hyd roch lo r i c a c i d s o l u t i o n and al lowed
t o soak s i x hours,
and
4. F i n a l n e u t r a l i z a t i o n w i t h soda ash and DIS-132 s o l u t i o n . Th is
n e u t r a l i z i n g s o l u t i o n rerr!ained i n t h e b o i l e r u n t i l a 'hydro'
' t e s t was completed.
WASTE MANAGEMENT
F igu re P-6 presents a general schematic o f t h e t rea tment system a t P l a n t G. A l l
c l e a n i n g s o l u t i o n s were dra ined through a 7,000 g a l l o n condenser p i t sump before
go ing t o an a s p h a l t - l i n e d h o l d i n g bas in (145,000 g a l l o n s ) f o r t reatment.
The t rea tment o f t h e f o u r b o i l e r c lean ing d ra ins occurred on s i t e by an ou ts ide
vendor us ing a p o r t a b l e l ime/polymer t rea tment u n i t . The u n i t can t r e a t up t o
70,000 gal lons/day. Lime s l u r r y was added t o t h e waste l i q u i d i n t h e r e a c t i o n
tank. L i q u i d was f l a s h mixed, polymer added and t r a n s f e r r e d t o t h e f l o c c u l a t o r .
The waste was pumped t o a c l a r i f i e r where t h e s o l i d s se t t l ed .
t r a n s f e r r e d t o a mult i -media f i l t e r composed of sand, gravel , and diatomaceous
The l i q u i d was
A-30
-. .. WASTE
SAMPLING -0 POINT
LIME FEED
I32 REACTION TANK
POLYMER FEED
SLUDGE TO CLASS I LANDFILL
FILTER
ASPHALT~LINED HOLDING BASIN FOR DISCHARGE
F igure A-6. P l a n t G Low Volume Waste Treatment System
I I I 1 1
earth.
concen t ra t i ons were monitored before discharge t o t h e ocean.
c l a r i f i e r was t rucked t o a Class I l a n d f i l l f o r d isposal .
The e f f l u e n t was pumped t o a s e t t l i n g bas in where t h e pH and i r o n
Sludge from t h e
SAMPLES COLLECTED
Sampled were c o l l e c t e d on May 1-8. 1985, as descr ibed i n Table A-5, w i t h sampling
p o i n t s i d e n t i f i e d on F igu re A-6.
Table A-5
PLANT G SAMPLES FROM MAY 1-8, 1985
SnmPLc G-Cmpl
G-Ef2
G-S3
G-Brl
G-R1
G-IiC1 1
G-Hyl1
Sample Eeint
I
-- Sample D e s c r i p t i o n
Composite sample taken f o r each of t h e four b o i l e r d ra ins (5 gal . each).
Post- t reatment e f f l u e n t .
Post- t reatment s1 udge.
Bromate d r a i n composite.
Rinse d r a i n composite.
HC1 d r a i n composite.
N e u t r a l i z i n g s o l u t i o n d r a i n composite.
'See F i g u r e A-6 f o r sampling p o i n t l o c a t i o n
SUMMAEY
The un t rea ted waters ide wastewater i s a RCRA non tox i c waste because t h e d i sso l ved
metal concen t ra t i ons a r e below t h e maximum al lowed l i m i t s f o r t h e E x t r a c t i o n
Procedure (EP). However, t h e wastewater i s a RCRA c o r r o s i v e waste because t h e pH
i s below 2. Th is c l a s s i f i c a t i o n as c o r r o s i v e cou ld be avoided if t h e wastewater
d r a i n s were n e u t r a l i z e d " in-1 ine" o r i n an "elementary n e u t r a l i z a t i o n u n i t " p r i o r
t o r o u t i n g t o t h e h o l d i n g bas in (40 CFR P a r t 260.10, D e f i n i t i o n s ) .
The s o l i d s generated du r ing t rea tment of t h e waters ide wastewater were nontox ic
by t h e RCRA EP. The proposed T o x i c i t y C h a r a c t e r i s t i c Leaching Procedure (TCLP)
A-32
was a l s o performed on t h e s o l i d s and t h e r e s u l t a n t e x t r a c t showed concent ra t ion
l e v e l s w e l l below t h e c u r r e n t RCRA t o x i c i t y l i m i t s . When subjected t o a more
aggressive s t a t e e x t r a c t i o n procedure ( C a l i f o r n i a Assessment Manual, o r CAM,
t e s t ) , t h e s o l i d s exceeded t h e s o l u b i l i t y t h resho ld l i m i t concen t ra t i on f o r
n i c k e l .
The mobi le t rea tment u n i t used a t P l a n t G reduced a l l metal concent ra t ions below
1 mg/L, except f o r i ron . I r o n was reduced i n concent ra t ion from 1,030 t o 1.2
mg/L.
t h e t r e a t e d e f f l u e n t .
Th is s i n g l e sample may no t accura te ly represent t h e average composi t ion o f
DISCUSSION OF RESULTS
Appendix B presents r e s u l t s of t h e samples obta ined from t h e mobi le system used
a t P l a n t G.
dra ined from t h e b o i l e r .
waste sent t o t h e h o l d i n g basin. Several meta ls a r e present i n t h e composite
waste i n concent ra t ions over 1 mg/L, i n c l u d i n g aluminum, boron. chromium ( t o t a l ),
copper, i ron, manganese. n i cke l . and z inc. The a l k a l i meta ls ca lc ium and magne-
sium a r e a l s o w e l l above 1 mg/L. Sample G-Ef2 i s t h e e f f l u e n t f o l l o w i n g t r e a t -
ment o f t h e wastewater.
except f o r i r o n which was measured a t 1.2 mg/L. Th is i r o n va lue i s s u r p r i s i n g
s ince i r o n i s very i n s o l u b l e a t t h e h igh pH measured i n t h e e f f l u e n t (pH 11). i s poss ib le t h a t sane c o l l o i d a l i r o n passed through t h e f i l t e r i n g system on t h e
t rea tment u n i t and was subsequently red i sso l ved i n t h e sample p rese rva t i on and
ana lys i s steps.
Sample G-Cmpl i s a composite o f t h e c lean ing s o l u t i o n s and r i n s e s
Th is sample represents t h e average composi t ion of t h e
A l l o f t h e meta ls have been reduced t o below 1 mg/L
It
F l u o r i d e was a l s o reduced i n concen t ra t i on du r ing treatment, due t o p r e c i p i t a t i o n
o f t h e s l i g h t l y s o l u b l e ca lc ium f l uo r ide .
a d d i t i o n used t o r a i s e t h e pH i n t h e t rea tment process . Calcium l e v e l s increased due t o l i m e
The sludge from t h e c l a r i f i e r underf low (Sample G-S3) was composed l a r g e l y o f
i r o n and calcium, w i t h l e s s e r amounts o f copper, magnesium, sodium, n i cke l , and
z inc .
I n d i v i d u a l analyses o f t h e c lean ing s o l u t i o n s and r i nses t h a t made up t h e compos-
i t e waste are a l so presented. The bromate d r a i n conta ins copper a t 450 mg/L and
t h e hyd roch lo r i c a c i d d r a i n conta ins i r o n a t 5,900 and copper a t 320 mg/L.
r i n s e water does n o t con ta in any meta ls above 1 mg/L. I r o n and n i c k e l a r e
p resent a t 120 and 3 mg/L, respec t ive ly , i n t h e f i n a l hydraz ine dra in .
The
A-33
SOLID WASTE
The RCRA s o l i d wastes i nc lude t h e sludge from t h e l i m e t rea tment process and t h e
i n d i v i d u a l b o i l e r drains.
f o r discharge, they a re de f i ned as s o l i d wastes under RCRA (40 CFR P a r t 261,
D e f i n i t i o n o f s o l i d waste).
Although t h e b o i l e r d ra ins a re l i q u i d s and a re t r e a t e d
Three t ypes of waste e x t r a c t i o n procedures were performed on t h e t rea tment
sludge: t h e EPA E x t r a c t i o n Procedure (EP), the proposed T o x i c i t y C h a r a c t e r i s t i c
Leaching Procedure (TCLP), and t h e C a l i f o r n i a Assessment Manual (CAM) Waste
E x t r a c t i o n Test. The r e s u l t s o f t h e EP and TCLP analyses a r e presented i n
Appendix C a long w i t h t h e RCRA maximum a l l owab le concentrat ions.
produce values above t h e l i m i t f o r t h e e i g h t regu la ted metals.
were a l s o below t h e l i m i t s es tab l i shed f o r t h e EP t e s t . The n i c k e l concen t ra t i on
i n t h e CAM e x t r a c t was above t h e So lub le Threshold L i m i t Concent ra t ion (STLC).
Chromium, a t 6.5 mg/L i n t h e ex t rac t . i s above t h e STLC f o r hexavalent chromium,
b u t w e l l below t h e l i m i t f o r t o t a l chromium.
The EP d i d no t
The TCLP r e s u l t s
Appendix C a l s o compares t h e analyses o f t h e wastewaters t o RCRA l i m i t s .
these wastes a re l i q u i d s w i t h l e s s than 0.5 percent so l i ds , they a re analyzed
d i r e c t l y and compared t o RCRA o r s t a t e concen t ra t i on l i m i t s .
t a l concen t ra t i ons exceed t h e RCRA l i m i t s .
Since
None o f t h e elemen-
A-34
PLANT H
Low volume wastes obta ined from P l a n t H were taken on May 29 and 30, 1985 du r ing
d ra in ing and t rea tment of a hyd roch lo r i c a c i d and ammoniated bromate c lean ing of
t h e b o i l e r . Samples o f t h e bromate, acid, n e u t r a l i z e d acid, and ho ld ing pond
l i q u i d s were analyzed.
PLANT DESCRIPTION
P l a n t H i s l oca ted i n t h e Southeast EPRI data reg ion and burns b i tuminous coal.
The s t a t i o n has seven bo i le rs , t h r e e gas un i t s , and four coal b o i l e r s . The gas
u n i t s are operated i n f requen t l y . The coal b o i l e r s range i n s i z e from 75 t o 500
MW. U n i t 6 (350 MW) was being cleaned d u r i n g t h e sampling t r l p .
A t P l a n t H, b o i l e r s fo r u n i t s 4 and 5 are cleaned once every f o u r t o f i v e years.
B o i l e r s fo r u n i t s 6 and 7 are cleaned every 18 months.
500 pounds o f copper and 1500 - 2000 pounds of i r o n depos i ts a re removed.
c o n t r a c t o r performed t h i s cledning.
re rcer i t s o l u t i o n o f ammonium bromate t o s o l u b i l i z e copper. Th is requ i res
fou r -s i x hours p lus a two-hour d ra in per iod.
percent HC1 s o l u t i o n w i t h an i n h i b i t o r (Rodine 213) was used f o r i r o n removal.
Caust ic was i n j e c t e d i n t o t h e d r a i n p ipe t o r a i s e t h e pH from 1 t o 10 - 12 as
t h i s waste was dra ined from t h e b o i l e r .
Typ ica l l y , about 300 - A
The tubes were f i r s t soaked w i t h a one
Fo l low ing a r i n s e and a i r blow. a 5
WASTE MANAGEMENT
U n i t 6 requ i res about 50,000 g a l l o n s t o fill t h e b o i l e r tubes.
t h r e e r i n s e volumes are pumped t o a rubber - l ined 1.5 m i l l i o n g a l l o n pond.
i n t h e pond i s ad jus ted w i t h c a u s t i c t o 11 - 12 and t h e pond aerated t o o x i d i z e
and p r e c i p i t a t e t h e metals.
i r o n and copper l e v e l s a re below 1 mg/L.
drummed and disposed of i n a hazardous l a n d f i l l .
sample o f t h e l i q u i d when t h e t rea tment was f in ished.
The two waste and
The pH
The supernate i s pumped t o t h e ash pond once t h e
The s o l i d s i n t h e pond are p e r i o d i c a l l y
U t i l i t y personnel c o l l e c t e d a
SAMPLES COLLECTED
Samples of waste and n e u t r a l i z e d waste were c o l l e c t e d on May 29 and 30, 1985.
T h e i r d e s c r i p t i o n and l o c a t i o n a r e presented i n Table A-6 and F igure A-7, a
general schematic o f t h e t rea tment process a t P l a n t H.
A-35
IN. LIN E CAUSTIC CAUSTIC ADDITION ADDITION & AERATION -
FUEL- Q&Q LINED HOLDING 7 ASH POND
2
CHEMICAL CLEANING-
c--__)
I POND BOILER
F igure A-7. P l a n t H Waterside Waste Treatment System
Table A-6
SAMPLES FROM PLANT H UNIT 6
SamDle
H-Brl
H-HCll
H-HC12
H-S2
H-P3
Sample eeint
1
1
2
2
3
Samole D e s c r i o t i o n
Ammoniated bromate waste (no c a u s t i c in jec ted . pH 11)
HC1 waste (pH 1)
HC1 waste a f t e r c a u s t i c i n j e c t i o n (pH 12)
Sol ids ' p r e c i p i t a t e d from HC1 waste a f t e r c a u s t i c i n j e c t i o n
Aerated. t r e a t e d l i q u i d p r i o r t o d ischarge t o ash pond
SUMMARY
The unneut ra l i zed HC1 d r a i n exceeded t h e EP t o x i c i t y l i m i t f o r t o t a l chromium,
and t h e r e f o r e may be s u b j e c t t o hazardous waste r e g u l a t i o n .
d u r i n g t h e n e u t r a l i z a t i o n of t h e a c i d a r e n o t hazardous according t o t h e EP
t o x i c i t y t e s t .
The s o l i d s generated
The a n a l y s i s of t h e h o l d i n g pond sample d i d n o t show i r o n and copper l e v e l s below
1 mg/L as des i red. A d d i t i o n a l a e r a t i o n and pH adjustment ( r e d u c t i o n ) should
achieve these l e v e l s by reducing t h e c o n c e n t r a t i o n o f metal hydrox ide complexes.
DISCUSSION OF RESULTS
Appendix B p resents t h e analyses of t h e samples from P l a n t H.
bromate sample was used t o remove copper depos i ts from t h e b o i l e r .
stream c o n t a i n s a h i g h l e v e l of d isso lved i ron . Aluminum. boron, copper,
manganese, n i c k e l , and z i n c a r e a l s o present a t l e v e l s above 10 mg/L.
n e u t r a l i z a t i o n w i t h c a u s t i c e f f e c t i v e l y reduces t h e concent ra t ion of a l l of t h e
m t a l s except z inc, which e x h i b i t s amphoteric behavior ( h i g h s o l u b i l i t y a t a c i d
and a1 k a l i n e pH).
The ammoniated
The a c i d
I n - l i n e
The h o l d i n g pond sample (H-P3) has aluminum. copper, and z inc a t l e v e l s above 1 mg/L. The copper i s i n s o l u t i o n as an ammonia complex and would be expected t o
decrease w i t h t i m e as more ammonia v o l a t i l i z e s . The i r o n and aluminum g r e a t l y
A-37
exceed t h e i r s o l u b i l i t y l i m i t s . i n d i c a t i n g t h e probable presence o f c o l l o i d a l
s o l i d s i n t h e sample analyzed.
SOLID WASTE
The s o l i d waste streams, as def ined by RCRA, i n c l u d e t h e sludge produced by
t rea tment and t h e c l e a n i n g s o l u t i o n s .
l i q u i d s and a r e t r e a t e d f o r discharge, t h e y a r e de f ined as s o l i d wastes ( 4 0 CFR
P a r t 261.2. D e f i n i t i o n o f s o l i d waste).
Although t h e c l e a n i n g s o l u t i o n s a r e
No s o l i d s were ob ta ined from t h e t rea tment impoundment due t o i n a c c e s s i b i l i t y .
However, as mentioned e a r l i e r , t h e a c i d d r a i n was n e u t r a l i z e d by c a u s t i c a d d i t i o n
b e f o r e being pumped t o t h e impoundment.
s u f f i c i e n t amount of s o l i d s t o perform t h e EPA E x t r a c t i o n Procedure (EP) t e s t f o r
t o x i c i t y .
The sample of t h i s waste conta inbd a
The r e s u l t s o f t h e EP t e s t on t h e n e u t r a l i z e d HC1 s o l i d s a r e presented i n Appen-
d i x C. None of t h e RCRA metals exceed t h e t o x i c i t y l i m i t . The z i n c l e v e l i s
very high, again due t o t h e h igh s o l u t i o n pH.
hydrox ide species l e v e l s o f caus t ic . The h y d r o c h l o r i c a c i d d r a i n (H-HC11)
exceeded t h e EP t o x i c i t y l i m i t f o r t o t a l chromium and there fore may be
s u b j e c t t o hazardous waste r e g u l a t i o n .
The sludge s o l i d s c o n t a i n res idua l
A-38
PLANT I
Several low volume wastes were c o l l e c t e d a t P l a n t I d u r i n g June, 1985. Hydro-
c h l o r i c a c i d wastes from two separate b o i l e r s ( u n i t s 1 and 31, a t r i s o d i u m
phosphate r inse, and coal p i l e runof f were obtained. A d d i t i o n a l l y , severa l pond
water e f f l u e n t samples were analyzed t o determine t h e e f f e c t i v e n e s s o f coponding
as a t rea tment method.
PLANT DESCRIPTION
P l a n t I i s l o c a t e d i n t h e South East EPRI Data Region and has f o u r c o a l - f i r e d
b o i l e r s . Low volume wastes a r e t r e a t e d on s i t e by coponding i n t h e ash pond.
The s t a t i o n has a t o t a l c a p a c i t y of 2,030 MW. Uni t 1 i s 350 MW and Un i t 3 i s a
650 MW s u p e r c r i t i c a l b o i l e r .
U n i t 1 had severa l b o i l e r tubes replaced, w h i l e U n i t 3 was being serv iced based
on a three-year c lean ing cyc le .
Both were being cleaned d u r i n g t h e sampling e f f o r t .
WASTE MANAGEMENT
I n 1976, t h e u t i l i t y t h a t owns P l a n t I obta ined a permi t from t h e s t a t e f o r us ing
t h e i r ash bas ins system-wide as waters ide wastewater t rea tment systems. To ge t
t h e permi t t h e u t i l i t y demonstrated t h a t coponding i n t h e bas ins i s equ iva len t t o
l i m e t reatment . A schematic o f t h e i r t rea tment system i s presented i n F i g u r e
A-8. The coponding procedure c o n s i s t s o f sending d i l u t e d ( a t most a 6:l d i l u -
t i o n ) wastewater t o t h e ash basin. I n t h e ash basin, t h e waste must be d i l u t e d
1OO:l; t h i s l e v e l o f d i l u t i o n i s requ i red t o reduce t h e complexing power o f t h e
aqueous ammonia species wi th copper.
p r e c i p i t a t e heavy metal ions, such as i r o n and copper. as hydroxides.
Immediately a f t e r t h e waters ide wastewater i s dra ined t o t h e basin, and f o r four
days t h e r e a f t e r , t h e e f f l u e n t from t h e bas in i s stopped t o a l l o w these chemical
r e a c t i o n s t o occur. Once e f f l u e n t i s re leased t o t h e r i v e r . it i s monitored
d a i l y for f o u r days. and t w i c e monthly as a check on t h e q u a l i t y of t h e
discharge.
Ash prov ides t h e necessary a l k a l i n i t y t o
I n t h i s p a r t i c u l a r cleaning, t h e ash pond was low s ince t h e p l a n t was i n t h e
process o f c o n v e r t i n g t o a d ry ash hand l ing system.
was supp l ied from t h e r i v e r .
Therefore. d i l u t i o n water
SAMPLES COLLECTED
Runoff from t h e coal p i l e i s d i v e r t e d by a per imeter drainage d i t c h t o a bas in
and from t h e r e t o t h e ash basin. There had been heavy r a i n s d u r i n g t h e week
A-39
7 P 0
r- 6:l DILUTION OF
WASHWATER REQUIRED N
WATER HELD UP 3 DAYS
TO OCCUR PRIOR TO DISCHARGE. FOR CHEMICAL REACTIONS
ASH BASIN 450,Mx) TONS ASH
PER YEAR DURING USE.
t DISCHARGE
p r i o r t o t h e sampling (approx imate ly 3 inches over t h e week) and t h e bas in had
water cover ing an area about 100 by 80 yards.
u n i t s 1 and 3 were sampled by u t i l i t y personnel. as was t h e e f f l u e n t f rom t h e ash
basin. Table A-7 summarizes t h e samples co l l ec ted .
The waters ide wastewaters f rom
Table A-7
SAMPLES COLLECTED AT PLANT I I N JUNE 1985
LaJwJ-e I-HC13
I-HC1 1
Sampl el enint
1
1
Sample D e s c r w o n
Hydroch lo r ic a c i d waste from U n i t 3
Hydroch lo r ic a c i d waste f rom U n i t 1 ( f o l l o w s phosphate wash)
I-TSP1 1 The sodium phosphate d r a i n f rom U n i t 1
I-P-1
I-Pt .2
I -P+l
I-P+2
I -P t3
I-P+4
I-CRP3
2
2
2
2
3
'See F igu re A-8 f o r l o c a t i o n o f sampling po in ts .
'Discharge from ash pond t o r e c e i v i n g water.
Ash bas in e f f l u e n t c o l l e c t e d from d ischarge s t r u c t u r e p r i o r t o c lean ing
Ash bas in+? hours a f t e r s t a r t i n g d ischarge
Ash bas in 1 day a f t e r s t a r t i n g d ischarge
Ash bas in 2 days a f t e r s t a r t i n g d ischarge
Ash bas in 3 days a f t e r s t a r t i n g d ischarge
Ash bas in 4 days a f t e r s t a r t i n g d ischarge
Coal p i l e runof f from c o l l e c t i o n bas in a t base of coal p i l e
SUMMARY
The two a c i d d r a i n streams a t P l a n t I may be considered c o r r o s i v e and t o x i c under
t h e EP due t o t o t a l chromium leve ls . The t r i s o d i u m phosphate d r a i n and t h e coa l
p i l e r u n o f f a r e n o t RCRA t o x i c o r co r ros i ve .
The pond water e f f l u e n t samples demonstrate o n l y a minor e f f e c t of t h e a d d i t i o n
o f t h e low volume wastes.
l e v e l were seen f o r barium and potassium and 20 percent f o r molybdenum and
sodium. Copper and z i n c increased s i g n i f i c a n t l y , however o n l y t o very low
l e v e l s . No heavy metal concent ra t ions above 1 mg/L were measured i n any o f t h e
pond samples.
Increases of 10 percent or less ove r t h e background
DISCUSSION OF RESULTS
Appendix B p resents t h e composi t ions o f t h e f o u r low volume waste streams
c o l l e c t e d and t h e a n a l y s i s of t h e ash pond e f f l u e n t f o r f o u r days f o l l o w i n g t h e
resumption of d ischarges.
t o t h e ash pond f o r d isposa l . Sample I-HC11 i s a hyd roch lo r i c a c i d waste from
U n i t 1. It con ta ins h igh l e v e l s of i ron , c h l o r i d e . and f l u o r i d e . Sample I-TSP1
i s a t r i s o d i u m phosphate r i n s e from t h e U n i t 1 b o i l e r and con ta ins low l e v e l s o f
metals.
t h e replacement of several tubes. As such, t h e waste a c i d would be r e l a t i v e l y
easy t o t r e a t w i t h o n l y n e u t r a l i z a t i o n requ i red t o p r e c i p i t a t e t h e i r o n .
A l l o f t h e b o i l e r c lean ing wastes a t P l a n t I a r e sent
The c l e a n i n g o f U n i t 1 was performed t o remove m i l l s ca le and o i l due t o
Sample I-HC13 i s t h e a c i d d r a i n from U n i t 3. It has h i g h metal concen t ra t i ons o f
aluminum. boron. copper, i ron , manganese, and zinc. Ammonia. c h l o r i d e and
f l u o r i d e a r e t h e major anions present. T h i s waste r e q u i r e s bo th n e u t r a l i z a t i o n
and d i l u t i o n f o r t reatment. The ammonia l e v e l w i l l keep copper complexed i f it
i s n o t d i l u t e d o r removed by a i r s t r i p p i n g . The f l u o r i d e i o n i s a l s o a good
complexat ion agent f o r i r o n i n t h e a c i d i c pH range.
The coa l p i l e r u n o f f sample shows an a c i d i c pH (3.1) and s l i g h t l y e leva ted i r o n
and s u l f a t e concent ra t ions , i n d i c a t i o n s o f p y r i t e weathering.
The pond water samples show o n l y a s l i g h t e f f e c t of t h e waste a d d i t i o n on t h e
e f f l u e n t q u a l i t y .
discharge, however it q u i c k l y drops. The i r o n concen t ra t i on shows a gradual drop
over t h e sampling pe r iod w i t h t h e h ighes t value occu r r i ng p r i o r t o t h e waste
a d d i t i o n .
and subsequent decrease i n e q u i l i b r a t i o n t ime between t h e pond l i q u i d and t h e
The copper concen t ra t i on shows a sp i ke r i g h t a t t h e s t a r t of
The s l i g h t inc rease i n pH i s p o s s i b l y due t o the resumption of f l o w
A-42
atmosphere.
g r e a t e r C02 absorpt ion, t h u s lower ing t h e pH of t h e pond water.
Longer e q u i l i b r a t i o n t imes dur ing per iods o f no f low would a l low
SOLID WASTE
Although no s o l i d wastes were analyzed, f o r r e g u l a t i o n purposes, t h e l i q u i d
b o i l e r wastes a r e c l a s s i f i e d as s o l i d waste under RCRA (40 CFR P a r t 261.2.
D e f i n i t i o n of s o l i d waste).
t h e RCRA standards. To ta l chranium exceeds t h e EP l i m i t . The low pH o f t h e
d r a i n s a l s o makes them RCRA cor ros ive .
Appendix C p resents t h e sample a n a l y s i s compared t o
A-43
PLANT J
Samples o f EDTA wastes and pond l i q u i d , be fo re and a f t e r treatment, ash pond
so l i ds , and coal p i l e r u n o f f l i q u o r and s o l i d s were ob ta ined i n A p r i l 1985 front
P1 a n t J . PLANT DESCRIPTION
The p l a n t i s l o c a t e d i n t h e West Cent ra l EPRI Data Region and has two 750 W
u n i t s t h a t f i r e a l ow-su l fu r Montana coal . Low volume wastes a re t r e a t e d on s i t e
i n an ash pond, w i t h t h e u l t i m a t e t rea tment of EDTA b o i l e r c lean ing waste be ing
s u n l i g h t degradat ion (UV r a d i a t i o n ) .
Waterside washing o f t h e b o i l e r s occurs every t h r e e years.
low volume wastes produced a t t h e p l a n t cou ld n o t be determined.
The t o t a l volume of
WASTE MANAGEMENT
A general schematic o f t h e t rea tment system a t P l a n t J i s presented i n F i g r e
A-9. A lso shown i n t h e f i g u r e a re t h e sampling p o i n t s around t h e system. A
p r i v a t e cont rac tor , Dowell, i s h i r e d t o perform t h e c lean ing operat ion. A
p o r t i o n of t h e 85,050 ga l l ons of water i n t h e b o i l e r i s drained t o p rov ide space
f o r EDTI! add i t i on .
o f EDTA i s added. The i r o n and EDTA concent ra t ions i n t h e wastewater a re
monitored; t h e c lean ing cont inues u n t i l t h e i r o n concen t ra t i on i s cons tan t (12-16
hottrs).
hydrazine and s u f f i c i e n t ammonia t o p rov ide a systeni pH g rea te r than 10 i s made.
An a i r p a s s i v a t i o n s tep i s included. A l l c l ean ing wastewaters are then dra ined
t o an i d l e FGD t h i c k e n e r c o n t a i n i n g 500,000 ga l l ons (1/3 f u l l ) o f water. The
e n t i r e con ten ts o f t h e FGD t h i c k e n e r a re then discharged t o t h e ash pond.
ash pond has 65 acres of surfa,ce area, i s 50 f ee t deep and i s l i n e d w i t h 18 inches o f compacted c lay . The pond i s non-evaporative; water i s re tu rned t o t h e
p l a n t f o r use as makeup water t o t h e FGD system.
w i t h i n one f o o t o f i t s riiarinium l e v e l and a second ash pond (100 acres x 50 f e e t
deep) has r e c e n t l y been constructed.
The b o i l e r i s preheated t o 3OO0F and a t o t a l of 9,500 g a l l o n s
The b o i l e r i s then cooled t o 180°F and drained. One r i n s e o f 200 mg/L
The
C u r r e n t l y t h e ash pond i s
A l l o the r low volume wastes a re codisposed i n a small pond used f o r bot.trmi ash
disposal . The coal p i l e runoff goes d i r e c t l y t o t h e bottom ash pond. C-ther l w
volume wastes, such as a i r p reheater r i n s e water and p y r i t e s a re sent t o t h e
bo-t tmi ash pond. Deminera l i zer regenera t ion wastes go t o t h e n e u t r a l i z a t i o n
basin. T h i s bas in overf lows t o t h e bottom ash pond. Water from t h e bottom ash
A-44
THICKENER 1,500,OW GAL.
EDTA
BOILER
COAL PILE RUNOFF
w BOTrOM ASH POND
(LINED WITH 18 IN. CLAY)
%--.-- UNDERFLOW
TO FGD L& SYSTEM
ASH POND (LINED WITH 18 IN. CLAY) 65 ACRES x 50 FT. DEEP
TO FGD SYSTEM
ASH POND (LINED WITH 18 IN. CLAY) 65 ACRES x 50 FT. DEEP
Figure A-9. P l a n t J Waterside Waste Treatment System and Coal P i l e Runoff Col lect ion System
I i I I '
pond decants t o t h e r e c y c l e pond and i s reused f o r bottom ash s l u i c i n g and. t o a
l e s s e r degree. as pump seal water. The o n l y waste c u r r e n t l y p e r m i t t e d f o r
o f f - s i t e d isposal i s c o o l i n g tower blowdown.
SAMPLES COLLECTED
Samples were c o l l e c t e d on A p r i l 23-25, 1985. A t t h a t time, t h e o n l y wastewater
be ing t r e a t e d was t h e waters ide waste o f U n i t 1.
o f t h e waters ide wastewater and t r e a t e d water a r e i n d i c a t e d i n F i g u r e A-9.
Sampling p o i n t s r e p r e s e n t a t i v e
An ammoniated EDTA c leaner was used a t P l a n t J f o r t h e b o i l e r c leaning.
Wastewater was discharged t o t h e ash pond. A sample o f t h e un t rea ted wastewater
was c o l l e c t e d from sampl ing p o i n t 1 i n F i g u r e A-9. A t a l a t e r date (approx i -
l r a t e l y one week), p l a n t personnel c o l l e c t e d a sample o f t h e pond water a t p o i n t
3 , a f t e r p a r t i a l t rea tment by UV s u n l i g h t . Table A-8 l i s t s t h e samples taken and
t h e i r descr iD t ions .
T h i s
Table A-8
SAMPLES FRO4 PLANT J
Sample Point ’
J -CPR4 4
J-CPS4 4
J -P-1 3
J-PS 3
J-TkU-1 2
J-V1 1
J-TkUt1 2
J-P+1 3
- ’See F i g u r e P.-9 f o r sample p o i n t l o c a t i o n .
A-46
. . SamDle Description
Coal p i l e r u n o f f l i q u o r c o l l e c t e d a t coal p i l e runof f bas in
Coal p i l e r u n o f f s o l i d s c o l l e c t e d a t coal p i l e r u n o f f bas in
Ash pond supernate c o l l e c t e d b e f o r e EDTA a d d i t i o n
Ash pond s o l i d s c o l l e c t e d before EUTA a d d i t i o n
Thickener underf low 1 iquor c o l l e c t e d b e f o r e EDTA a d d i t i o n
Composite o f t h e EDTA waste co l - l e c t e d from t h e b o i l e r c lean ing
Thickener underflow 1 iquor c o l l e c t e d a f t e r EDTA a d d i t i o n
-
Ash pond supernate c o l l e c t e d a f t e r EDTA a d d i t i o n
SUMMARY
Both t h e coal p i l e runo f f l i q u i d and raw EDTA s o l u t i o n a re RCRA non tox i c waste
because t h e d i sso l ved metal concent ra t ions a re below t h e RCRA maximum l i m i t s .
D i l u t i o n of t h e waters ide wastewater i n t h e th i ckener and ash pond. fo l l owed by
t h e breakdown of t h e EDTA by sun l i gh t , e f f e c t i v e l y reduces t h e i r o n concen t ra t i on
t o near i n i t i a l ash pond l e v e l s a f t e r a one week per iod. Copper and z i n c a re
reduced below 1 mg/L.
DISCUSSION OF RESULTS
Appendix B p resents sample r e s u l t s f rom t h e P l a n t J t rea tment system. Samples
J-V1, J-TkU-1, and J-TkUt1 are t h e raw EDTA s o l u t i o n d i r e c t l y from t h e b o i l e r
c leaning, and t h e t h i c k e n e r underf low be fo re and a f t e r a d d i t i o n o f t h e EDTA
s o l u t i o n , respec t i ve l y . High l e v e l s of boron and magnesium were present i n t h e
t h i c k e n e r underf low be fo re t h e EDTA d ra in . These h igh l e v e l s a re present because
t h e water l e f t i n t h e t h i c k e n e r was from t h e combinat ion part iculate/FGD process.
After the EDTA dra in , t h e i r o n concen t ra t i on i n t h e waters ide wastewater i s
reduced t o 5 pe rcen t of i t s former value. The pH i s ra i sed from s l i g h t l y above 7 t o 8.5. Aluminum and i r o n reniain above 1 mg/L. S u l f a t e l e v e l s a re a l s o high.
Samples J-P-1 and J-Pt1 a re t h e ash pond water before t h e EDTA d r a i n and one week
a f tek t h e EDTA dra in .
s i m i l a r t o t h a t o f t h e th i ckener ; boron and magnesium l e v e l s a r e high. One week
a f t e r t h e EDTA has been dra ined t o t h e pond, t h e i r o n concen t ra t i on i s l e s s than
5 mg/L.
c h e l a t e by s u n l i g h t (UV r a d i a t i o n ) . As t h e c h e l a t e i s broken, t h e hydroxide
s o l u b i l i t y l i m i t i s exceeded. causing t h e i r o n t o p r e c i p i t a t e as f e r r i c
hydroxide. The i r o n l e v e l can be expected t o drop f u r t h e r w i t h t ime as o x i d a t i o n
and h y d r o l y s i s t a k e s place. The copper and z i n c l e v e l s a re q u i t e low. High
magnesium and s u l f a t e l e v e l s a re due t o t h e ash/FGD scrubber systems.
The composi t ion of t h e pond water i n i t i a l l y p resent i s
Th is i s due t o t h e combined e f f e c t s of d i l u t i o n and break ing o f t h e EDTA
Sample J-CPR4 i s t h e coa l p i l e runoff l i q u o r c o l l e c t e d a t t h e coa l p i l e r u n o f f
basin. A l l of t h e t r a c e meta ls a re below 1 mq/L. The water from t h i s pond i s
re.turried t o t t i e p l a n t fw use as pump sea'l water and i s no t discharged.
A-47
SOLID WASTE
The s o l i d waste streams, as de f ined by RCRA, i n c l u d e t h e EDTA wastewater and coal
p i l e runof f . Although both are l i q u i d , they a r e de f ined as s o l i d waste (40 CFR
261.2, D e f i n i t i o n of s o l i d waste).
elemental concent ra t ions found i n t h e coal p i l e runof f and t h e raw EDTA s o l u t i o n .
I n both cases, s ince t h e wastes are l i q u i d w i t h l e s s than 0.5 percent so l i ds ,
they a r e analyzed d i r e c t l y and compared t o RCRA l e v e l s .
t h e RCRA maxlmum 1 fmi ts .
Appendix C presents a comparison o f t h e
Both samples a r e below
A-48
PLANT K
Samples o f raw and t r e a t e d f i r e s i d e wastewater, p o l i s h i n g pond water, and a
combined sludge fran t h e t reatment process were obta ined i n June 1985 from P lan t
K.
PLANT DESCRIPTION
The p l a n t s i t e i s l oca ted i n t h e Nor theast EPRI Data Region. There are two
o i l - f i r e d b o i l e r s , 180 tW each. t h a t burn No. 6 o i l . Low volume wastes a r e
t r e a t e d on-site. us ing c a u s t i c and lime, i n a u t i l i t y owned f a c i l i t y . Dur ing t h e
sampling period. f i r e s i d e wastewater was being processed.
The f i r e s i d e o f t h e b o i l e r i s cleaned du r ing annual two week outages. Approx-
imate ly 1.6 m i l l i o n ga l l ons o f a i r preheater waste a r e generated. Every f o u r
years t h e r e i s a major outage when bo th t h e f i r e s i d e and waters ide of t h e b o i l e r s
a r e cleaned.
WASTE MANAGEMENT
F igu re A-10 presents a general schematic o f t h e t rea tment system a t P l a n t K.
Also i n d i c a t e d i n t h e f i g u r e are t h e sampling p o i n t s around t h e system. The a i r
preheater was washed w i t h h igh pressure water, and t h e waste water c o l l e c t e d and
sent v i a sumps t o e q u a l i z a t i o n bas in 2. The bas in i s l l n e d w i t h a membrane and
ho lds 2.6 m i l l i o n g a l l o n s of wastes.
Wastewater from t h e bas in i s pumped t o t h e t rea tment system where t h e pH i s
ad jus ted i n a 9000 g a l l o n tank. The pH i s ra i sed t o between 9 and 11 us ing
caus t ic , which p r e c i p i t a t e s t h e d isso lved meta ls as hydroxides. The pH-adjusted
stream i s sent t o t h e c l a r i f i e r where polymer i s added t o e f f e c t f l o c c u l a t i o n and
c l a r i f i c a t i o n .
mate ly 600 gpm. Underflow frm t h e c l a r i f i e r i s recyc led back t o t h e c l a r i f i e r
as seed mate r ia l . Since i n d i v i d u a l c lean ings do n o t war ran t ope ra t i ng t h e vacuum
f i l t e r . t h e under f low i s o n l y p e r i o d i c a l l y dewatered i n t h e vacuum f i l t e r . The
sludge i s drummed and cont rac ted ou t f o r l and d isposal .
c l a r i f i e r goes t o a 90,000 g a l l o n p o l i s h i n g pond where f u r t h e r reac t i ons and
s e t t l i n g may occur. A p o r t i o n of t h e over f low from t h e p o l i s h i n g pond i s r e c i r -
c u l a t e d t o t h e power p lan t . The r e s t o f t h e pond over f low i s ad justed t o near
neu t ra l pH w i t h a c i d before subsequent ocean discharge.
The c l a r i f i e r volume i s 20,000 g a l l o n s w i t h a f l o w r a t e o f approxi-
Overflow from t h e
? cn 0
EQUALIZATION BASIN 2 CAUSTIC
FEED
POLYMER
LINED POND POWER 2 6 MILLION G
EQUALIZATION
(FLY ASH) BASIN 1 pH ADJUSTMENT
TANK %OW G
20,OWG 900,WOG CONCRETE TANK
250,WO G
SLUDGE TO CONTRACTED
DISPOSAL
L RECIRCULATION
ACID FEED
ADJUSTMENT TANK
a SAMPLING POIN1
F igure A-10. P l a n t K Low Volume Waste Treatment System
I ~l
SAMPLES COLLECTED
Samples were c o l l e c t e d on June 9, 1985. A t t h a t time, f i r e s i d e wastewater from
t h e c l e a n i n g of t h e a i r preheater was being t rea ted .
p o i n t s 1. 2 , 3, 4. and 5 as shown i n F i g u r e A-10.
were c o l l e c t e d from p o i n t s 1 and 2 , represent ing t h e sump and e q u a l i z a t i o n basin,
respec t ive ly .
should have t h e same composit ion.
Samples were c o l l e c t e d from
A i r preheater waste samples
Only samples from p o i n t 1 were analyzed s ince bo th o f t h e samples
Sample p o i n t 3 represents t h e water q u a l i t y a f t e r p r imary treatment, and sample
p o i n t 4 represents t h e f i n a l water q u a l i t y . Sample p o i n t 5 i s t h e t h i c k e n e r
underflow and was taken f o r s o l i d waste ana lys is . The vacuum f i l t e r was n o t i n
o p e r a t i o n a t t h e t i m e o f sampling.
Samples of waste from t h e s tack wash and p r e c i p i t a t o r wash were c o l l e c t e d w i t h i n
t h e f o l l o w i n g two weeks by p l a n t personnel. These samples represent composites
of t h r e e grab samples taken one hour a f t e r s t a r t o f washing, a t t h e m i d p o i n t of t h e wash, and near t h e end o f washing.
SUMMARY
The s o l i d wastes present a t P l a n t K a r e c l a r i f i e r sludge and e l e c t r o s t a t i c
p r e c i p i t a t o r and s tack wash s o l i d s . The e l e c t r o s t a t i c p r e c i p i t a t o r waste was
t o x i c by RCRA procedure; cadmium l i m i t s were exceeded i n bo th t h e EP and
TCLP/Liquid t e s t s (under t h e proposed procedure f o r t h e TCLP, any l i q u i d p resent
i n a sludge i s analyzed separa te ly from t h e s o l i d e x t r a c t ) .
s o l i d wastes were found t o be t o x i c by RCRA procedures.
None o f t h e o t h e r
Ana lys is o f t h e e f f l u e n t from t rea tment of t h e a i r preheater waste showed t h a t
a l l o f t h e meta ls concentrat ions, except vanadium. were reduced below 1 mg/L.
The vanadium c o n c e n t r a t i o n i n t h e e f f l u e n t was under 2 mg/L.
DISCUSSION OF RESULTS
Appendix B p resents sample r e s u l t s from t h e P l a n t K t rea tment system.
samples were taken as grabs and do n o t represent an average e f f l u e n t q u a l i t y .
Samples K-APrl. K-Tk03, and K-P4 were taken a t t h e a i r preheater wastewater,
t h i c k e n e r overf low and p o l i s h i n g basin, r e s p e c t i v e l y . The raw f i r e s i d e
wastewater c o n t a i n s i ron , n icke l , and vanadium above 1 mg/L. The c a u s t i c
t rea tment removes most o f these metals. b u t vanadium i s s t i l l s l i g h t l y above 1
These
A - 5 1
mg/L.
same, except f o r lower vanadium l e v e l s i n t h e f i l t e r e d sample. Th is suggests
t h a t f i n e s o o t and ash p a r t i c l e s may be respons ib le f o r t h e vanadium present.
The f i l t e r e d and u n f i l t e r e d raw f i r e s i d e wastewater a r e e s s e n t i a l l y t h e
The composi t ions o f t h e t r e a t e d f i r e s i d e wastewater from t h e c l a r i f i e r and
p o l i s h i n g pond a r e a l s o very s i m i l a r . Th is i n d i c a t e s t h a t f u r t h e r r e a c t i o n s
w i t h i n t h e p o l i s h i n g pond a r e minimal, as expected. The s l i g h t increases i n
aluminum, magnesium, and vanadium concent ra t ions i n t h e p o l i s h i n g pond over those
found i n t h e c l a r i f i e r overf low may be due t o p rev ious wastes conta ined i n t h e
pond.
SOLID WASTES
The s o l i d waste samples i n c l u d e c l a r i f i e r sludge. s tack wash so l ids. e l e c t r o -
s t a t i c p r e c i p i t a t o r wash s o l i d s , and t h e a i r preheater l i q u i d . Although t h e
l a t t e r sample i s a l i q u i d and t r e a t e d f o r discharge, it i s defined as a s o l i d
waste under RCRA (40 CFR P a r t 261.2, D e f i n i t i o n of s o l i d waste).
Appendix B p resents t h e a n a l y s i s of t h e c l a r i f i e r sludge and t h e e l e c t r o s t a t i c
p r e c i p i t a t o r wash s o l i d s . The sludge c o n s i s t s p r i m a r i l y of calcium, i ron,
magnesium, and vanadium. Due t o t h e o p e r a t i n g pH o f t h e c l a r i f i e r , these species
would presumably be present as hydroxides, except f o r vanadium, which i s probably
found i n t h e pentox ide form. The e l e c t r o s t a t i c p r e c i p i t a t o r wash s o l i d s a l s o
c o n s i s t p r i m a r i l y of calcium, i r o n , magnesium, and vanadium.
Three types o f e x t r a c t i o n procedures were performed on t h e sludge; t h e EPA
E x t r a c t i o n Procedure (EP), t h e proposed T o x i c i t y C h a r a c t e r i s t i c Leaching Proce-
dure (TCLP), and t h e C a l i f o r n i a Assessment Manual (CAM) Waste E x t r a c t i o n Test.
The EP, TCLP and CAM t e s t r e s u l t s a r e presented i n Appendix C a long w i t h t h e RCRA
maximum c o n c e n t r a t i o n l i m i t s . As shown i n Appendix C, t h e e l e c t r o s t a t i c p r e c i p i -
t a t o r wash exceeded t h e RCRA l i m i t s f o r cadmium i n both t h e EP and TCLP/Liquid
t e s t s . I n t h e CAM t e s t s , t h e STLC l i m i t s fo r cadmium, n i c k e l , and vanadium were
exceeded by t h e e l e c t r o s t a t i c p r e c i p i t a t o r s o l i d s .
more aggress ive than t h e o t h e r two procedures due t o t h e use o f a c i t r a t e b u f f e r
and a l a r g e r e x t r a c t i o n t ime.
values.
The CAM t e s t i s genera l l y
The TCLP r e s u l t s a r e t y p i c a l l y lower than t h e EP
Appendix C a l s o presents a comparison of t h e f i l t e r e d and u n f i l t e r e d f i r e s i d e
wastewater t o RCRA s o l i d waste r e g u l a t o r y l i m i t s .
w i t h l e s s t h a n 0.5 percent so l ids , they a r e analyzed d i r e c t l y and compared t o t h e
RCRA l i m i t s . Both samples a r e w e l l below t h e maximum a l lowab le l i m i t s .
Since t h e wastes a r e l i q u i d s
A-52
PLANT L
Samples of EDTA b o i l e r chemical c lean ing waste and coa l p i l e runo f f were obta ined
i n June 1985 from P l a n t L.
PLANT DESCRIPTION
The p l a n t i s l o c a t e d i n t h e East Centra l EPRI Data Region and has t h r e e u n i t s
w i t h a t o t a l capac i t y o f about 780 W. The p l a n t burns subbituminous coal from
t h e Powder R i v e r Basin. Dur ing t h e sampling period, one 317 MW u n i t was being
cleaned. Other low volume wastes ( coa l p i l e runof f , f l o o r drains, etc.) a re
t r e a t e d on s i t e and sent t o ash basins.
Waterside washing occurs every t h r e e years and generates about 80,000 g a l l o n s of
wastewater per u n i t .
WASTE MANAGEMENT
F i g u r e A-11 presents a general schematlc of t h e coa l p i l e runoff t reatment system
a t P l a n t L. b o i l e r . The steam drum, round drum, and w a l l tubes were cleaned us ing c i r c u l a t e d
Vertan 675, which con ta ins ammoniated EDTA. The s o l u t i o n was c i r c u l a t e d i n t h e
b o i l e r a t a temperature between 200 and 3000F f o r i r o n sca le removal.
est imated i r o n removal was achieved, a i r was added t o supply t h e oxygen necessary
for copper removal. When t h e des i red copper removal was achieved, t h e s o l u t i o n
wa5 dra ined from t h e b o i l e r t o h o l d i n g tanks.
s o l u t i o n had been h e l d i n t h e b o i l e r f o r t h r e e days.
usual due t o problems w i t h t h e c i r c u l a t i o n pumps.
The EDTA s o l u t i o n from t h e b o i l e r c lean ing i s i n c i n e r a t e d i n a
A f te r t h e
A t t h e t in ie o f sampling, t h e EDTA
T h i s time was longer than
The wastewater h e l d i n t h e s torage tanks i s evaporated i n one o f t h e b o i l e r s by
i n j e c t i o n through 4 nozz les a t f lows o f 20 gpm per nozzle.
t o 50 p s i a r e mainta ined a t t h e nozz le heads.
F l u i d pressures o f 40
Coal p i l e r u n o f f i s c o l l e c t e d around t h e per imeter of t h e coal p i l e and dra ined
t o t h e c o l l e c t i o n basin. From t h e basin. t h e water normal ly proceeds t o a
coalescer, where so l i ds , o i l , and water a re separated. A t t h e t in ie o f sanlpling,
t h e coalescer was n o t i n operat ion. The water i s then pumped froni t h e coalescer
( o r basin. when t h e coalescer i s n o t i n use) t o one of two ash ponds. The ash
bas ins a r e a c o l l e c t i o n o f bot tom ash, p y r i t e s , and miscel laneous p l a n t waters.
A -53
Q
A-54
SAMPLES COLLECTED
Samples were c o l l e c t e d on June 15, 1985. A t t h a t time, waters ide washing o f t h e
b o i l e r s was being conducted.
composite from a s l i p stream dur ing d r a i n i n g of t h e b o i l e r . The sample was w e l l
mixed and smal le r a l i q u o t s were taken f o r ana lys is .
c o l l e c t e d from t h e dra inage t rench f low ing from t h e coa l p i l e t o t h e c o l l e c t i o n
bas in ( p o i n t 1 i n F igu re A-11).
A sample of t h e EDTA waste was c o l l e c t e d as a
Coal p i l e runof f was
DISCUSSION OF RESULTS
Appendix B presents sample r e s u l t s from t h e P l a n t L waste system.
t h e spent EDTA so lu t ion .
by copper, n icke l . and z inc. Other t r a c e metals, such as aluminum, chromium,
manganese, and lead a r e present above 1 mg/L. As s ta ted prev icus ly , t h i s waste
i s evaporated i n a b o i l e r .
w i t h t h e d isposal method.
Sample L-V1 i s
,The EDTA waste con ta ins h igh l e v e l s of i ron, fo l lowed
Th is p l a n t s i t e c u r r e n t l y has no regu la to ry problems
Sample L-CPRZ i s t h e coal p i l e runof f . Th i s waste con ta ins moderate amounts o f
iron, along w i t h low amounts (above 1 mg/L) o f manganese and n i cke l .
SOLID WASTE
The EDTA waste and coa l p i l e runoff a re de f ined as s o l i d wastes under RCKA (40
CFR, P a r t 261.2, D e f i n i t i o n o f s o l i d waste) even though both samples a r e l i q u i d
streams. Appendix C presents a comparison o f t h e EDTA waste and coa l p i l e runof f
t o s o l i d waste regu la to ry l i m i t s . I n bo th cases. s ince t h e wastes a r e l i q u i d s
w i t h l e s s than 0.5 percent so l ids , they are analyzed d i r e c t l y and compared t o
RCRA concen t ra t i on l i m i t s . Based upon t h e t o t a l chromium concentrat ion, t h e EDTA
stream may be c l a s s i f i e d as a hazardous waste.
A-55
PLANT M
Waste samples obta ined i n J u l y 1985 from P l a n t M inc luded b r i n e concentrator
r e j e c t 1 iqu id, evaporat ion pond 1 iqu id, and evaporat ion pond s o l i d s .
PLANT DESCRIPTION
The p l a n t i s l oca ted i n t h e West EPRI Data Region and has four c o a l - f i r e d u n i t s
genera t ing a t o t a l of 1900 Mw. B r i n e concent ra to r r e j e c t i s sent t o one o f e i g h t
l i n e d evapora t ion ponds f o r u l t i m a t e d isposal .
WASTE MANAGEMENT
P l a n t M has a zero discharge permi t and i s l oca ted i an a r i d regi.c Recycl i ng
of recovered water i s t h e r e f o r e essen t ia l t o p l a n t operation. Large q u a n t i t i e s
of process water a re recovered us ing reverse osmosis systems and b r i n e
concentrators . The f i n a l r e j e c t water fran t h e b r i n e concent ra to rs i s sent t o
evapora t ion ponds f o r disposal. A t o t a l of e i g h t l i n e d ponds have been i n s t a l l e d
t o handle t h e wastewater fran t h e e n t i r e p lant . L i q u i d l e v e l s of 3-6 f e e t a re
kep t i n each pond t o g i v e a maximum evaporat ion r a t e w i t h minimum volume. Low
l i q u i d l e v e l s decrease t h e evaporat ion r a t e because h igh d isso lved s o l i d s depress
t h e water vapor pressure.
The u t i l i t y has t h r e e b r i n e concent ra to rs i n operat ion.
p l a n t wastewater (which inc ludes l o w volume waste).
system blowdown.
One i s used f o r general
The o the r two process FGD
SAMPLES COLLECTED
Samples were c o l l e c t e d on J u l y 10, 1985 a t p o i n t s l i s t e d i n Table A-9.
sample o f b r i n e concent ra to r r e j e c t was taken from t h e general wastewater system.
The samples o f evapora t lon pond l i q u i d s and s o l i d s were obta ined from pond S-4,
which has o n l y rece ived general wastewater b r i n e concentrate s ince s ta r tup .
The
A-56
Tab le A-9
SAMPLES FROM PLANT SITE M, JULY 10, 1985
SamDle.
M-BC1
M-P2
M-S2
SamDle D e s c r m n
B r i n e concent ra te r e j e c t l i q u i d
Evapora t ion pond l i q u i d
Evaporat ion pond s o l i d s
SUMMARY
The evapora t ion pond s o l i d s were found t o be a RCRA nontox ic waste. The t o x i c i t y
t e s t i n g us ing bo th t h e c u r r e n t E x t r a c t i o n Procedure (EP) and t h e T o x i c i t y Charac-
t e r i s t i c Leaching Procedure (TCLP), under development, showed e x t r a c t a b l e concen-
t r a t i o n s of metal w e l l below t h e RCRA maximum a l l owab le concent ra t ions . The pond
l i q u i d , however, d i d exceed t h e RCRA s o l i d waste r e g u l a t o r y l i m i t f o r selenium.
The b r i n e concent ra to r r e j e c t l i q u i d con ta ins aluminum, i ron . copper, and z i n c a t
l e v e l s above 1 mg/L. Both t h e r e j e c t and pond l i q u i d s c o n t a i n h igh l e v e l s o f
sodium, su l fa te , and c h l o r i d e . The pond l i q u i d does con ta in h ighe r l e v e l s o f
d i sso l ved metals than t h e b r i n e concen t ra to r r e j e c t due t o concen t ra t i on by
evaporat ion.
DISCUSSION OF RESULTS
Appendix B p resents sample r e s u l t s from t h e P l a n t M t rea tment system.
concent ra to r r e j e c t con ta ins very h i g h l e v e l s of sodium, ch lo r i de , and su l fa te .
Aluminum, copper, i ron , manganese, and z i n c a re p resent above 1 mg/L. The l e v e l
of d i sso l ved s o l i d s i s 104,000 mg/L o r 10.4 percent t o t a l d i sso l ved s o l i d s .
The b r i n e
The pond water a l s o con ta ins h igh l e v e l s of sodium and s u l f a t e . b u t has a lower
c h l o r i d e l e v e l . I n a d d i t i o n t o aluminum, copper, i ron , manganese, and zinc. t h e
pond water a l s o con ta ins c o b a l t and selenium above 1 mg/L.
between t h e pond water and b r i n e r e j e c t a r e probably due t o t h e na ture o f p rev i -
ous general wastes t r e a t e d and disposed i n t h e pond, and t o evaporat ion. Evapora-
t i o n o f t h e pond l i q u i d w i l l concent ra te t h e metals a l ready present, and over
tire, lead t o an inc rease i n t h e o v e r a l l metals concent ra t ion .
The d i f f e r e n c e s
A-57
SOLID WASTE
The s o l i d waste samples i nc lude t h e evapora t ion pond so l ids , b r i n e concen t ra to r
r e j e c t l i q u i d , and evapora t ion pond l i q u i d .
streams, bo th a re de f ined as s o l i d waste (40 CFR 261.2. D e f i n i t i o n o f s o l i d
waste).
Al though t h e l a s t two a r e l i q u i d
Three t ypes o f e x t r a c t i o n procedures were performed on t h e pond s o l i d s :
E x t r a c t i o n Procedure (EP), t h e proposed T o x i c i t y C h a r a c t e r i s t i c Leaching Proce-
dure (TCLP), and t h e C a l i f o r n i a Assessment Manual (CAM) Waste E x t r a c t i o n Test.
The r e s u l t s o f t h e EP and TCLP, along w i t h t h e RCRA maximum a l l owab le
concentrat ions, a re presented i n Appendix C. The r e s u l t s of t h e CAM t e s t and t h e
CAM So lub le Threshold L i n l i t Concentrat ions a r e shown i n Appendix C also.
pond s o l i d s d i d n o t exceed t h e l i m i t s on any o f t h e tes ts .
g e n e r a l l y more aggress ive than t h e o t h e r two, s ince a c i t r a t e b u f f e r and longer
e x t r a c t i o n t i m e a r e used.
t h e EPA
The
The CAM e x t r a c t i o n i s
Appendix C also presents a comparison o f t h e l i q u i d samples t o RCRA s o l i d waste
r e g u l a t o r y l i m i t s .
and compared t o RCRA maximum concen t ra t i on l i m i t s .
l i q u i d d i d n o t exceed t h e RCRA l i m i t s . The pond water. however, d i d exceed t h e
t o x i c i t y concen t ra t i on l i m i t f o r selenium.
Since t h e samples a r e l i q u i d s , they were analyzed d i r e c t l y
The b r i n e concent ra to r r e j e c t
A-58
PLANT N
Samples were c o l l e c t e d a t P l a n t N i n August 1985 f o r general p l a n t wastewater
( b r i n e concent ra to r feed), product water, r e j e c t l i q u i d . and r e j e c t s o l i d s f rom
P l a n t N.
PLANT DESCRIPTION
The p l a n t i s l o c a t e d i n t h e West EPRI Data Region and has 3 c o a l - f i r e d b o i l e r s
w i t h a genera t i ng ou tpu t of over 1,300 W .
p l a n t has a dry ash hand l i ng system and wet and dry FGD systems.
A nearby mine supp l i es t h e coal. The
WASTE F/ANAGEMEb!T
P l a n t N i s a z e r o discharge f a c i l i t y i n a water l i m i t e d region. Consequently, a
maximum e f f o r t i s made t o r e c y c l e a l l o f t h e water. B r i n e concent rd to rs a re key
process u n i t s i n t h e water management scheme, a long w i t h t h r e e types o f ponds.
General p l a n t wastewater ( c o o l i n g tower blowdown, FGD l i q u o r , etc.) i s sen t t o
t h e medium q u a l i t y pond. Th is pond feeds t h e b r i n e concent ra to rs . Product water
i s s to red i n t h e h i g h q u a l i t y pond f o r use as system makeup. Re jec t s l u r r y i s
sent t o a nearby decant bas in where t h e b u l k o f t h e s o l i d s a re removed. Re jec t
l i q u i d then f l ows t o t h e low q u a l i t y evapora t ion pond f o r u l t i m a t e disposal . The
s o l i d s i n t h e decant bas in a re removed semiannually and disposed o f w i t h t h e h igh
volume wastes i n t h e coa l mine.
SAMPLES COLLECTED
Several samples were c o l l e c t e d on August 21, 1905. The samples a re l i s t e d i n
Table A-10. Th is s t a t i o n i s o n i y several years old. Dur ing st:artup, t h e water
bala.nce was o f t e n overloaded, which caused a l l of t h e ponds t o rece ive r e l a t i v e l y
h i g h q u a l i t y water.
however, t h e low q u a l i t y evapora t ion pond s t i l l has a r e l a t i v e l y low d i sso l ved
s o l i d s concent ra t ion . Consequently. no pond samples were obtained. Samples were
taken of t h e feed, p roduc t and ' r e j e c t f rom t h e b r i n e concent ra to r . A d d i t i o n a l l y ,
a sample of p y r i t e s was ob ta ined f o r ana lys i s and l a b o r a t o r y t e s t s .
I n t h e l a s t few years t h i s circumstance has been corrected;
A-59
SamDle.
N-WW1
N-Prod2
N-BCFU
N-S3
Table A-10
SAMPLES COLLECTED AT PLANT N AUGUST 1985
D n s c r i o t i o n
Wastewater fed t o t h e b r i n e concent ra to r
Product water f rom t h e b r i n e concent ra to r
B r i n e concent ra to r r e j e c t l i q u i d
Sludge from decant bas in
. .
SUMMARY
A l l o f t h e streams sampled were found t.o be RCRA non tox i c s o l i d wastes.
t o x i c i t y t e s t i n g us ing t h e c u r r e n t E x t r a c t i o n Procedure (EP) and two v a r i a t i o n s
of t h e T o x i c i t y C h a r a c t e r i s t i c Leaching Procedure (TCLP), under development,
showed e x t r a c t a b l e concent ra t ions o f meta ls w e l l below t h e RCRA maximum a l l owab le
l i m i t s f o r t h e r e j e c t so l ids . t h e r e j e c t l i q u i d . and t h e p l a n t wastewater.
The
The b r i n e concent ra to r r e j e c t l i q u i d contained boron and z i n c a t 20 mg/L.
low q u a l i t y pond increases i n s a l i n i t y . o the r elements may become more concen-
t r a t e d .
As the
DISCUSSION OF RESULTS
Appendix B p resents t h e a n a l y t i c a l r e s u l t s f o r t h e th ree l i q u i d streams and one
s o l i d stream sampled. The wastewater con ta ins p r i m a r i l y calcium, magnesium.
sodium, su l fa te , and c h l o r i d e , a l l species commonly p resent i n c o o l i n g tower
blowdown and FGD l i q u i d . No t r a c e metals a r e present a t s i g n i f i c a n t l eve l s .
Approximately 98 percent of t h e wastewater i s recovered as product water o f very
h i g h q u a l i t y .
t o i t s v o l a t i l i t y .
Only boron i s n o t s i g n i f i c a n t l y renioved from t h e feed stream due
The r e j e c t l i q u i d con ta ins h igh l e v e l s of t h e f i v e major species mentioned above
an$ lower l e v e l s of boron and zinc.
a rsen ic a t 0.5 rog/L.
The o n l y o t h e r element o f poss ib le no te i s
The r e j e c t s o l i d s a re p r i n i a r i l y ca lc ium su l fa te .
A-60
SOLID WASTE
S o l i d waste samples, according t o 40 CFR, Subpart B 260.10, i n c l u d e bo th l i q u i d
and s o l i d streams. These streams a r e t h e wastewater and t h e r e j e c t l i q u i d and
so l i ds . The r e j e c t s o l i d s were processed us ing f o u r types o f e x t r a c t i o n proce-
dures; t h e EP i n Appendix I1 of 40 CFR P a r t 261. t h e o r i g i n a l l y proposed TCLP
( o l d ) , a newer proposed TCLP (new) and t h e C a l l f o r n i a Assessment Manual (CAM)
Waste E x t r a c t i o n Test. The CAM t e s t represents a s t a t e procedure more s t r i n g e n t
than t h e fede ra l methods and i s i nc luded f o r t h a t reason. Appendix C presents
t h e p e r t i n e n t c r i t e r i a rega rd ing t h e methodology of each procedure.
procedures d i f f e r i n t h e l each ing f l u i d and i t s method o f i n t roduc t i on .
The two TCLP
Appendix C presents t h e r e s u l t s of t h e EP, TCLP, and CAM e x t r a c t i o n s of t h e b r i n e
concen t ra to r so l i ds . None of t h e analyses produced a t o x i c metal concent ra t ion .
A-61
PLANT 0
Low volume waste samples of b r i n e concent ra to r r e j e c t , t h e pond so l i ds , and t h e
pond l i q u i d were ob ta ined i n August 1985 Prwn P l a n t 0.
PLANT DESCRIPTION
The p l a n t i s l o c a t e d i n t h e West EPRI Data Region and has two c o a l - f i r e d b o i l e r s
w i t h a genera t ing ou tpu t over 500 Mw. A nearby mine supp l i es t h e coal. The
p l a n t i ises a d ry f l y ash hand l i ng system.
WASTE MANACEMEI’IT
P l a n t 0 is a ze ro discharge f a c i l i t y i n a water l i m i t e d region. Consequently, a
maximum e f f o r t i s made t o r e c y c l e a l l o f t h e water. The b r i n e concent ra to r i s a
key process u n i t i n t h e water management scheme, a long w i t h t h r e e types of ponds.
General p l a n t wastewater ( c o o l i n g tower blowdown, o t h e r drains, e t c . ) i s sen t t o
t h e medium q u a l i t y pond. Th is pond feeds t h e b r i n e concent ra to r . Product water
i s s to red i n t h e h i g h q u a l i t y pond f o r use as system makeup and r e j e c t s l u r r y i s
sent t o an evapora t ion pond.
SAMPLES COLLECTED
On August 21 several samples were c o l l e c t e d a t P l a n t 0, as shown i n Table A-11.
Samples o f t h e b r i n e concent ra to r r e j e c t , pond water, and s o l i d s were obtained.
The pond water sample was taken across t h e pond from t h e r e j e c t entrance.
sample o f p y r i t e s was a l s o ob ta ined f o r a n a l y s i s and labo ra to ry tes ts .
A
Table A-11
SAMPLES COLLECTED AT PLANT 0, AUGUST 1985
s - a w k l h
0-BCR1
0-P2
0-52
0-Py
D e s c r i o t i o n
B r i n e concent ra to r r e j e c t
Evaporat ion pond water
Sludge s o l i d s from pond
P y r i t e s frm p u l v e r i z e r
. .
A-62
SUMMARY
A l l of t h e streams sampled were found t o be RCRA non tox i c s o l i d wastes. The pond
s o l I d s were t e s t e d u s i n g t h e c u r r e n t E x t r a c t i o n Procedure. two a l t e r n a t e T o x i c i t y
C h a r a c t e r i s t i c Leaching Procedures and t h e CAM Waste E x t r a c t i o n Test.
e x t r a c t a b l e metal concent ra t ions were above t h e l i m i t s f o r any of those
p roced ures.
No
DISlXlSSION OF RESULTS
Appendix B p resents t h e a n a l y t i c a l r e s u l t s f o r t h e two l i q u i d streams and one
s o l i d stream sampled. The r e j e c t s l u r r y and pond water con ta in p r i m a r i l y c a l c i -
um, magnesium, sodium. su l fa te , and ch lo r ide , a l l species commonly present i n
c o o l i n g tower blowdown and makeup water.
c a n t l e v e l s . The r e j e c t s o l i d s a re p r i i n a r i l y ca lc ium su l fa te .
No t r a c e metals a re present a t s i g n i f i -
S O L l D WASTE
S o l i d waste samples, according t o 40 CFR, Subpart B 260.10, i nc lude bo th l i q u i d
and s o l i d streams. These streams a re t h e r e j e c t s l u r r y , and pond s o l i d s and
l i q u i d . The pond s o l i d s were processed us ing f o u r t ypes of e x t r a c t i o n proce-
dures; t h e EP i n Appendix I1 o f 40 CFR P a r t 261, t h e o r i g i n a l l y proposed TCLP
( o l d ) , a newer proposed TCLP (new) and t h e C a l i f o r n i a Assessment. Manual (CAM)
Waste E x t r a c t i o n Test. The CAM t e s t represents a sta. te procedure more s t r i n g e n t
than t h e fede ra l methods and i s i nc luded f o r t h a t reason. Appendix C prEsents
t h e p e r t i n e n t c r i t e r i a rega rd ing t h e methodology o f each procedure. The two TCLP
procedures d i f f e r i n t h e l each ing f l u i d and i t s method o f i n t r o d u c t i o n .
Appendix C a l s o presents t h e r e s u l t s of t h e EP, TCLP, and CAM e x t r a c t i o n s o f t h e
s o l i d s . None o f t h e m a l y s e s produced a t o x i c metal concentrat ion.
A-63
PLANT P
Samples of c i t r a t e b o i l e r chemical c lean ing waste. waters ide r i n s e water, and ash
pond e f f l u e n t before and a f t e r a d d i t i o n of t h e waters ide wastewater were ob ta ined
i n J u l y 1985 from P l a n t P.
PLANT DESCRIPTION
The p l a n t i s l o c a t e d i n t h e Eas t Cen t ra l EPRI Data Region and has two 535 Fki u n i t s t h a t burn Ind iana coal .
ponds.
The pr imary ash pond ho lds the m a j o r i t y of t h e f l y ash and b o t t m ash.
Low volume wastes a r e t r e a t e d on s i t e us ing ash
Dur ing t h e sampling period, waters ide wastewater was be ing processed.
B o i l e r chemical c lean ing i s conducted every f i v e years. Approximately 190,000
g a l l o n s o f waste and r i n s e waters a re produced every f i v e years for each o f t h e
two un i t s .
WATER MANAGEMENT
F igu re A-12 presents a schematic o f t h e ash pond t rea tment system a t P l a n t P. Also i n d i c a t e d i n t h e f f g u r e a r e t h e sampling po in ts . The b o i l e r t h a t was
cleaned d u r i n g t h e sampling pe r iod has a t o t a l fill volume o f 63,000 gal lons.
Dur ing c leaning, about 5,000 ga l l ons o f water were drained and rep laced w i t h
c i t r a t e s o l u t i o n s u f f i c i e n t t o produce an o v e r a l l 3 percent c i t r a t e
concent ra t ion .
i r o n and copper; 5.000 l b s i r o n (as Fe30q) and 50 l b s copper.
heated i n t h e b o i l e r t o about 392% and c i r c u l a t e d w i t h pumps. Dur ing t h e f i r s t
stage, i r o n i s removed w i t h t h e s o l u t i o n a t pH 3.5. When t h e des i red i r o n
removal i s achieved, t h e pH i s r a i s e d t o between 9 and 9.5 w i t h ammonia. Sodium
n i t r i t e i s added as an o x i d i z i n g agent t o s o l u b i l i z e copper deposits. The e n t i r e
process takes about 12 hours, a f t e r which t h e c i t r a t e s o l u t i o n i s d ra ined under a
s l i g h t head of n i t r o g e n gas (about 10 pounds per square inch) .
t hen r i nsed t w i c e w i t h water.
pr imary ash pond hold5 n1os.t of t h e f l y ash and bottom ash. The main o u t l e t of
water. from t h e pr imary pond i s by seepage under t h e d i k e t o t h e secondary pond.
An over f low w e i r a t t h e u n l i n e d secondary pond c o n t r o l s t h e f low o f e f f l u e n t t o
t h e r i v e r .
T h i s concen t ra t i on was se lec ted t o remove t h e des i red weight of
The s o l u t i o n i s
The b o i l e r i s
A l l of t h e d r a i n s a re sent t o t h e ash pond. The
SAMPLES COLLECTED
Samples were c o l l e c t e d on J u l y 6, 1985.
be ing dra ined and sent t o t h e ash pond.
A t t h a t t ime waters ide wastewater was
Samples o f t h e b o i l e r c lean ing drain,
A-64
CLEANING SOLUTION
OVERFLOW TO RIVER
PRIMARY SECONDARY BOILER ASH POND POND
F igure A-12. P l a n t P Ash Pond Treatment o f Boiler Cleaning Waste
I ~I I '
t h e f i r s t r inse, and t h e secondary pond e f f l u e n t b e f o r e waste entered t h e pond
were c o l l e c t e d from p o i n t s 1 and 2 as shown i n F i g u r e A-12.
P l a n t personnel c o l l e c t e d samples o f t h e secondary pond e f f l u e n t 2 , 4, 7, and 14
days a f t e r t h e c i t r a t e s o l u t i o n was dra ined i n t o t h e pond. These samples were
ob ta ined from p o i n t 2.
DISCUSSION OF RESULTS
Appendix B presents sample r e s u l t s from t h e P l a n t P t rea tment system.
be noted t h a t t h e pond e f f l u e n t samples were taken as grabs, and as such do n o t
represent an average e f f l u e n t q u a l i t y .
It should
Samples P-C1 and P-R1 a r e t h e c i t r a t e waste and f i r s t r inse . The c i t r a t e waste
conta ins h i g h l e v e l s of i r o n . Aluminum, chromium. copper, manganese, n i c k e l , and
z i n c a r e p resent above 1 mg/L. The r i n s e water c o n t a i n s copper, i ron, and
manganese above 1 mg/L.
Samples P-PI, P-Pt2, P-Pt4, P-Pt7, and P-Pt14 a r e t h e pond e f f l u e n t before t h e
dra in , and 2, 4, 7. and 14 days a f t e r t h e dra in . The pond e f f l u e n t b e f o r e t h e
d r a i n o n l y c o n t a i n s i r o n above 1 mg/L; a l l o t h e r meta ls a r e below 1 mg/L. The
f i r s t sample a f t e r r e s t a r t i n g f low shows a h i g h e r i r o n l e v e l . 4.1 mg/L. A l l of
t h e subsequent pond e f f l u e n t samples a r e very s i m i l a r i n composition.
concent ra t ions a r e below 1 mg/L. The m t a l complexes i n t h e wastewater a r e most
l i k e l y broken down upon a d d i t i o n t o t h e ash pond due t o t h e combined e f f e c t s o f
biodegradation, UV r a d i a t i o n and d i l u t i o n .
The metals
SOLID WASTE
The s o l i d waste streams. as def ined by RCRA. a r e t h e c i t r a t e and r i n s e water.
Although bo th a r e l i q u i d streams and a r e e v e n t u a l l y discharged, they a r e de f ined
as s o l i d wastes (40 CFR P a r t 261.2. Def in i t ion o f s o l i d waste).
Appendix C p resents a comparison o f t h e c i t r a t e waste and r i n s e water t o RCRA
s o l i d waste a l l o w a b l e c o n c e n t r a t i o n l i m i t s . I n bo th cases, s ince t h e wastes a r e
l i q u i d s w i t h l e s s than 0.5 percent s o l i d s , they a r e analyzed d i r e c t l y and
compared t o t h e RCRA l e v e l s .
chranium.
The c i t r a t e stream exceeded t h e EP l i m i t f o r t o t a l
A-66
PLANT Q
Samples o f p y r i t e s and f l y ash were obta ined i n September 1985 from P l a n t Q i n
o r d e r t o perform 1 aboratory s t u d i e s on codisposal.
PLANT DE SCR I PT I ON
P l a n t Q i s l o c a t e d i n t h e Nor theast EPRI data r e g i o n and i s composed o f two u n i t s
w i t h a t o t a l capac i ty o f 200 W . Pennsylvania coal i s burned a t t h e s t a t i o n .
WASTE MANAGEMENT
P l a n t Q i s i n a s t a t e t h a t cons iders a l l u t i l i t y wastes t o be hazardous and which
determines d isposal requi rements on a case by case basis. A t P l a n t Q, f l y ash i s
l a n d f i l l e d . A Hypalon l i n e r i s used t o p revent leachate contamination. The ash
i s wetted t o 15 t o 20 percent mo is tu re p r i o r t o disposal. P y r i t e s a r e codisposed
w i t h t h e f l y ash i n t h e l a n d f i l l .
year o f f l y ash and about 2,050 t o n s per year of p y r i t e s , roughly two percent o f
t h e ash volume.
The s t a t i o n generates about 110,000 t o n s p e r
SAMPLES COLLECTED
Samples o f moistened f l y ash and p y r i t e s were ob ta ined from t h e p l a n t d u r i n g
September 1985. These samples were used i n a l a b o r a t o r y codisposal study.
Analyses a r e presented i n Appendix 6.
A-67
PLANT R
Samples o f py r i t es , bottom ash and f l y ash were ob ta ined i n September 1985 from
P l a n t R i n o rder t o perform labo ra to ry s tud ies on codisposal.
PLANT DESCRIPTION
P l a n t R i s l oca ted i n t h e Nor theast EPRI data reg ion and i s composed o f two u n i t s
w i t h a t o t a l capac i ty of 160 M. Pennsylvania coal from severa l mines i s burned
a t t h e s t a t i o n .
WASTE MANAGEMENT
P l a n t R i s i n a s t a t e t h a t cons iders a l l u t i l i t y wastes t o be hazardous and which
determines d isposal requirements on a case by case basis. A t P l a n t R, f l y ash
and bottom ash a r e disposed of i n impoundments. P y r i t e s from U n i t 3 a r e
codisposed w i t h t h e f l y ash, w h i l e U n i t 4 p y r i t e s a re sent t o t h e bottom ash
pond. The s t a t i o n generates an est imated 1,000 tons per year o f py r i t es .
SAMPLES COLLECTED
Samples o f f l y ash, bottcm ash and p y r i t e s from each u n i t were obta ined from t h e
p l a n t d u r i n g September 1985. These samples were used i n a l abo ra to ry codisposal
study. Analyses a r e presented i n Appendix B.
A-68
PLANT S
Samples o f p y r i t e s and f l y ash were obta ined i n September 1985 from P l a n t S i n
o r d e r t o perform l a b o r a t o r y s t u d i e s on codisposal.
PLANT DESCRIPTION
P l a n t S i s l o c a t e d i n t h e Nor theast EPRI data r e g i o n and i s cmposed of t h r e e
u n i t s w i t h a t o t a l capac i ty of 1,884 MW. Pennsylvania coal from two mines i s
burned a t t h e s t a t i o n .
WASTE MANAGEMENT
A t p l a n t S, f l y ash and bottom ash a r e disposed o f Tn separate l a n d f i l l s .
P y r i t e s a r e codisposed w i t h t h e bottom ash. The s t a t i o n generates an est imated
1,500 t o n s per month o f p y r i t e s , and 50,000 t o n s per month of f l y ash.
u t i l i t y r o u t i n e l y performs dens i ty and h e a t l n g va lue measurements on t h e p y r i t e s .
Dens i ty v a r i e s from 70 t o 90 pounds per cub ic foot , w i t h heat ing va lues o f 6,000
t o 7,000 B t u per pound.
The
SAElFi E S COLLECTED
Samples o f f l y ash and p y r i t e s from each u n i t were ob ta ined from t h e p l a n t d u r i n g
September 1985.
Analyses a r e presented i n Appendix B.
These samples were used i n a l a b o r a t o r y codisposal study.
A-69
PLANT T
Samples of f i r e s i d e wastewater, t h i c k e n e r overflow, and sludge s o l i d s were ob-
t a i n e d i n September 1985 a t P l a n t T.
PLANT DESCRIPTION
The p l a n t i s l o c a t e d i n t h e Nor theast EPRI Data Region.
of 350 Md each and burns o i l and gas. They have been burn ing predominantly gas
(80 t o 90 percent ) s ince February o f 1985.
The p l a n t has two u n i t s
WASTE MANAGEMENT
The f i r e s i d e s of t h e b o i l e r s a r e cleaned two t o t h r e e t imes per year. The
u t i l i t y does i t s own washing u s i n g two percent soda ash i n water. which i s
sprayed over t h e b o i l e r through spray mani fo lds.
t h e b o i l e r a f t e r t h e soda ash wash f o r a thorough cleaning.
F i r e hoses are used t o r i n s e
Wastewater d r a i n s from t h e b o i l e r through t h e econwnizer i n l e t i n t o a c o l l e c t i o n
sump. From t h e sump, t h e wastewater 1s routed t o a h o l d i n g pond f o r l a t e r t r e a t -
ment i n t h e p l a n t wastewater t rea tment system, o r i s s e n t d i r e c t l y t o t reatment .
For t h e present wash, t h e water was sent d i r e c t l y t o t h e t rea tment system.
F i g u r e A-I3 p resents a s l m p l i f i e d schematic of t h e wastewater t rea tment system.
The wastewater was pumped from t h e c o l l e c t i o n sump d i r e c t l y t o t h e m i x well where
l i m e was added t o r a i s e t h e pH t o about 11 ( t h e pH o f t h e un t rea ted wastewater
was near 5 d u r i n g t h e i n i t i a l hours of cleaning. and near 11 a f t e r 16 hours o f
c lean ing) . A f t e r t h e mix we l l , t h e s l u r r y i s sen t t o t h e c l a r i f i e r where t h e
chemical p r e c i p i t a t i o n r e a c t i o n s occur and t h e s o l i d s s e t t l e out. Discharge from
t h e c l a r i f i e r i s sen t t o a p o l i s h i n g pond where f u r t h e r p r e c i p i t a t i o n may occur.
The water i n t h e p o l i s h i n g pond i s checked t o see t h a t it meets t h e discharge
l i m i t s f o r i ron, copper, and o i l and grease, be fore it i s pH ad jus ted t o between
s i x and n i n e and discharged.
Sludge from t h e c l a r i f i e r underflow i s dewatered t o 15 t o 20 percent s o l i d s by a
b e l t f i l t e r . About 30 c u b i c yards per week o f sludge i s generated and t r a n s -
p o r t e d t o a l i c e n s e d d isposal f a c i l i t y i n t h e nor theast . Cost f o r disposal i s
$55 per c u b i c yard.
A-70
LIME
r - - - FIRESIDE
WASTE
HOLDING POND 400,WO G
DISCHARGE
-0 SAMPLING POlNl SLUDGE TO
OFF-SITE DISPOSAL CU. YDS I WK
BELT FILTER
Figure A-13. P l a n t T Wastewater Treatment System
I i I I '
SAMPLES COLLECTED
Samples were c o l l e c t e d on Septanber 14 and 15, 1985. and are descr ibed i n Table
A-12.
t rea tmen t e f f l u e n t s a r e i n d i c a t e d by p o i n t s 1, 2, and 3 i n F i g u r e A-13.
Sampling p o i n t s used t o c o l l e c t samples o f t h e f i r e s i d e wastewater and
Table A-12
SAMRES FROM FIRESIDE WASHING AT PLANT T, SEPTEMBER 14 AND 159 1985
5adLUL - D e s c u t 1 . . Qn
T-F+l
T-F+16
T-Tk02
T- S3
1
1
2
3
F i r e s i d e wastewater c o l l e c t e d from economizer hopper a f t e r 1 hour of washing
F i r e s i d e wastewater c o l l e c t e d from economizer hopper a f t e r 16 hours o f washing
C l a r i f i e r overf low c o l l e c t e d a f t e r 16 hours o f washing
Sludge from b e l t f i l t e r . Only f i r e s i d e wastewater was being t r e a t e d (16 hours i n t o wash)
See F igu re A-13 f o r sampling p o i n t loca t ions .
SUMMARY
None of t h e samples analyzed are t o x i c accord ing t o t h e EP o r TCLP tes ts .
sludge s o l i d s exceed t h e l i m i t s e t f o r vanadium i n t h e C a l i f o r n i a Assessment
Manual Waste E x t r a c t i o n Test.
The
The l i q u i d f rom t h e f i r s t hours of washing conta ins much h igher l e v e l s o f t r a c e
meta ls than t h a t found a t t h e end o f t h e cleaning. Concentrat ions above 5 mg/L
were found f o r aluminun. cobal t , copper, i ron, and z inc. I n t h e sample c o l l e c t e d
near t h e end o f cleaning, on l y vanadium was present above 5 mg/L.
A-72
DISCUSSION OF RESULTS
The t h r e e l i q u i d streams show progress ive improvement i n water q u a l i t y .
hour f i r e s i d e waste sample con ta ins many t r a c e metals a t h i g h concentrat ions.
t h e end of t h e wash period, o n l y vanadium i s s t i l l present. I n t h e t h i c k e n e r
overf low, t h e on ly metal above 5 my/L i n concen t ra t i on i s vanadrum.
The one
A t
The sludge s o l i d s a re comprised p r i m a r i l y o f magnesium and ca lc ium compounds,
presumably as carbonates s ince soda ash i s used i n t h e wash.
SOLID WASTE
S o l i d waste samples, accord ing t o 40 CFR. Subpart B 260.14, i nc lude bo th l i q u i d
and s o l i d streams. These streams a re t h e wastewater. t h e overf low, and t h e
f i l t e r s o l i d s .
procedures: t h e EP i n Appendix I1 of 40 CFR P a r t 261, t h e o r i g i n a l l y proposed
T o x i c i t y C h a r a c t e r i z a t i o n Leaching Procedure TCLP ( o l d ) . a newer proposed TCLP
(new) and t h e C a l i f o r n i a Assessment Manual (CAM) Waste E x t r a c t i o n Test. The CAM
t e s t represents a s t a t e procedure more s t r i n g e n t than t h e federal methods, and i s
inc luded f o r t h a t reason.
t h e methodology o f each procedure.
i n g f l u i d and i t s method o f i n t r o d u c t i o n .
The f i l t e r s o l i d s were processed us ing f o u r types o f e x t r a c t i o n
Appendix C presents t h e p e r t i n e n t c r i t e r i a rega rd ing
The two TCLP procedures d i f f e r i n t h e leach-
Appendix C p resents t h e r e s u l t s o f t h e EP, TCLP and CAM e x t r a c t i o n s o f t h e
s o l i d s . As seen, t h e new TCLP concen t ra t i on l e v e l s a r e very s i m i l a r t o those
found i n t h e c u r r e n t l y used EP. Th is i s due t o t h e changes made i n t h e TCLP
which r e s u l t e d i n a f i n a l e x t r a c t a c i d i t y very c lose t o t h e a c i d i t y found i n an
EP e x t r a c t . Only t h e vanadium l e v e l i n t h e CAM procedure exceeded a regu la to ry
l i m i t , which would make t h e waste hazardous i n C a l i f o r n i a .
Appendix C a l s o presents t h e a n a l y s i s o f t h e two wastewater samples compared t o
t h e RCRA l i m i t s .
t h e regu la ted metals.
N e i t h e r o f theses samples exceeds t h e RCRA t o x i c i - t y l i m i t s for
A-73
PLANT U
Samples of two b o i l e r chemical c lean ing wastes were ob ta ined i n October 1985 from
P l a n t U: an EDTA s o l u t i o n and an hydroxyacet ic / fo rmic a c i d (HAF) waste.
PLANT DESCRIPTION
The EDTA sample was ob ta ined from one o f f o u r small c o a l - f i r e d b o i l e r s which
power a 60 MW t u rb ine . The HAF sample was ob ta ined from t h e c lean ing o f an 800 M W s u p e r c r i t i c a l c o a l - f i r e d u n i t . Both b o i l e r s a r e l o c a t e d i n t h e East Cen t ra l
EPRI data region.
WASTE MANAGEMENT
The EDTA waste i s evaporated i n one of t h e opera t i ng b o i l e r s .
verba l perni ission f o r t h i s procedure from t h e county a i r q u a l i t y c o n t r o l
personnel.
observable de t r imen ta l effects, according t o t h e p l a n t con tac t .
The u t i l i t y has
Gas sampling conducted du r ing t h e f i r s t evapora t ion revealed no
Spent HAF i s c o l l e c t e d i n a t rea tment bas in and n e u t r a l i z e d w i t h l ime. A f t e r t h e
s o l i d s have p rec ip i t a ted , t h e supernate i s discharged i n accordance w i t h t h e
NPDES requirements.
SAMPLES COLLECTED
U t i l i t y personnel c o l l e c t e d t h e EDTP, waste, t h e f i r s t EDTA rinse, and t h e HAF
waste i n October, 1985.
SUKbIARY
The EDTA waste sample con ta ins l ead above t h e EP t o x i c i t y l i m i t , making it an EP
t o x i c waste according t o 40 CFR P a r t 261.24.
chromium above t h e EP t o x i c i t y l i m i t . and t h e r e f o r e may be sub jec t t o hazardous
waste regu la t i on .
The HAF waste con ta ins t o t a l
The EDTA r i n s e i s n o t hazardous.
The a n a l y s i s o f t h e t h r e e samples i s presented i n Appendix E. The EDTA waste
a l s o c o n t a i n s i g n i f i c a n t l e v e l s of copper, i ron. n i cke l , and zinc. The smal l
s i z e and age of t h i s b o i l e r i n d i c a t e s an o l d e r n te ta l lu rgy fo rmu la t i on than seen
i n o t h e r samples c o l l e c t e d i n t h i s prograa.
waste which has had a h i g h l e a d l e v e l .
b o i l e r con ta ins on ly i r o n and smal l amounts of n icke l , molybdenuni, and chromium.
T h i s i s t h e on ly b o i l e r c lean ing
The HAF waste f rom t h e s u p e r c r i t i c a l
A-74
Appendix B
TABULATION OF RESULTS FOR
SAMPLING AND ANALYSIS OF LOW
VOLUME WASTES AT FOSSIL FUEL-FIRED POWER PLANTS -
!
!
~
j
,
CONTENTS
8- 1
8-2
8-3
8-4
8-5
8-6
8- 7
8-8
8-9
8-10
8-11
8-12
8-13
8- 14
8-15
8-16
8-17
8-16 8-19
8-20
8-21
8-22
Low Volume Wastes Collected and Analyzed Analytical Resul ts -- Plan t A
Analytical Resul ts -- Plan t B
Analytical Resul ts -- Plan t C Analyt ical Result's -- Plan t D Analytical Resul ts -- Plan t E
Analytical Resul t s -- Plan t F
Analytical Results -- Plant G
Analytical Resul t s -- Plan t H
Analytical Resul t s -- Plan t I Analytical Resul t s -- Plan t J
Analytical Resul t s -- Plant K
Analytical Resul t s -- Plant L
Analytical Resul ts -- Plan t M
Analytical Resul t s -- Plan t N
Analytical Resul t s -- Plan t 0 Analytical Resul t s -- Plan t P Analytical Resul t s -- Plan t Q
Analytical Resul t s -- Plan t R Analytical Resul ts -- Plan t S
Analytical Resul t s -- Plan t T
Analytical Resul t s -- Plant U
8-2
8-6
8-7
8-6 8-9 8-10
8-11
8-12
8-14
8-15
8-17
8-18
8-19
8-20
8-21
8-22
8-23
8-25
8-26
6-27
8-28
8-29
6 - i i i
TAENJLATION OF RESULTS FOR SAMPLING AND ANALYSIS
OF LOW VOLUME WASTES
The r e s u l t s o f a n a l y s i s conducted d u r i n g RP2215-1 a r e t a b u l a t e d i n t h i s appendix.
I n general. t h e data a r e ordered by p lant , A through U. The d iscuss fon o f
r e s u l t s f a r each p l a n t i s conta ined i n Appendix A.
, -
I -
I
,
Ela.@z A
EPRI Data Reaion
west
Tab le B-1
LOW VOLUME WASTES COLLECTED AND ANALYZED
E!dd
Gas
B Northeast O i l
W
N
C
D
E
F
West
Nor theast
South Cent ra l
West
Gas
O i l
Gas
C i l
Sanlole f i r e s i d e waste t r e a t e d f i r e s i d e e f f l u e n t EDTA waste t r e a t e d ECTA e f f l u e n t combined s o l i d s
HC1 waste n e u t r a l i ze6 HC1 r i n s e water soda ash r i n s e sludge from bas in t r e a t e d HC1 e f f l u e n t
ammonium bromate waste HC1 k a s t e pond water pond s o l i d s
f i r e s i d e waste c l a r i f i e r supernate sludge s o l i d s c l a r i f i e r underflow
c i t r a t e waste
HAF composite waste t r e a t e d HAF e f f l u w t c l a r i f i e r underflow
T;n9f
A-F A- F A-V A-V A-S
B-HC1 e-HC1 e-R e-SA
B-Ef e-s
c-er C-HCl c-P c-s
D-F D-TkO D-S E-TkU
E-C
F-HAF F-Ef F-S
c a u s t i c t rea tment p reopera t iona l c l e a n i n g l i n e and c a u s t i c t r e a t n e n t f ran t rea tments
waters ide wash PH 6 f i r s t water r i n s e
taken a f t e r l a s t waste f i l t e r e d e f f l u e n t
waters ide wash watersicis wash combined washwaters s ludge from pond
fe r rous s u l f a t e , l i m e t rea tment vacuum f i l t e r percent s o l i d s o n l y
evaporated
hydroxyacet ic / fo rmic and r i n s e s 1 ime a d d i t i o n t rea tment sludge
' I ~I I ' 1
Table B-1 (Continued)
LOW VOLUME WASTES COLLECTED AND ANALYZED
EPRI Data m Realon G West
€u?l Samole O i l composite waste
t r e a t e d e f f l u e n t t rea tment sludge HC1 waste ammonium bromate waste water r i n s e hydraz ine r i n s e
H Southeast
m I w
I Southeast
Coal ammonium bromate waste HC1 waste n e u t r a l i z e d HC1 pond water
Coal HC1 waste HC1 waste t r i s o d i u m phosphate r i n s e coal p i l e runof f ash pond water ash pond water ash pond water ash pond water ash pond water ash pond water
th i ckener be fo re th i ckener a f t e r pond be fo re pond a f t e r coal v i l e runoff
J West Cent ra l Coal EDTA waste
s G-Cmp G-Ef G-S G-HC1 G-Br G-R G-Hy
H-Br H-HC1 H-HC1 -N H-P
I-HC11 I-HC13 I-TSP
I-CPR I-P-1 I-P+.2 I -P+ l I-P+2 I-P+3 I-P+4
J-V J-TkU-1 J-TkU+l J-P-1 J-P+l J -CPR
Come n t s
Bromate, HC1 and r i n s e s l i m e a d d i t i o n
waters ide wash waters ide wash
p a s s i v i z a t i o n step
waters ide wash waters ide wash i n - l i n e c a u s t i c a d d i t i o n mixed wastes and r i n s e s
from u n i t 1 from u n i t 3 from u n i t 1
from c o l l e c t i o n bas in p r i o r t o a c i d waste 2 hours a f t e r discharge 1 day a f t e r d ischarge 2 days a f t e r discharge 3 days a f t e r discharge 4 days a f t e r discharge
waters ide wash p r i o r t o EDTA a d d i t i o n a f t e r EDTA a d d i t i o n be fo re EDTA a d d i t i o n one week a f t e r EDTA a d d l t i o n from c o l l e c t i o n basin
I I I 1 I
EPRI Data EL& Reaion K Nor theest
L
F: m a
N
Table B-1 (Continued)
LCh' VOLUME WASTES COLLECTED AND ANALYZED
Euel O i 1
East Cent ra l Coal
West Coal
West Coal
West Coal
East Cent ra l Coal
L Q k , I
a i r preheater waste K-APr t r e a t e d a i r preheater K-TkO pond e f f l u e n t K-P th i ckener underf low K-TkU ESP wash s o l i d s K-ESP
EDTA waste L-V coal p i l e runo f f L-CPR
b r i n e concent ra te r e j e c t K-BCR evaporat ion pond l i q u i d M-P evaporat ion pond s o l i d s M-S
wastewater N-WW product water N-Prod b r i n e concent ra te r e j e c t N-BCR b r i n e concent ra te r e j e c t N-S p y r i t e s N-Py
b r i n e concent ra te r e j e c t 0-BCR evaporat ion pond l i q u i d 0-P evaporat ion pond s c l i d s 0-5 p y r i t e s 0-PY
c i t r a t e waste P-c f i r s t r i n s e P-R ash pond water P-P-1 ash pond water P-P+2 ash pond water P-P+4 ash pond water P-P+7 ash pond water P-P+14
Comments f l l t e r e d and u n f i l t e r e d c a u s t l c a d d i t i o n t h i c k e n e r over f 1 ow
evaporated Powder R ive r coa l
l i q u i d phase
fed t o b r i n e concent ra to r b r i n e concent ra to r p roduc t l i q u i d phase s o l i d phase
s l u r r y
waters ide wash waters ide p r i o r t o c i t r a t e waste 2 days a f t e r d ischarge 4 days a f t e r d ischarge 7 days a f t e r d ischarge 14 days a f t e r d ischarge
Tab le 6-1 (Continued)
LCM VCLUME WP.STES COLLECTED AND ANALYZEC
EPRI Cata Phl! i Rea i cn
Q Nor theas t
R Nor theas t
S Nor theas t
m cn T Nor theas t
U East Cen t ra l
-L!sJ--* Comments
Coal moistened f l y ash Q-FA p y r i t e s from p u l v e r i z e r 0-Py
Coal f l y ash from pond R-FA bottom ash from pond E-BA p y r i t e s from p u l v e r i z e r R-Fy
Coal f l y ash from s i l o s S-FA p y r i t e s from p u l v e r i z e r S-Py
Gas/o i l f i r e s i d e waste T-F+l c o l l e c t e d a f t e r 1 hour f i r e s i d e waste T-F+16 c o l l e c t e d a f t e r 16 hours c l a r i f i e r over f low T-TkO 16 hour sample f i 1 t e r s o l i d s T-S
Coal EDTA waste u-v evaporated
Coal hydroxyacet ic / fo rmic U-HAF waters ide wash r i n s e water U-R waters ide r i n s e
Table 8-2
ANALYTICAL RESULTS - PLANT A
Sample:
Desc r ip t i on :
Elemental Analys is A1 um inum A n t i mony Arsenic Barium B e r y l l i u m Boron Cadmium Calcium Chromium Chromium V I Cobal t Copper I r o n Lead Magnesium Manganese Mercury Molybdenum Nickel Potassium Selenium S i 1 i c o n Si1 ve r Sodium Thal 1 i um Vanadium Zinc
Water Q u a l i t y Values pH ( u n i t s ) A c i d i t y (as Cam 1 A l k a l i n i t y (as dC03) Ammonia (as N) coo Ch lo r ide F l u o r i d e N i t r a t e N i t r i t e (as N) S u l f a t e TOS TOC
A-F2
F i res ide Wash
mg/L 0.66
<0.021 <0.002 0.083
(0.001 (0.02 0.004
89 (0.005
0.26 0.12 8.6 0.007
47 0.84
<0.0002 0,003 5.7 4.4
<0.002 2.9 0.0022
160 (0.09 0.14 0.45
6.5 23 35
23 0 130
2.1 (0.1 (0. 1
560 1040
A-F5
Treated Wash
mg/L 0.26
(0.021 <0.002 (0.07 < O . O O l (0.05 0.006
85 0.007
0.15 0.13 4.2 0.033 9.1 0.15
<0.0002 0.008 4.3 5.7
<o. 002 3 0.0072
430 (0.09 0.29 0.073
6.6 23 65
25 0 120
2.6 (0.1 (0.1
900 1700
106
A - V 1
EDTA €!LaiQ
mg/L 3.6 0.089 0.21 0.34
(0.001 0.16 0.061
0.55
0.41 1.52
1.1
1.8
0.2 8.3 7.3
<0.002 7.4 0.012
240
15 0
66
<0.0002
1100 10.09 12
1.4
6.7 300 440 520
6200 280
2.3 (0. 1
1.01 2100 9400 2500
A-V3
Treated S L G L
mglL 1.4 0.11 0.099 0.018
(0.001 CO .05 0.076
0.32
0.25 2.7 1.2 0.325 0.11 0.004 0.0004 0.14 5.6 9.7
(0.002 5.5 0.007
390
4400 <o .09 7.5 0.13
12.5
5200 3 20
1300 3 20 31.4 (0.1 0.87
7200 18000
527
S1 udge &Li..&
Ngls 570
6.1 65
110 (0.86 57 15
12000 27
63 300
76 15000
290 32000
4.2 1000
(4.3 18 (1.7 0.41
2400
680 210
(7.8
5-6
Table 8-3
ANALYTICAL RESULTS - PLANT B
Sample:
D e s c r i p t i o n :
8-HC1 1
HC1 Waste
B-HC12
Feed t o Basln
B-R1
Waste -Binsk
6-SA1
Waste SQdUwL
B-Ef4
Treated Effluent
6 4 3
Sludge Solids
mg/L 0.48
mg/L 0.51
mg/L 0.51
(0.02 (0.002
u9/9 8900
200 330
Elemental Ana lys is A 1 uminum Antimony Arsenic Barium Bery 11 i um Boron Cadmium Calcium C h rom i um Chromium V I Cobal t Copper I r o n Lead Magnesium Manganese Mercury Molybdenum N i c k e l Pot ass i urn Selenium Si1 icon S i l v e r Sodium Thal 1 i um Vanadium Zinc
mg/L 25
mg/L 34
0.5 <0.002 0.47
(0.1 12 0.78
29 6 0.47
1.7 (0.6
1.3 (0.01 (0.5
0.077 (0.002 0.051
10.001 (0 .05 0.002
21 0.045
10.02 (0.002 0.019
(0.001 (0.05 0.022 0.64
(0.005
(0.006 0.39 4.6 0.64
(0.03 0.01
<0.0002 0.022
(0.003 1.9
(0.02 0.94 0.011
2200 (0.09 (0.003 0.09
~. ~
0.14 (0.001 0.08 0.11
0.008
(0.006 0.03 0.078 <0.08 32
300
0.005 0.0009
73 4.1
5 10 57 0.62
8960 118900 35 0
130 6800
255400 610
6000 65 0
0.85
0.56 32
1450
0.013 1.7
1.5 182
4140 86 0.7 5 0.9 0.0003 0.007 0.25 2.4
(0.002
0.51 14 27
0.0003 0.45
1.4 48 11 0.0025 0.041 9.8 2
(0.8
8 1 2700
0.019 0.006 26
(0.5 ~~
13 (0.002 4.1 0.032
880 <0.09 0.27
(0.003
(50 <0.002 250
17400 (2
15
390 0.098
71
1180 0.68
2.2 0.0038
13 15400 (90
3500 1900
(0. 9 (0.9 1.1 6.4
(0.09 (0.003 0.14
0.094 30
Water Q u a l i t y Values pH ( u n i t s ) 1.8 5.5
17
29 <2
120
A c i d i t y (as CaCO-) 52000
A1 k a l i n i t y 3 (as CaCO 1 (1
Ammonia (a2 N) COD 8000 C h l o r i d e 33000 F1 uor 1 de 2100 N i t r a t e 19 N i t r i t e (as N) (0.02 S u l f a t e 50 TDS 12000 TOC 890
1600 2.6 7 0.17
960 3600
3 1
B-7
Sample
D e s c r i p t i o n :
Elemental Ana lys is A1 uminum Antimony Arsenic Barium Bery l 1 i um Boron Cadmium Calcium Ch rami um Chromium V I Cobal t Copper I r o n Lead Magnesium Manganese Mercury Molybdenum Nickel Pot ass i um Selenium S i 1 icon S i l v e r Sod i um Thal l ium Vanad i um Zinc
Water Q u a l i t y Values pH ( u n i t s ) A c i d i t y (as CaCO ) A l k a l i n i t y (as C&03) Amnonia (as N) COD Ch lor ide F l uor i de N i t r a t e N i t r i t e (as N) S u l f a t e TOS TOC
9 \ o o m o ~ o o o o oooooo o o o o o ' ~ o o o 0 m o o m r - "03 domo mom r - o m m o 3 O m o m I N 0 m V 3 m 3 r l d ' D m v ' u , 3 r l V N I O
I
3 0 m P n - 0 m v) m P - J rl m r - U
'9 I:
In 7J
0 u)
Be m
... r
n
a N
m -J N 5 L
1 9 N
J a. I
m o r - ~ o m o ~ o o o - 3 u v 3 v V N o o v m m m m m U
a 3 r V ) n w m r r t-
m 0 2 s m w N O
2 N P 0 - 4 N N m m o
N . N . 1 1 2 o
5- N.9??".? 1 7'9 9 '491 5 9 9 m m o o o o o o o o 0 0 - o o m o ~ m o o m o o ~ o u m o d m r - o m o o o m m v E 3 V V v v P m v m m m v v r r ID N 00 -Jm
' D m 0 e 2 N
2
lL
.. c 0 .r .. ::
a, .- F L n u € I n m a , v ) n
In ._
m m
Sample:
Oescri p t i o n :
Elemental Ana lys is Aluminum Antimony Arsenic Barium Bery l 1 i um Boron Cadmium Cal c 1 um Chromium Chranium V I Cobal t Copper I r o n Lead Magnesium Manganese Mercury Molybdenum N icke l Potassium Sel en I um S i 1 Icon S i 1 ve r Sodium Thal 1 i um Vanadium Z inc
Water Q u a l i t y Values pH ( u n i t s ) A c i d i t y (as CaCO ) A l k a l i n i t y (as C$C03) k n i a (as N ) COD Ch 1 o r 1 de F1 u o r i de N i t r a t e N i t r i t e (as N) Su l fa te
Table 6-6
ANALYTICAL RESULTS -- PLANT E
E-C1
C i t r i c Waste
v9/9 11 (2.1 0.031 1.1
(0.1 (5 0.19
32 3.4 3 1.2
223 2270
1.6 15 16 <0.0002 2.2
13 6.8
(0.002 8.5 0.37
1800 19 13 6 1
9.8 (10
19000 7380
14000 (10
120 0.06
1.2 23
TDS TOC
17000 6900
6-10
Table 8-7
ANALYTICAL RESULTS - PLANT F
Sample:
Oescr i p t i o n :
Elemental Ana lys i s A 1 umi num Antimony Arsen ic Bar i urn B e r y l 1 i um Boron Cadmium Calcium Chromium Chranium V I Coba l t Copper I r o n Lead Magnesium Manganese Me rcu r y Molybdenum N i c k e l Pot as sium Selenium S i 1 i con S i l v e r Sod i urn Thal 1 i urn Vanadium Z inc
Water Q u a l i t y Values pH ( u n i t s ) A c i d i t y (as CaC03) A l k a l i n i t y (as CaC03) Ammonia (as N) coo C h l o r i d e F1 uor i de N i t r a t e N i t r i t e (as N ) S u l f a t e TOS TOC
Elemental Ana lys is A1 um inum Antimony Arsenic Barium B e r y l 1 i um Boron Cadmium Cal c i urn Chromium Chromium V I Cobal t Copper I r o n Lead Magnesium Manganese Mercury Molybdenum N i c k e l Pot ass i um Selenium S i 1 icon S i l v e r Sodium Thal 1 i urn Vanadium Z inc
Water Q u a l i t y Values pH ( u n i t s ) A c i d i t y (as CaCO ) A l k a l i n i t y (as C&03) Ammonia (as N) coo C h l o r i d e F l u o r i d e N i t r a t e N i t r i t e (as N ) S u l f a t e TOS TOC
G-Cmpl
Composite Waste
mg/L 1.7 0.62 0.008 0.17
<0.01 2.6 0.15
1.1 0.12 0.35
23
19 1030
0.032 12 7.1
<o. 0002 0.25
47 3.8
<0.002 7.6 0.055
75 0 CO.9 0.23 6.2
1.5 8700
<1
2300 9300
5 25 (100
190 6000
610
0.1
G-Ef2
Treated Effluent
mg/L 0.68 0.98
<0.002 0.16
<0.01 (0.5 0.088
0.11
<0.06 0.24 1.2
<o .002 1.7
<0.01 <o. 0002 0.12 0.4 3.6
<0.002 1.3 0.24
1710
390 <0.9 0.12
C0.03
11.0 < l o 880 229
8300 2400
13 (10
NO 28
6700 200
G-S3
S1 udge ami!&
l.lg/g 3310
88 120 36
220 99
144900 430
62 11900
186900
1.6
290 10100 2740
31 6880 ~~~
<50 210
11600 <2
7410 189 280
4440
8-12
Sample:
Descr ip t ion :
Elemental Ana lys is A1 umi num A n t i mo ny Arsenic Barium Bery l 1 i um Boron Cadmium Calcium Chromium Chrmium V I Cobal t Copper I r o n Lead Magnesium Manganese Mercury Molybdenum Nicke l Potassium Selenium S i l i c o n S i l v e r Sodium T h a l l ium Vanadium Z i n c
Water Q u a l i t y Values pH ( u n i t s ) A c i d i t y (as CaCO 1 A l k a l i n i t y (as C&03) Ammonia (as N) COD Ch l o r i de F l u o r i d e N i t r a t e N i t r i t e (as N ) S u l f a t e TDS TOC
Table B-8 (Continued)
ANALYTICAL RESULTS - PLANT G
G-Brl
Broniate A!asL%
mg/L (5 5.8
<o .002 (0.1 (0. 1 (5 0.006 6.3 0.5
(0.6
(0.8 <o ,002 5.4
<0.1
450
0.59 1.5
(5 <0.002 3.2 0.26
190 (9 (0.3 3
G-R1
Water SLnre
mg/L (0.05 0.075 0.004 0.006
<0.001 0.23 0.007
0.011
(0. 006 0.31 0.14
<0.002 6.2 0.004
0.033 0.031 3.2
<o .002 6.7 0.0063
18
35 (0.09 0.009 0.006
G-HC1 1
HC1 r(aste
mg/L (5 5.6 0.004 1
(0.1 6.2 0.18
74 . . 3.5 0.24 1.6
320 5900
1.6 42 3 1
0.72 210 (5 <o .002 22
0.17 160
(9 (0.3 30
G-Hyl
Hydrazine Dra in
mg/L (0.5 <0.2
(0.01 (0.01 (0.5
0.015
0.041 6.9 0.07 0.064
<0.06 0.98
(0.002 120
0.5 0.86
0.49 3
C0.5 (0.002 1.1 0.028
1900 (0.9 (0.03 0.11
8-13
Table 6-9
ANALYTICAL RESULTS - PLANT H
Sample:
Oescr ip t ion:
Elemental Ana lys is A1 umi num Antimony Arsenic Barium Bery l 1 i um Boron Cadmium Calcium Ch romi um Chromium V I Cobal t Copper Iron Lead Magnesium Manganese Mercury Molybdenum Nicke l Pot as slum Selenium S i 1 i con S i l v e r Sod i um Thal 1 i um Vanadium Zinc
Water Q u a l i t y Values pH ( u n i t s ) A c i d i t y (as CaCO ) A l k a l i n i t y (as C$C03) Ammonia (as N) coo Ch lor ide F1 uor i de N i t r a t e N i t r i t e (as N ) S u l f a t e TDS TOC
H-Brl
Bromate Waste
mg/L (0.5 (0.2 (0 .002 0.022
(0.01 (0.5
(0.5 10.05
10.06
(0.08
0.007
3 25
0.016 1
(0.01 <0.0002 0.031 0.098 2.1
(0.002 (0.2 0.069
320 (0.9 (0.03 3.1
10.8 (10
13000 3980
160 310
0.08
0.2 (2
( 2 1200
4
H-HC11
HC1 Waste
mg/L 29 0.89 0.007 2.6 (0.1 18
27 0.019
5.7 2.4 0.78 10.5
6960
(3 52 <0.0002 0.43
0.33
180 (0.5 <0.002 16 0.001
190 (0.9 (0.3
100
1.5 59000
(1
340 38000
2300 (10 (0.02 26
18600 110
H-HC2
HC1 neu Waste
mg/L (0.5 0.077
<0.002 (0.001 (0. 001 (0.05
(0.05 0.002
0.02
(0.006 0.58 1
10.03 C0.03 <0.001 0.0039 0.25 0.015 6.1
(0.002 4.3
(0.001 50800
(0.09
26 0.016
12.1 (10
56000
590 33000
2800
0.21
100000 75
H-P3
Pond Water
mg/L 4.3
(0.02 0.007 0.001
<0;001 (0.05 0.23 0.31
(0.005
(0.006 2.4 5.5
(0.009 (0.03 (0.001 0.0004 0.068 0.036 3.2
(0 .002 1.8 0.068
5460 (0.09 0.005 0.12
12.0 (10
3800 1 25 240
5400 15 0 (10 0.11
4 20 12000
61
r
6-14
Table B-10
ANALYTICAL RESULTS - PLANT I
Sample:
Descr ip t ion :
Elemental Ana lys is A 1 urn i n um Antimony Arsenic Barium Bery l 1 i um Boron Cadnii um Calcium Chromium Chranium V I Coba l t Copper I r o n Lead Magnesium Manganese Mercury Molybdenum N icke l Potass i urn Selenium S i l i c o n S i l v e r Sod i um Thal 1 i um Vanadium Zinc
Water Q u a l i t y Values pH ( u n i t s ) A c i d i t y (as CaCO ) A l k a l i n i t y (as C b 3 ) Ammonia (as N ) coo Ch lo r lde F l u o r i d e N i t r a t e N i t r i t e (as N ) S u l f a t e TDS TOC
I-HC11
HC1 Waste U n i t 3
mg/L 36
0.91 0.12 0.87
(0. 1 22
13 0.13
6.4 0.2 0.83
287 7060
0.008 4.5
0.0003 1.1 4 3.4
(0.002 25 ~
0.2
(0.9
32
360
0.32 170
1.0 76000
(1
8300 48000
3400 (10
390 14000
1800
I-HCl 1
HC1 Waste - mg/L 33
1.4 0.011 0.31
(0.1 22
0.066 3.7
1.1 0.64 1.7
35
10500
5.4
0.0008 8.5 7.4
(0.5 10.002 32
0.044 390
58
(0.9 0.5 0.56
1.1 52000
(1
3400 33000
2100 (10
53 14000
270
6.5
I-TSP1
Na3P04 - mg/L
0.85 <0.02 0.01 0.009
(0.001 (0.05 a. 002 0.17 0.028 0.007
'(0.006 0.29 0.24
(0.08 10.03 (0.001 <0.0002 0.018
(0.003 0.34
(0 .002 2.9
<0.002
CO.09 1530
0.012 0.013
9.4 (10
2800
480 11 1.3
(2 (0.02 10
5600 53
I-CPR3
Coal P i l e Runoff
mg/L 14 (0.02 (0.002 0.04 0.007
10.05 0.004
72 0.005
0.17 0.06 2.6
(0.08 19 3.2 0.0003 0.005 0.21 1.8
(0.002 4.4 0.0018
12 (0.09 (0 .003 0.59
3.1 180 ( 1
(5 20 0.61 2
(0.02 480 660
2
6-15
Table E-10 (Continued)
ANALYTICAL RESULTS - PLANT I
Sample: I-P-1 I-P+.2 I-P+l I-Pt2 I-P+3 i-p+4
D e s c r i p t i o n : Ash Pond Before
Ash Pond Ash Pond AlAL
mg/L 0.44 10.02 10.06
Ash Pond a h Y . L
Ash Pond L % A Y L
Ash Pond - mg/L 0.41 10.02 0.024
Elemental Ana lys is Alumlnum Antimony Arsenic Barium Bery l 11 um Boron Cadmium Calcium Chromium Chranium V I Cobal t Copper I r o n Lead Magnesium Manganese Mercury Molybdenum Nicke l Potass i um Selenium S i l i c o n S i l v e r Sodium Thal 1 i um Vanadium Zinc
Elemental Ana lys is A1 umlnum Antimony Arsen ic Barium B e r y l 1 i um Boron Cadmi urn Calcium Chromium Chranium YI Coba l t Copper I r o n Lead Magnes i um Manganese Mercury Molybdenum N i c k e l Potassium Selenium S i l i c o n S i l v e r Sodium T h a l l i urn Vanadium Z inc
mg/L 0.15
(0.02 <0.002 0.078
<0.001 0.8 (0.001 45 (0 .005
(0. 006 0.002 0.38
(0 .002 18 0.023 0.0003
(0 .002 (0 .003 0.76
<0.002 1.8 0.0023 85 (0.09 (0.003 (0.003
Water Q u a l i t y Values pH ( u n i t s ) 9.3 A c i d i t y
A l k a l i n i t y
Ammonia (as N ) coo ( 5 C h l o r i d e 8 F l u o r i d e 0.24 N i t r a t e 6 N i t r i t e (as N ) 0.03
(as CaC03) (10
(as CaC03) 93
S u l f a t e TOS
420 970
TOC 2
J-V1 J-TkU-1 J-TkU+1 J-P-1 J-P+l
EDTA Thickener Thickener Pond Pond Waste Before After Before A f t e r
Elemental Analys is A1 um i num Antimony Arsenic Barium Bery l 1 i um Boron Cadmium Calcium Chromi urn Cobal t Copper Iron Lead Magnesium Manganese Mercury Molybdenum N icke l Potassium Selenium S i l i c o n S i l v e r Sodium Tha l l i um Vanadium Z inc
mg/L 0.6
<o .02 (0.002 0.076
(0.001 0.14 0.011
10 (0.005 0.19 0.12
32 (0.002 68 1
<0.0002 0.006 5.5 9
<0.002 0.31 0.021
420 10.09
0.006 0.36
Water Q u a l i t y Values pH ( u n i t s ) A c i d i t y (as CaCO A l k a l i n i t y (as C$.C03) coo Ch lo r ide F1 u o r i de N i t r a t e N i t r i t e (as N) S u l f a t e TOS TOC
K - A P r l
U n f i l t e r e d Washwater
mg/L 2.8
(0.02 <o. 002 0.061
10.001 0.2 0.017
0.21 0.22 0.33
0.082 0.008 1.1
<0.0002 0.036 6.5 8.8
10.002 0.49 0.019
10
36
420 (0.09 6.8 0.71
3.9 170 (1 (5
35 0 0.21
10 (0 .02
990 2000
4
K-Tk03
Thickener Overflow
mg/L 0.2
(0.02 <0.002 0.092
<0.001 (0.5
9.7 <0.005 <O .006
0.03 0.11
10.002 19 <0.001 <0.0002 0.37
(0.003 9.7
<0.002 0.28 0.015
390 (0.09
1.2 0.003
9.5 (10 220
300 0.41
<2 <o .02
320 15 00
2
K-P4
Pond Effluent
mg/L 0.34
<0.002 <0.002 0.12
(0.001 <0.05 0.011 8.5
(0.005 (0.006 0.09 0.17
<0.002 34 <O.OOl <o ,0002 0.32
<O. 003 9.8
10.002 0.29 0.013
400 (0.09
1.9 10.003
K-TkU5
Thickener Underflow
P9/g 2940
92 1020 160
<1 180 11
14800 170 23 0 72 0
77500 360
126000 450
110 7040 <50 (80
6310
3770 (90
13100 1350
2.5
K-ESP1
Waste 35QIi.k
v9/g 2900
47 1830 750 < 1 <50 50
5380 130 110 160
26800 1400
19000 47
470 3540
(5 0 (80
1140
4550 <go
26500 260
2.7
8-18
Sample:
Oescr i p t i o n :
Elemental Analys is Aluminum Antimony Arsenic Barium B e r y l l i u m Boron Cadmium Calcium Chromium C h r a i u m V I Cobal t Copper I r o n Lead Magnesium Manganese Mercury Molybdenum N icke l Potassium Selenium S i 1 i c o n S i l v e r Sod i um Thal 1 i um Vanadium Zinc
Table 8-13
ANALYTICAL RESULTS - PLANT L
L-v1
EDTA Waste
mg/L 18
1.3 0.36 0.65 (0. 1 <5
14 0 0.78
7.7 0.89 1.8
321 7000
1.8 23 42
0.0004 2.4
(0.5 160
<0.002 17
15 0 0.057
(0.9 C0.3 64
Water Qual i t y Values pH ( u n i t s ) 10.3 A c i d i t y (as C a m 1 (10 A l k a l i n i t y (as C k X 3 ) 19000 Ammonia (as N) 7560 COD 32000 Ch lo r ide F l u o r i d e 0.67 N l t r a t e N i t r i t e (as N) 0.21 S u l f a t e TDS 730 TOC 23000
L-CPR2
Coal P i l e Bunoff
m d L - 0.54 (0.02 0.006 0.043 <0.001 0.95 0.001
(0.005 270
(0.006 0.002
13.3 0.015
68 1.2
<0.0002 <0.002 3 4.1
(0.002 11 0.0012
48 (0.09 (0.003 0.01
8.4 a 0 310
<5 34 0.24
(2 <0.02
740 1500
4
6-19
Sample:
Descr ip t ion :
Elemental Ana lys ls Aluminum Ant i mony Atse n i c Barium Bery l 11 um Boron Cadmium Cal c i um Chromium Chranium V I Cobal t Copper I r o n Lead Magnesium Manganese Mercury Molybdenum Nicke l Pot ass1 um Selenium S i l i c o n S i 1 ver Sod i um Thal 1 i um Vanadium Zinc
Water Qual i t y Values pH ( u n i t s ) A c i d i t y (as Cam ) A l k a l i n i t y (as C%X13) Ammonia (as N) COD Ch lor ide F l u o r i d e N i t r a t e N i t r i t e (as N) S u l f a t e TDS TOC
Table 6-14
ANALYTICAL RESULT5 - PLANT M
M-BCR1
Reject Llouid
mg/L 3.9 0.28 0.27 0.1 0.003
(0.05 0.03
0.31
0.05
452
b 1;.4
<o .ow 1.7 0.0003 1.5 0.37
3 100
710
69
25800
0.027
0.03
0.19 0.51 4.1
4.9 570 440
4400 36000
170 (500
40 63000
104000 710
M-P2
Pond Water
mg/L 4.6 0.22 0.019 0.1 0.02
(0.05 0.04
0.26
3.5 1.8
42 (0.002
630 3.1 0.025 0.68 1.3
1.5
0.01
0.12 0.41 4.4
3 96
165
99
49300
4.6 5100
15
7400 4100
40 6400
43000 107000
180
0.02
6-20
Sample:
Desc r ip t i on :
Elemental Analys is A 1 uminum A n t i mony Arsenic Barium B e r y l l i u m Boron Cadmium Calcium Chromium Cobal t Copper I r o n Lead Ma gn es i um Manganese Mercury Molybdenum N i c k e l Potassium Selenium S i l i c o n S i l v e r Sodium T h a l l ium Vanadium Z i n c
Water Qual i t y Values pH ( u n i t s ) A c i d i t y (as CaCO ) A l k a l i n i t y (as Ck03) COD C h l o r i d e F l u o r i de N i t r a t e N i t r i t e (as N) S u l f a t e TDS TOC
Elemental Analys is A1 uminum Antimony Arsenic Barium Bery l 1 ium Boron Cadm i um Calcium Ch ranium Cobalt Copper I r o n Lead Magnesium Manganese Mercury Molybdenum Nickel Potassium Selenium S i1 i con S i l v e r Sodium Thal 1 i um Vanadium Zinc
Water Q u a l i t y Values pH ( u n i t s ) A c i d i t y (as CaCO A l k a l i n i t y (as CjCO,) Ammonla (as N) coo Ch lor ide F1 uor ide N i t r a t e N i t r i t e (as N) S u l f a t e TOS TCC
0-BCRl
Reject
mg/L (0.05 0.036 0.02 0.18 0.001
12 <0.002
620 (0.005 0.018 0.011 0.34 (0.002
1.8 <0.0002 0.039 0.28
(0,002 3.6
(0.002
0.1 0.14
<0.003
Slurrv
1510
214
2780
7.2 29
170
5 10 1900
15 <1
11000 20000
230
0.07
0-P2
Pond Water
mg/L CO.05 0.12 0.14 0.15 0.003
0.003
0.025 0.047 0.076 0.39
<0.002
1.8 <0.0002 0.33 0.32
380 0.037
45 <0.002
7110 0.21 0.27 2.2
56
353
3620
6.2 140 3 10
4200 7600 100 (1
66000 122000
1800
3.9
0 4 2
S1 udge Scllds
W g 705 (20
(6 165
(0.09 5 1 (0.19
226500 3.5
(0.6 14
478 (8
1840 16
(0.02 0.98
220 <8
3226
1450 (0
55
0.96
3.2
6-22
Table B-17
ANALYTICAL RESULTS - PLANT P
Sample:
Oescr ip t i o n :
Elemental Analys is A1 umi num Antimony Arsenic Barium Bery l1 i um Boron Cadmium Cal c i um Chromium Cobal t Copper I ron Lead Magnesium Manganese Mercury Molybdenum N icke l Potassium Selenium S i l i c o n S i l v e r Sodium T h a l l i u m Vanadium Z inc
Water Q u a l i t y Values pH ( u n i t s ) A c i d i t y (as CaCO ) A l k a l i n i t y (as C k V 3 ) Ammonia (as N) COD ,Ch lo r ide F1 u o r i de N i t r a t e N i t r i t e (as N) S u l f a t e TDS TOC
Elemental Ana lys i s A1 um i n um Antimony Arsen ic Barium B e r y l 1 i um Boron Cadmium Calcium Ch rom i um Coba l t Copper I r o n Lead Magnes i urn Manganese Mercury Molybdenum N i c k e l Potassium Selenium S i l i c o n S i l v e r Sodium T h a l l ium Vanadium Z inc
Elemental Ana lys is A1 um i num Antimony Arsen ic Barium Bery l 1 i um Boron Cadmium Calcium Chromium Coba l t Copper I r o n Lead Magnesium Manganese Mercury Molybdenum N i c k e l Potassium Selenium S i l i c o n S i l v e r Sod i um Thal 1 i um Vanadium Z inc
S u l f u r ( 9 6 ) Heat ing Value (BTU/Lb)
Table 6-18
ANALYTICAL RESULTS - PLANT Q
Pvrite mg/L 101600
c42 1280 770 11 140
7960 550 62 02
71700 1560 1800 280
7.9
0.86 c0.4 2.6
(0.5
1.8
7460
8180 < 18 67 34
18.12 4863
P y r i t e F.hwL Standard
mg/L mg/L 17100
c4 1180 (0.2 c0.2
c0.4 (10
15300 500
57 3 . 2
1983400 435900 48
3720 190
28 0.21
110 18500
(0.5
13 4990 (180 210 170
0.26 NA
49.53 2174
-
*Atomic abosrp t ion ana lys is . A l l o t h e r elements by ICP.
NA - Not analyzed
Whole-sample d i g e s t i o n s by p e r c h l o r i c a c i d d igest ion, except f o r i r o n and s i l l c o n analyses which were prepared by l i t h i u m metaborate fus ion.
6-25
Elemental Ana lys is A1 umi num Antimony Arsenic* Barium B e r y l l i u m Boron Cadmium Calcium Ch romi um Coba l t Copper I r o n Lead* Magnesium Manganese Mercury Molybdenum Nicke l Phosphorus Potassium Selenium* S i 1 i con S i l v e r Sod i urn Thal 1 i um T i tan ium Vanadium Z inc
S u l f u r (%) Heat ing Value (BTWLb)
Table 6-19
ANALYTICAL RESULTS - PLANT R
Pvrite mg/L 8130 (4 1
3460 (2 (2 (98 <4
1670 5 20 15
374300
610 170
11 59
(490 1190
9.2
0.27
0.76
c0.5
5.8 940 a 8 0 150 (3 0 78
46.34 3241
*Atomic abosrp t ion ana lys is . A l l o the r elements by ICP.
NA - Not analyzed
. ILesJL
mg/L 1870 100 56 990 c2.0
220 6.9
1780 380 93 140
488700
520 470
12 25 0 (500 1630
4.8
0.02
c0.5
14 c30 <180 1060 60 46
0.29 NA
P y r i t e Standard
mg/L
435900
49.53 2174
Whole-sample d iges t i ons by p e r c h l o r i c a c i d d iges t ion , except f a r i r o n and s i l i c o n analyses which were prepared by 1 i t h i u m metaborate fusion.
B-26
Table 6-20
ANALYTICAL RESULTS - PLANT S
Elemental Ana lys is A 1 urn inum Antimony Arsenic Barium B e r y l 1 ium Boron Cadmium Calcium Ch rom i um Coba l t Copper I r o n Lead Magnesium Manganese Mercury Molybdenum N i c k e l Phosphorus Potassium Selenium S i l v e r Sodium S u l f u r ( % ) T i tan ium T h a l l ium Vanadium Z i n c
Heat ing Value (BTU/l b)
PYtTe
48800 (40 200 3800
15 NA (4
3670 44 20 100
86900 65
3000 130
0.2 15 37
c300 11000
c4 c 2 730 14.04
2500 (180 160 44
4200
8-27
Table 8-21
ANALYTICAL RESULTS - PLANT T
Sample:
Oescr i p t i on :
Elemental Ana lys is A1 umi num Antimony Arsen ic Barium Bery l 1 i um Boron Cadmium Calcium Ch romi um Coba l t Copper I r o n Lead Magnesium Manganese Mercury Molybdenum N icke l Potass i urn Selenium S i l i c o n S i l v e r Sodium T h a l l ium Vanadium Z i n c
Water Q u a l i t y Values pH ( u n i t s ) A c i d i t y (as CaCO ) A l k a l i n i t y (as C b 3 ) COD C h l o r i d e F1 u o r i de N i t r a t e N i t r i t e (as N) S u l f a t e TOS TOC
T-Ft1
F i res ide t1 H r
mg/L 21
0.31 <o .002 0.089 0.012
<0.5 0.2
0.53 5.4 7.1
0.051
1.3 <0.0002 0.074 0.59
<0.002 6.1 0.022
0.27 4.7
381
513
2710
335
5790
25
T-Ft16
F i r e s i de t 1 6 H r s
mg/L <0.05 0.087 0.016 0.09
<0.001 0.29
<o. 002 14 <0.005 <0.006 0.012 0.52 0.008
17 0.002
<o . 0002 0.43 0.032 5.5
<o .002 0.98
<0.002 75 0 C0.09 19 0.007
10.1 (10
1400 18 13
I .2 2 0.06
340 2200
3
T-Tk02
Thickener Overflow
mg/L <0.05 <0.02 (0.002 0.046
(0.001 0.63
(0.002
0.013 <O .006 0.014 0.27
<0.002 0.22 0.003
<0.0002 0.28 <O .003 26 <0.002 1.3
<o. 002
<o * 09 8.8
CO. 003
25 1
942
11.2 < l o 320 26
860
<1
1200 3200
<1
0.7
0.6
T-S3
F i l t e r Sludae
Pg/g 10200
55 340
84 (1 60
52600 180 130 400
72500 18 1
149300 1320
26 4330 1930
96 83 0
5090 40
6840 1940
5.2
4.4
6-28
Table B-22
ANALYTICAL RESULTS - PLANT U
Sample:
D e s c r i p t i o n :
Elemental Ana lys i s Aluminum Antimony A r sen 1 c Barium Bery l 1 ium Boron Cadmium Calcium Chranium Chromium V I Coba l t Copper I r o n Lead Magnesium Manganese Mercury Molybdenum N icke l Pot ass i um Se len i um S i l i c o n S i l v e r Sodium T h a l l ium Vanadium Z inc
Water Q u a l i t y Values pH ( u n i t s ) A c i d i t y (as CaCO ) A l k a l i n i t y (as C k 0 3 ) Ammonia (as N ) coo C h l o r i d e F l u o r i d e N i t r a t e N i t r i t e (as N) S u l f a t e TDS
c-3 C a l i f o r n i a Assessment Manual Waste E x t r a c t i o n Test Resul ts -- EP and TCLP Leach Test Resul ts--Plants A Through ti
P l a n t s A Through T C-8
c-3
c-4 A n a l y t i c a l Resul ts o f RCRA Wastes--Plants A Through U c-11
C - i i i
TABULATION OF REGULATORY ANALYSIS OF
LW VOLUME WASTES
T h i s appendix presents t h e r e s u l t s of federa l and s t a t e regu la to ry c l a s s i f i c a t l o n
procedures performed on u t i l i t y low volume waste samples c o l l e c t e d a t 21 power
p l a n t s ( A through U ) . A summary of t h e procedures I s conta ined i n Table C-1. The remaining t a b l e s present t h e r e s u l t s o f performing t h e t e s t s on samples
c o l l e c t e d from p l a n t s A through U.
c-1
Table C-1
COMPARISON OF LEACHING TEST METHODS
Epl Procedure :
L i q u i d t o s o l i d 2O:l r a t i o
Leaching f l u i d Water maintained a t pH 5.0 w i t h 0.5 N a c e t i c a c i d (no more than 49 per g o f so l i d s )
M ix ing method S t i r o r5
E x t r a c t i o n t i m e 24 (hours)
Phase Membrane separa t ion f i l t e r
r o t a t e
Old TCLP'
2O:l
0.1 N sodium aceta te b u f f e r a t pH 5.
Rotate a t 30 r P m
18
Glass f i b e r f i l t e r
New TCL P3 CAM4
2O:l 1 O : l -
1) 0.1 N 0.2 M c i t r a t e sodium aceta te b u f f e r a t pH b u f f e r a t pH 5 5. or 2) 0.1 N a c e t i c a c i d
S t i r , r o a t e i! Rotate a t 30 rpm o r shake
18 48
Glass f i b e r Memb ran e f i l t e r f i l t e r
'EP - E x t r a c t i o n Procedure (EP) T o x i c i t y Tes t Method and S t r u c t u r a l I n t e g r i t y
Test, Tes t Methods f o r Eva lua t i ng S o l i d Waste. SW-846, 1985.
'Old TCLP - D r a f t procedure dated A p r i l 1985 (Method 13xx, T o x i c i t y
C h a r a c t e r i s t i c Leaching Procedure).
3New TCLP - Revised d r a f t procedure dated October 4, 1985 (Method 13xx,
T o x i c i t y C h a r a c t e r i s t i c Leaching Procedure).
e x t r a c t i o n media.
Federal Reg is te r .
Inc ludes choice of two
Th is procedure was a l s o presented i n t h e January 14, 1986
4CAM - C a l i f o r n i a Assessment Manual Waste E x t r a c t i o n Test. C r i t e r i a f o r
I d e n t i f i c a t i o n of Hazardous and Extremely Hazardous Wastes. A r t i c l e 11 o f T i t l e
22, C a l i f o r n i a Department of Hea l th Services, October 13, 1984.
50verhead s t i r r e r s were used t o f a c i l i t a t e pH c o n t r o l i n t h e EP t o x i c i t y t e s t .
The TCLP and CAM e x t r a c t s were a g i t a t e d by r o t a t i o n .
c-2
Table C-2
EP AND TCLP LEACH TEST RESULTS - PLANTS A, B. C (mg/L)
Sample: RCRA Max. A 4 4 A-S4 B-S5 c-s4 c-54
Method: Llmit
Elemental Analysis Arsenic 5 Barium 100 Beryl l ium Cadm i urn 1 Chromium 5 Cobalt Copper Lead 5
Molybdenum Nickel Selenium 1 S i l v e r 5 T h a l l ium Vanadium Z i nc
EP AND TCLP LEACH TEST RESULTS - PLANTS 0, Fp G (mg/L)
Sample: RCRA Max.
Method : Llmlt Elemental Analysis
Arsenic Barium Beryl 1 ium Cadmium Chromium Cobalt Copper Lead Mercury Molybdenum Nickel Selenium S i l v e r T h a l l ium Vanad i um Zinc
pH ( u n i t s )
5 100
1 5
5 0.2
1 5
0-S3
EP
(0.002 0.16 0.007 0.48 0.053 0.54 0.091
(0.002 <0.0002 0.15
36 (0 .002 0.014
(0.09 4.8 3.3
4.8
D-S3
L 2 M i l u
0.013 0.02
(0.001 0.002 0.046 0.011 0.021
(0.002 <0.0002 1.1 0.028
(0.002 0.034 0.18
0.018
7.5
37
. .
F-S3
EP
(0.002 0.092
(0.01 0.042
(0.05 (0.06 0.14
<0.002 0.0009 0.054 1.2
(0.002 0.01
(0.09 (0.03 0.28
5.1
F-$3
Old TCLP
<0.002 0.014
(0.001 0.022 0.017
<0.006 (0.001 <0.002 0.0006 0.25
(0.003 <0.002 0.007
(0 .09 (0.003 0.007
7.1
g-53
EP
<0.002 0.26
(0.01 0.054 0.056 0.21 0.53
<0.002 <0.0002
0.032 23 <o .002 0.016
(0.09 (0.03 20
4.8
c-4
Table C-2 (cont inued)
EP AND TCLP LEACH TEST RESULTS - PLANTS G, HI K (mg/L)
Sample: RCRA Max. G-S3 H-S3 K-TkU5 Old K-TkU5
Method: -.L.mL-
Elemental Ana lys is Arsenic 5 Barium 100 Bery l 1 ium Cadmium 1 Ch rom i um 5 Cobal t Copper Lead 5 Mercury 0.2 Molybdenum Nicke l Selenium 1 S i l v e r 5 T h a l l ium Vanad i um Z inc
Method : L i m i t L L JCLP/Sol id TCLP/Lia. Stack Wash 01 d 01 d
Elementa l Ana lys is Arsen ic Barium B e r y l l i u m Cadm i um Chromi urn C o b a l t Copper Lead Mercury Molybdenum N i c k e l Selenium S i l v e r T h a l l ium Vanadium Z i n c
pH ( u n i t s )
5 0.1 100 0.03
1 0.23 5 0.25
0.46
0.009
5 3.1 0.058
0.2 0.0002 0.1
14 1 0.026 5 0.008
(0.09 7.8 1.5
3.5
0.19 0.13 0.018 9.4 1
22 7.1
<0.002 <0.0002 8.1
(0.002 0.083
(0.09 360
43
820
2.9
0.003 0.089 . 0.003 0.75 0.069 1.7 0.33
(0.002 <0.0002 1.1
60 (0. 002 0.002
(0.09 12 3.3
4.9
0.062 0.16 0.036
21 2.1 48 15 (0.002 <0.0002 20
1730 (0.002 0.23
(0.09 880
92
3
C-6
Table C-2 (cont inued)
EP AN0 TCLP LEACH TEST RESULTS - PLANTS M, N
Sample: RCRA Max.
Method : Limlt
Elemental Analys is Arsenic 5 Barium 100 B e r y l l i u m Cadmium 1 Chromium 5 Cobal t Copper Lead 5 Mercury 0.2 Molybdenum N icke l Selenium 1 S i l v e r 5 T h a l l ium Vanadium Z inc
pH ( u n i t s )
M-S3
EP
<o. 002 0.06
<0.001 0.02 0.1 0.06 0.41
<0,002 0.0017 0.02 0.11 0.13 0.02
(0.09 0.04 0.18
5.2
(mg/L)
. .
M-S3
L2 lLrGu
(0.002 0.07 0.001 0.007 0.1 0.075 0.94
<0.002 0.0032 0,025 0.16 0.25 0.01
(0.09 0.03 0.02
N-S3
EP
(0.002 0.045
(0.001 <0.002 0.01
(0.006 0.15 0.006
<0.0002 (0 * 002 0.011
(0.003 <0.002 (0.09 0.032 0.69
N-S3
kd2l.E
<O. 004 0.07
(0.001 (0 .002 0.018
S0.006 0.16
(0.002 0.0002
(0.002 0.03
(0. 003 0.009 (0.09 0.044 0.53
n-53
cLd3L.e
(0.004 0.19
(0.001 (0.002 0.022
<0.006 0.17 0.006
<0.0002 0.006 0.018
C0.003 0.007
(0.09 0.061 0.89
c-7
Table 0 2 (continued)
EP AN0 TCLP LEACH TEST RESULTS - PLANTS 0, T (mg/L)
Sample: RCRA Max. 0 4 2 0-s2 0 4 2 T-S3
Method: L i m i t L l i Q L u e - L Elemental Analysis
Arsenic 5 Barium 100 Beryl 11 um Cadm i um 1 Chromium 5 Cobalt Copper Lead 5 Mercury 0.2 Molybdenum Nickel Selenium 1 S i l v e r 5 Tha l l i u m Vanadium Zinc
CALIFORNIA ASSESSMENT MANUAL WASTE EXTMCTION TEST RESULTS - PLANTS A, C, D, F S G (mg/L)
Sample: A-S4 c-s4 D-S1 F-S3 G-S3
D e s c r i p t i o n : CAM Sludge S1 udge S1 udge Sludge S1 udge m ~ ~ ~ s Q L h k s Q L h k
Elemental Ana lys is Arsenic 5 0.018 0.31 0.33 0.021 0.17 Barium 100 1.3 1.1 2.6 0.26 1.2 B e r y l 1 lum 0.75 0.4 <o. 1 0.029 0.014 (0.1 Cadmium 1 0.1 1.5 1.5 0.062 0.47 Chromium 560 0.7 27 1.2 6.8 6.5 Chranium V I 5 0.13 0.037 0.054 Cobal t Copper Lead Mercury Molybdenum N i c k e l Selenium S i l v e r Thal 1 ium Vanadium Z inc
80 25
5 0.2
350 20 1 5 7
24 250
2.8 0.69 1.1 0.00084 0.08
34 <0.002 0.065
<0.9 7.4
11
1.3 1 0.26
<0.0002 2
100 <o .002 0.8
<9 9
100
1.6 0.21 <0.6 2.2 0.62 0.29 2.4 <0.002 <0.002
<o . 0002 <0.0002 <o . 0002 2.9 3.1 c0.2
<0.002 <0.002 <0.002 0.26 <o .02 <0.2 4.2 (0.9 (9
1000 0.44 1.9 11 1.1 56
110 2 79
pH ( u n i t s ) 8 6.6 7.8 8.6 6.8
c-9
Table C-3 (cont inued)
CALIFORNIA ASSESSMENT MANUAL WASTE EXTRACTION TEST RESULTS - PLANTS K, M, N p 0 (mg/L)
Sample: K-TkU5 K-ESP1 M-S3 N-S3 0-s2 7-53
D e s c r i p t i o n : CAM SIU;
Elemental Analys is Arsenic 5 Barium 100 Bery l 1 i urn 0.75 Cadmium 1 Chromi um 560 Chromium V I 5 Cobal t 80 Copper 25 Lead 5 Mercury 0.2 Molybdenum 35 0 Nickel 20 Selenium 1 S i l v e r 5 Thal 1 i urn 7 Vanad i um 24 Zinc 25 0
Th Ickener Sol i d s
0.012 0.3
<0.001 0.097 0.22
0.2 0.47 0.22 0.0004 0.85 5.5 0.004
<o .002 CO.09 13
1.21
ESP Sol i d s
1.3 0.21
<0.01 13 2.6 0.026
32 11
<0.0002 20
4.7
1100 0.016 0.24 4.5
970 59
Pond. Sollds
0.052 0.08 0.005 0.009 1.6
0.14 4.2
<0.002 0.0027 0.11 0.37 0.28 0.02
<0.09 0.21 0.44
Pond Sollds
<o. 008 0.059 0.001
<0.002 0.047
0.009 0.56
<o. 002 0.0002 0.017 0.046
<0.03 0.006
<0.09 0.11 2.3
Pond solids
<0.016 0.067 0.001
<0.002 0.061
<0.006 0.082
<o. 002 0.0003 0.007 0.048
<0.02 0.004
CO.09 0.083 2.1
F i l t e r -&l.i!&
0,13 0.42
<0,01 (0.02
1.4
0,96 3.7 0.7 0,0007 0.29
23 <0.003 (0.02 <0.9 43 2.2
c-10
Table C-3 (continued)
CALIFORNIA ASSESSMENT MANUAL WASTE EXTRACTION TEST RESULTS - BLANK EXTRACTIONS (mg/L)
Sample:
Descript ion:
Elemental Analysis Arsenic Barium Bery l l ium Cadmlum Chromium Chromium V I Cobalt Copper Lead Mercury Molybdenum Nickel Selenium S i l v e r Thall ium Vanadium Zinc
ANALYTICAL RESULTS OF RCRA WASTES - PLANTS A, B (mg/L)
Sample: RCRA A-F2 A-V 1 B-HC1 1 B-R1 8-SA1
Oescript ion: Maximum F i r e s i d e EDTA HC1 Waste Waste
Elemental Analysis
~~~~~~
Arsenic 5 (0.002 0.21 <0.002 <0.002 <0.002 Barium 100 0.083 0.34 0.47 0.051 0.019 Beryl 1 ium (0.001 <0.001 <o. 1 <0.001 (0.001 Cadm i um 1 0.004 0.061 0.78 0.002 0.022 Chromium 5 (0.005 0.55 h 0.045 (0.005 Chranium VI 0.47 0.47 Cobalt Copper Lead Mercury Molybdenum Nickel Selenium S i l v e r T h a l l i urn Vanadium Zinc
ANALYTICAL RESULTS OF RCRA WASTES - PLANTS C, 0, E, F (mg/L)
Sample: F-HAF1 RCRA C-Brl C-HC11 D-F1 E-C1 HAF
Oescr i p t i o n : Maximum Bromate HC1 F i r e s i d e C i t r i c Composite l l m i t W a s t e - - - W a s t e
Elemental Ana lys is 5 <o. 002 0.015 <o. 002 0.031 <o. 002
100 0.015 1.6 0.26 1.1 0.097 <0.01 < O . l (0.01 <o. 1 (0.01
Arsenic Bar 1 um Bery l1 ium Cadmfum Chromium Chromium V I Cobal t Cop pe r Lead Mercury Molybdenum N icke l Selenium S i l v e r Thal 1 i um Vanadium Zinc
ANALYTICAL RESULTS OF RCRA WASTES - PLANT G (mg/L)
Sample: RCRA
D e s c r i p t i o n : Maximum L.iD2.L
Elemental Ana lys is Arsenic Barium Bery l 1 i um Cadm i um Chromi um Chromium V I Coba l t Copper Lead Me rcu r y Molybdenum N i c k e l Selenium S i l v e r T h a l l i um Vanadium Z inc
Elemental Analys is Arsenic 5 Barium 100 Bery l l i um Cadm i um 1 Chromium 5 Chromium V I Coba 1 t Copper Lead 5 Mercury 0.2 Molybdenum Nickel Selenium 1 S i l v e r 5 T h a l l i um Vanadium Z.i nc
pH ( u n i t s ) 2<pH<12.5
(mg/L 1
H-Brl
Bromate Waste
<0.002 0.022
<o. 01 0.007
(0.05
(0.06 3 25
0.016 <0.0002 0.031 0.098
<0.002 0.069
<0.9 CO.03 3.1
10.8
H-HC1 1
HC1 J!luiL%
0.007 2.6
<o. 1 0.019 5 . 2 2.4 0.78
10.5 0.33
<o . 0002 0.43
<0.002 0.001
(0.9 10.3
180
100
1.5
H-HC12
Neut ra l i zed HC1 A
<0.002 <o. 001 <0.001
0.002 0.02 0.064
<0.006 0.58
<0.03 0,0039 0.25 0.015
<0.002 <0.001 <o .09 0.016
26
12.1
C-15
Table C-4 (cont inued)
ANALYTICAL RESULTS OF RCRA WASTES - PLANTS I, J
Sample: RCRA
Desc r ip t i on : Maximum limLt
Elemental Analys ls Arsenic 5 Barium 100 Bery l 1 ium Cadmium 1 Chromium 5 Chromium V I Cobal t Copper Lead 5
Molybdenum N icke l Selenium 1 S i l v e r 5 T h a l l ium Vanadium Z inc
ANALMICAL RESULTS OF RCRA WASTES - PLANTS K s L, M (mg/L)
Sample: RCRA K-APrl K-APrl L-v1 M-BCR1 M-P2
Descr ip t ion : Maximum F i l t e r e d U n f i l t e r e d EDTA Re jec t Pond -LA&- A i rp rehah te r W a s h w a t e r W a s t e L l a u l d W
Elemental Ana lys is 5 10.002 <0.002 0.36 0.27 0.019
100 0.076 0.061 0.65 0.1 0.1 Arsenic Barium Bery l l i um Cadm i um Chromium Chrmium V I Cobalt Copper Lead Mercury Molybdenum Nicke l Selenium S i l v e r T h a l l i um Vanadium Zinc
ANALYTICAL RESULTS OF RCRA WASTES - PLANTS N, 0, P (mg/L)
Samp 1 e: RCRA N-BCR3 0-BCR1 0-P2 P-c1
Descr ip t ion :
Elemental Ana lys is Arsenic Barium Bery l 11 um Cadmium Chromium Chranium V I Cobalt Copper Lead Mercury Molybdenum Nickel Selenium S i l v e r T h a l l i um Vanad i um Zinc
Maximum U m i L
5 100
1 5
5 0.2
1 5
Re jec t !J.uuJ-
0.52 0.14 0.008
CO.02 0.14
0.1 0.33
~ . . ~ <0.002 <0.0002 0.87 0.84
<o. 002 0.022 0.54 0.68
20
Re jec t “!L
0.02 0.18 0.001
<o .002 (0.005
0.018 0.011
<0.002 <0.0002 0.039 0.28
(0.002 <o .002
0.1 0.14
10.003
Pond lwQL
0.14 0.15 0.003 0.003 0.025
0.047 0.076
<0.002 <o . 0002 0.33 0.32 0.037
<o .002 0.21 0.27 2.2
C i t r a t e Waste
0.17 0.32
(0.1 (0.2 Lz
0.95 3.8 0.19
<0.0002 1.1 4.9
<o .002 CO.02 0.41 0.29 2.7
pH ( u n i t s ) 2<ph<12.5 4.9 4.6 9.8
P-RI
F i r s t _Rlnstr
0.018 0.097
(0.01 0.04 0.77
0.09 8.5
<0.002 <0.0002 0.19 0.49
<0.002 <0.02 (0.09 0.03 0.49
9.3
c-18
Table C-4 (cont inued)
ANALYTICAL RESULTS OF RCRA WASTES - PLAkTS T, U (mg/L)
Sample: RCRA T-Ft1 T-Ft16 u-v1 U-R1 U-HAF2
Descr ip t ion : Maximum F i r e s i d e F i r e s i d e EDTA EDTA HAF J.3u.L +1 h r t 1 6 hrs ~~~
Elemental Analys is Arsenic 5 Barium 100 Bery l l i um Cadm f um 1 Chromi um 5 C h r a i u m V I Cobalt Copper Lead 5
Molybdenum Nickel Selenium 1 S i l v e r 5 T h a l l i um Vanad i urn Zinc
Mercury 0.2
pH ( u n i t s ) 2<pH<12.5
<0.002 0.089 0.012 0.2 0.53
5.4 7.1 0.051
<0.0002 0.074 0.59
<0.002 0.022 0.27 4.7
25
0.016 0.09
<O.OOl <0.002 (0.005
<0.006 0.012 0.008
<0.0002 0.43 0.032
<0.002 (0.002 (0.09 19 0.007
10.1
0.4 1.3
(0.1 <0.2 4.7
0.6 123 23
0.0012 1
15 <0.002 0.029 0.43 0.28
60
8.4
0.014 0.005 0.004
<0.002 0.11
0.023 0.94 0.46
<0.0002 0.098 0.64
<0.002 <0.002 (0.09
0.003 1.6
9.1
0.007 0.16
(0.1 (0.2 lz
0.027 0.62 0.1 0.3 0.0004
13 6.2
<0.002
1.3 3.8
3.1
c-19
Appendix D
QUALITY ASSURANCE -- RESULTS
OF FIELD AND LABORATORY
QUALITY CONTROL
CONTENTS
Iahle m D-1 Q u a l i t y Assurance Resu l t s -- Ana lys i s o f Con t ro l
Standard D-2
D-2 D.ual i ty Assurance Resu l ts -- R e p l i c a t e Ana lys i s D-3
D-3 Q u a l i t y Assurance Resu l ts -- EP R e p l i c a t e Ana lys is . D-4
D-4 Q u a l i t y Assurance Resu l ts -- D.ual i ty Con t ro l f o r Water
Parametars (P lan ts A through U) D-5
0 - i i i
QUALITY ASSURANCE -- RESULTS OF FIELD AN0
LABORATORY QUALITY CONTROL
The q u a l i t y assurance p lan inc luded adher ing t o t h e sampling and a n a l y t i c a l p lans
developed f o r each p l a n t ( o r each s e t of experiments), and f o l l o w i n g q u a l i t y
c o n t r o l CQC) p r a c t i c e s es tab l i shed f o r l a b o r a t o r y analys is . The QC plan was
w r i t t e n p r i o r t o i n i t i a t i o n o f any o f t h e work.
A n a l y t i c a l QC inc luded t h e f o l l o w i n g four-s tep pro toco l :
0 Cont ro l Standards - With each batch of analyses (a t o t a l of f i v e
batches were processed) EPA c o n t r o l standards were a l s o analyzed. The
c o n t r o l standards were p laced i n b o t t l e s i d e n t i c a l t o t h e sample
b o t t l e s . One standard conta ined known l e v e l s o f arsenic, barium,
cadmium. chranium, lead. selenium and s i l v e r ; another conta ined known
l e v e l s o f a l k a l i n i t y , c h l o r i d e , f l u o r i d e , and s u l f a t e ; another had a
known pH and TOS; and a f i n a l standard f o r COO and TOC. These QC
analyses i n d i c a t e how c l o s e t h e .analyses came t o c e r t i f i e d standards
(accuracy ) . 0 R e p l i c a t e Ana lys is - One sample was analyzed repeatedly w i t h each batch
of analyses. The comparison o f r e s u l t s f o r t h i s sample over t i m e g ives
an i n d i c a t i o n o f t h e t ime v a r i a b i l i t y o f t h e analyses ( p r e c i s i o n ) .
0 Recovery - Water q u a l i t y parameters were QC checked f o r recovery by
runn ing c e r t i f i e d standards and by s p i k i n g t h e ac tua l samples w i t h a
known amount o f standard.
accuracy o f t h e analyses.
Both checks prov ide a measure of t h e
The r e s u l t s o f t h e QC plan, presented i n t h e t a b l e s of t h i s appendix. can be used
t o judge t h e r e l a t i v e accuracy (closeness t o a known standard) and p r e c i s i o n
( b i a s ) o f t h e analyses.
D - 1
Table 0-1
QUALITY ASSURANCE RESULTS--ANALYSIS OF CONTROL STANDARD
U i c a l Resu l ts (mo/L) .
P1 ants:
Elemental Ana lys is A1 um i n um Antimony Arsenic Barium Bery l1 ium Boron Cadmium Calcium Ch rom 1 um Cobal t Copper I r o n Lead Ma.gn e s i um Manganese Mercury Molybdenum N icke l Potassium Selenium S i l i c o n S i l v e r Sod i um T h a l l ium Vanadium Z inc
Water Qual i t y Values pH ( u n i t s ) A c i d i t y
A1 k a l i n i t y
coo Ch lor ide F l u o r i d e N i t r a t e N i t r i t e (as N) S u l f a t e TOS TOC
(as CaC03)
(as CaC03)
A
(0.05 (0 .02 (0.06 0.34
(0.001 (0.06 <0.002 (0 .05 0.032
(0.006 (0.001 (0.008 (0.08 (0.03 (0.001
(0.002 (0 ,003 (0.05 (0.08 0.26 0.021 0.46
(0.09 (0.003 0.004
7.7
23
26 440
19 (0.1 (1 (0 .02 10
B-G
0.17 10.02 0.037 0.37
(0.001 (0.05 0.006
(0 .05 (0.006 0.035
(0.001 0.018
(0.08 (0.03 (0.001
(0.002 (0 .003 (0.05 0.005 0.3 0.041 0.87
(0.09 (0.003 (0.003
0.48
15 0 89 103
tl-l
0.037 0.36
(0.001
<0.002
0.031 (0.006 <0.001
0.044
0.0096 0.007
(0.003
0.008
0.01
(0.09 (0.003 (0 .003
2.44
570
(1 190 27
0.51 (2 (0.02 11 64 85
P,M
(0.05 (0.02 0.044 0.36
<0.001 0.26
(0.002 (0 .05 0.047
(0 .006 (0.001 0.095 0.041
(0.03 (0.001
<0.002 (0 .003 0.15 0.009 0.33 0.035
(0.03 (0.09 (0.003 (0 .003
0.0012
7.6
15
21.5
18.3 0.51
(1 10.02 5.4
42 88
209
fLQLILL
10.05 <0.02 0.044 0.36
(0.001 0.26
<0,002 (0.05 0.047
(0.006 (0.001 0.095 0.041
(0 .03 (0. 001
(0.002 (0.003 0.15 0.009 0.33 0.035
(0.03 (0.09 (0.003 10.003
0.0012
6.9
15
Actual Values
0.043 0.344
0.0046
0.046
0.045
0.0076
0.034
7.8
22 21.7
20 17.8 210 232
0.51 0.43 (1 (0.02 5.4 7.2
42 44.2 88 91.5
D-2
Table 0-2
QUALITY ASSURANCE RESULTS--REPLICATE ANALYSIS
Elemental Ana lys is Aluminum Ant i mony Arsen ic Barium Bery l 1 i um Boron Cadmium Calcium Chromium Coba l t Copper I r o n Lead Magnesium Manganese Mercury Molybdenum N icke l Potassium Selenium S i l i c o n S i l v e r Sodium T h a l l ium Vanadium Z inc
Water Q u a l i t y Values pH ( u n i t s ) A c i d i t y
(as CaCO3) A1 k a l i n i t v
(as CaC63) coo Ch lor ide F1 u o r i de N i t r a t e N i t r i t e (as N) S u l f a t e TOS TOC
Sample B - H C l l (ma/L) 7/3/85 7/15/85 1013185 12/04/85
EP QUALITY ASSURANCE RESULTS -- EP REPLICATE ANALYSIS
Elemental Ana lys is Arsen ic Barium B e r y l l i u m Cadmium Chromium Cobalt Copper Lead Mercury Molybdenum N icke l Selenium S i l v e r Thal 1 ium Vanadium Z inc
Rapid-Mix Tank N e u t r a l i z a t i o n - 50 GPM System
Rapid-Mix Tank N e u t r a l i z a t i o n - 50 GPM Two Chemical
Rapid-Mix Tank N e u t r a l i z a t i o n - 250 GPM System
Rapid-Mix Tank N e u t r a l i z a t i o n - 250 GPM Two Chemical
Rapid-Mix Tank N e u t r a l i z a t i o n - 500 GPM System
Rapid-Mix Tank N e u t r a l i z a t i o n - 500 GPM Two Chemical
Feed Systems
Feed Systems
Feed Systems
In -L ine N e u t r a l i z a t i o n - 50 GPM System
In -L ine N e u t r a l i z a t i o n - 50 GPM Two Chemical Feed
Systems
In -L ine N e u t r a l i z a t i o n - 250 GPM System
In -L ine N e u t r a l i z a t i o n - 250 GPM Two Chemical Feed
Systems
In -L ine N e u t r a l i z a t i o n - 500 GPM System
In -L ine N e u t r a l i z a t i o n - 500 GPM Two Chemical Feed
Systems
Procedure for Determining Impoundments Costs
Physical IChemical Treatment - 50 GPM
Physfcal IChemical Treatment - 250 GPM
Physical IChemical Treatment - 250 GPM
Physlcal/Chemical Treatment - 500 GPM
Physical/Chemical Treatment - 500 GPM
Procedure f o r Determining L a n d f i l l Costs
E-2
E-3
E-4
E-5
E-6
E-7
E-8
E-9
E-10
E-11
E-12
E-13
E-14
E-16
E-18
E-19
E-20
E-21
E-22
E-iii
COST B A S I S FOR TREATMENT SYSTEMS
Th is appendix presents data used as the basis f o r costs o f treatment systems
discussed i n Section 4 o f t h i s manual. The basis includes d e t a i l e d equipment
1 i s t s , equipment purchase and i n s t a l l a t i o n costs. and ca lcu la t ions for est imating
sme costs.
E-1
Table E-1
RAPID-MIX TANK NEUTRALIZATION - 50 GPM SYSTEM ( d e t a i l e d equipment l i s t )
Item Mix Tank
Mix Tank A g i t a t o r
Chemlcal Feed Tanks
Discharge Sump Pumps
Acid Feed Pumps
Caust lc Feed Pumps
pH Cont ro l System
Level Cont ro l System
F1 ow I n d i c a t o r
DescdDt ion
Concrete Sump 2000 ga l lon . 6.5 ft x 6.5 f t x 7.5 f t (1 f t freeboard) g ra ted top, a g i t a t o r and pump suppor ts
P r o p e l l e r mixer ( 2 hp. 70 rpm) a l l in-tank p a r t s 304 S t a i n l e s s Steel
200 ga l lon . f i be rg lass - re in fo rced p l a s t i c , v e r t i c a l , f l a t bottom. dished heads. inc ludes hold-down lugs. manway, and ven t connect ion
Cent r i fuga l . 50 gpm, 55 ft head. 2 hp, TEFC motor, s t a i n l e s s s t e e l i n te rna ls , mechanical sea ls (1 operat ing. 1 spare)
Diaphragm, i n t e r n a l s o f Carpenter 20 s tee l , 1/3 hp motor. e l e c t r o n i c s t r o k e adjustment. 4-20 m i l l i amp i n p u t (1 operat ing. 1 spare)
Dlaphragm, s t a i n l e s s s t e e l i n t e r n a l s 1/3 hp motor, e l e c t r o n i c s t r o k e adjustment, 4-20 m i l l i amp i n p u t (1 operat ing. 1 spare)
I n s e r t i o n probe (1 operat ing. 1 spare), 2 t ransmi t te rs , 4-20 m i l l i amp outpu t
dP t ransmi t te r , 4-20 m i l l i amp outpu t I / P conver te r (4-20 mil l iamp/3-15 p s i g ) S1 i d i n g g a t e valve, pneumat ica l ly operated, 2'9, Cv = 30. carbon s t e e l w i t h threaded ends and s t a i n l e s s s t e e l i n t e r n a l s
S t a i n l e s s s t e e l o r i f i c e and f l ange dP t r a n s m i t t e r . l o c a l i n d i c a t o r
E-2
Table E-2
RAPID-MIX TANK NEUTRALIZATION - 50 GPM TWO CHEMICAL FEED SYSTEMS
(equipment purchase and installation costs) - Mix Tank Mix Tank Agitator Chemical Feed Tanks Discharge Pumps Acid Feed Pumps Caustic Feed Pumps pH Control System Level Control System Flow Indicator On-site Costs1 Off-site Costs2
l25 percent of purchased equipment cost for piping, foundations. electrical, and insulation, paint, and cleanup.
'15 percent of direct process cost for buildings, storage facilities, uti1 ities, and off-site piping.
E-3
Table E-3
RAPID-MIX TANK NEUTRALIZATION - 250 GPM SYSTEM ( d e t a i l e d equipment 1 i s t )
Item DesCriDt ion
Mix Tank Concrete Sump 10,DOO gal lon, 11 f t x 11 f t x 12 ft (1 ft freeboard) grated top, a g i t a t o r and pump supports
Mix Tank A g i t a t o r p r o p e l l e r mixer (5 hp, 70 rpm) a l l in- tank p a r t s 304 S t a i n l e s s Steel
Chemical Feed Tanks 1000 gal lon, f i b e r g l a s s - r e i n f o r c e d p l a s t i c , v e r t i c a l , f l a t bottom, dished heads, i nc ludes hold-down lugs. manway, and ven t connect ion
C e n t r i f u g a l s 250 gpm. 50 f t head. 10 hp, TEFC motor, s t a i n l e s s s t e e l i n te rna ls , mechanical seals, (1 operat ing. 1 spare)
Discharge Sump Pumps
Acid Feed Pumps Diaphragm, i n t e r n a l s o f Carpenter 20 s tee l , 1/3 hp motor, e l e c t r o n i c s t r o k e adjustment, 4-20 m i l l i amp i n p u t (1 operat ing, 1 spare)
Caust ic Feed Pumps Diaphragm, s t a i n l e s s s t e e l i n t e r n a l s 1/3 hp motor. e l e c t r o n i c s t r o k e adjustment, 4-20 m i l l i a m p i n p u t (1 operat ing, 1 spare)
pH Cont ro l System I n s e r t i o n probe (1 operat ing, 1 spare), 2 t ransmi t te rs . 4-20 m i l l i a m p ou tpu t
Level Con t ro l System dP t r a n s m i t t e r , 4-20 m i l l i a m p ou tpu t I / P conver te r (4-20 m i l 1 iamp/3-15 ps ig ) S1 i d i n g g a t e valve. pneumat ica l ly operated. 3", Cv = 130, carbon s t e e l w i t h f langed ends and s t a i n l e s s s t e e l i n t e r n a l s
Flow I n d i c a t o r S t a i n l e s s s t e e l o r i f i c e and f l ange dP t r a n s m i t t e r , l o c a l i n d i c a t o r
E-4
Table E-4
RAPID-MIX TANK NEUTRALIZATION - 250 GPM TWO CHEMICAL FEE0 SYSTEMS
(equipment purchase and i n s t a l l a t i o n c o s t ) - Mix Tank Mix Tank A g i t a t o r Chemical Feed Tanks Discharge Pumps Acid Feed Pumps Caust ic Feed Pumps pH Cont ro l System Level C o n t r o l System Flow I n d i c a t o r
l 2 5 percent of purchased equipment c o s t fo r p ip ing. foundations, e l e c t r i c a l , and i n s u l a t i o n . pa in t , and cleanup.
215 percent of d i r e c t process c o s t f o r b u i l d i n g s , s torage f a c i l i t i e s , u t i l i t i e s , and o f f - s i t e p ip ing .
E-5
Table E-5
RAPID-MIX TANK NEUTRALIZATION - 500 GPM SYSTEM ( d e t a i l e d equipment l i s t )
Item Descr iD t ion
Mix Tank Concrete Sump 20,000 gal lon, 14 f t x 14 f t x 15 f t (1 f t freeboard) grated top. a g i t a t o r and pump supports
Mix Tank A g i t a t o r
Chemical Feed Tanks 2000 gal lon, f i be rg lass - re in fo rced p l a s t i c , v e r t i c a l , f l a t bottom. dished heads. inc ludes hold-down lugs. manway. and v e n t connect ion
Discharge Sump Pumps Cen t r i f uga l , 500 gpm, 50 f t head, 15 hp, TEFC motor. s t a i n l e s s s t e e l i n te rna ls , mechanical
p r o p e l l e r m ixe r (10 hp. 60 rpm) a l l in- tank p a r t s 304 S t a i n l e s s Steel
Ac id Feed Pumps
Caus t i c Feed Pumps
pH Con t ro l system
seals. (1 operat ing. 1 spare)
Diaphragm. i n t e r n a l s o f Carpenter 20 s tee l . 1/3 hp motor. e l e c t r o n i c s t r o k e adjustment, 4-20 m i l l i a m p i n p u t (1 operat ing, 1 spare)
Diaphragm, s t a i n l e s s s t e e l i n t e r n a l s 1/3 hp motor. e l e c t r o n i c s t r o k e adjustment, 4-20 m i l l i a m p i n p u t (1 operat ing. 1 spare)
I n s e r t i o n probe (1 operat ing. 1 spare), 2 t ransmi t te rs , 4-20 m i l l i a m p ou tpu t
Level Con t ro l System dP t r a n s m i t t e r , 4-20 m i l l i a m p ou tpu t I / P conver te r (4-20 mi l l iamp/3-15 p s i g ) S1 i d i n g g a t e valve. pneumat ica l ly operated. 4", Cv = 200, carbon s t e e l w i t h f langed ends and s t a i n l e s s s t e e l i n t e r n a l s
Flow I n d i c a t o r S t a i n l e s s s t e e l o r i f i c e and f l ange dP t r a n s m i t t e r . l o c a l i n d i c a t o r
E-6
Table E-6
RAPID-MIX TANK NEUTRALIZATION - 500 GPM TWO CHEMICAL FEE0 SYSTEMS
(equipment purchase and i n s t a l l a t i o n cos ts )
U n i t To ta l Purchase I n s t a l l a t i o n To ta l -*-LA- Mix Tank $4.000 1 $4.000 $7,000 $1 1,000 Mix Tank A g i t a t o r lotloo 1 lotloo 900 11.000 Chemical Feed Tanks 4,000 2 8,000 2,000 10,000 Discharge Pumps 3,800 2 7,600 1,000 8,600 Acid Feed Pumps 29550 2 5,100 400 5,500 Caust ic Feed Pumps 29500 2 5.000 400 5.400 pH Cont ro l System 1.600 2 3200 1,000 4.200 Level Cont ro l System 6.100 1 6,100 600 69700 F1 ow I n d i c a t o r 1,000 1 1,000 300 1.300 On-s i te Costs1 13,000 O f f - s i t e Costs2 11,000
TOTAL $87,000
l25 percent o f purchased equipment c o s t f o r p ip ing. foundations, e l e c t r i c a l , and insu la t l on , pa int , and cleanup.
215 percent o f d i r e c t process c o s t f o r bu i l d ings . s torage f a c i l i t i e s . u t i l i t i e s , and o f f - s i t e p ip ing .
-
E-7
Table E-7
IN-LINE NEUTRALIZATION - 50 GPM SYSTEM ( d e t a i l e d equipment l i s t )
Item In-1 i n e S t a t i c Mixer
Chemical Feed Tanks
Discharge Pumps
Acid Feed Pumps
Caust ic Feed Pumps
pH Con t ro l System
Flow I n d i c a t o r
D e s c r i o t i o n
2- inch diameter, 2 e lemen tdmixe r A l l o y 20 cons t ruc t ion . threaded ends
200 ga l lon . f i be rg lass - re in fo rced p l a s t i c . v e r t i c a l , f l a t bottom. dished heads. inc ludes hold-down lugs. manway, and ven t connect ion
Cen t r i f uga l , 50 gpm. 50 f t head. 2 hp, TEFC motor. s t a i n l e s s s t e e l l n te rna ls , mechanical seals. (1 operating, 1 spare)
Diaphragm. i n t e r n a l s o f Carpenter 20 s tee l , 113 hp motor, e l e c t r o n i c s t r o k e adjustment, 4-20 m i l l i amp i n p u t (1 operating, 1 spare)
Diaphragm, s t a i n l e s s s t e e l i n t e r n a l s 1/3 hp motor. e l e c t r o n i c s t r o k e adjustment, 4-20 m i l l i amp i n p u t (1 opera t ing , 1 spare)
I n s e r t i o n probe (1 operat ing. 1 spare). 2 t ransmi t te rs . 4-20 m i l l i a m p ou tpu t
S t a i n l e s s s t e e l o r i f i c e and f lange dP t r a n s m i t t e r . l o c a l i n d i c a t o r
E-8
Table E-8
IN-LINE NEUTRALIZATION - 50 GPM TWO CHEMICAL FEED SYSTEMS
(equipment purchase and i n s t a l l a t i o n costs;
U n i t
In-1 i n e Mixer $700 1 Chemical Feed Tanks 1.850 2 Discharge Pumps 1,900 2 Ac id Feed Pumps 29500 2 Caus t i c Feed Pumps 2,450 2 pH Con t ro l System 1,600 2 Flow I n d i c a t o r 1,000 1 On-si te Costs1
O f f - s l t e Costs2
TOTAL -
Total Purchase Cost
$700 3,700 31800 5,000 4.900 3,200 1,000
I n s t a l l a t i o n Cost
$500 1,000 1,000
400 400
1,000 300
T o t a l _cnst
$1,200 4,700 4,800 5,400 5.300 4.200 1.300
5,500 4 I 800
$36,800
I25 percent o f purchased equipment c o s t f o r p ip ing, foundations, e l e c t r i c a l , and insu la t i on , pa int , and cleanup.
'15 percent o f d i r e c t process c o s t f o r bu i l d ings , s torage f a c i l i t i e s , u t i l i t i e s . and o f f - s i t e p ip ing.
E-9
Table E-9
IN-LINE NEUTRALIZATION - 250 GPM SYSTEM ( d e t a i l e d equipment l i s t )
Item Descr ipL ion
In-1 i n e S t a t i c M ixe r 4-inch diameter, 2 elements/mixer A l l o y 20 cons t ruc t ion . threaded ends
Chemical Feed Tanks 1000 ga l lon , f iberg lass- re in fo rced p l a s t i c . v e r t i c a l , f l a t bottom, dished heads. inc ludes hold-down lugs, manway. and vent connect ion
Discharge Pumps Cent r i fuga l . 250 gpm, 50 ft head, 10 hp, TEFC motor, s t a i n l e s s s t e e l i n te rna ls . mechanical seals, (1 operat ing. 1 spare)
s tee l , 1/3 hp motor. e l e c t r o n i c s t roke adjustment, 4-20 mi l l i amp i n p u t (1 operat ing. 1 spare)
Ac id Feed Pumps Diaphragm, i n t e m a l s o f Carpenter 20
Caust ic Feed Pumps Diaphragm, s t a i n l e s s s t e e l I n t e r n a l s 1/3 hp motor, e l e c t r o n i c s t r o k e adjustment, 4-20 mi l l i amp i n p u t (1 operat ing. 1 spare)
2 t r ansmi t te rs , 4-20 mi l l i amp ou tpu t pH Cont ro l System I n s e r t i o n probe (1 operat ing, 1 spare),
Flow I n d i c a t o r S t a i n l e s s s t e e l o r i f i c e and f l ange dP t ransmi t te r . l o c a l i n d i c a t o r
E-10
IN-LINE NEUTRALIZATION - 250 GPM TWO CHEMICAL FEE0 SYSTEMS
(equipment purchase and i n s t a l l a t i o n cos ts )
U n i t To ta l Purchase I n s t a l l a t i o n ItemcCostmcostCost
In-1 i n e Mixer $1,500 1 $1,500 $1.000 Chemical Feed Tanks 2,800 2 5.600 1.500 Discharge Pumps 3,100 2 61200 1,000 Acid Feed Pumps 2,550 2 5,100 400 Caust ic Feed Pumps 2,450 2 4.900 400 pH Contro l System 1,600 2 3,200 1.000 Flow I n d i c a t o r 1,000 1 1,000 300
On-s i te Costs1
O f f - s i t e Costs2
TOTAL
Tota l AiQSL
$2,500 7,100 7.200 5,500 5.300 4,200 1.300
6.900
61000
$46,000
125 percent of purchased equipment c o s t for piping, foundations, e l e c t r i c a l . and i n s u l a t i o n . pa int , and cleanup.
215 percent of d i r e c t process c o s t f o r bu i ld ings, storage f a c i l i t i e s . u t i l i t i e s , and o f f - s i t e p ip ing.
E-11
Table E-11
IN-LINE NEUTRALIZATION - 500 GPM SYSTEM ( d e t a i l e d equipment 1 i s t )
Item D e s c r i p t i o n
In-1 i n e S t a t i c Mixer 6- inch diameter, 2 elements/mixer A l l o y 20 cons t ruc t ion , threaded ends
Chemical Feed Tanks
Discharge Pumps
Ac id Feed Pumps
Caus t i c Feed Pumps
pH Cont ro l System
Flow I n d i c a t o r
2000 ga l 1 on, f i be r g l ass- r e i n f o r c e d p l a s t i c, v e r t i c a l . f l a t bottom, d ished heads, inc ludes hold-down lugs, manway, and vent connect ion
Cen t r i f uga l . 500 gpm, 50 f t head, 15 hp, TEFC motor. s t a i n l e s s s t e e l i n t e r n a l s , mechanical seals. ( 1 operating, 1 spare)
Diaphragm. i n t e r n a l s o f Carpenter 20 s tee l , 6 hp motor, e l e c t r o n i c s t r o k e adjustment, 4-20 mi l l i amp i n p u t (1 operat ing, 1 spare)
Diaphragm. s t a i n l e s s s t e e l i n t e r n a l s 1/3 hp motor. e l e c t r o n i c s t r o k e adjustment, 4-20 m i l l i a m p i n p u t (1 operating, 1 spare)
I n s e r t i o n probe (1 operat ing, 1 spare), 2 t r ansmi t te rs , 4-20 m i l l i a m p ou tpu t
S ta in less s t e e l o r i f i c e and f lange dP t r a n s m i t t e r , l o c a l t o d i c a t o r
E-12
Table E-12
IN-LINE NEUTRALIZATION - 500 GPM TWO CHEMICAL FEED SYSTEMS
(equipment purchase and i n s t a l l a t i o n cos ts )
U n i t T o t a l Purchase -cost
In -1 i n e Mixer $2,700 1 $2.700 Chemical Feed Tanks 4.000 2 8,000 Discharge Pumps 3.800 2 7,600 Acid Feed Pumps 2.550 2 5,100 Caust ic Feed Pumps 2,500 2 5,000 pH Cont ro l System 1,600 2 3,200 F1 ow I n d i c a t o r 1,000 1 1,000
On-s i te Costs1
O f f - s i t e Costs2
TOTAL
I n s t a l l a t i o n Cost
$1,500 2r000 lrOOO 400 400
1,000 300
To ta l a 54r200 10,000 81600 5r500 5,400 4,200 1,300 8,100 7.100
$54,100
125 percent o f purchased equipment c o s t f o r p ip ing . foundations, e l e c t r i c a l , and insu la t i on . pa in t . and cleanup.
215 percent o f d i r e c t process c o s t f o r bu i ld ings , s to rage f a c i l i t i e s , u t i 1 i t i e s . and o f f - s i t e p ip ing .
E- 13
Table E-13
PROCEDURE FOR OETEWINING IMPOUNDMENT COSTS
These procedures can be used t o es t imate t h e cos ts o f d iked impoundments. t h i s design. it i s assumed t h a t t h e ponds a re excavated t o a depth s u f f i c i e n t t o a l l o w c o n s t r u c t i o n of t h e d i kes w i t h t h e excavated m a t e r i a l (i.e., volume of excavated m a t e r i a l i s approx imate ly equal t o t h e volume requ i red f o r d i k i n g ) .
For g i ven impoundment spec i f i ca t i ons . several texts p rov ide standard geane t r i ca l formulas t o c a l c u l a t e t h e phys i ca l paramsters needed f o r c o s t es t imat ion . Two o f these are:
Kayes. W.B., and P o l l u t i o n C o n t r a E a c i l i t i e a . Wiley, 1977, 329 pp.
Radian Corporation. Treatment Costs f o r Gas-side Washes a t Steam E l e c t r i c Power Plants, EPA Con t rac t No. 68-01-5163. November, 1981.
I n
The design s p e c i f i c a t i o n s f o r use o f these formula include:
impoundment volume. g a l l o n s w a l l s lope berm width. f t l i q u i d depth, f t freeboard, ft
The parameters needed f o r c o s t es t ima t ion include:
excavat ion volume (volume o f e a r t h excavated below grade), cub ic f e e t b a c k f i l l volume (volume o f e a r t h requ i red f o r d ikes) , c u b i c feet l i n i n g area (sur face area o f l i n e r ma te r ia l ) . square f e e t s i t e p repara t i on area (a rea o f impoundment. i n c l u d i n g d ikes) . acres
A step-by-step procedure f o r determin ing impoundment cos ts from these da ta i s presented below.
A 1 = Land Cost = $5,00O/acre X s i t e p repara t i on area
A2 = Cleaning and Grubbing = $264/acre X s i t e p repara t i on area
= On-s i te Excavat ion = $2.20/cu yd X excavat ion volume
A4 = R o l l i n g Area = $0.53/sq yd X s i t e p repara t i on area
A5 = S o i l S t e r i l i z a t i o n = $0.02/sq f t x s i t e p repara t i on area
= D ike Placement/Compaction = $1.38/cu yd X b a c k f i l l volume
A7 = G e o t e x t i l e Under l i ne r ( i n s t a l l e d cos t ) = 61.45/sq yd X l i n e r area ( n o t requ i red f o r c lay-1 ined impoundments)
E-14
Table E-13 (cont inued)
PROCEDURE FOR OETEWINING IMPOUNDMENT COSTS
A8 = L i n e r M a t e r i a l and I n s t a l l a t i o n F l e x i b l e Membrane L iners :
S ing le FML ( i n s t a l l e d ) = $0.42/sq ft X l i n e r area Double FML ( i n s t a l l e d ) = $0.82/sq f t X l i n e r area
L o c a l l y A v a i l a b l e ( i n s t a l l e d ) = $0.30/sq f t X l i n e r area $ l l O / t o n De l i ve red Clay ( i n s t a l l e d ) = $0.63/sq f t X l i n e r area $150/ton De l i ve red Clay ( i n s t a l l e d ) = $0.75/sq f t X l i n e r area $200/ton De l i ve red Clay ( i n s t a l l e d ) = $0.90/sq f t X l i n e r area
Clay L i n e r s (18- inch) :
Ag = Groundwater Mon i to r i ng ( o p t i o n a l ) - sum o f w e l l i n s t a l l a t i o n c o s t and c o s t o f sampling pump and generator
Number o f w e l l s = (1/50 acres X s i t e p repara t i on area) t 5 Cost = $ 3 2 / f t X we l l depth X number o f w e l l s Sampling Pump and Generator = $1,700
A1O = Leachate C o l l e c t i o n ( o p t i o n a l ) - sum o f c o s t s f o r g ranu la r ma te r ia l . p ip ing . ho ld ing sump, r e t u r n pump. and i n s t a l l a t i o n
Granular Ma te r ia l . cub ic yards = l i n e r area X th i ckness X number o f leachate c o l l e c t i o n l a y e r s
M a t e r i a l Cost $4.00/cu yd Hau l ing $Z.OO/cu yd I n s t a l l a t i o n d l 9 D / c u v d
To ta l $9.00/cu yd
P i p i n g and I n s t a l l a t i o n = $3.00/ f t X 1200 f t / a c r e X s i t e p repara t i on area
Ho ld lng Sump and Return Pump = $4,500
E-15
Table E-14
PHYSICAL/CHEMICAL TREATMENT - 50 GPM ( d e t a i l e d equipment l i s t )
Item D e s c r i p t i o n
Lime Storage System Storage s i l o . 750 cub ic fee t . ( w i t h ladder, s l i d e gate. b rac ing f o r dus t c o l l e c t o r ) , 2-foot b i n a c t i v a t o r . 2-inch screw feeder
Dust c o l l e c t o r . 486 sq ft. 3 hp blower
Welded epoxy-l ined carbon s t e e l mix tank. 1400 gal lons, 2 hp a g i t a t o r
S t a i n l e s s s t e e l c e n t r i f u g a l . 5 gpm, 65 ft head. 1-1/2 hp, TEFC motor (1 operat ing, 1 spare)
Cent r i fuga l , 50 gpm, 50 f t head, 2 hp, TEFC motor, (1 operat ing, 1 spare)
Raw Wastewater Pumps
React ion Tank
C1 a r i f i e r System
Polymer Feed System
pH Adjustment System
Welded epoxy-l ined carbon s t e e l tank, 350 gal lons. 1/2 hp a g i t a t o r
100 sq ft, 10- foo t s idewa l l c l a r i f i e r . s t a i n l e s s s t e e l c e n t r i f u g a l underflow pump. 15 gpm, 65 f t head. 1.5 hp
Drum mixer and drum t r a n s f e r pump, 50 g a l l o n s t a i n l e s s s t e e l mix tank, 1/4 hp a g i t a t o r , diaphragm feed pump, s t a i n l e s s s tee l i n t e m a l s . 1/3 hp
Acid s torage tank, 50 g a l l o n FRP diaphragm feed pump, Carpenter 20 i n te rna ls . 1/3 hp. e l e c t r o n i c s t roke adjustment. 4-20 m i l l i amp input, 100 g a l l o n FRP mix tank, 1 /4 hp a g i t a t o r
G r a v i t y F i 1 t e r System S ing le -ce l l dual media f i l t e r s , 4 - f o o t diameter, automatic backwash. f i l t e r media inc luded (2 u n i t s )
Thickener System 14- foo t diameter, 10- foot s idewal l , sludge rake and motor included. s t a i n l e s s s t e e l diaphragm underf low pump, 10 gpm (1 operating, 1 spare)
Vacuum F i l t e r System Rotary vacuum f i l t e r , 3 - f o o t diameter, 3 - f o o t face, 28 sq f t r vacuum pump, rece iver , and f i l t r a t e pump inc luded
E-16
Table E-14
PHYSICAL/CHEMICAL TREATMENT - 50 GPM (equipment purchase and i n s t a l l a t i o n c o s t s )
U n i t T o t a l Purchase I n s t a l l a t i o n T o t a l
Lime Storage System $23.000 1 $23,000 $7,000 $30.000 Lime Slaker 0 0 0 Lime S l u r r y Mix System 7,800 1 7.800 1,500 9.300 Lime S l u r r y Feed Pump 1,600 2 3,200 1,000 4,200 Raw Wastewater Pump 1,900 2 3.800 1,000 4,800 Polymer Feed System 4,300 1 4,300 1,000 5,300 F lash Mix System 2,800 1 2,800 1,000 3.800 C1 a r i f i e r 21,000 1 21.000 8,000 29,000 C l a r i f i e r Underf low Pump 1,600 2 3,200 1,000 4,200 pH Adjustment System 4,800 1 4,800 1,000 5,800 G r a v i t y F l l t e r 18,000 2 3 6 ~ 0 0 0 14,400 50,400 G r a v i t y Thickener 25,000 1 25.000 10.000 35,000 Thickener Underflow Pump 2,500 2 5,000 1,000 6.000 Rotary Vacuum F i l t e r 50r000 1 50,000 4.000 54,000
I n s t r u m e n t a t i o n 20.000 20.000 4,000 24,000 B e l t Conveyer 5.250 0 0 0 0
On-s i te Costs1 180.000
O f f - s i t e Costs2 110,000
TOTAL $5601000 __
145 percent o f purchase c o s t s f o r p ip ing, foundations, e l e c t r i c a l , and insu la - t i o n , pa in t . and cleanup.
225 percent o f d i r e c t process c o s t s f o r bu i ld ings , s to rage f a c i l i t i e s , u t i l i t i e s and o f f - s i t e p ip ing.
E-17
Table E-15
PHYSICAL/CHEMICAL TREATMENT - 250 GPM ( d e t a i l e d equipment l i s t )
Item Lime Storage System
Raw Wastewater Pumps
React ion Tank
C1 a r i f i e r System
Polymer Feed System
pH Adjustment System
G r a v i t y F i l t e r System
Thickener System
Vacuum F i l t e r System
B e l t Conveyer
D e s c r i o t i o n
Storage s i l o , 3700 cub ic feet, ( w i t h ladder. s l i d e gate, b rac ing f o r d u s t c o l l e c t o r ) , 4 - foo t b i n ac t i va to r , 2-inch screw feeder
Dust c o l l e c t o r , 486 sq ft. 3 hp b lower
Lime s laker . 1000 lb /h r , g r i t remover inc luded
Welded epoxy-l ined carbon s t e e l mix tank. 7000 gal lons. 5 hp a g i t a t o r
S t a i n l e s s s t e e l c e n t r i f u g a l . 20 gpm. 65 f t head. 3 hp, TEFC motor. (1 operat ing, 1 spare)
Cen t r i f uga l . 250 gpm, 50 f t head. 5 hp, TEFC motor (1 operat ing. 1 spare)
Welded epoxy-1 ined carbon s t e e l tank. 2000 ga l lons . 2 hp a g i t a t o r
500 sq ft, 10- foot s idewa l l c l a r i f i e r . s t a i n l e s s s t e e l c e n t r i f u g a l underf low pump, 80 gpm, 70 f t head. 3 hp
Drum mixer and drum t r a n s f e r pump, 150 g a l l o n s t a i n l e s s s t e e l mix tank. 1/4 hp ag i ta to r , diaphragm feed pump. s t a i n l e s s s t e e l i n t e m a l s . 1/3 hp
Acid s torage tank, 150 g a l l o n FRF' diaphragm feed pump, Carpenter 20 in te rna ls . 1/3 hp. e l e c t r o n i c s t r o k e adjustment. 4-20 m i l l iamp input. 500 g a l l o n FRF' mix tank, 1/2 hp a g i t a t o r
S ing le -ce l l dual media f i l t e r s . 7-fOOt diameter automat ic backwash, f i l t e r media inc luded (2 u n i t s )
30 - foo t diameter. 10-foot s idewal l , sludge rake and motor included. s t a i n l e s s s t e e l diaphragm underf low pump, 40 gpm (1 operating, 1 spare)
Rotary vacuum f i l t e r , 6 - foo t diameter, 6 - foo t face, 113 sq ft, vacuum pump, rece iver . and f i l t r a t e pump inc luded
50 f t conveyer, 18-inch b e l t width, inc ludes t r u s s and frame. pu l leys . d r ive , i d l e r s . l oad ing hopper. and d ischarge hood
E-18
Table E-16
PHYSICAL/CHEMICAL TREATMENT - 250 GPM (equipment purchase and i n s t a l l a t i o n c o s t s ) -
Lime Storage System Lime Slaker Lime S l u r r y Mix System Lime S l u r r y Feed Pump Raw Wastewater Pump Polymer Feed System F lash Mix System C l a r i f i e r C l a r i f i e r Underflow Pump pH Adjustment System G r a v i t y F i l t e r G r a v i t y Thickener Thickener Underflow Pump Rotary Vacuum F i l t e r B e l t Conveyer I n s t r u m e n t a t i o n
'45 percent o f purchase c o s t s f o r p ip ing, foundations, e l e c t r i c a l . and insu la - t i o n . pa in t , and cleanup.
'25 percent o f d i r e c t process c o s t s f o r b u i l d i n g s , s to rage f a c i l i t i e s , u t i l i t i e s and o f f - s i t e p ip ing.
E-19
Table E-17
PHYSICAL/CHEMICAL TREATMENT - 500 GPM ( d e t a i l e d equipment l i s t )
Item Lime Storage System
Raw Wastewater Pumps
React ion Tank
C l a r i f i e r System
Polymer Feed System
pH Adjustment System
G r a v i t y F i l t e r System
Thickener System
Vacuum F i l t e r System
B e l t Conveyer
D e s c r i p t i o n
Storage s i l o , 8000 c u b i c f e e t ( w i t h ladder, s l i d e gate, b rac ing f o r d u s t c o l l e c t o r ) . 8- foot b i n a c t i v a t o r . 2- i nch screw feeder
Dust c o l l e c t o r . 486 sq ft. 3 hp blower
L i r e s laker . 2000 l b / h r r g r i t remover inc luded
Bol ted epoxy- l ined carbon s t e e l mix tank. 14,000 gal lons, 10 hp a g i t a t o r
S t a i n l e s s s t e e l c e n t r i f u g a l , 40 gpm. 75 ft head. 3 hp. TEFC motor (1 operat ing, 1 spare)
Cen t r i f uga l , 500 gpm, 50 f t head, 15 hp. TEFC motor (1 operat ing. 1 spare)
Bol ted epoxy-l ined carbon s t e e l tank. 3750 gal lons. 3-1/2 hp a g i t a t o r
1000 sq ft, 10- foot s idewa l l c l a r i f i e r , s t a i n l e s s s t e e l c e n t r i f u g a l underf low pump, 160 gpm, 85 f t head, 3 hp
Drum mixe r and drum t r a n s f e r pump, 250 g a l l o n s t a i n l e s s s t e e l mix tank, 1/2 hp a g i t a t o r , diaphragm feed pump. s t a i n l e s s s t e e l i n t e m a l s , 1/3 hp
Acid s torage tank, 250 g a l l o n FRP diaphragm feed pump, Carpenter 20 in te rna ls , 1/3 hp, e l e c t r o n i c s t r o k e adjustment. 4-20 m i l l i a m p input. 1000 g a l l o n FRP mix tank, 1 hp a g i t a t o r
S ing le -ce l l dual media f i l t e r s , & f o o t diameter automatic backwash, f i l t e r media inc luded ( 2 u n i t s )
42- foot diameter, 10-foot s idewal l , s ludge rake and motor included, s t a i n l e s s s t e e l diaphragm underf low pump, 75 gpm (1 operat ing, 1 spare)
Rotary vacuum f i l t e r . & f o o t diameter, 10- foot face. 250 sq ft, vacuum pump, receiver , and f i l t r a t e pump inc luded
50 f t conveyer, 18-inch b e l t width. inc ludes t r u s s and frame. pu l l eys , dr ive. i d l e r s , l oad ing hopper, and discharge hood
E-20
Table E-18
PHYSICAL/CHEMICAL TREATMENT - 500 GPM (equipment purchase and i n s t a l l a t i o n c o s t s ) -
Lime Storage System Lime Slaker Lime S l u r r y Mix System Lime S l u r r y Feed Pump Raw Wastewater Pump Polymer Feed System F lash Mix System C l a r i f i e r C l a r i f i e r Underf low Pump pH Adjustment System G r a v i t y F i l t e r G r a v i t y Thickener Thickener Underf low Pump Rotary Vacuum F i l t e r B e l t Conveyer I n s t r u m e n t a t i o n . On-s i te Costs1
TOTAL 8930tOOO - 145 percent o f purchase c o s t s f o r p ip ing. foundations. e l e c t r i c a l , and insu la - t i o n . pa in t . and cleanup.
225 percent o f d i r e c t process c o s t s for bu i ld ings , s to rage f a c i l i t i e s , u t i l i t i e s and o f f - s i t e p i p i n g .
E - 2 1
Table E-19
PROCEDURE FOR DETEFMINING LANDFILL COSTS
These procedures can be used t o e s t i m a t e t h e c o s t s o f below-grade, d iked l a n d f i l l s . l a n d f i l l s o r l a n d f i l l s having double f l e x i b l e membrane l i n e r systems.
F o r g iven l a n d f i l l geometries, severa l t e x t s p r o v i d e standard formulas t o c a l c u l a t e t h e p h y s i c a l parameters needed f o r c o s t es t imat ion . Two o f these are:
Kayes, W.B., C a o s t r u c t i o n o f L i n i n g s f o r Ressmoirs . Tanks. and P o l l u t i o n C o n t r d F a c i l i t i a s d L i h y , 1977, 329 pp.
Radian Corporation, Treatment Costs f o r Gas-side Washes a t Steam E l e c t r i c Power Plants , EPA C o n t r a c t No. 68-01-5163, November 1981.
The methodology g iven below can be used t o c o s t e i t h e r c l a y - l i n e d
The design s p e c i f i c a t i o n f o r use of these formula inc lude:
waste volume, cub ic yards w a l l s l o p e berm width, f t waste depth, f t t h i c k n e s s o f s o i l l i n i n g s and caps. f t
The parameters needed f o r c o s t e s t i m a t i o n inc lude:
excavat ion volume (volume o f e a r t h excavated below grade), cub ic f e e t b a c k f i l l volume (volume o f e a r t h r e q u i r e d f o r d ikes) , cub ic f e e t l i n i n g areas (sur face area for f l e x i b l e membrane l i n e r s ) , square f e e t l i n i n g volumes (volumes f o r s o i l l i n e r s o f s p e c i f i e d th ickness) , c u b i c yards s i t e p r e p a r a t i o n area ( a r e a of impoundment, i n c l u d i n g d ikes) . acres
A step-by-step procedure f o r determin ing l a n d f i l l c o s t s from these data i s presented below.
INSTALLED = + A2 t A3 t A4 + A5 t Ag t A7 t A8 t Ag t A10 + A 1 1
= Land Cost = $5,00O/acre X s i t e p r e p a r a t i o n area
A2 = Cleaning and Grubbing = $264/acre X s i t e p r e p a r a t i o n area
A3 = On-s i te Excavat ion = $2.2O/cu yd X excavat ion volume
= R o l l i n g Area = $0.53/sq yd X s i t e p r e p a r a t i o n area
Ag = s o i l S t e r i l i z a t i o n = $o.OZ/sq f t x s i t e p repara t ion area
A6 = D ike PlacementKompaction = $1.38/cu yd X b a c k f i l l volume
E-22
Table E-19 (cont inued)
PROCEDURE FOR DETEFNINING LANDFILL COSTS
A, = L i n e r System - sum o f requi red l i n e r l a y e r s and leacha te c o l l e c t i o n F l e x i b l e Membrane L ine rs :
FML ( i n s t a l l e d ) = $0.50/sq ft X l i n e r area
Clay L i n e r s ( 3 f t laye rs ) :
L o c a l l y A v a i l a b l e ( i n s t a l l e d ) = $0.60/sq f t X l i n e r area $ l l O / t o n D e l i v e r e d Clay ( i n s t a l l e d ) = $1.26/sq f t X l i n e r area $15D/ton De l i ve red Clay ( i n s t a l l e d ) = $1.50/sq ft X l i n e r area $20D/ton D e l i v e r e d Clay ( i n s t a l l e d ) = $1.8O/sq f t X l i n e r area
Leachate C o l l e c t i o n - sum of c o s t s f o r g r a n u l a r mater ia l , p ip ing, ho ld ing
sump, r e t u r n pump, and i n s t a l l a t i o n
M a t e r i a l Cost $4.DO/cu yd Hau l i ng $2.OO/cu yd I n s t a l l a t i o n
T o t a l $9.OO/cu yd
Granular Ma te r ia l , c u b i c yards = t o t a l volume o f c o l l e c t i o n l a y e r s
P i p i n g and I n s t a l l a t i o n = $3.00/ft X 1200 f t / a c r e X s i t e p repara t i on area
Hold ing Sump and Return Pump = $4,500
Ag = Cap System - sum f o r requi red l i n e r l a y e r s and leacha te c o l l e c t i o n Topso i l = $8.OO/cubic yard X l i n e r volume
( o t h e r l i n e r c o s t s and leacha te c o l l e c t i o n c o s t s a r e t h e same as those
l i s t e d for t h e l i n e r system; see A7)
A9 = Groundwater Mon i to r i ng ( o p t i o n a l ) - sum o f w e l l i n s t a l l a t i o n c o s t and c o s t of sampling pump and generator
Number o f w e l l s = (1/50 acres X s i t e p repara t i on area) + 5 Cost = $ 3 2 / f t X w e l l depth X number o f w e l l s Sampling Pump and Generator = $1.700
A10 = Fencing: M a t e r i a l = $ 8 . l l / f t X d iked p e r i m t e r + $400 Gates = $ 3 7 / f t X se lected ga te s i z e Sign = $28/sign X number o f s igns requi red
All = Roads Clear ing/Grubbing = $1.69/ f t X road l e n g t h R o l l i ng /P repara t i on = $1.76/f t X road l e n g t h C u l v e r t s = $19075 /cu l ve r t X number o f c u l v e r t s Base M a t e r i a l = $6.46/f t X road l e n g t h Wear M a t e r i a l = $2.01/f t X road l e n g t h Grading/Cleanup = $0.66/f t X road l e n g t h