Manual for pH Determination Version 1.0: Determination of the pH of sea water using the indicator dye m-cresol purple This SOP was adapted from Dickson et al (2007, SOP 6b) for use with the GOA-ON in a Box equipment (list is available here on GOA-ON website). More information about GOA-ON in a Box efforts and related SOPs referenced below are available on the GOA-ON website under Resources. “GOA-ON in a Box” is the name used to describe equipment being provided through an international scientific capacity building effort being conducted to support the Global Ocean Acidification Observing Network. 1. Overview This procedure describes a method for the spectrophotometric determination of the pH of sea water on the total hydrogen ion concentration pH scale. The total hydrogen ion concentration, [H + ], is expressed as moles per kilogram of sea water. This SOP was adapted from Dickson et al (2007, SOP 6b). Sections 2 and 3 give a summary of the principles of spectrophotometric measurement of pH Sections 4 to 9 give details of the method and the calculations Section 10 provides information on quality assurance Appendix 1 describes the Excel sheet template used for calculating pH from the absorbance data Appendix 2 contains instructions on using the AquaMate TM700, the spectrophotometer provided as part of “GOA-ON in a Box” Appendix 3 is a Quick Guide for the determination of pH using a spectrophotometric method This pH SOP also includes a spreadsheet for the calculation of pH from the measured absorbance values. 2. Definition The total hydrogen ion concentration of sea water includes the contribution of the medium ion sulfate and is defined as [H + ] = [H + ] F (1+S T / S )
Transcript
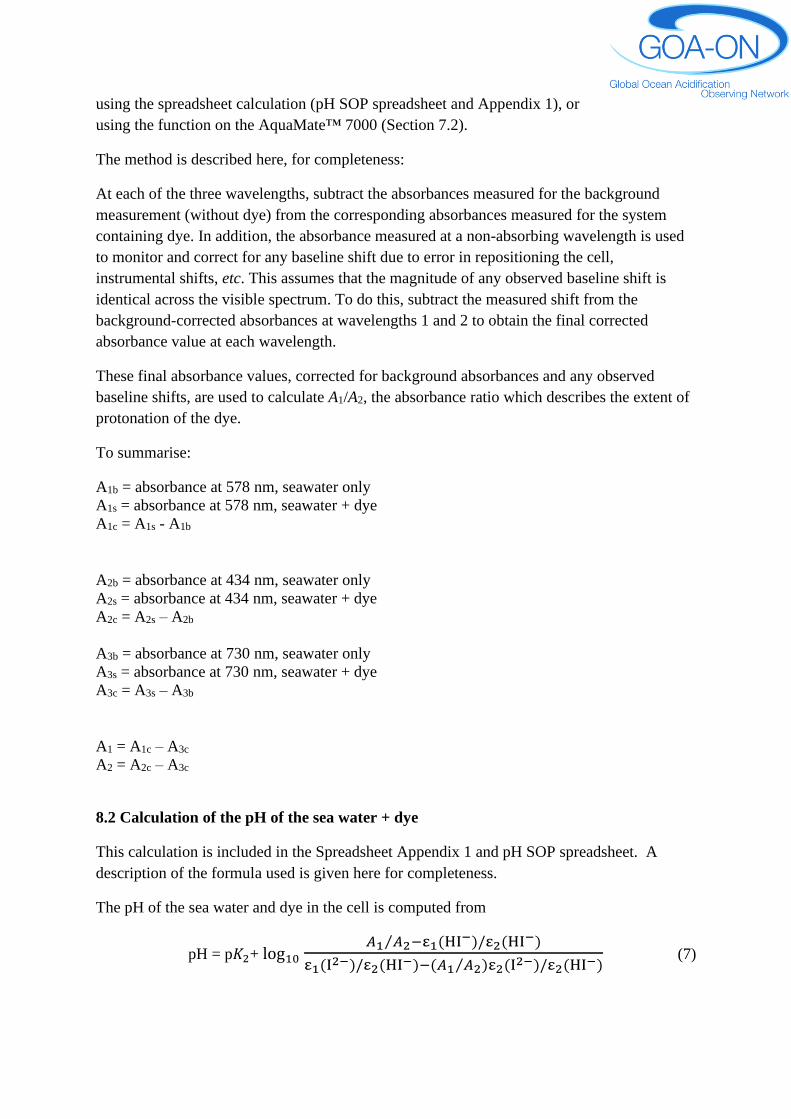
Manual for pH Determination Version 1.0:
Determination of the pH of sea water using the indicator dye m-cresol
purple
This SOP was adapted from Dickson et al (2007, SOP 6b) for use with the GOA-ON in a Box
equipment (list is available here on GOA-ON website). More information about GOA-ON in
a Box efforts and related SOPs referenced below are available on the GOA-ON website under
Resources.
“GOA-ON in a Box” is the name used to describe equipment being provided through an
international scientific capacity building effort being conducted to support the Global Ocean
Acidification Observing Network.
1. Overview
This procedure describes a method for the spectrophotometric determination of the pH of sea
water on the total hydrogen ion concentration pH scale. The total hydrogen ion concentration,
[H+], is expressed as moles per kilogram of sea water.
This SOP was adapted from Dickson et al (2007, SOP 6b).
Sections 2 and 3 give a summary of the principles of spectrophotometric measurement of pH
Sections 4 to 9 give details of the method and the calculations
Section 10 provides information on quality assurance
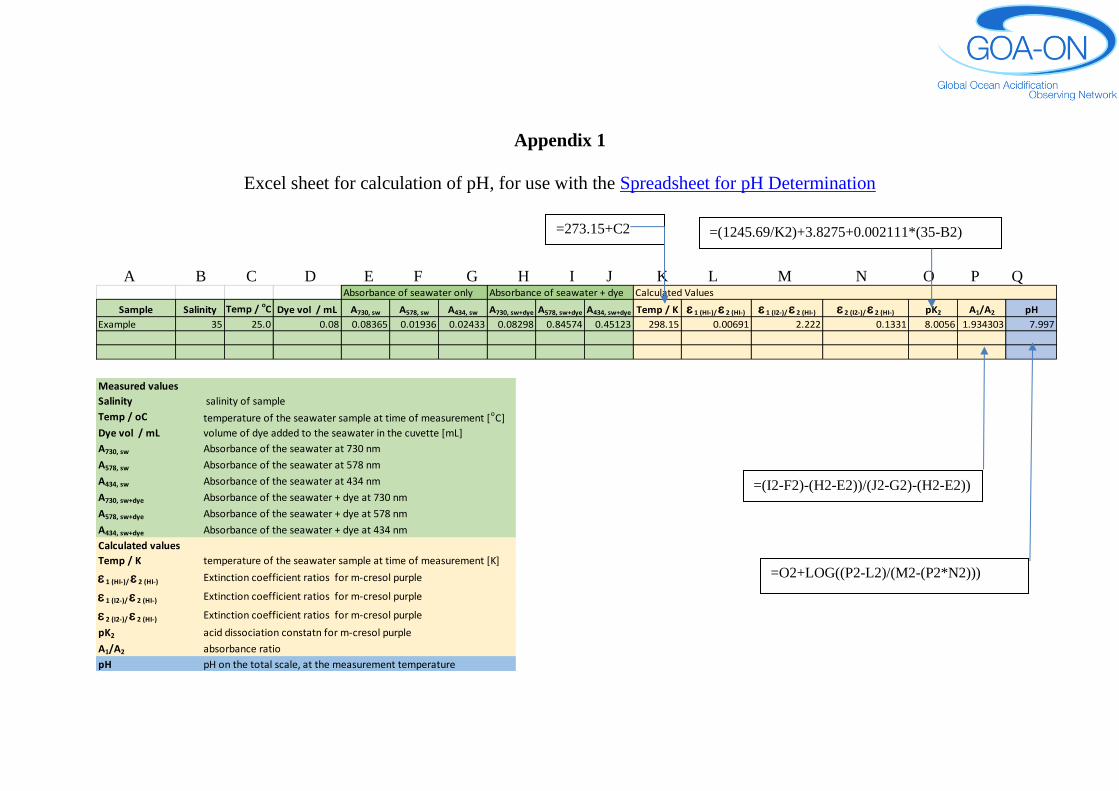
Appendix 1 describes the Excel sheet template used for calculating pH from the absorbance
data
Appendix 2 contains instructions on using the AquaMate TM700, the spectrophotometer
provided as part of “GOA-ON in a Box”
Appendix 3 is a Quick Guide for the determination of pH using a spectrophotometric method
This pH SOP also includes a spreadsheet for the calculation of pH from the measured
absorbance values.
2. Definition
The total hydrogen ion concentration of sea water includes the contribution of the medium
These instructions will help to set up the AquaMate™ 7000 spectrophotometer to measure the absorbance at the three different wavelengths required for the
measurement of pH in seawater using m-crsesol purple. For a full description of the operation of the AquaMate™ 7000, refer to the manual, available at
Use carousel Position 2, The three-position carousel has one adjustable 13 to 25 mm round vial holder in position B, one 10 mm square vial holder in position 2
and one 20 to 50 mm (long path) rectangular vial holder in position 4.
Use the Sample Positioner command on the menu to select Sample position 2.
Set up a Method for measuring the absorbance at three
wavelengths
1. Press the test key to access the Test Types menu.
2. Press the ▲or ▼ key to highlight Multiwavelength and
3. Highlight and change the displayed test parameters, including Test Name, Measurement Mode and Sample Positioner.
Test Name – give your method a name, for example sw pH
Measurement Mode – Absorbance
Sample Positioner – Auto2
4. Press the Set nms function key to add the wavelengths
Press the Add nm function key, use the numeric keypad to enter the wavelength value and press the enter key.
For m-cresol purple, use the three wavelengths 434nm, 578 nm and 730 nm
5. Press the Run Test function key.
Recalling an Existing Multiwavelength Method
1. Press the test key to access the Test Types menu.
2. Press the ▲or ▼ key to highlight Multiwavelength and press the enter key.
3. To recall an existing multiwavelength method, press the Stored Tests function key.
4. Press the ▲or ▼ key to highlight Load internal test or Load test from USB drive and press the enter key.
5. Press the ▲or ▼ key to highlight the desired test and press the enter key.
Taking Measurements with Multiwavelength Method
Once the parameters have been set for the multiwavelength test:
1. Press the Run Test function key.
2. Prepare the sample, first the seawater only (blank), secondly the seawater+dye.
3. Measure the absorbances:
• Place the cuvette containing the seawater into position 2 on the vial holder carousel and press the Measure Blank function key. Once the blank has been
measured, remove it from the carousel.
• Add the dye then place the cuvette containing the seawater + dye into position 2 on the vial holder carousel and press the Measure Sample function
key.
• Repeat for each sample.
5. When all of the samples have been measured, press the Save Data function key and follow the onscreen prompts to save the sample measurements to the
USB memory stick.
It is a good idea to also record the absorbance values in your notebook.
Using the pH SOP Spreadsheet
Note that the pH SOP Spreadsheet is set up for separate entry of the absorbance of the seawater only, and seawater +dye. The
spreadsheet will need to be edited if using this method.
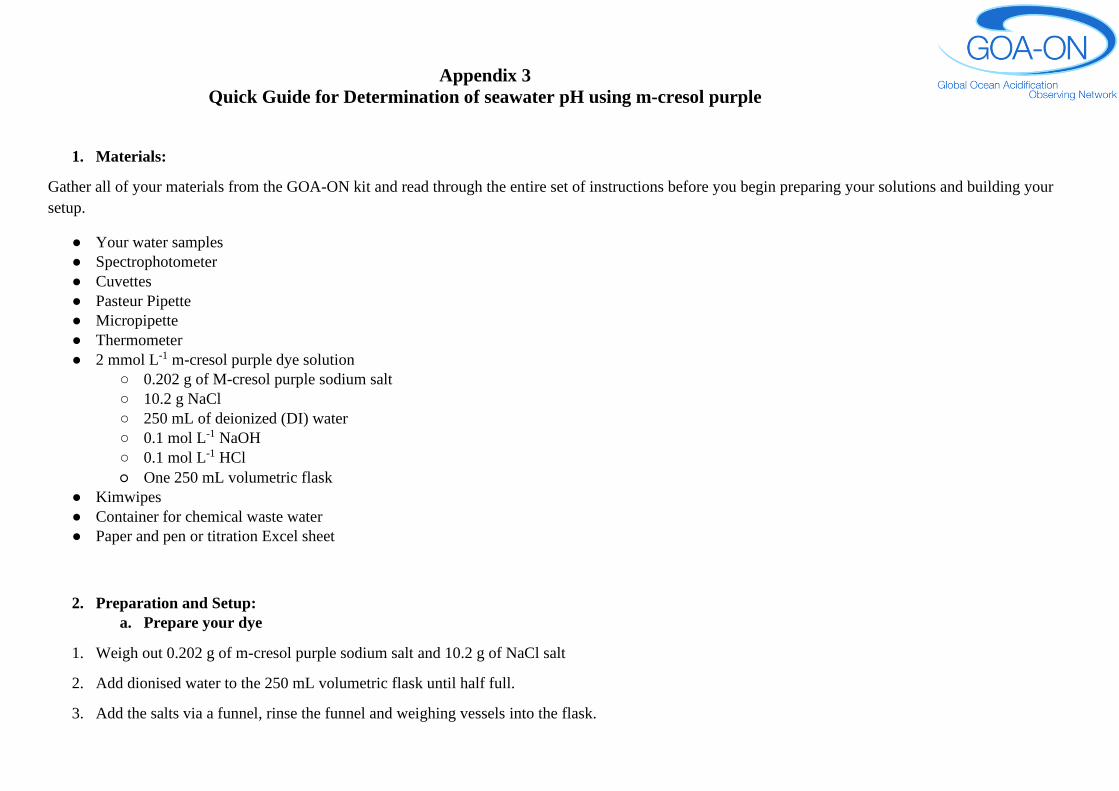
Appendix 3
Quick Guide for Determination of seawater pH using m-cresol purple
1. Materials:
Gather all of your materials from the GOA-ON kit and read through the entire set of instructions before you begin preparing your solutions and building your
setup.
● Your water samples
● Spectrophotometer
● Cuvettes
● Pasteur Pipette
● Micropipette
● Thermometer
● 2 mmol L-1 m-cresol purple dye solution
○ 0.202 g of M-cresol purple sodium salt
○ 10.2 g NaCl
○ 250 mL of deionized (DI) water
○ 0.1 mol L-1 NaOH
○ 0.1 mol L-1 HCl
○ One 250 mL volumetric flask ● Kimwipes
● Container for chemical waste water
● Paper and pen or titration Excel sheet
2. Preparation and Setup:
a. Prepare your dye
1. Weigh out 0.202 g of m-cresol purple sodium salt and 10.2 g of NaCl salt
2. Add dionised water to the 250 mL volumetric flask until half full.
3. Add the salts via a funnel, rinse the funnel and weighing vessels into the flask.
4. Dissolve the salts completely.
5. Carefully fill the flask to the fill line with DI water to make 250 mL of dye.
6. Measure the pH of the dye with an electrode. Adjust until the pH is between 7.8 and 8.0
a. If the pH of the dye solution is less than 7.8, add 0.1 mol L-1 NaOH solution dropwise until the pH increases to 7.9±0.1
b. If the pH of the dye solution is greater than 8.0, add 0.1 mol L-1 HCl solution dropwise until the pH increases to 7.9±0.1
7. Transfer to a screw cap glass bottle and seal. This dye solution should last for several months, but check the pH before each use, and adjust if necessary.
b. Bring the samples to the lab temperature
Leave the samples, the cuvettes and the dye at lab temperature for a few hours.
c. Set up spectrophotometer
1. Turn the power onto the spectrophotometer
2. Load the multi -wavelength method if using
3. Orientate the turret so that the square cuvette holder is in the light path
3. Perform the Measurement
Remember that the sample contains mercuric chloride. Wear gloves
1. Fill the cuvette with sample using a Pasteur pipette. Ensure that there are no bubbles in the cuvette, no drops on the outside of the cuvette and no
smudges or scratches
2. Place in the sample holder in the Spectrophotometer
3. Measure the absorbance at 730 nm, 578 nm, and 434 nm and record the values
4. Remove the cuvette from the Spec. then add 40 L of dye solution (for 2.5 mL cuvette, check Table 1 for the dye volume needed for different sized
cuvettes. Mix carefully. Wipe off any drops on the outside of the cuvette, avoiding smudges on the optical surface.
5. Place in the sample holder in the Spectrophotometer, in the same orientation as in Step 2.
6. Measure the absorbance at 730 nm, 578 nm, and 434 nm and record the values
7. Measure the temperature of the solution.
8. Discard the solution
4. Calculate the pH
Enter the data into the pH SOP Spreadsheet, in the green cells. The spreadsheet is set up assuming that the absorbance of the seawater, and the absorbance of
the seawater+dye are recorded separately. If the blank correction is done automatically then the spreadsheet will need to be adjusted accordingly.
The yellow and blue cells will calculate, giving the pH value in the blue column.