ANNUAL MANUFACTURING REPORT 2016 In association with Sponsored by FINANCE & INVESTMENT ECONOMY, POLICY & GROWTH AUTOMATION & PRODUCTIVITY 2015 2008 TRAINING & SKILLS INFORMATION & COMMUNICATIONS TECHNOLOGY (ICT) £ SERVITIZATION
Transcript
ANNUALMANUFACTURINGREPORT 2016
In association with Sponsored by
FINANCE & INVESTMENT
ECONOMY, POLICY
& GROWTH
AUTOMATION & PRODUCTIVITY
20152008
TRAINING & SKILLS
INFORMATION & COMMUNICATIONS
TECHNOLOGY (ICT)
£
SERVITIZATION
www.themanufacturer.com | September 2015 | Vol 18 Issue 7
HOT TOPICSlave to fashion Can UK fashion houses compete with overseas labour markets?
OUT & ABOUTA simulating experience Enter a new world of testing for UK automotive
OPINIONA parting note one of UK manufacturing’s top names looks at the state of the industry before he retires this month
WORKFORCE & SKILLSTake another look How women engineers are taking a stand through social media
MANUFACTURING SERVICESWhen less is far more How much service is too much service?
INTERVIEWMark Elborne, CEO, GE UK & Ireland
In partnership with:
Can UK manufacturers meet the demand of an ageing rail network?
In association with:Membership
The digital edition of The Manufacturer magazine UK
The Manufacturer magazine UK
The weekly e–newsletter with the latest UK manufacturing news
50% discount at The Manufacturer’s Leaders Conference
Membership of The Manfacturing Co–Operative
From £295
Other packages available please see website for details.
Matching the specialist skills of small UK manufacturing businesses with the needs of Original Equipment Manufacturers to deliver innovative supply chain solutions.
Matching the specialist skills of small UK manufacturing businesses with the needs of Original Equipment Manufacturers to deliver innovative supply chain solutions. The Manufacturing Co-operative is committed to helping UK manufacturers increase exports and drive economic growth. It works in partnership with SME members to match their specialist engineering skills with the needs of OEMs.
It’s collaborative approach proactively encourages members to work together and share best practice and experience, to strengthen resources and make it easier for world-class OEMs to source products and services from UK SMEs.
themanufacturer.com/sign-up-subscribe
www.manufacturing.coop
Gold or platinum packages give you automatic membership to:
Head office: Elizabeth House, Block 2, Part 5th Floor, 39 York Road, London, SE1 7NQ
T: +44 (0)20 7401 6033 www.hennikgroup.com
£
ANNUALMANUFACTURINGREPORT 2016
MANUFACTURINGREPORT2016ANNUAL
FOREWORD
By Callum Bentley Editor, The Manufacturer
Our annual survey of manufacturers attracted responses from across a vast range of manufacturing activities including the UK’s leading areas of automotive and aerospace, through to furniture and steel.
The resilience of Britain’s manufacturers in the face of unending challenges seems to put into action the phrase: when life gives you lemons, make lemonade. Eurozone countries still struggling? China’s economy slowing down? Look elsewhere in SE Asia and beyond. If sanctions close the door to Russia, look to the growing markets in Latin America. If the currency is moving against you, move upmarket and add value.
It would be Polyanna-ish to claim that everything in the garden is completely rosy, however. We have seen an overall downturn in manufacturing in the UK, led by the steel sector, which is reported to have shrunk by nine per cent. The fall in energy prices has led to a decline in activity in the North Sea. The strength of Sterling makes for tough competition in international markets and has had an effect in the domestic sphere as well. Nonetheless, UK exports of higher added-value products has remained strong.
Political uncertainty was largely ended by the result of this year’s General Election. Investment in automation and information and communications technology is at historically high levels and likely to continue that way. Vacancies seem to remain generally plentiful.
Once again, the greatest and most widely-shared concerns are about skills.
To put it bluntly, our education system is failing our youngsters and, consequently, creating problems for industry. Kids coming out of schools and Further Education colleges at 16 and 18 are reported to be poorly prepared for work. This isn’t about their skills levels; no-one reasonably expects that a fresh-faced youngster will have the skills and experience of a veteran. It is about basic work preparedness and it has been going on for decades. The longer it continues the more it will compromise our competitiveness.
The gap in understanding between schools and workplaces must be bridged, for the sake of our manufacturing base and for our people themselves.
Our sincere thanks to everyone who participated in the survey and to our sponsors for their support.
MANUFACTURINGANNUAL
REPORT2016
Welcome to the Annual Manufacturing Report 2016.
FOREWORD
MANUFACTURINGREPORT2016ANNUAL
EXECUTIVE SUMMARY
UK Manufacturers are facing tougher conditions, once again. The pound has strengthened against the euro, and the global collapse in demand for steel has led to closures, retrenchment and significant downsizing in the industry in this country. The steel sector on its own has shrunk by around nine per cent and this has led to a bit of a fallback in the manufacturing sector as a whole. The UK government cannot, on its own, take action to address and rebuff dumping; that has to be a matter for international co-operation.
Despite all these challenges, the majority of respondents to our survey are optimistic about the future. Indeed, this year’s report found the second-highest level of optimism recorded in its nine year history. The majority believe that the government is managing the overall economy fairly well, although confidence in the management of manufacturing in particular is not quite so high. The final verdict on strategies such as the Northern Powerhouse has yet to be delivered.
The perception or belief that other countries support their manufacturing more than the UK does is not so widely held as previously. A big majority said that development of international trade is and will continue to be of significant importance for their businesses. The performance of UKTI is rated pretty highly by those who have contact with them.
Ruari McCallion Analyst, Hennik Research
New product development, improved sales and customer relationship management are the key business focuses for this year and looking forward into 2016.
The big blot on the horizon, as far as UK manufacturing is concerned, is to be found in the area of skills – more particularly, the preparedness for work of youngsters leaving full-time education and taking up their first job at ages 16 and 18. Whether they come straight from school or from Further Education College, the findings are broadly in line: they are poorly, or very poorly, prepared for the world of work.
This is not clichéd criticism of the youngsters themselves; it is a strong indictment of the education system. Manufacturers are prepared to invest in our youngsters, by taking them on and committing to training, apprenticeships and upskilling.
The main focuses of finance and investment are on cost control and improving cash flow, which has returned to the top of the table this year. The bulk of investment appears to be strategic, which is for the longer term, and this is born out by the expectations of ROI (return on investment). Product development is frequently mentioned as a priority.
We found a large majority of respondents have undertaken an investment in automation in the past five years. The
main focuses are to improve business efficiency generally, cut cycle time and boost quality, followed by new product introduction, a trend being found across the board. The primary expectation of automation vendors is that they should provide good technical support.
This year’s Annual Manufacturing Report includes a new section on Servitization. This term, along with others such as “full service manufacturing”, has been enjoying a rising profile and so we believe the time is right to ask about it. Activities that could fall under its heading are currently in the minority but awareness does seem to be growing, led by customer support agreements. We will probably get a clearer picture next year.
Investment in ICT is an area that has developed the habit of underpromising and overdelivering. The last few years have seen plans for the following year’s investment in ICT set at levels lower than have actually been the case. The field this year is led by ERP systems, followed by the upgrading of existing IT infrastructure – last year’s leader – and MES (Manufacturing Execution Systems).
We also asked about the relatively new subject of IoT (Internet of Things), which is another area we expect will gain in importance as time goes on. For the moment, progress appears to be evolutionary, rather than revolutionary.
Welcome to the Annual Manufacturing Report 2016, sponsored by Columbus, The Automation Advisory Board Thought Leadership Network, The Manufacturing Services Thought Leadership Network, Hennik Recruitment, Dell and Intel, and Barclay’s Bank. The survey on which it is based was conducted during August and September 2015.
EXECUTIVE SUMMARY
MANUFACTURINGREPORT2016ANNUAL
ECONOMY, POLICY & GROWTH MANUFACTURINGANNUAL
REPORT2016
MANUFACTURINGREPORT2016ANNUAL
ECONOMY, POLICY & GROWTH
ECONOMYPOLICY & GROWTH
Responses for the survey were gathered after the General Election but before the announcements of closures and major retrenchments in the steel industry. However, the problems were already surfacing in that sector throughout the year and had fed into the supply chain, so they did not come as a complete surprise. UK’s manufacturers remain optimistic, overall, and believe that the government’s economic policy is broadly headed in the right direction – even if they are somewhat less enthusiastic when it comes to the manufacturing sector in particular.
The huge fall in oil prices is feeding through in the form of much lower energy prices. However, the longer-term effect of lower prices on the North Sea has yet to be fully felt, although exploration companies are definitely feeling the pinch.
Last year, we suggested that lower oil prices could have the effect of slowing the growth of alternative and green energy projects. The government’s termination of subsidies and incentives for onshore wind farms and large-scale solar farms is changing the landscape. Alternative energy will have to make a commercial case while standing on its own two feet.
The General Election removed a great deal of uncertainty and companies can make longer-term plans with a degree of confidence. The Annual Investment Allowance will continue at a reasonably high level and respondents said that innovation and new product development
have been and will continue to be among their main priorities. Policies such as the Northern Powerhouse and Local Enterprise Partnerships are being viewed with cautious optimism – or at least, less cynical pessimism than may have been the case in the past – and public agencies such as UKIF and MAS have received good reports in this year’s report.
The perception that other countries provide more help to their manufacturers than the UK does is not as strongly-held a belief as has been the case in the past.
Overall, respondents to the Annual Manufacturing Report are essentially confident in what the future holds. But there is still a long way to go in making manufacturing look like a good career choice. The gap in understanding between officialdom, politicians and manufacturing employers can sometimes seem to be a chasm. Both sides need to give thought to how they can improve the perception, if we are to attract the brightest and best.
It is with great pride that Columbus supports the 2016 Annual Manufacturing Report. For years Columbus has positioned itself alongside the UK manufacturing sector in an effort to help drive productivity and best practice throughout. Now, by aligning with the 2016 AMR, we can ensure we have our finger on the latest trends from industry to ensure our solutions meet the demands of the evolving UK manufacturing landscape.
Analysis by Ruari McCallionAnalystHennik Research; and
Mary HunterManaging DirectorColumbus
Sponsored by:
MANUFACTURINGREPORT2016ANNUAL
The UK’s manufacturers continue to look to the future with confidence.
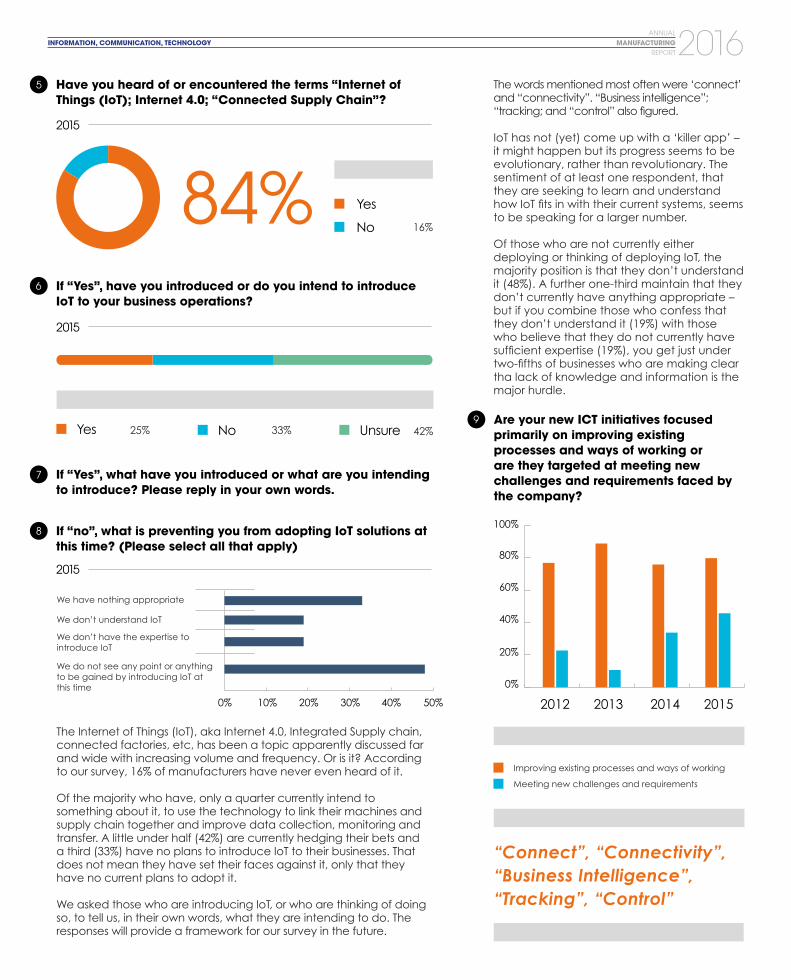
Despite negative reports, a slowdown in manufacturing output over the summer of 2015 and uncertainty in overseas markets – especially China – the mood remains positive. More than 84% of respondents said they were ‘very’ or ‘quite’ optimistic, which is the second-highest figure we have ever recorded. No-one says they are ‘very pessimistic’; a total of just over 15% said they were ‘quite’, which is less than last year’s one in five.
The UK’s economy continues to be among the strongest in the G7 nations and the good news for exporters is that some struggling Eurozone economies, such as Spain, seem to be recovering as well.
How confident are you about the UK economy over the next 12-36 months?
How well do you think the government has been managing the economy as a whole, across the country and all business sectors?
1
2
Very optimistic
Quite pessimistic
Very pessimistic
2015
Quite optimistic71% 14%
15%
0%
100%
75%
50%
25%
0%
2013
2013
2012
2012
2011
2011
2008 2010
2010
2009
2009
3 How well do you think the government is managing the manufacturing sector of the UK economy?
In general, manufacturers believe that the government has been managing the economy reasonably well – less than 12% expressed negative views.
When it comes to manufacturing in particular respondents were less enthusiastic; nearly one-third suggested that there is room for improvement. However, that still leaves a big majority in favour, with nearly 70% giving the thumbs-up (54% moderately well, 12% very well and 4% exceptionally well). That is noticeably up on last year’s vote, when the total of positive votes was 58%.
Exceptionally well Very well
Moderately well Moderately poorly
Very poorly Exceptionally poorly
Exceptionally well Very well
Moderately well Neither well nor poorly
Moderately poorly Very poorly
Exceptionally poorly
ECONOMY, POLICY & GROWTH
80% 100%60%20% 40%0%
2014
2014
2015
2015
2015
2015
70%believe that the economy has been managed reasonably well
100%
80%
60%
20%
40%
0%
2009 2010 2011 2012 2013 2014 2015
MANUFACTURINGREPORT2016ANNUAL
6 What effect do you expect that global influences will have on the UK economy?
To what extent do you expect the government’s declared policies, such as the Northern Powerhouse, and its broader industrial strategy including Local Enterprise Partnerships, for example, will help your business to grow over the next five years?
In your experience do manufacturers in the following countries receive more or less government support than manufacturers in the UK?
ECONOMY, POLICY & GROWTH
4
5
This is the first year that we have asked this question in this form.
The overall response to specific aspects of the government’s economic policy can be summarised as cautious approval. Exactly half of the sample expect that policies such as the Northern Powerhouse will make some difference but fewer than one in 10 (8%) believe that they will help a lot. Less than four per cent expect the effects to be negative and no-one expects them to be harmful – exactly the same number as believe that they are nowhere near enough. That last result is a little strange; whenever manufacturers voice an opinion about government policy it tends to be to ask it to do a great deal more or to get out completely.
Manufacturers continue to maintain that competitors in other countries receive more government help than we in the UK do, and the list continues to be led by Germany (76%) and France (70%). The one that seems to have slipped back a lot is China; 57% of respondents to our survey last year reckoned that Chinese companies got a lot more government help than manufacturers in the UK but that proportion this year is 46%. Italy and India (34%) have overtaken the USA to move into fourth position in the perceived league of recipients of government largesse but only just: 32% of respondents still believe that, for all the talk of free markets and opposition to government interference, American companies get more public support than the British (down from 40%).
Estimates of Russian government support for their companies has fallen significantly, from 30% in 2015 to just 14% a year later. This could be because fewer companies are directly engaged with Russian businesses as a result of the ongoing EU economic boycott. South Africa and Australia are in the same teen-percentage bracket; the proportion of responders identifying the Netherlands, Switzerland, Canada and Spain as particularly advantaged ranged across the 20s – but the country with the highest percentage reckoning that its support wasn’t as good as the UK’s was also Spain, with 24% mentioning it.
The view of the global economic situation has improved since last year, despite the downturn in China’s fortunes: nearly 58% of respondents have either a “quite positive” or “very positive” position. This is a reversal from 2015, when 56% responded that they were “quite negative”.
50%
2015
8%
39%
They will help a lot
They will help a little
They will probably make no difference
They will hinder business prospects
They will be positively harmful to our business
They do not go anywhere near far enough
They will help a little
4%
0%
0%
100%
20%
40%
60%
80%
0%
More Less
Germany
Franc
e
The N
etherla
nds
Italy
Spain
Switz
erland
Canada
USA
Austra
liaBra
zil
Russi
aInd
ia
China
Sout
h Afric
a
Don’t know About the same
2015
6%
42%
0%
Very positive
Quite negative
Very negative
52%Quite positive
MANUFACTURINGREPORT2016ANNUAL
74%
71%
80%
60%
40%
20%
0%
2009 2010 2011 2012 2013 2014 2015
ECONOMY, POLICY & GROWTH
Which (if any) of the following WILL BE key business focuses for your company over the next 12 months? Please answer all that apply
7
8
The overwhelming majority of respondents have done, are doing and intend to continue doing something about waste reduction (80%), improving energy efficiency (69%) and optimising work processes and practices including reducing travelling, introducing home working and other improvements to non-core activities (57%). Areas that have yet to make much impact: ‘greening the supply chain’; adoption of emerging green technologies; carbon trading; and renewable fuels and power sources.
Micro and/or nano-technologies
Exploitation of E-business and web-based opportunities
Improving workplace health and safety
Supply chain integration and partner collaboration
Application of lean management principles
Change management activities in key business areas
Improved customer relationship management and exploitation of sales opportunities
New product development and innovation
2009 2010 2011 2012 2013 2014 2015
Which (if any) of the following HAVE BEEN key business focuses for your company over the past 12 months? Please answer all that apply
100%
80%
60%
40%
20%
0%
The majority of the UK’s manufacturers recognise the value of international markets. Only 14% said it was of no importance.
While the number saying it was of vital importance is high it actually represents a fall from previous years and the number who said it was of secondary importance, so maybe in their thoughts although not at the very front, rose, from 21 to 27%.
9 How significant is developing international trade for the future of your company?
2015
Very important/vital
Very important/vital
Secondary importance
Secondary importance
21%
21%
8%
6%
Of no concern
Of no concern
2014
2013
27%
14%
Secondary importance
Of no concern
60% Very important/vital
This is in line with previous years although green technologies seem, if anything, to be becoming viewed as less pressing. The planning level is around 20% and implementation has fallen from 24-5% in 2011-12.
MANUFACTURINGREPORT2016ANNUAL
ECONOMY, POLICY & GROWTH
Once again, we presented respondents with a list of agencies and asked if they had had contact with them. The “Yes” column was headed by UKTI (UK Trade & Investment), which would seem to indicate interest in boosting business overseas. The total level of response is slightly up on last year, at 65%. Mentions of the Manufacturing Advisory Service (MAS), EEF and Chamber of Commerce all fell back this year, from the mid-50s to 46, 44 and 40%, respectively. In fact, the response rate to every agency declined, with the exceptions of UKTI and UK Export Finance.
Those mentioning interaction with Local Enterprise Partnerships fell from just over 50% to less than 39%. Technology catapults are down, from 24% to 15%; and Innovate UK/Technology Strategy Board from 32% to 25%. The skills shortage makes the decline in interaction with Semta (sector skills agency for Science, Engineering and Manufacturing Technologies Agency) from 17% to 12% appear curious. The Learning and Skills Council also showed a decline but this is less surprising, as it was formally abolished in 2010. Its activities in funding training in Further Education and for manufacturing and engineering were taken over by the Skills Funding Agency. The number reporting experience with the Warwick Manufacturing Group fell by over half, from nearly one in five (19%) to less than one in twelve (8%).
We can only speculate why these falls in interaction with technical and support organisations have occurred; we did not ask for comments.
Three other agencies were also mentioned: the Energy Industries Council; the Welsh Assembly (which has taken over from the Welsh Development Agency – point taken!) and Business Growth Accelerator.
Were these agencies useful to those who accessed their services? The answer is overwhelmingly (but not unanimously): yes. In the case of UKTI and UK Export Finance, the ‘yeas’ outnumbered the ‘nays’ by more than six to one. EEF, Chamber of Commerce and ‘Catapults’ were rated positive by between four and five to one, and Business Growth Fund and CBI by more than three to one. Others still in positive territory but who should maybe review their effectiveness include MAS, with a positive rating below 3:1; and Carbon Trust and Technology Strategy Board/Innovate UK (2:1). It looks like the Local Enterprise Partnerships need to put in some work, as their rating is less than 2:1 in favour and Semta actually fell into negative territory. The Warwick Manufacturing Group broke even.
Has your company had contact with any of the following agencies or organisations? (Mark as many as apply)
How useful did you find your contact with those agencies (please respond for all that apply)?
10
11
2012 2013
2014 2015
100%80%60%40%20%0%
Useful 2012 Useful 2013 Useful 2015Useful 2014
UK Trade & Investment
Manufacturing Advisory Service
EEF
Chambers of Commerce
The Carbon Trust
Innovate UK (Technology Strategy Board)
“Catapults”/Technology Innovation Centres
Local Enterprise Partnerships (previously:Regional Development Agencies
Confederation of British Industry (CBI)
UK Export finance
Business Growth Fund
Learning and Skills Council
Semta
Warwick Manufacturing Group
60% 80%20% 40%0%
UK Trade & Investment
Manufacturing Advisory Service
EEF
Chambers of Commerce
The Carbon Trust
Innovate UK (Technology Strategy Board)
“Catapults”/Technology Innovation Centres
Local Enterprise Partnerships (previously:Regional Development Agencies
Confederation of British Industry (CBI)
UK Export finance
Business Growth Fund
Learning and Skills Council
Semta
Warwick Manufacturing Group
MANUFACTURINGREPORT2016ANNUAL
ECONOMY, POLICY & GROWTH
12 Does bureaucracy, regulation and ‘red tape’ obstruct or influence your business decisions?
21%
0%
51%
17%
19%
13%
33%
56%
10%
2%
14%
39%
44%
4%
Not really
Definitely notYes, a lot/To an extent
50%
47%
3%
0%
Yes, a lot
Yes, that would be a workable idea
Maybe, with the right structure
No, that would not work
Not sure
24%
48%
27%
1%
Yes, definitely – regulations make innovation more trouble
In general, do you think today’s regulatory climate encourages a ‘risk-averse’ approach and frustrates innovation?
Should trade associations have a greater role in helping achieve regulatory compliance, compared with government enforcement?
2013
2015
2014
79%
13
14
50%
50%
10%
10%
20%
20%
30%
30%
40%
40%
0%
0%
Bureaucracy and red tape remains a hindrance but the proportion that answered Q12 in the negative is very noticeably down this year; the 2015 edition reported that 97% found bureaucracy, regulation and red tape to be a hindrance, to a greater or lesser extent. This year, that percentage is down to 79% – still overwhelmingly negative but it is interesting to note that more than one in five (21%) said “not really”.
We slightly amended the wording for Q13, compared with its equivalent last year, in order to elicit more nuanced responses. In last year’s survey, 51% said yes, that they believed that the regulatory climate encourages a ‘risk-averse’ approach. This year, the clearer wording (“Yes, definitely!”) attracted the support of only 14%. The more cautious but still negative “To an extent – if in doubt, don’t!” was selected by between a third and a half (39%). The largest response (44%) was to the suggestion that the regulatory climate is the backdrop, which indicates broad acceptance; possibly grudging but we cannot say for certain. Those most accepting of regulation, the “definitely nots” were very much in the minority.
As the regulatory climate has such an impact on business decisions, would it be a good idea to give trade associations a greater role in compliance?
The idea receives a pretty strong, but tempered welcome: nearly a third of respondents (33%) believe the idea would work and the vast majority of the remainder (56%) think that it could be a runner with the right structure. Less than 10% think it wouldn’t work at all and just a tiny fraction is unsure.
To an extent Not really Definitely not
2015
2015
2014
To an extent – if in doubt, don’t!
Not really – the regulatory climate is the backdrop
Definitely not – regulation ensures everyone is working within the same structure
MANUFACTURINGREPORT2016ANNUAL
ECONOMY, POLICY & GROWTH
15 Do you think enough is being done to make manufacturing an attractive career choice?
0%
39%
Finally in this section, we asked if enough is being done to make manufacturing an attractive career. The answer is clear: No. Not a single respondent is happy with the current situation. More than 60% said that there is not enough good work being done; the remainder (39%) said that there is some good being done but there is a need for more.
We gave respondents an opportunity to expand on their answers in their own words. Some strong opinions were expressed:
“We have a serious skills shortage within the Manufacturing and Engineering Sector.”
“Engineering has been portrayed as a greasy overall wearing profession. The UK still produces the best engineers in the world but not nearly enough of them.”
“Inward investment and support for manufacturing has for too long been a poor relation to the service industries.”
“There are a plethora of initiatives, but no clear enough overall strategy and enough incentive to encourage talented people to pursue a career in engineering/manufacturing.”
“Fundamental lack of industry understanding within academia. Therefore they avoid.”
“Schools still not encouraging careers in manufacturing. Some colleges not providing the real skills required by employers.”
And some suggestions as to how to improve:
“The general perception of manufacturing is 40 years out of date and so is not attractive to a lot of young people. There needs to be more industry and education contact. The Baker/Daring university technical colleges are a good idea.”
“More encouragement given to employers to offer the right raining and career prospects, established learning sources are not in tune with requirements, also it is too difficult to make profit; not enough available to re-invest in our people. We like others do as much training as possible but it is always restricted by insufficient budgets.”
“Manufacturing is becoming more popular as a career but more skilled new people are still needed.”
“We struggle to attract engineering graduates despite paying above market rates in an area of high unemployment. There are simply not enough graduates to meet demand.”
“Too much concentration on functional design and not on how it is to be made and supported through its useful life.”
And the very simple but heartfelt:
Our sincere thanks to all who participated in this part of the survey.
Yes, enough is being done
There is some good work being done but there should be more
No, not enough is being done
65%
59%
32%
41%
3%
2014
2015
2013
62%No, not enough is being done
“Where are the apprentices?”“The Government actions strongly indicate that manufacturing is considered a declining UK activity.”
“The UK should replicate Germany’s appreciation of Engineer qualifications”
MANUFACTURINGREPORT2016ANNUAL
Your businessYour business in 2016
Your business has the potential to grow; whether you’re looking to adopt different business models with servitization, delivering more/better to current customers or you’re embracing new channels to market through eCommerce. Are you ready to compete with new agile competitors who are harnessing the latest technology to grow their business fast? We’ve supported growth with technology and ERP solutions for many years, with many customers. So grab the growth opportunities in UK manufacturing now, before your competition does; let’s talk!
Visit us at...www.columbusglobal.com
Get in touch...01623 72 99 77 @UK_Columbus Columbus A/S
Transform ad_210x260.indd 1 16/11/2015 14:29
MANUFACTURINGREPORT2016ANNUAL
Your businessYour business in 2016
Your business has the potential to grow; whether you’re looking to adopt different business models with servitization, delivering more/better to current customers or you’re embracing new channels to market through eCommerce. Are you ready to compete with new agile competitors who are harnessing the latest technology to grow their business fast? We’ve supported growth with technology and ERP solutions for many years, with many customers. So grab the growth opportunities in UK manufacturing now, before your competition does; let’s talk!
Visit us at...www.columbusglobal.com
Get in touch...01623 72 99 77 @UK_Columbus Columbus A/S
The Automation Advisory Board Thought Leadership Network (AABTLN) is pleased to support the latest edition of the Annual Manufacturing Report. It continues to provide an insight into trends, investment and priorities, both ongoing and projected.
It was gratifying to see the Chancellor recognise the importance of investment in automation, in the form of a continuing Annual Investment Allowance at a reasonably high level. While £200,000 is not as high as the previous level of £500,000, it is still high enough to cover the needs of most manufacturing companies in the UK, the SMEs.
Competition with other countries, both low-cost and advanced, is fierce and automation is key to achieving parity. The UK still has a long way to go in terms of roboticisation; Germany, for example, has around 10 times as many industrial robots as the UK does. The world population of robots has now exceeded 9 million and is being led by the auto industry.Sales of industrial robots reached 229,000 in 2014; 139,300 were bought by companies in Asia. And, as if it didn’t have enough already, Germany was in the top five purchasing countries, with 20,100 new robots bought that year alone – a record high.
Of course, automation is not entirely about robots but their presence in an
industrial economy is an indication of its level of sophistication and competitiveness.
The advancing level of roboticisation and automation in the UK is welcome but the pace has to pushed even more. The reasons given for investment in automation are led by the drive to improve business efficiency, cycle time and quality – all of them aspects of productivity. It is reported that working conditions were improved by automation, as well. Contrary to widespread perceptions, jobs are not generally destroyed by automation – they are preserved or increased, according to our survey, at least.
Satisfaction with automation projects and with suppliers have reached very high levels – over 90%. Expectations appear to be generally managed pretty well and ROI achieved ahead of or on schedule. Engagement and service are the principle characteristics customers look for in their vendors; no-one likes nasty surprises.
It may be early in the process but it does look like UK manufacturers are following a strong evolutionary route, rather than a ‘Great Leap Forward’. Objectives are being clearly defined, measured and managed, and the mix we have in the UK of Lean and automation continues to be a defining characteristic.
Analysis by Adrian SellChairmanThe Automation Advisory Board Thought Leadership Network
Sponsored by:
MANUFACTURINGREPORT2016ANNUAL
AUTOMATION & PRODUCTIVITY
Productivity is a continuing concern for the country as a whole. The UK does not wish to and cannot compete as a low-skill, low-wage economy, which means that automation has to take over the lower added-value functions, as well as those activities that are dirty, difficult, dangerous and those that are mind-numbingly repetitive as well.
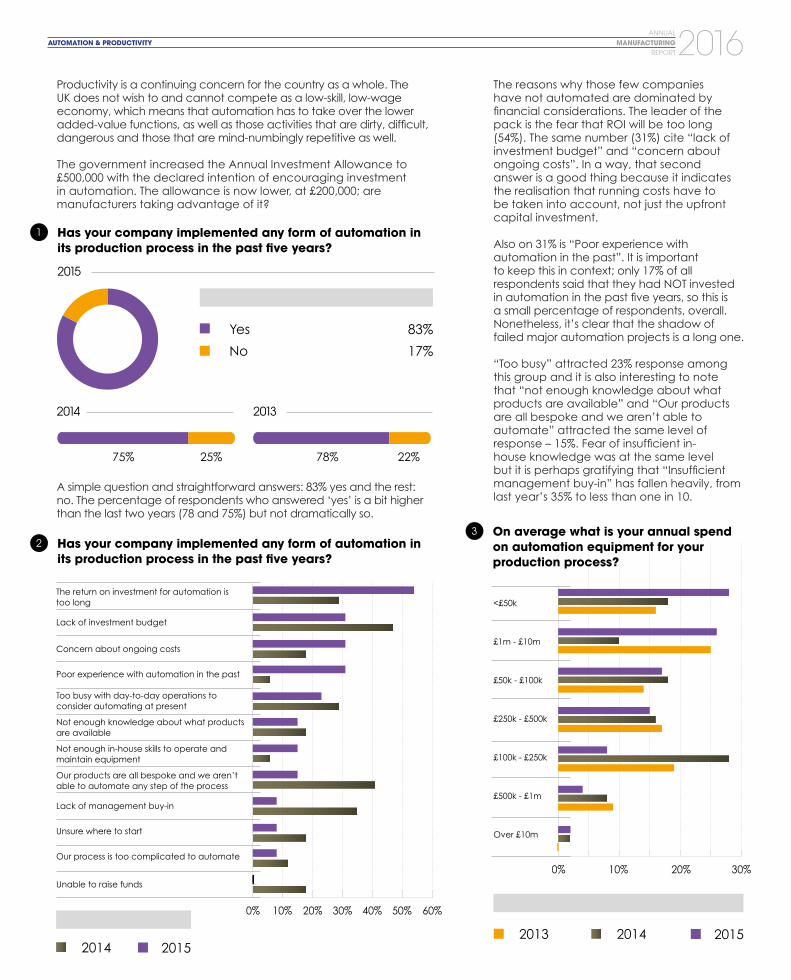
The government increased the Annual Investment Allowance to £500,000 with the declared intention of encouraging investment in automation. The allowance is now lower, at £200,000; are manufacturers taking advantage of it?
A simple question and straightforward answers: 83% yes and the rest: no. The percentage of respondents who answered ‘yes’ is a bit higher than the last two years (78 and 75%) but not dramatically so.
The reasons why those few companies have not automated are dominated by financial considerations. The leader of the pack is the fear that ROI will be too long (54%). The same number (31%) cite “lack of investment budget” and “concern about ongoing costs”. In a way, that second answer is a good thing because it indicates the realisation that running costs have to be taken into account, not just the upfront capital investment.
Also on 31% is “Poor experience with automation in the past”. It is important to keep this in context; only 17% of all respondents said that they had NOT invested in automation in the past five years, so this is a small percentage of respondents, overall. Nonetheless, it’s clear that the shadow of failed major automation projects is a long one.
“Too busy” attracted 23% response among this group and it is also interesting to note that “not enough knowledge about what products are available” and “Our products are all bespoke and we aren’t able to automate” attracted the same level of response – 15%. Fear of insufficient in-house knowledge was at the same level but it is perhaps gratifying that “Insufficient management buy-in” has fallen heavily, from last year’s 35% to less than one in 10.
1
23
Has your company implemented any form of automation in its production process in the past five years?
Has your company implemented any form of automation in its production process in the past five years?
On average what is your annual spend on automation equipment for your production process?
The return on investment for automation is too long
Lack of investment budget
Concern about ongoing costs
Poor experience with automation in the past
Too busy with day-to-day operations to consider automating at present
Not enough knowledge about what products are available
Not enough in-house skills to operate and maintain equipment
Our products are all bespoke and we aren’t able to automate any step of the process
Lack of management buy-in
Unsure where to start
Our process is too complicated to automate
Unable to raise funds
Yes
No
83%
17%
2015
20132014
78%75% 22%25%
0%
0%
10%
10%
20%
20%
30%
30%
40% 50% 60%
201420142013
20152015
<£50k
£1m - £10m
£50k - £100k
£250k - £500k
£100k - £250k
£500k - £1m
Over £10m
MANUFACTURINGREPORT2016ANNUAL
AUTOMATION & PRODUCTIVITY
The UK Government boosted the Annual Investment Allowance (AIA) for plant and machinery up to £500,000 a year for the period 1 April 2014 to 31 December 2015, when it will be reduced to £200,000/yr.
Did the higher allowance encourage businesses to invest in equipment and processes that would help them to be more productive? The answer is mixed but appears to be “yes” – at the lower end, at least. We have seen a significant rise in expenditure on automation for production processes in the range up to £50,000; 28% said they were spending in this bracket, compared to 18% last year and slightly less the year before (see Q3 graph).
Those spending £50-£100k, £250-£500k and £1-£10 million have held pretty steady while the middle of the ‘AIA range’ (£100-£250k) has fallen back, really rather a lot – from 28% last year to just 8% in this survey.
Around one-third expect to spend more on automation in the coming 12 months and just under half think they will spend about the same. The proportion who think they will spend less has fallen notably, from 18% last year to just 13% now. We offered “don’t know” for the first time this year and 9% took that option.
A little under half of respondents said that they are in the process of implementing a major project and 21% said that they last did so in 2014. This means that just under two-thirds of UK manufacturing businesses committed to major automation projects in the past two years.
In terms of cost, the spread in this year’s survey is broadly similar to last year’s, with some internal variations. Projects costing £100-£250,000 are down by half (from 16% to 8%) but those over £250,000 are up, from 50% of all respondents to 55%. Six per cent are still ongoing.
64
5
Roughly how much did that project cost?Are you planning on spending more, less or the same next year as you did this year?
When did you last implement a major automation project at your company? (A major project being large relative to the scale of your business)
More
Less
Same
Don’t know
32%
13%
45%
9%
36%
18%
46%
25%
33%
42%
2015
20142013 2015
<£50k
£50k - £100k
£100k - £250k
£250k - £500k
£500k - £1m
Over £1m
Still going
20132014
In 2014
In 2011
In 2013
In 2010
In 2012
Prior to 2010
We are implementing a major project in 2015
We have never implemented a major automation project
20142015
43%
21%
8%
6%
4%
2%
8%
9%
64%
16%
8%
4%
8%
35%0% 10% 20% 30%
MANUFACTURINGREPORT2016ANNUAL
AUTOMATION & PRODUCTIVITY
7 What payback period (ROI) did you forecast/budget?
8 What ROI did you achieve?
9 Was ROI faster, slower or about the same as expected?
The overwhelming majority (72%) of respondents expected full return on investment (ROI) within three years, with the largest single share going to 2-3 years (36%. The overwhelming majority (71%) saw ROI within three years – the majority got it inside just two. Other ROI periods are broadly in line with previous surveys – except those looking further ahead than five years. Their number has leaped from just 2% last year to 9% this time.
Was ROI achieved as expected? 62% said yes and a further 15% said it was faster, leaving 23% disappointed. This is not as good as last year, when 92% were either as expected or faster but it’s much better than 2013, when 40% said that ROI was slower than it should have been.
“Our project was well planned, thoroughly researched and effectively managed”
“The machine’s capability to do various operations helped us achieve a quicker ROI than anticipated, and this was a nice surprise.”
2013
2015
2014
17% 25% 33% 16% 9%
Less than 1 Year
1 - 2 Years
2 - 3 Years
3 - 4 Year
4 - 5 Years
More than 5 Years
8% 28% 36% 11% 11%
8% 28% 40% 12% 10% 2%
6%
2015
20132014
Less than 1 Year
1 - 2 Years
2 - 3 Years
3 - 4 Year
4 - 5 Years
More than 5 Years
4%
42%
25%
9%
11%
9%
10%
36%
34%
8%
10%
2%
14%
43%
19%
8%
16%
0%
20%
40%
60%
80%
0%
Faster Slower The Same
2013 2014 2015
MANUFACTURINGREPORT2016ANNUAL
AUTOMATION & PRODUCTIVITY
10
11
What were the project’s objectives?
What effect did the automation project have on employment and activity in your company?
The focus of automation projects remains “to improve business efficiency” (78%). The next two on the list – cycle time (60%) and quality (58%) – could be regarded as subsets of efficiency. As in the past two years, these three priorities are simply streets ahead of the rest.
Introduction of new products leads the pursuing pack, being mentioned by 44%, with Improved health and safety (38%) and plant flexibility (36%) vying for fifth place. Once again, it is very clear that reducing staff costs is not a lead priority – only 27% of respondents mentioned it, the same number as Reduce costs (excluding staffing) and Satisfy growing orders. Improving the working environment (31%) was just ahead of these and, sadly, a small number (2%) said that the objectives were unclear. Maybe it seemed a good idea at the time?
The argument over whether automation boosts employment or impacts on jobs has raged since Jethro Tully presented his seed drill. A comfortable majority (60%) of respondents said that working conditions and job satisfaction had improved as a result of their most recent automation project, and absolutely none said they had worsened.
Approaching half (44%) said that jobs had actually been preserved and nearly one-fifth (18%) reported that new jobs had been created. A very small number (2%) said that work had been ‘reshored’ – transferred back from overseas – and 16% reported no change. Just over one-eighth (13%) said that it was too early to say.
“Good planning and execution”
“We have to ensure we budget correctly otherwise we don’t get capital for these projects.”
20% 40% 60% 80% 100%0%
2013 2014 2015
Improve business efficiency
Reduce production time (cut cycle time)
Improve quality
Introduction of new products
Improve health and safety for staff
Achieve plant flexibility
Improve working environment
In order to satisfy growing orders
Reduce costs (NOT including staffing)
Reduce staff costs
It is not clear what the objectives were
Additional jobs have been created
Work was transferred to the factory from foreign locations
Jobs were preserved
Working conditions and job satisfaction have improved
Working conditions and job satisfaction have declined
No change in employment or workload
It is too early to say how employment has been affected, one way or another
18%
2%
44%
60%
0%
16%
13%
16%
10%
42%
50%
12%
2%
2015
2014
60% Working conditions and job satisfaction have improved
MANUFACTURINGREPORT2016ANNUAL
12
13
14
15
Did the project meet its defined objectives?
What are your expectations of your automation supplier? (Select as many as apply)
Did your supplier meet expectations?
Which funding options would you/do you prefer to use for an investment in automation?
A simple question and a simple answer: only seven per cent said “no”.
Why did it fail? One can excuse those whose projects are still ongoing for being unable to assess whether it has or not. However, there was also reported experience of implementation being so poor that cycle times actually increased, which should never happen. A system that is too specialised will also lead to failure; flexibility and ability to adapt to change are essential in today’s fast-moving market.
Absolutely at the top of the list of expectations is that the supplier should provide good technical support. Eighty-nine per cent mentioned this – broadly in line with the past two surveys.
Good customer service (76%), knowledgeable staff (70%) and Responsive (63%) filled the next three places, before Flexible, which was the only other characteristic to be mentioned by half or more. Interestingly, it attracted noticeably higher response than it did last year, which itself was higher than the year before. One that seems to have gone the other way is Low overall cost of ownership, which slipped from 38% last year (42% the year before) to 28% in this year’s survey.
2013
20152014
2013
2013
2015
2015
2014
2014
20%
40%
60%
80%
0%
100%
Yes
Yes
No
No
Being a specialist is important to 41%; stable pricing and ‘being a known brand’ matter to only 20% each. Having global product availability continues to lag in the teens, although that is showing an upward trend, from zero two years ago, to six per cent last year and 15% now. Fewer people (9%) felt that ‘being a global company’ is important, compared with last year’s 14%.
The overwhelming majority (94%) did. Among the reasons why some didn’t were poor support and slow responsiveness; and late delivery with many further adjustments having to be made.
Preparation appears to be key to success.
This is the first year we have asked this question in this form: we have added Equity Fundraising and Business Growth Fund/State Aid or Grant to the list of choices. The banks say they are eager to lend to business; this question asks what sort of funding manufacturing companies actually prefer.
Cash or ‘own resources’ remains the preferred option (54%). It appears that businesses still prefer to avoid borrowing if they can – bank loans are along way back in fourth place (17%), behind asset financing (22%) and state aid in one form or another (20%). Equity financing is very much a minority pursuit (4%) and overdrafts have fallen far from their peak, with only two per cent saying they were their preference.
Good technical support
Deliver good customer service
Experienced and knowledgeable staff
Responsive
Flexible
Specialist
Provide a low overall cost of ownership
Have stable pricing
Known brand
Global product availability
Offer a large product range
They should be a global company
Cash
Bank loan
Asset finance
Overdraft
Equity fundraising
Business Growth Fund/state aid or grant
Other (please specify)
20%
20%
40%
40%
60%
60%
80% 100%0%
0%
2013
2014
2015
AUTOMATION & PRODUCTIVITY
20%
40%
60%
80%
0%
100%
Apply for AABTLN membership and gain access to exclusive networking opportunities.
FREE TO JOIN
Raising the awareness of automation and robotics in UK manufacturing.
Overcoming existing prejudices of automation by offering a host of articles, research, thought leadership, face to face engagement and social media interaction.
Benefits of joining: exclusive networking; direct access to thought leaders; closed social network; articles; insights; case studies; event attendance; and access to three years of primary research.
•
•
•
Principles of Automation Advisory Board Thought Leadership Network
aabtln.com
In association with:
Partners:
MANUFACTURINGREPORT2016ANNUAL
SERVITIZATION MANUFACTURINGREPORT2016ANNUAL
MANUFACTURINGREPORT2016ANNUAL
SERVITIZATION
SERVITIZATION
In order to remain competitive, manufacturers have to be relentless in their search for added value.
This is the first year that the Annual Manufacturing Report has asked about servitization. The Aston Centre for Servitization Research and Practice and Hennik Research collaborated in preparing the questions and conducting the analysis in this section of the survey.
Some manufacturers are moving further up the value chain and incorporating activities that may, previously, have been undertaken by their own customers. For example, in the auto industry, a glass supplier will now supply an entire sunroof system, including electronics and servomotors, in a single unit that the OEM can drop cleanly into the assembly process. The last few years have also seen the growth of another business model: servitization.
It appears in various different guises, from packaged leasing deals for forklift trucks to ‘power by the hour’ contracts between airlines and their engine suppliers. Instead of buying a unit with capital upfront and paying for maintenance and repairs on an arising basis, the airline pays the supplier for keeping the engine running. Money changes hands only when the unit is employed, i.e., flying.
Servitization can help manufacturers to develop long-term, secure relationships
with their customers, even to the extent of shutting out competition. It can aid in overcoming low-cost competition. It also helps to provide manufacturers with reliable, long-term revenue streams that are not as reliant on the potential famine or feast of new product sales.There are challenges, of course: not least, and especially for SMEs, financing. Large companies may well be able to fund the necessary initial expenditure out of their reserves but smaller companies can find that foregoing the large inflows of money that come with outright sales can be rather offputting.
Investment in technology is also key. Equipment has to be monitored closely, in order to ensure that usage is within specified parameters and that repairs and maintenance are undertaken so as to keep the equipment working. The Internet of Things (IoT) is looking like an essential element.
The answers we have received will set the benchmark for the future, as well as helping to paint a clearer picture of the current state of understanding -and therefore the ‘evangelisation’ work that remains to be done – and the extent to which it is being undertaken already. Our sincere thanks to everyone who took the time to complete the survey, and especially those who were unsure of where they stood and where they were heading! Your input has been invaluable.
Analysis by Dr Ali Ziaee Bigdeli Senior Research FellowAston Centre for Servitization Research and Practice, Aston Business School
Sponsored by:
MANUFACTURINGREPORT2016ANNUAL
SERVITIZATION
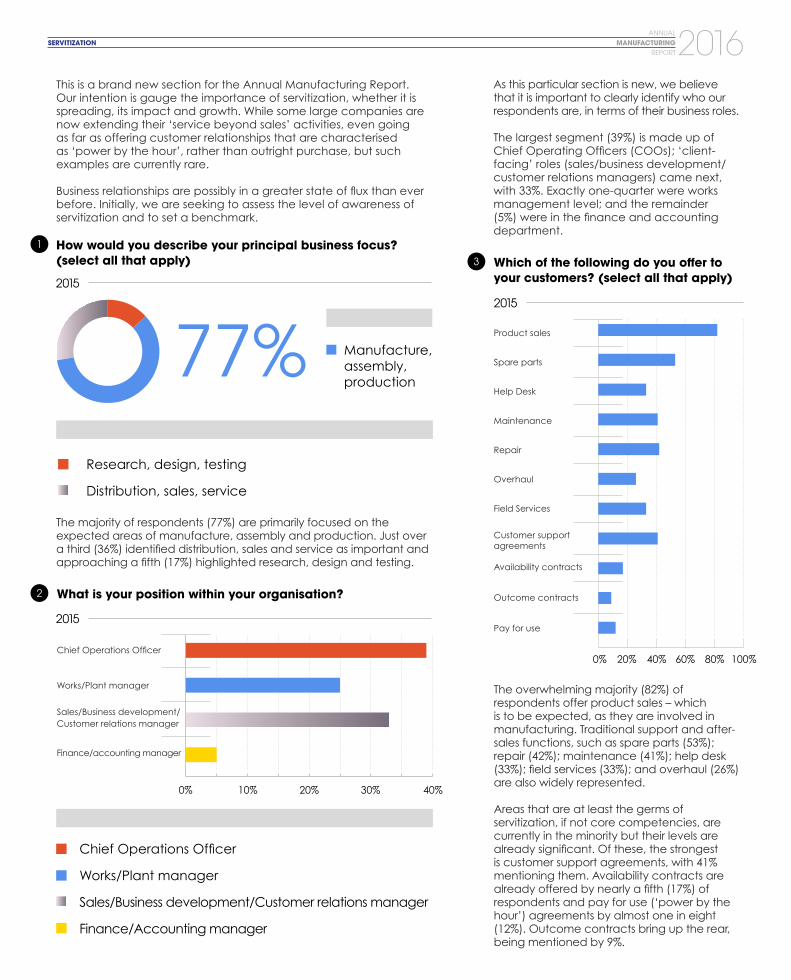
This is a brand new section for the Annual Manufacturing Report. Our intention is gauge the importance of servitization, whether it is spreading, its impact and growth. While some large companies are now extending their ‘service beyond sales’ activities, even going as far as offering customer relationships that are characterised as ‘power by the hour’, rather than outright purchase, but such examples are currently rare.
Business relationships are possibly in a greater state of flux than ever before. Initially, we are seeking to assess the level of awareness of servitization and to set a benchmark.
The majority of respondents (77%) are primarily focused on the expected areas of manufacture, assembly and production. Just over a third (36%) identified distribution, sales and service as important and approaching a fifth (17%) highlighted research, design and testing.
The overwhelming majority (82%) of respondents offer product sales – which is to be expected, as they are involved in manufacturing. Traditional support and after-sales functions, such as spare parts (53%); repair (42%); maintenance (41%); help desk (33%); field services (33%); and overhaul (26%) are also widely represented.
Areas that are at least the germs of servitization, if not core competencies, are currently in the minority but their levels are already significant. Of these, the strongest is customer support agreements, with 41% mentioning them. Availability contracts are already offered by nearly a fifth (17%) of respondents and pay for use (‘power by the hour’) agreements by almost one in eight (12%). Outcome contracts bring up the rear, being mentioned by 9%.
As this particular section is new, we believe that it is important to clearly identify who our respondents are, in terms of their business roles.
The largest segment (39%) is made up of Chief Operating Officers (COOs); ‘client-facing’ roles (sales/business development/customer relations managers) came next, with 33%. Exactly one-quarter were works management level; and the remainder (5%) were in the finance and accounting department.
1
3
2
How would you describe your principal business focus? (select all that apply) Which of the following do you offer to
We asked respondents to be specific about their own business’ sources of revenue. To what extent is manufacturing becoming more about ongoing relationships, as measured by revenues, rather than ‘sell and move on’?
The responses are impossible to reproduce in graph form, as each company gave different figures. They range from 100% product sales and no service revenue at all at one extreme, to 100% service and no outright product sales at the other – but that is, currently, rather in the minority.
The balance is very much towards sales at the moment but some responses were worth highlighting. One respondent said that they don’t currently charge services separately from their product offering; the two appear to be completely integrated.
There appears to be a correlation between those who selected customer-involved answers to Q6 with a larger share of revenues coming from service. This shouldn’t come as a surprise.
“Internet of Things” and “Big Data” are phrases that have been appearing quite a lot in trade and specialist journals so it is to be expected that they will be most familiar to our respondents; 56% said they were. Servitization is currently in second place, mentioned by 42%. The two areas have a lot of overlap; it would be hard to provide broad-spectrum service without high levels of data collection.
Promoters of Industry 4.0 may be disappointed that their efforts have, so far, only reached the ears of 21% of the business population. It lags behind ‘circular economy’ but is ahead of Product-service systems. These concepts do not yet seem to be in the mainstream.
Servitization is very much about customer relationships. We phrased the question in order to get a clearer picture of how businesses are working with and relating to their customers and how closely they are involved with each other.
Referring back to Q4, the majority of respondents said that most of their revenues came from product sales – well over 70%, in many cases. However, the answers to this question paint a slightly different picture. Less than one-fifth (18%) said that their relationship is limited to supplying the product in accordance with the terms and conditions. The same number said that repeat orders are important so they work to ensure that whatever they are doing meets customers’ needs.
At the other extreme, absolutely none of our respondents said that they offer leasing with full maintenance, support and replacement and only 15% offer maintenance and support through the lifecycle of the product.
However, nearly half (49% in total) of respondents said that they are working with their customers to develop solutions tailored to their needs, either through bespoking (“we work with customers to develop solutions …” 26%) or through involvement from the earliest stages (“we work with customers to design and develop tailored solutions” – 23%). Sell and move on to the next prospect is not an approach pursued by the majority, clearly.
4
5
6
How is your revenue split between product and service sales (e.g. 80/20)?
Are you familiar with any of the following terms? (please select all that apply)
How would you define your relationship with your customers?
We supply the product and provide replacement/repair in accordance with the terms of the guarantee/warranty
We work with customers to ensure our product meets their needs; repeat orders are an important part of our business
We work with customers to develop solutions appropriate to their needs
We work with customers to design and develop tailored solutions
We offer a service that includes maintenance and support throughout the lifecycle of the product
We offer a leasing/contract package that includes maintenance, support and replacement
Servitization IOT (‘Internet
of Things’)/Big Data
Circular Economy
Product–Service Systems
Industry 4.0 None of the above
2015
2015
60%
20%10%
20%
30%
40%
0%
0%
“One respondent said that they don’t currently charge services separately from their product offering; the two appear to be completely integrated.”
Almost a third of respondents (32%) said they were unfamiliar with any of these terms.
MANUFACTURINGREPORT2016ANNUAL
SERVITIZATION
7 8How integrated is your business with your customers’ operations?
If you are offering pay for use/power by the hour/pay per click/pay as you go (etc) how is it financed?
Businesses that want to provide customers with a strong service offer have to get close to them, which means integrating operations to a pretty significant extent. This question is intended to identify how many are doing so and to what extent.
It appears that collaboration is important but integration is currently a minority pursuit.
Technologies such as EDI are pretty familiar, especially in the aerospace and auto supply chains, and that is reflected in the fact that approaching half (44%) of respondents use it and similar IT solutions to collaborate on supply chain issues.
Almost as many (39%) employ performance measures (KPIs) that are designed to reflect outcomes aligned to individual customers. This is going beyond basic quality control – “does it work as specified and did it arrive on time” – to a more personal and tailored relationship.
Deep-level servitization – integrated business processes (5%); co-located facilities and operations (3%) – has established a bridgehead but has not reached the fertile hinterland, as yet. The means of doing so may well be growing, as 10% of respondents said that they are using technology such as IoT (internet of Things) in order to manage support, maintenance, spare parts and repair.
Building relationships with customers on the basis of service rather than product sales alone is expensive. There is logic to paying for machine availability, rather than just for hardware, and especially from the customer’s point of view. However, it is expensive; the costs of production still have to be covered as they are incurred, rather than over the lifecycle of equipment, which can be as long as 20 years. It is likely that only the larger companies could afford to do it themselves.
Eighty per cent of our respondents said that the question is simply not applicable – they do not currently offer ‘power by the hour’ or any similar arrangement.
Of those who do offer it, the largest proportion (13%) said that they fund capital equipment from their own resources and a further 5% said that funding was initially from the bank, but is now provided internally. The remaining 3% use bank or finance house lease financing.
“Collaboration is important”
“80% of respondents do not currently offer ‘power by the hour’ or anything similar”
We utilise technology such as the Internet of Things/Internet 4.0 in order to manage support, maintenance, spare parts and repair
We operate facilities that are co-located and distributed throughout customers’ operations and integrated within their supply chain
Our performance measures are designed to reflect outcomes aligned to individual customers
Our business processes are integrated with customers’ operations
We operate separately from our customers but collaborate on supply chain issues through IT, including EDI
44%
2015
2015
10%
3%
39%
5%
Capital funding is provided on a lease basis by a bank or finance house
Capital funding is provided by invoice financing
We are able to fund capital equipment from our own resources
Capital funding was provided by a bank/finance house but we are now able to fund it ourselves
Not applicable
80%60%20% 40%0%
MANUFACTURINGREPORT2016ANNUAL
SERVITIZATION
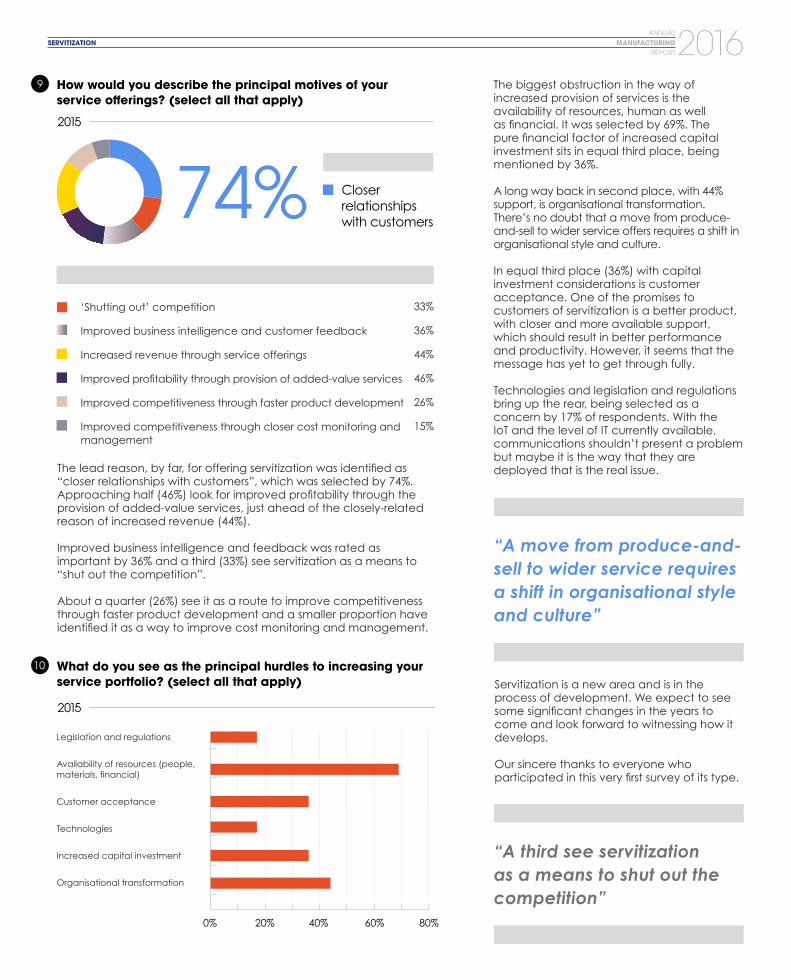
10 What do you see as the principal hurdles to increasing your service portfolio? (select all that apply)
9 How would you describe the principal motives of your service offerings? (select all that apply)
The lead reason, by far, for offering servitization was identified as “closer relationships with customers”, which was selected by 74%. Approaching half (46%) look for improved profitability through the provision of added-value services, just ahead of the closely-related reason of increased revenue (44%).
Improved business intelligence and feedback was rated as important by 36% and a third (33%) see servitization as a means to “shut out the competition”.
About a quarter (26%) see it as a route to improve competitiveness through faster product development and a smaller proportion have identified it as a way to improve cost monitoring and management.
The biggest obstruction in the way of increased provision of services is the availability of resources, human as well as financial. It was selected by 69%. The pure financial factor of increased capital investment sits in equal third place, being mentioned by 36%.
A long way back in second place, with 44% support, is organisational transformation. There’s no doubt that a move from produce-and-sell to wider service offers requires a shift in organisational style and culture.
In equal third place (36%) with capital investment considerations is customer acceptance. One of the promises to customers of servitization is a better product, with closer and more available support, which should result in better performance and productivity. However, it seems that the message has yet to get through fully.
Technologies and legislation and regulations bring up the rear, being selected as a concern by 17% of respondents. With the IoT and the level of IT currently available, communications shouldn’t present a problem but maybe it is the way that they are deployed that is the real issue.
Servitization is a new area and is in the process of development. We expect to see some significant changes in the years to come and look forward to witnessing how it develops.
Our sincere thanks to everyone who participated in this very first survey of its type.
“A move from produce-and-sell to wider service requires a shift in organisational style and culture”
“A third see servitization as a means to shut out the competition”
‘Shutting out’ competition
Improved business intelligence and customer feedback
Increased revenue through service offerings
Improved profitability through provision of added-value services
Improved competitiveness through faster product development
Improved competitiveness through closer cost monitoring and management
Closer relationships with customers
2015
2015
33%
36%
44%
46%
26%
15%
Legislation and regulations
Availability of resources (people, materials, financial)
The Manufacturing Services Thought Leadership Network (MSTLN) was designed to raise awareness within UK manufacturing, that ensuring long-term success requires companies to increasingly focus on creating value in the customers’ business, rather than solely in the production facility and R&D lab.
Through networking with like-minded manufacturers
Access to articles from thought leaders
Discounted attendance at the MSTLN annual conference
mstln.co.ukJoin for free!
* In order to ensure you are a qualifying company, registration will be checked and once approved you will be sent log in details
MANUFACTURINGREPORT2016ANNUAL
MANUFACTURINGREPORT2016TRAINING & SKILLS
ANNUALMANUFACTURING
REPORT2016ANNUALTRAINING & SKILLS
MANUFACTURINGREPORT2016ANNUAL
TRAINING & SKILLS
There are plenty of vacancies in manufacturing; it offers more opportunities, and of higher value, than for decades. It offers real training and the prospect of acquiring transferable skills to last a lifetime. Projects like Bloodhound SSC and initiatives such as STEM can fire young imaginations and help to attract and retain people throughout their working lives. It opens up global opportunities; if you’re an engineer you can go anywhere in the world.
But the skills gap remains and some of the needs are in crucial areas. The preparedness of young people for the world of work is unacceptable. Far too many of our respondents describe the preparedness of 16 and 18-year-olds as “poor” or “very poor”. While it has been suggested that the abolition of compulsory work placement may have had an effect, it cannot be seriously argued that two weeks out of 11 or 13 years of compulsory education can really make a huge difference.
The problem is deeper-seated and rooted in a longstanding disconnection between schools and employers. There may have to be some plain speaking
across either side of the divide if the gap in understanding is to be bridged.
Shortages exist in engineering and automation; toolmaking; technical and practical positions; and in problem solving; planning and organisation; and leadership and management roles. Written communication skills seem to be in shorter supply as well.
Companies are prepared to invest in their own people. There are more vacancies for apprentices and there’s more in-work upskilling, both accredited and informal. The recently-announced Apprenticeship Levy may encourage even more – depending on its final shape.
Manufacturing already knows that low-skilled, heavily physical occupations are in the past and no more than historical curiosities. Opportunities presented by STEM, Bloodhound and the success of Lewis Hamilton and our F1 teams generally should be seized upon in order to inform, educate and enthuse the next generation.
TRAINING & SKILLS
Analysis by Halil BedeviManaging DirectorHennik Recruitment
Sponsored by:
MANUFACTURINGREPORT2016ANNUAL
As well as government encouragement and support, UK Manufacturing needs employees with the right skills. This year’s survey makes very clear that major problems persist, especially in education.
Only around 16% of respondents said that their company currently had no vacancies at all. Most have between two and four openings (just under 47%) and over 22% have more than 10.
In the case of multi-site companies in particular (nearly four-fifths of respondents), 10% reported more than 10 openings and just under 35% said that they had between two and four.
The overwhelming majority (71%) of respondents are in charge of their own recruitment and training. Of the rest, where primary responsibility lies with head office the site itself has at least some (8%) or a lot (16%) of input. The remaining four per cent were unsure where decisions are taken.
Local management have very high awareness of the quality of applicants. There are clearly a lot of job opportunities but do the workforce have the right skills and are companies providing means to acquire them, if not?
We asked this question at the end of Section One in order to get a general overview. Section Two engages with a more specialised group of respondents and more specific and detailed personnel topics.
The response is very similar indeed: just under 84% responded “No, not enough is being done”. Just over six per cent weren’t sure and a sliver over 10% said that they believe that enough is being done to make manufacturing an attractive career choice.
TRAINING & SKILLS
1
2
Do you think enough is being done to make manufacturing an attractive career choice?
How many vacancies do you CURRENTLY have at your company?
2015
10%
84%
6%
Yes
No
Not sure
84%believe not enough is being done
How many vacancies do you CURRENTLY have at your particular site?
3
0 1 2-4 5-10 11+ This is a single-site company
50%
50%
10%
10%
20%
20%
30%
30%
40%
40%
0%
0%
2013
2013
2014
2014
2015
2015
Where are decisions relating to recruitment and training taken?
4
60% 80% 100%20% 40%0%
Don’t Know
Solely by Head Office
Primarily at head office but your establishment has some input
Solely by your establishment
Primarily at head office but your establishment has a lot of input
2013 2014 2015
2015
71% Do their own recruitment and training
MANUFACTURINGREPORT2016ANNUAL
There is some kind of training going just about everywhere, pretty much across the board, nearly all the time - and a lot of it is formal/accredited. Fewer than one in ten said that none of their staff get any kind of formal training within a six-month period. It seems that everyone has some kind of informal or on-the-job training, every month.
The number of employees getting at least some formal training seems to be rising. The percentage of respondents saying that between one in ten and one-quarter of their payroll is doing so almost doubled from last year, from 17% to 33%. This area seems to have drawn from the lower end; the number putting fewer than 1 in 10 through is well
TRAINING & SKILLS
5 What percentage of your employees do you estimate receive formal accredited training and development during a typical six month period?
What percentage of your employees do you estimate receive on-the-job / informal training and development during a typical month?
6
0%32%36%
21%
7%
0%
4%
0%32%17%
20%
15%
5%
12%
3%57%25%
12%
0%
2%
2%
0%
1-10%
11-25%
26-50%
8%
29%
33%
10% Our training is primarily informal/ on-the-job
51-75%
76-99%
100%
2%
8%
4%
6%
0%
1-10%
11-25%
26-50%
0%
18%
22%
29%
51-75%
76-99%
100%
12%
8%
10%
2014
2014
2015
2015
2013
2013
Yes, from internal resources
Yes, from external resources
Yes, a combination of internal and external resources
Yes, from internal sources but some difficulties with external
Yes, from external sources but some difficulties with internal
No, we cannot access the right training and development resources
4%
0%
64%
12%
14%
63%
15%
12%
3%
4%
0%
8%
0%
64%57%
down, from 57% to 29%. Those putting more than a quarter through formal training in any six month period is up also (from 16% to 24%). It will be encouraging if this turns out to be a permanent trend.
Sixty per cent of respondents said that at least one-quarter of their workforce received informal/on-the-job training in any one month. The last survey result was 52%, which was itself an increase over the previous year’s 32%. Just a little over one in ten said that every one of their employees had some kind of training during a typical month.
Less than 10% said they could not access the training they needed. This is a noticeable improvement on the past two years.
We asked about the mix of training: is it all from external or internal sources and were there any problems? By a large majority (63%), the preference appears to be for a mix of internal and external provision. About one-eighth (12%) said they had encountered difficulty finding the right external providers. Fewer than five per cent said that their internal training was difficult to source.
7 Are you able to access the correct/required training for staff?
20132014
2015
86%83%
Yes No
MANUFACTURINGREPORT2016ANNUAL
TRAINING & SKILLS
9 In your experience, which of the following occupations are difficult to recruit and/or retain?
50% 70%30%10%0%
2014 2015
Toolmakers & Technical Roles
CNC Roles
Engineers
Management & Leadership Roles
Other
8 In your experience, which of the following skills are difficult to find?
Technical or Practical skills lead the pack once again, with approaching two-thirds (61%) of those surveyed mentioning them. That choice has moved from second place for the past two years, behind Engineering/Automation skills. It’s fall into second place does not mean that those skills are becoming easier to find: 53% said that they remain difficult to find (58% last year).
Written Communication (49%) comes next, with Planning and Organisational skills and Problem-Solving tied at 47% each. Team working is a problem for nearly a third (33%) and there is a clutch of issues bunched around the mid-20s: Literacy and job-specific skills (27% each) just edge ahead of Numeracy, Strategic Management and Oral Communication (all 25%).
One can understand that Strategic Management might be in short supply as it is high-level and requires experience. But what is to be made of the fact that basic skills such as Literacy, Numeracy and Oral Communication are in the same bracket?
These vital skills keep being identified, year after year, as hard to find – and in pretty much the same proportions; there are no signs of improvement.
There seems to be a major disconnect between manufacturing’s expectations of basic ‘life skills’ and those of the UK’s education system.
Technical or practical skills
Engineering / automation skills
Written communication skills
Problem solving skills
Planning and Organisation skills
Team working skills
Literacy skills
Job specific skills
Oral communication skills
Strategic Management skills
Numeracy skills
Advanced IT or software skills
Customer handling skills
Foreign language skills
Basic computer literacy / using IT
Office admin skills
WALES: Written Welsh language skills
WALES: Oral Welsh language skills
60% 70%20% 30%10% 40% 50%0%
2013 2014 2015
Engineers are the hardest vacancies to fill (61%), followed by Leadership and Management roles (49%) and Toolmakers and Technical roles (43%). CNC roles come fourth but six per cent of respondents don’t find any problem at all. Roles mentioned under the “other” category included “Purchasing Team”.
61%Of respondents selected ‘Engineers’ as the most difficult staff to recruit and/or retain
“There seems to be a major disconnect between manufacturing’s expectations of basic ‘life skills’ and those of the UK’s education system”
MANUFACTURINGREPORT2016ANNUAL
67%Introduced further training/development opportunities
TRAINING & SKILLS
The answer selected by most of our respondents – 53% - is “not enough people interested”. Geographic location came second, with 43%. Wages only just squeaked in third (37%), ahead of “Too much competition from other employers” (35%).
The “benefits trap” lagged quite a way down the list (10%), well behind “Lack of career progression” (29%) but ahead of “Lack of employee engagement with the organisation” (8%) and ambition-killers like “Long/unsocial hours” (6%); “Unattractive conditions of employment”; and “Staff don’t want long-term commitment” (2% each).
The leading response to retention and recruitment challenges is, once again, to introduce Further Training and Development Opportunities for their staff – and by a wide margin: 67%, more than 20 points ahead of Increased Management/Leadership Training (47%). Introduction of Flexible Working Hours (39%) comes in third, just ahead of Improved Career Progression (37%) and Higher Pay/Incentives.
Changing Job Specification/Spreading Tasks (22%) is a bit more popular this year than last but Automation, at just over four per cent, is not currently seen as a significant solution. Assistance with Travel or Childcare was mentioned by just over 12% of our respondents; they seem to be more niche than widespread.
The lead responses are about personal development and improvement: in essence, making work more fulfilling and worthwhile.
10 Which of the following factors affect your company’s ability to attract and retain staff?
2013
2014
2015
40% 50% 60%30%20%10%0%
Not enough people interested in doing this type of work
Geographic location of the firm
Wages offered are lower than those offered by other firms
Too much competition from other employers
Lack of career progression
Impact of the benefits trap
Lack of employee engagement with the organisation
Long/unsocial hours
Unattractive conditions of employment
Staff don’t want long term commitment
“These vital skills keep being identified, year after year, as hard to find – and in pretty much the same proportions; there are no signs of improvement”
“The lead responses are about personal development and improvement; making work more fulfilling and worthwhile”
11 What measures, if any, have you taken to overcome your company’s retention and recruitment difficulties?
2013 2014 2015
20%
40%
60%
80%
0%
Offered higher pay or more incentives than normal
Introduced job enrichment
Introduced further training/development opportunities
Improved career progression
Provided assistance with travel
Provided assistance with childcare
Introduced flexible working hours
Changed the job specification by giving some of the tasks to other staff
Changed the job specification by automating some of the tasks
Increased management/leadership training
Not taken any measures to overcome retention difficulties
MANUFACTURINGREPORT2016ANNUAL
13
14
If you have given ‘first job’ opportunities to youngsters on leaving school, college or university, have any of them been (please select all that apply):
Thinking of those recruited over the past 2-3 years, how well prepared for work have they been?
There is no easy way to say this and no point in sugaring the pill: UK Manufacturing continues to find that youngsters coming for their first job from schools and FE Colleges are particularly poorly prepared for the world of work. The worst-prepared are 17-18-year-old school leavers: a staggering 77% of respondents said they were poorly or very poorly prepared and none – not one – has found them very well prepared.
It’s a little less awful for 16-year-old school leavers but not much: 73% found them to be poorly or very poorly prepared.
The response to FE Colleges has improved a little, with one-third saying they are well-prepared – but over half (58%) still found them poor or very poor.
This is not hearsay, rumour or gossip. These responses are from real people, in real companies, dealing with real youngsters that they have recruited.
The biggest impact is, once again, increased strain on management of remaining staff (59%). This problem is highlighted by well over half of all respondents, year after year.
Increased Recruitment Costs comes next (43%); loss of Efficiency/Increased Wastage has leaped to the same number (37%) as Restriction of Business Development Activities and Increased Running Costs. Difficulties with Quality, and Difficulties with Introducing New Working Practices were selected by around one-third. Customer Service Difficulties were mentioned by only a quarter of those surveyed, which may come as a surprise to some.
12 In your experience, do staff retention difficulties lead to:
40% 60% 80%20%0%
40% 50% 60%10% 30%20%0%
40% 60% 80%20%0%
Increased strain on management of existing staff in covering the shortage
An increase in recruitment costs due to more advertising or use of a recruitment agency
Restriction of business development activities
Loss of efficiency or increased wastage
Increased running costs (e.g., use of excess overtime subcontracting or use of temporary staff etc)
Difficulties with quality
Difficulties with introducing new working practices
Difficulties with customer service
Loss of business (including known losses to competitors)
Difficulties with accommodating technological change
Retention difficulties have not affected the business
2013
2013
2015
2015
2014
2014
TRAINING & SKILLS
17 or 18 year olds recruited to their first job from FE College
Recruited to their first job from University or another Higher Education institution
17 or 18 year olds recruited to their first job from school
16 year olds recruited to their first job on leaving school
16-yr-old school leavers
17-18-yr-old school leavers
17-18-yr-old FE/6th Form College leavers
University/Higher Education graduates/leavers
Very well prepared
Well prepared
Poorly prepared
Very poorly prepared
Varies too much to say
“This is not an indictment of the youngsters themselves but rather of a system that seems to be failing them”
MANUFACTURINGREPORT2016ANNUAL
The overwhelming majority offer apprenticeships but just over a quarter (26%) do not. The majority of those who currently don’t have apprentices said that they plan to offer them in the future.
It bears repetition: the skilled workforce of tomorrow is not going to be trained by someone else – it has to be done by manufacturing companies themselves, working with schools, colleges and universities. The quality of recruits may not be as good as we want but that is not a reason to abandon attempts to work with the education system: quite the opposite. It reinforces the argument that schools especially need to develop a better understanding of manufacturing and engineering.
Initiatives and projects such as STEM, Bloodhound SSC and JCB’s engagement with local schools present opportunities to be seized by manufacturers. Bloodhound has done a great job in getting youngsters interested in engineering – advanced engineering especially. Its recent official launch will have helped to raise the profile further.
Apprenticeships are coming back into favour; the Chancellor announced an Apprenticeship Levy in the summer Budget and the numbers are up in our survey, in every category, over last year. More apprenticeships, at higher levels, are being offered but higher skills will require even more.
TRAINING & SKILLS
It is a shocking indictment of our compulsory education system that so many – the majority – young people up to age 18 are arriving at their first job seriously inadequately prepared for the world of work. This is not an indictment of the youngsters themselves but rather of a system that seems to be failing them.
The overall responses are broadly the same, year after year. There is a serious problem with education in the UK.The good news is: UK Manufacturers still have faith in our youngsters and remain convinced that they can help them better themselves because they continue to recruit kids from schools and FEs, to give them a chance and to invest in the training and education that will provide the necessary skills for self-reliance and independence.
Higher Education – the university sector – seems to be doing a better job. Nearly 10% of respondents said that their recruits are very well prepared and just under 45% said “well prepared” – more than half in total. Around 42% were rated as poorly or very poor but university graduates had the lowest ‘very poor’ score out of all the groups, at just over five per cent.
The trend towards closer links with universities and the more focused and vocational characteristic of engineering and technical education seems to be producing better results.
“We explored the opportunity but received a poor quality, and relatively low quantity, of applicants/potential placements.”
“UK Manufacturers still have faith in our youngsters”
“It is a shocking indictment of our compulsory education system that so many young people are arriving at their first job seriously inadequately prepared for the world of work”
15 Do you offer apprenticeships? If yes, at what level?
2015
Advanced
Higher
We do not offer apprenticeships at present but plan to in future
We used to offer apprenticeships but do so no longer [Please specify why you stopped]
We do not offer apprenticeships and have no plans to do so [Please specify why you do not offer apprenticeships]
47%
22%
18%
4%
4%
55%Intermediate
MANUFACTURINGREPORT2016ANNUAL
Recruitment
Connecting opportunity with talentWe are a specialist recruitment consultancy dealing exclusively with all senior level appointments in the manufacturing sector.
Contact us if you have any vacancies or if you would like to be considered for opportunities.
The 2016 Annual Manufacturing Report finds that the strong level of investment in Information and Communications Technology (ICT) that we saw last year has been broadly sustained. Nearly 90% of respondents said that their investment in ICT was the same or more than last year.
Increased focus on ERP and new investments into analytics and reporting alongside better need for operational planning shows that manufacturers are looking at ICT to not only gain visibility and control of their entire business, but also to drive greater efficiency through integration.
Market pressures such as competitiveness on price and a need to differentiate via innovation are some of the critical challenges driving new ICT initiatives. ICT investment still continues to support innovation and product development and continues to show a positive impact on key business metrics such as productivity and profitability.
A drive to achieve better planning and monitoring is also evident with a strong need to measure ‘product design and development’. Most companies said that the goal of their ICT investment is
to improve their existing performance. For example, CRM is now looked on as a tool to derive greater value from loyal customers and to improve cost of sales.
We have, for the first time this year, asked about the Internet of Things (IoT) or ‘Industry 4.0’. As with any new technology, there seems to be high awareness but low adoption. Most companies seem to be in a ‘wait and watch’ mode as they try to assess and understand IoT’s impact to their business.
Dell helps manufacturers to drive efficiencies and increase productivity. Our strong capabilities in business intelligence and data analytics means that our customers can gain critical insights into their business to achieve a competitive edge, whilst protecting their IP. Our products and expertise around IoT are helping manufacturers manage critical control areas such as plant and asset maintenance and partner integration, whilst enabling business innovation by securing their IP to drive a competitive edge.
INFORMATION &
TECHNOLOGYCOMMUNICATIONS
INFORMATION, COMMUNICATION, TECHNOLOGY
Analysis by Atul ShrivastavaHead of Dell Services: Manufacturing, Energy & Utilities Sector,Dell Corporation
Analysis by Tim GriffinDell UK Vice President & GMDell Corporation
Sponsored by:
MANUFACTURINGREPORT2016ANNUAL
INFORMATION, COMMUNICATION, TECHNOLOGY
1
2
3Is your total ICT expenditure (including hardware, service, software, infrastructure, training, etc) in the last financial year less, more or the same as the previous year?
Is your proposed expenditure for next financial year less, more or the same as this year’s?
Which of the following IT and technology-based initiatives is currently the highest priority within the company? (i.e., there is a current project or that one is planned to start in the next 12 months.)
Expenditure trends in ICT may have reached a peak last year, when 71% of respondents said they are spending more than previously – but intentions have not fallen back very far: 61% said they are spending more than in the previous year. This is the second-highest level we have ever recorded. Exactly a quarter said they are spending the same and 14% said they are spending less, which is a little up on last year’s 11%.
It is worth noting that 53% of respondents last year said that they expected to spend at higher levels in the coming 12 months. The reality is that even more are doing so.
Expectations for 2016 are a little more pessimistic, with fewer than half (48%) expecting to spend more in the coming financial year and 27% saying they will spend less. The pattern we have found in practice over the past four years is that respondents expect investment in ICT to be less than the actuality, although not wildly so.
2015
80%
100%
110%
60%
20%
40%
0%
2013
2013
2012
2012
2014
2014
2015
2015
The sameLess More
The sameLess More
2015
Upgrading IT infrastructures
Financial or accounting software
Manufacturing Execution System (MES)
Management Information System (MIS)
Use of internet for sales and marketing
Systems integration
Introduce RFID/wireless technology to any part of your operations
Enterprise resource planning (ERP)
Supply chain management and integration (SCM)
Product engineering data management (PDM)
Customer relationship management (CRM)
Intranet development
Warehouse management systems
Business Intelligence, analytics and reporting software
Wireless technology
E-business
Use of public or private web exchange(s)
Enterprise application integration (EAI)
Product lifecycle management (PLM)
Application service provision (ASP)
Advanced Planning and Scheduling / Finite capacity planning and scheduling
Time & Attendance / Workforce labour management
Simulation and modelling of products or processes
80%
100%
60%
20%
40%
0%
5% 35%25%15%0%
2013 2014 2015
MANUFACTURINGREPORT2016ANNUAL
INFORMATION, COMMUNICATION, TECHNOLOGY
4 Over the past 12 months, have you made any new IT investments to improve your company’s performance in any of the following business processes? (Mark as many as apply).
Having slipped well back into second place in 2014, when only 13% of respondents reported that it was the highest IT priority, ERP investment has jumped to the top of the pile, with 25% identifying it. In doing so it leapfrogged Upgrading IT Infrastructure, which has seen a steady decline from its 2013 peak of 35% to only 16% this year.
Manufacturing Execution Systems (MES) are marching in the other direction and are now the priority of just over one in ten (11%). Customer Relationship Management (CRM) (9%) is just behind but a little down on last year’s 11%. Supply Chain Management (SCM) is next up, albeit with only 7% support – but this is much higher than the previous two years’ zero and at the same level as Intranet development.
Internet Sales & Marketing; Systems Integration; Business Intelligence, analytics and reporting software; and E-business are all the priority of around one company in 20. Accounting software, PLM and Time & Attendance/workforce labour management are almost friendless but not quite (2% each). The lonely ones are RFID, MIS, PDM, warehouse management, wireless technology, ASP, advanced planning and scheduling and simulation and modelling. None of these results is notably out of line with previous surveys; it does seem to be the big, integrated systems such as ERP that attract the main attention.
The answers to this question are, strangely, in contrast to those provided in response to Question 3. Planning and scheduling operational processes was not selected as a high priority but it is the area mentioned most often (50%) when respondents are asked what they are actually spending money on. It’s almost exactly the same with Analytics and Reporting: a priority for only 5% but mentioned as a current project by just under half (48%) of all respondents – and they are the same people who are doing the responding.
PDM (product engineering data management) was not identified as a priority by anyone in response to Q3 but product design and development has attracted new investment from 39% of all the businesses surveyed in this section.
Similar pictures emerge all the way down the list – SCM, CRM and Financial Management are not identified as main priorities by many but new money is being spent on all of them (34%, 27% and 21% respectively) to a significant degree. Similar but not quite so contrasting pictures apply to Workforce management and Demand forecasting.
Why the apparent contradiction? Hard to be absolutely definitive but it could be the case that expenditure in these areas may be significant but it has become routine, so they aren’t identified as ‘priority’. Or it could be that the priority areas are those that are in need of some TLC, in order to make up for lost ground.
There has been movement across the board since last year’s survey, at least in terms of the total identifying areas of expenditure, and most of it has been upwards. The notable exceptions going the other way are Workforce Management (down from 36% in 2014 to 18% this year); and Forecasting Demand (22% to 11%). The area that has shown something of a welcome rise is Plant and asset maintenance, up from 7% in 2014 to 16% this year. Maintenance is often described as the “Cinderella service”; do this year’s numbers represent a significant shift or a single-year spike? Time will tell.
Product design and development
Supply chain management
Improving energy/resource efficiency
Planning and scheduling operational processes
Analytics and reporting (e.g., monitoring of sales and other financial and non-financial information)
Workforce management
Logistics / Transport / Distribution
Forecasting demand
Customising offers and services to customers
Managing customer relationships
Developing new business models
Financial management
Plant and asset maintenance
50%40%20% 30%10%0% 20132012 2014 2015
“Significant money is being spent on SCM, CRM and Financial Management”
MANUFACTURINGREPORT2016ANNUAL
2015
2015
2015
Yes
No 16%
No 33%Yes 25% Unsure 42%
INFORMATION, COMMUNICATION, TECHNOLOGY
5
6
9
8
7
Have you heard of or encountered the terms “Internet of Things (IoT); Internet 4.0; “Connected Supply Chain”?
If “Yes”, have you introduced or do you intend to introduce IoT to your business operations?
Are your new ICT initiatives focused primarily on improving existing processes and ways of working or are they targeted at meeting new challenges and requirements faced by the company?
If “no”, what is preventing you from adopting IoT solutions at this time? (Please select all that apply)
If “Yes”, what have you introduced or what are you intending to introduce? Please reply in your own words.
84%
The Internet of Things (IoT), aka Internet 4.0, Integrated Supply chain, connected factories, etc, has been a topic apparently discussed far and wide with increasing volume and frequency. Or is it? According to our survey, 16% of manufacturers have never even heard of it.
Of the majority who have, only a quarter currently intend to something about it, to use the technology to link their machines and supply chain together and improve data collection, monitoring and transfer. A little under half (42%) are currently hedging their bets and a third (33%) have no plans to introduce IoT to their businesses. That does not mean they have set their faces against it, only that they have no current plans to adopt it.
We asked those who are introducing IoT, or who are thinking of doing so, to tell us, in their own words, what they are intending to do. The responses will provide a framework for our survey in the future.
The words mentioned most often were ‘connect’ and “connectivity”. “Business intelligence”; “tracking; and “control” also figured.
IoT has not (yet) come up with a ‘killer app’ – it might happen but its progress seems to be evolutionary, rather than revolutionary. The sentiment of at least one respondent, that they are seeking to learn and understand how IoT fits in with their current systems, seems to be speaking for a larger number.
Of those who are not currently either deploying or thinking of deploying IoT, the majority position is that they don’t understand it (48%). A further one-third maintain that they don’t currently have anything appropriate – but if you combine those who confess that they don’t understand it (19%) with those who believe that they do not currently have sufficient expertise (19%), you get just under two-fifths of businesses who are making clear tha lack of knowledge and information is the major hurdle.
We have nothing appropriate
We don’t understand IoT
We don’t have the expertise to introduce IoT
We do not see any point or anything to be gained by introducing IoT at this time
10 What challenges have led to the introduction of new ICT initiatives? (Mark as many as apply).
As with last year, we allowed respondents to select both answers to Q9, if they so wished, and quite a few did – which is why the total exceeds 100%.
Those saying that their ICT projects are aimed at improving existing processes and ways of working totalled 80%, which is consistent with previous years. Offering two options indicates that “meeting new challenges” is a growing reason for investing in new ICT initiatives; it registers 46% support this year, compared with 34% in 2014 and significantly lower numbers in previous years.
The list of specific challenges is once again led by “productivity improvement” (51%), although not as overwhelmingly as last year. Price competitiveness has taken a bit of a leap forward into second place (44%), ahead of Service, last year’s runner-up, which has slipped from 49% to 41, and is only just ahead of Innovation and Product development, which has strengthened to 39%, from last year’s 31. On the same 39% mark this year is the related response of “Raising innovation performance; development of new products or processes”, which has taken of a great leap forward. The previous three years had seen it slipping back, from 32%, to 14% and then a small recovery to 18% before roaring forward in 2015. It’s not all that surprising, given the talk of the need to raise productivity; it is the processes and products that will deliver it.
Competition from low-cost competitors shows a tick upwards, back to the 23% level seen in 2012 and well up from the low of 11% recorded in 2013. Regulatory and compliance issues retain their importance (22%) at about the same level as last year (21%).
The rising number mentioning a more geographically dispersed customer base (18%) reflects anecdotal and other reports we have collected during the year. With China’s rate of growth slowing and the sanctions on Russia having their effect, UK manufacturing has to look further afield to new markets to sustain and grow. This is reflected by 10% mentioning “offshoring manufacturing functions”, a level that is the highest we have recorded in the four years we have been asking this question.
Environmental and customer pressures attract support in the mid-teens, Offshoring manufacturing functions has shown a recovery to 10% after several years in the low single-digit levels.
A very low 3% have no idea what they have been challenged by.
Offshoring manufacturing functions (including relocation, outsourcing and investment)
More geographically dispersed customer base
Competition from low-cost competitors
Innovation / product development
Service
Regulatory and compliance issues
Reducing environmental impact of business
Increasing price competitiveness
Customer pressure to adopt new processes
Raising innovation performance; development of new products or processes
Productivity improvement
Don’t know
20132012 2014 2015
60%40% 50%20% 30%10%0%
“Meeting new challenges” is a growing reason for investing in new ICT
MANUFACTURINGREPORT2016ANNUAL
INFORMATION, COMMUNICATION, TECHNOLOGY
11 To what extent did the introduction of ICT lead to an improvement?
Whatever the challenge and whatever the question, the measure of whether or not it was successful is: did it work? Did it deliver the improvements being looked for? This year’s answers are rather positive – with one possible exception.
Productivity tops the charts again this year, and even more strongly than previously; no less than 98% of respondents said that it had improved either moderately or a lot. This is a notable improvement over the past three years, when the positive rating had hovered around 80%.
Competitiveness/efficiency has also strengthened; 89% said it had gone up moderately or significantly, taking it back up to 2013’s levels. Customer satisfaction is in the same ballpark as last year’s level, with a slight improvement to 86%.
Profitability looks to be the big gainer. It has always struggled to get into the high levels of overall improvement reported for Productivity, Competitiveness and Customer satisfaction but it really sails into their territory this year, with a total of 80% positive rating. More than a quarter (27%) of respondents said that the improvement had been “significant”.
Bottom of the heap, with 42% reporting “no improvement”, is energy/resource efficiency. Even though a majority (56% in total) said that they had seen improvement and the negative rating is lower than we have ever recorded, there is still some ground to be made up. The collapse in oil prices and consequent lower energy costs has probably assuaged disappointment but there is no guarantee that the situation will continue. Either operators have to make their requirements clearer or vendors have to pull their socks up.
We changed “required downtime” to “Unavoidable downtime” this year, in order make the question stronger. A total of 31% of respondents are still disappointed with the absence of any improvement but, again, that is the lowest negative level that we have ever recorded.
All other categories report generally positive results, and more so than in previous surveys. Performance in inventory (72% improvement) and manufacturing costs (77%) are much better than last year. It looks like it has generally been a good year for ICT vendors and their customers.
Unavoidable downtime (whether routine or unscheduled)
Manufacturing costs
Customer satisfaction
A significant improvement
A significant improvement
A moderate improvement
A moderate improvement
No improvement
No improvement
60%
40%
20%
0%
A significant improvement
A significant improvement
A moderate improvement
A moderate improvement
No improvement
No improvement
80%
100%
60%
40%
20%
0%
MANUFACTURINGREPORT2016ANNUAL
12
13
Which of the following phrases best describes the nature of your IT deployment at your company?
Thinking of your company’s customer relations management (CRM), will you (or have you) implement(ed) new software solutions to achieve any of the following? (Mark as many as apply).
INFORMATION, COMMUNICATION, TECHNOLOGY
Is ICT strategic or tactical? Overwhelmingly, the answer is that its deployment is part of a “company-wide strategy”; 64% of respondents said so. This is down from last year’s 69% but around the same percentage (15%) as last year (16%) actually select “Tactical rather than strategic” as their answer.
We added a fourth answer for respondents to choose: “Responsive rather than pro-active”. Do companies initiate ICT projects because they have to or because they want to? 10% said that they were responding to events, rather than driving them.
Once again, CRM is not respondents’ top ICT priority but it remains important. This year’s results are broadly in line with previous years’, with some notable exceptions
Delivering higher levels of customer service remains the main objective for the majority (51%), and at about the same level as 2014 (53%). Seeking to improve/maintain customer loyalty follows and is getting close to the top spot, with 46%. Increasing sales productivity has taken a march forward as well, rising from 38% in 2014 to 44% this year.
Improved marketing of new products and services is also up, at 39% (33% in 2014), while targeting new market segments/increasing market share slips a little, from last year’s 36% to 33%.
The big mover is “Drive development of new products and services”. It has leaped from 16% last year – and only 6% in 2013 – to 28% now. One would expect effective CRM to feed back into product development and its low level over the past two years has a been a bit of a puzzle. We will have to wait to see if it will be sustained in the future.
There are two notable fallers in this year’s chart. “Improve distribution/delivery times” is down from 22% to just 13 – which could indicate that manufacturers have got their logistics under control, after several years of effort. The other one that has gone down is “Don’t know”, which was selected by just 5% - well down on previous years’ responses, which were in the upper-mid teens. But we did add another category: “We do not have a CRM system”. This was selected by 23% of all respondents.
We have checked and no, they did not select any other categories!
2015
2014 2013 2012
Company-wide strategy
Departmental strategy
Tactical rather than strategic
Responsive rather than pro-active 10%
12%22%16%
15%
16%17%16%
10%
72%61%69%
64%
60%40% 50%20% 30%10%0%
Improved marketing of new products and services
Drive development of new products and services
Deliver higher levels of customer service
Improve/maintain customer loyalty
Target new market segments / increase market share
Deliver service support to customers
Improve distribution/delivery times
Increase sales productivity
Don’t know
We do not have a CRM system
2012 2013 20152014
64%
“Delivering higher levels of customer service remains the main objective for the majority”
MANUFACTURINGREPORT2016ANNUAL
INFORMATION, COMMUNICATION, TECHNOLOGY
14 15What do you believe are the current major barriers to investment and implementation of IT within your organisation? (Mark as many as apply).
Thinking about your IT infrastructure as a whole, to what extent do you use open source software? (eg. Linux, MySQL, Apache, LibreOffice etc).
For more than half (54%) of respondents, cost remains the biggest obstacle to investment and implementation of ICT. This has remained at about the same level ever since we started asking, with a spike to 61% two years ago. As the government raised the Annual Investment Allowance to £500,000 for nearly two years, this has to be a disappointment. ICT is essential in the drive to raise productivity but it still appears to be a chicken and egg situation.
Almost as many (46%) respondents mentioned employee attitudes/resistance to change. This concern seems to fluctuate, year to year; it hasn’t settled into a pattern.
Lack of confidence or understanding of the potential ROI is also high, at 41%.
On the bright side, insufficient management buy-in remains below 30% - at 28%, in fact. Concern about lack of skills has fallen markedly, from 36 to 21%. This is probably to be expected, as there is no shortage of people offering integration and implementation services. The perceived overall risk of such a project in current economic circumstances is mentioned by the same proportion: 21%.
Concerns about obsolescence, previous poor experiences and unmatched technology are mentioned by a smattering across the sample, adding up to 10% in each case.
Fewer than one in 10 (8%) said that they neither experienced nor envisaged barriers to investment and implementation of IT projects.
Even fewer (29%) respondents this year said that they use open source software. The total has actually declined, year on year; it was 56% in 2013, then 40% last year. However, customers and collaborators from the other end might have a different story to tell as it is not unknown for error messages to mention Apache, MySQL or something else. However, our respondents tend to be users of the software, rather than technical experts.
Just over one-fifth (21%) of respondents recognise that they might well use such systems in the future but more than half (51%) said that they don’t and have no plans to.
2015
We don’t use it, and have no plans to
We don’t use it, but recognise that we might in the future.
We do use it in certain aspects of our operations.
We consider ourselves to be sophisticated users of open source, deploying it wherever it suits our business.
51%
21%
26%
3%
20132014
51%
28%
17%
50%
6%
31%
29%
36%
4%
50%36%
Lack of skills required to implement and maintain IT solutions
Insufficient management buy-in
Lack of confidence / understanding in the potential return on investment
Employee attitudes/resistance to change
Cost of investment
Overall risk of such a project in current economic times
Technology not sufficiently matched to business needs and exiting manufacturing
Previous experiences of IT projects
Pace at which technology becomes obsolete
No barriers experienced / envisaged
50% 60% 80%70%40%20% 30%10%0%
2013
2012
2014
2015
MANUFACTURINGREPORT2016ANNUAL
INFORMATION, COMMUNICATION, TECHNOLOGY
Is your business
/ future ready? /
Dell Enterprise Solutions
See how Dell future-ready solutions accelerate ideation, design & simulation, validation and manufacture.
Visit Dell.co.uk/manufacturing to Learn More.
Intel and the Intel logo are trademarks or registered trademarks of Intel Corporation or its subsidiaries in the United States and other countries.Dell and the Dell logo are trademarks of Dell Inc. registered in the United States and other countries.Dell Corporation Limited. Registered in England. Reg. No. 02081369 Dell House, The Boulevard, Cain Road, Bracknell, Berkshire, RG12 1LF, UK.
This year’s Annual Manufacturing Report finds a continuation of the trend of manufacturers showing sufficient confidence that they are prepared to invest in the future of their businesses.
Almost a third of survey respondents said that the majority of their capital investment projects are “strategic”. This is encouraging as it represents clear commitment to the future as well as a desire to place innovation at the heart of their businesses.
This year’s report shows a continuation of the focus around costs within the sector and this should come as no surprise with the various challenges manufacturers face such as increasing labour cost, margin pressure, raw material cost as well as the strength of sterling.
Access to funds has been improving over the last 12 months, with an increase in the number of respondents deeming the access to be ‘very much easier’.
Although there are more new funding alternatives available, the old favorites
such as overdrafts, loans and invoice financing remain popular. Due to the advantages of using company assets for better cash management and an improved balance sheet, asset financing and leasing remain popular after a sharp increase since 2013.
The level of satisfaction with banks’ commercial funding operations seems to be continuing its recovery, with more respondents indicating they are ‘very satisfied’. We are delighted to see these results, however, it is certainly not the time for banks to rest. Competition is as high as ever and manufacturers will continue to need their banks to be supportive as they make those key investment decisions.
At Barclays, we support our manufacturing clients by aligning our team closely with the manufacturing industry. Our Relationship Directors have gained specific expertise working across the sector for over ten years. At every stage, we can offer an experienced team that understands the challenges and opportunities that manufacturers face.
Analysis by Mike RigbyHead of Manufacturing,Transport and Logistics,Barclays
FINANCE& INVESTMENT£
MANUFACTURINGREPORT2016ANNUAL
1
2
Where is your company’s financial management agenda primarily focused?
What proportion of your company’s capital investment is strategic (i.e., for development/expansion) rather than replacement?
FINANCE & INVESTMENT
The Finance and Investment section of the Annual Manufacturing Report provides an insight into the leading areas of companies’ current focus, as well as concerns and intentions for the future. It has in the past offered early warnings on the ease of obtaining finance – and therefore on investment trends, as well as indicating changes in tastes for funding sources.
It is clear that UK manufacturing companies are no longer investing for maintenance.
Strategic investment is investment for growth. A total of 43% of respondents said that more than half of their investment is strategic, rather than replacement, which is down from last year’s 57% and extends a gentle downward trend for a third year. However, a further 26% reported that between a quarter and a half of their investment is strategic. Less than 10% said that they were not making any strategic investment at all at the moment.
Cost control continues to be the major concern, followed by increasing cash flow, which more respondents (38%) mentioned this year than 12 months ago (24%). Raising money for investment remains in third place but was mentioned by just over one in 10, well down from last year’s 18%. That was a peak in all years since we started asking the question, back in 2008.
Reducing debt has declined in importance; only four per cent of respondents selected it. About the same number reported concerns about exchange rate fluctuations. This is not in accord with wider reports and anecdotal evidence from elsewhere. The appreciation of Sterling against the Euro in particular is a significant factor for exporters. It could be that respondents interpreted ‘fluctuation’ very literally; things have trended pretty steadily in one direction for the past year or so.
2015
20132012
2011201020092008
2014 2015
60%
60%
50%
50%
10%
10%
0%
0%
20%
20%
30%
30%
40%
40%
Reducing costs generally
Increasing cash flow
Raising money for investment
Reducing debt
Exchange rate fluctuations
100%
75-99%
50-74%
25-49%
1-24%
None
20092008 2010 2011 2012 2013 2014 2015
45%said that more than half of their company’s capital investment is strategic
“The appreciation of Sterling against the Euro in particular is a significant factor for exporters”
MANUFACTURINGREPORT2016ANNUAL
3 What is your company’s level of capital investment in the following areas likely to be during this CURRENT financial year (2015/16)?
FINANCE & INVESTMENT
Property and buildings will, by their nature, tend to involve large amounts of money so it is not surprising to find they are strongly represented in the £500,000-plus segment. However, it appears that New Product Development is also receiving significant funding; it features quite strongly in the £50,000 and above responses. This underlines the trend towards strategic investment.
A wide variety of projects attract lower levels, at £10,000 and less, with Facilities upgrade for H&S and regulatory compliance, and handling and storage equipment leading the field. IT/Computer systems, both hardware and software, feature strongly in the up to £50,000 levels. Machine tools have not attracted as much higher-level investment as previously but it should be noted that New Product Development was formerly included. It has been deliberately separated this year.
Under £10,000
£10,000 – £50,000
£50,000 – £100,000
£100,000 – 500,000
Over £500,000
60%20% 40%0%
Machinery/machine tools (inc new production
facilities)
IT equipment/computer hardware and software
Property/buildings
Handling and storage equipment
New product development
2014
2015
60%20% 40%0%
Machinery/machine tools
(inc new production facilities)
IT equipment/computer
hardware and software
Property/buildings
Handling and storage equipment
New product development
2013
“Commitment to New Product Development underlines the trend towards strategic investment”
Machine tools
IT/Computer hardware
IT/Computer software and systems
Property/buildings
Handling and storage equipment
New product development
Facilities upgrade for Health & Safety/regulatory
compliance
Other capital investment
No major expenditure planned
60% 80%20% 40%0%
MANUFACTURINGREPORT2016ANNUAL
FINANCE & INVESTMENT
4
5
6
Which capital-raising methods has your company used in the past TWO years? (Mark as many as apply).
Are your company’s investments levels in the following areas THIS year (2015/16) more, less or about the same as last year?
Do you expect that your company will be investing more, less or about the same NEXT year (2016/17) in the following areas?
While it continues to be the case that more than half of respondents look to their own resources to finance capital investment, there are also signs of a return to more traditional bank funding and indications of resilience as manufacturers seek to build their asset levels.
The use of overdrafts (32%) has recovered strongly from last year’s 20% level, which looked at the time like an ongoing decline. Asset Finance stands at about the same level and HP/leasing come in at 26%. The latter is actually the same thing as ‘Asset finance’ but the two cannot be added together as respondents were asked to indicate all methods that they had used.
Bank loans and invoice financing/discount finance also enjoyed the support of a quarter. Equity finance, venture capital, “peer to peer” and crowdfunding remain at low levels. Flotation and sale of stock were not mentioned by any.
Overall, the level of strategic investment funding has remained consistent. All the major banks have made clear that they have an appetite for the manufacturing sector.
Company reserves
Overdraft
Asset Finance
Bank loan
Hire Purchase/Leasing
Invoice Financing/Discounting
Personal loans
Venture capital
Equity scheme
Peer-to-peer/Crowd funding
Flotation/sale of stock
2013
60%
80%
20%
40%
0%
2015
60%
80%
20%
40%
0%
Less
Same
More
Don’t know
2014
60%
20%
40%
0%
60%
80%
20%
40%
0%
Less
Same
More
Don’t know
Less
Same
More
Don’t know
Machinery/machine tools (inc new production facilities)
IT equipment/computer hardware and software
IT/Computer hardware
IT/Computer software and systems
Property/buildings
Handling and storage equipment
New product development
No major expenditure planned
Facilities upgrade for Health & Safety/regulatory compliance
Other capital investment
Don’t know
IT/Computer hardware
IT/Computer software and systems
Property/buildings
Machine tools
New product development
Handling and storage equipment
Facilities upgrade for Health & Safety/regulatory compliance
Other capital investment
20132012 2014 2015
2015
2014
2015
60% 100%20%0%
2013
MANUFACTURINGREPORT2016ANNUAL
FINANCE & INVESTMENT
7 Thinking ahead for the next FIVE years, what do you anticipate being the major areas of capital investment for your company?
What sort of trends or patterns are emerging in business investment?
In general, investment levels are higher and are focused on longer-term, strategic areas. Once again, IT/computer hardware, software and systems, and new product development, seem to be attracting more investment. The growing levels of investment in new product development reflect the increasingly innovative nature of the UK’s manufacturing sector.
Machinery and machine tools have fallen back somewhat; 43% said they were spending more in this area in 2014 than in the previous year but only 25% say that is the case in this year’s survey.
This trend is expected to continue. Looking ahead, the area in which the largest proportion of respondents (38%) expect to see an increase in spending is, once again, new product development. Elsewhere, the survey finds that investment levels are expected to stay largely at the same level as this year in IT/computer hardware (64%). The area most likely to see less investment is handling and storage equipment (35%), followed by IT/Computer software and systems.
Nearly 40% of respondents expected to see more expenditure this year on machinery and machine tools but only 25% actually did. Almost one-third (31%) expected that this year would see higher investment in new product development and even more (38%) actually did.
Looking further ahead into medium-term planning, new product development emerges once again as the likely lead beneficiary of budget increases; 47% of respondents said that they expected to increase expenditure in this area. IT equipment – both computer hardware and software – follows, with almost half (43%) expecting to spend more.
2013
2013
2015
2014
2014
60%
50%
50%
50%
60%
40%
40%
80%
80%
100%
100%
100%
100%
100%
20%
20%
0%
0%
0%
0%
0%
Machinery/machine tools(inc new production facilities)
IT equipment/computer hardware and software Property/buildings
Handling and storage equipment
New product development
Machinery/machine tools(inc new production facilities)
IT equipment/computer hardware and software Property/buildings
Handling and storage equipment
New product development
Machinery/machine tools(inc new production facilities)
IT equipment/computer hardware and software Property/buildings
Handling and storage equipment
New product development
Machinery/machine tools(inc new production facilities)
IT equipment/computer hardware and software Property/buildings
Handling and storage equipment
New product development
Machinery/machine tools(inc new production facilities)
IT equipment/computer hardware and software Property/buildings
Handling and storage equipment
New product development
Less
Same
Less
Same
More
Don’t Know
More
Don’t Know
MANUFACTURINGREPORT2016ANNUAL
FINANCE & INVESTMENT
8
9
What proportion of your production is outsourced?
Is your level of outsourcing likely to increase or decrease over the next 12 months?
0-10%
10-20%
20-30%
30-40%
more than 40%
Don’t know
Funding inaccessible
Funding difficult to obtain
No change
Funding obtained more easily
Funding very much easier - more sources, more choice
Not applicable - no funding sought
60% 60%
60%
70%
50%50%
30%
30%10%
10%
80%
80%
20%
20%
20%
40%
40%
40%
0%
0%
0%
2013
2013
2012
2012
2011
2011
2010
2010
2014
2014
2015
2015
Responses to this question have been broadly similar over the past five years. It is an area that remains important to some companies in manufacturing but the days of large-scale outsourcing appear to be in the past. Less than 10% of production is outsourced by the majority (62%). While around a fifth (19%) of respondents expect to see more outsourcing in the short term, the overwhelming majority (70%) expect things to stay much the same.
The dark days of the credit crunch are now behind us. The percentage of respondents saying that funding is easier, much easier or no more difficult (no change) to obtain in 2015, compared with previous years, is at the highest level (61% total) that this survey has ever recorded. “No change” is at its highest level since the first survey, in 2008 – just before the credit crunch hit and things became much harder.
Adverse conditions reached their nadir in 2010-12. We saw a steady recovery in the recorded levels of those finding funding easier, or very much easier, to obtain up to a peak of 21% in 2013 – the year that it and ‘harder/much harder’ crossed over. The proportion saying funding is harder to obtain is at its lowest level since 2009 and the number saying they are not looking for funding is also at an historically low level.
Easier access to funding appears now to be the norm; businesses are responding to the improved conditions with more investment.
Increased
Decrease
Stay the same
Don’t know
10 How easy has it been for your company to obtain necessary funding in 2015, compared with previous years?
20092008 2010 2011 2012 2013 2014 2015
“The days of large-scale outsourcing appear to be in the past”
MANUFACTURINGREPORT2016ANNUAL
“Relationships with the main commercial banks and lending institutions appear to be improving”
2010 2011 2012 2013 2014 2015
60%
80%
100%
110%
20%
40%
0%
FINANCE & INVESTMENT
UK manufacturers’ opinions of – and therefore, one suspects - relationships with the main commercial banks and lending institutions appear to be improving. In the case of the lenders, of whatever sort, the improvement is by a whisker over last year (70% to 69% “excellent” or “good”) but this generally sustains the pre-recession levels recorded last year, which were the highest since we started the survey.
The banks say they have been putting a lot of effort into improving their range of services and their flexibility and their efforts now seem to be bearing fruit. Most respondents (77%) are either indifferent or satisfied with the range of funding options offered by their banks, which represents a complete reversal from the depths of 2011 (76% indifferent/dissatisfied) and 2013 (74%).
The responses are actually a little better even than first overview would indicate. Those saying they are “very satisfied” are, at 17%, the highest level we have ever recorded. The “indifferent” level of 40% is an improvement; it is also the highest level ever recorded and the boost seems to be coming more from the negative wing, which is declining.
Responses overall in these areas – on which the banks are clearly focusing – are the strongest since the very first Annual Manufacturing Report in 2008.
11
12
How do you rate the level of service/advice provided by your current lender?
How satisfied are you with your bank’s range of commercial funding options?
Excellent
Good
Average
Poor
2010
42% 37% 11% 11%
2011
38%25% 19% 13%6%
2012
37% 2%9% 13%39%
2013
37% 10%10% 16% 26%
2014
29% 12%12% 31% 16%
2015
40% 13%17% 19% 11%
Very satisfied
Moderately satisfied
Indifferent
Moderately unsatisfied
Very unsatisfied
MANUFACTURINGREPORT2016ANNUAL
FINANCE & INVESTMENT
13
14
To what extent can your company assess its return on major capital projects?
What is your company’s typical required payback (ROI) period for a major investment?
2009
2009
2010
2010
2011
2011
2012
2012
2013
2013
2014
2014
2015
2015
60%
60%
70%
80%
50%
50%
10%
10%
20%
20%
30%
30%
40%
40%
0%
0%
Part of manufacturers’ relationship with their financial partners is in their own hands. Banks expect businesses to have clear and consistent monitoring and management measures in place and for them to have realistic strategies and approaches. The indication is that both are increasingly in place and it is worth highlighting that the number of companies seeking ROI within 12 months has declined to zero. This is evidence that manufacturers are adopting a more realistic and strategic approach.
The companies who said that they can achieve full financial ROI quantification is at the highest recorded level since 2009. The quality of assessment can be perceived to have risen since then, with increased and wider adoption of relevant ISO standards, so this year’s 28% mark may in fact be the highest level ever recorded.
The second highest level - most benefits quantified financially but not all - is at the lowest percentage (32%) since 2009 but the total of the top two, at 70%, should give banks and lending organisations confidence that manufacturers understand the importance of financial discipline and can deliver it.
Those who do not have a process for monitoring ROI seem to be declining in number, which suggests that a more structured approach is being taken.
When it comes to expected ROI, manufacturers are clearly adopting realistic positions. None expect full return within 12 months. The bulk of respondents - 64% - look for ROI within two to four years, which is consistent with findings elsewhere in the Report. This is also in keeping with lifecycles in, for example, the auto industry. Fifteen per cent have longer horizons and nine per cent set no ROI targets at all, which could make it hard to present a credible case to their financial partners.
“Manufacturers are adopting a more realistic and strategic approach”
“64% look for ROI within 2-4 years”
Full financial ROI (return on investment) quantification on all investments
Most benefits are quantified financially, but not all
Some ROI quantification
Mainly operate qualitative assessments
We have no process for monitoring ROI
No such targets usually set
12 months or less
1 - 2 years
2 - 4 years
4 - 7 years
More than 7 years
MANUFACTURINGREPORT2016ANNUAL
FINANCE & INVESTMENT
15 Over the past 12 months, has your spending changed in the following areas?
Finally, we look for trends in areas that manufacturers are increasing spending, and therefore where their priorities for the immediate future appear to lie. Once again, marketing enjoyed the largest increase in spending. This has been the case since we first asked the question, in 2012. However, the proportion saying that expenditure in this area had increased was the smallest ever recorded, at a little over 40%.
All the areas that are showing clear increases are sales related. The area that is reported by the largest percentage to have seen reduction in expenditure is Conferences, at just under a third – which is perhaps surprising. However, it has shown reasonably strong performances in the previous two years so this may be a blip. “Social” and HR perks continued their trend of reduction, albeit at a slower rate than previously recorded, in the case of HR.
The overall impression is that UK manufacturers are running increasingly tight ships and spending in all these areas continues to be closely scrutinised.
“All the areas that are showing clear increases are sales related”
2012
Marketing
Advertising
HR Perks
Employee Bonuses
Travel
Conferences
Social
2013
Marketing
Advertising
HR Perks
Employee Bonuses
Travel
Conferences
Social
60% 80%20% 40%0%
60% 80%20% 40%0%
Marketing
Marketing
Advertising
Advertising
HR Perks
HR Perks
Employee Bonuses
Employee Bonuses
Travel
Travel
Conferences
Conferences
Social
Social
2014
2015
60%
60%
80%
80%
20%
20%
40%
40%
0%
0%
Increase Stay the same Decreased
Barclays is a trading name of Barclays Bank PLC and its subsidiaries. Barclays Bank PLC. Authorised by the Prudential Regulation Authority and regulated by the Financial Conduct Authority and the Prudential Regulation Authority (Financial Services Register No. 122702). Registered office: 1 Churchill Place, London E14 5HP. September 2015. MCT204. *Lines are open Monday to Friday 8pm to 6pm. To maintain quality service we may monitor or record phone calls. Local mobile call charges apply.
A springboard for success.Working with Harrison Spinks to achieve global expansion and diversification.
Pocket spring manufacturing line, Leeds Simon Spinks, MD, Harrison Spinks Alex Pryce, Relationship Director, Barclays
Luxury bed and mattress manufacturer Harrison Spinks are expanding internationally, applying their innovative spring technology to new products such as baby mattresses, footwear and automotive seating. Barclays meets all their corporate banking needs, providing a dedicated relationship team with detailed knowledge of the manufacturing sector. As Simon Spinks, MD, says, “We’re currently a mattress manufacturer that makes spring components. With Barclays’ support we’ll become a truly global components manufacturer.”
Call 0800 015 8642* or visit barclays.com/corporatebanking to find out how we can help your business succeed.
MCT204 MTL Advert.indd 1 03/11/2015 20:46
In association with
The Manufacturer and Hennik Research would like to thank all of the Annual Manufacturing Report’s sponsors. Without their insight and support, this report would not be possible.
Sponsored by
Hennik ResearchElizabeth House, Block 2, Part 5th floor39 York Road, London, SE1 7NQT: +44 (0)20 7401 6033www.hennikgroup.com