31
www.pwc.com Manufacturing Barometer Business outlook report July 2014

www.pwc.com
Manufacturing Barometer
Business outlook report July 2014
Manufacturing Barometer: Business outlook report PwC
2
Contents
1 Quarterly highlights Page 1.1 Key indicators for the business outlook 5 1.1 Manufacturing current assessment and outlook indices 6 2 Economic views 2.1 View of US economy, this quarter 9 2.2 View of US economy, next 12 months 10 2.3 View of world economy, this quarter 11 2.4 View of world economy, next 12 months 12 3 Company performance 3.1 Company revenue growth, calendar year 14 3.2 Industry growth, calendar year 15 3.3 International sales 16 3.4 Changes in gross margins 17 3.5 Changes in costs and prices 18 3.6 Inventory movement 19 3.7 Level of operating capacity 20 4 Business outlook, next 12 months 4.1 Revenue growth, next 12 months 22 4.2 International sales, next 12 months 23 4.3 Percent planning to hire 24 4.4 Percent planning to hire by type of employee 25 4.5 Percent planning major new investments of capital 26 4.6 Percent planning to increase operational spending 27 4.7 Expected barriers to business growth 28 4.8 Plans for M&A and other business initiatives 29 5 Survey demographics and research methodology 30
Manufacturing Barometer: Business outlook report PwC
3
Quarterly highlights
Key findings:
In the second quarter of 2014, PwC interviewed 60 US-based industrial manufacturing executives about their current business performance, their views on the state of the economy, and their expectations for business growth over the next 12 months. We then compared their responses with results from prior quarters to see how the panel’s 12-month outlook has changed.
After a difficult first quarter 2014, with US GDP dropping to 2.9 percent (due in part to weather), optimism among industrial manufacturers decreased six points to a still largely positive 65 percent. Optimism about the global economy’s prospects declined 3 points to 38 percent. Panelists remain optimistic about the US economy but are mostly uncertain (57 percent) about the world economy.
Own company 12-month revenue targets remained moderately high at 5.2 percent average rate of growth, on pace with the prior quarter (5.3 percent), but above a year ago (4.6 percent). International sales retained their momentum, with 32 percent prospective revenue contribution among those selling abroad.
A strong rebound in longer-term CAPEX spending plans was reported – up 13 points to 52 percent, and with a sustained level of investment, 5.7 percent of sales. Shorter-term operational spending remained high, with 75 percent planning increased spending – led by R&D, new product or service introductions and IT, and a rise in business acquisitions. Planned M&A activity was up eight points to 38 percent, with most planning purchase of another business (35 percent).
New hiring plans are mixed. Fewer firms plan to hire over the next 12 months (48 percent, off 8 points), but the net workforce increase of +0.5 percent was on pace with the last two quarters.
The major headwind to growth is now seen by panelists as legislative/regulatory pressures, up 9 points to 47 percent. Concern about lack of demand remained high, in second place, cited by 42 percent.
Gross margins in Q2 2014 slipped a bit but remain positive. Both costs and prices were higher. Concern about profitability over the next 12 months remained moderately high (27 percent), three points above a year ago.
• Optimism positive in US, uncertain about worldwide economy. Optimism among industrial manufacturers about the US economy’s prospects over the next 12 months dropped 6 points to 65, only 2 points higher than a year ago. None were pessimistic, and 35 percent were uncertain. Perceptions of the US economy growing in Q2 2014 was at 68 percent, 11 points below the prior quarter.
Optimism about the world economy’s prospects among industrial manufacturers who market abroad dropped 3 points to 38 percent, although it was higher than a year ago (31 percent). Five percent are pessimistic and a majority, 57 percent, remain uncertain about global prospects.
• Own-company revenue growth forecasts continued. Own-company revenue forecasts for the next 12 months continued at 5.2 percent, on pace with last quarter’s moderately high 5.3 percent pace of growth. A year ago, 12-month forecasts were lower at 4.6 percent, and calendar year 2014 is forecast at a lower 4.5 percent growth rate. Looking ahead, 77 percent expect positive revenue growth for their own companies over the next 12 months, with 9 percent forecasting double-digit growth and 68 percent forecasting single-digit growth. None forecast negative growth, 15 percent zero growth, and 8 percent were not reported.
• International sales retain momentum. Despite some drop-off in optimism about the world economy’s prospects, quarterly sales among international marketers remained in an upward movement: 25 percent reported an increase in international sales in Q2 2014 (off 5 points) and 14 percent reported a decrease (4 points higher), for a net 11 percent increasers. The expected contribution of international sales to total revenues among those selling abroad over the next 12 months continued at 32 percent, reflecting a sustained positive movement.
• Fewer hiring, but overall workforce gains. Forty-eight percent of industrial manufacturers plan net new hiring over the next 12 months, 8 points below the prior quarter, but 6 points above a year ago (42 percent). Only 7 percent plan to reduce the number of full-time equivalent employees, and 45 percent will likely stay about the same. The total net workforce projection for the next 12 months is a plus 0.5 percent additional workers, similar to last quarter (0.4 percent) but below a year ago (0.9 percent). The most sought after employees will be skilled labor (32 percent), followed by production workers (27 percent) and professionals/technicians (20 percent). Plans to hire sales/marketing employees remain more limited (8 percent), indicative of slow expansion.
• CAPEX and budget spending high. A majority, 52 percent, of US industrial manufacturers plan major new investments of capital over the next 12 months, up 13 points from the prior quarter’s 39 percent and a year ago (40 percent). Their mean investment as a percentage of total sales was a moderate 5.7 percent, above the 5.4 percent in the prior quarter, and well above the 4.0 percent a year ago – indicative of spending increases in the year ahead.

Manufacturing Barometer: Business outlook report PwC
4
Operational spending increases in 2014 are planned by 75 percent of respondents. Leading increased investment areas will be new product or service introductions (43 percent), information technology (33 percent), and R&D (45 percent). Increased spending on geographic expansion was cited by 22 percent, up 7 points higher than a year ago. Marketing and sales promotion remained low (5 percent), and few plan increases in advertising (5 percent) – also indicative of slow expansion.
M&A activity is on the rise, planned by 38 percent (up 10 points) in the year ahead, focused on purchase of another business (35 percent), sale of part/all of own business (8 percent), or an equity carve-out/spin-off (3 percent). Expansion to new markets abroad was off sharply to 12 percent (off 6 points), with new facilities abroad at 10 percent.
• Headwinds to growth shifting. The major headwind to growth over the next 12 months is now seen as legislative/ regulatory pressures, rising 9 points from a low last quarter to 47 percent, but below a year ago. Concern about lack of demand was second, cited by 42 percent (off 2 points). Consistent this quarter were decreasing profitability (27 percent), oil/energy prices (28 percent) and taxation policies (25 percent). Lower were capital constraints (17 percent, off 11 points). Lack of qualified workers was off slightly to 25 percent.
• Margins positive, costs and prices increased. In Q2 2014, gross margins were higher for 25 percent and lower for 17 percent – a net plus 8 percent higher, but below the prior quarter (+18 percent). Costs were higher: up for 25 percent, lower for 8 percent, higher than a year ago. And prices remained notably flexible: 25 percent up, 8 percent down, a net 17 percent higher (5 points below a year ago). Looking ahead, decreasing profitability over the next 12 months was cited by 27 percent as a potential barrier (up 3 points from a year ago).
A quarter-over-quarter comparison of key indicators shows the business outlook for the next 12 months and how the views of the panel have changed each quarter (see chart 1.1). The pages that follow provide a detailed look at each question for the past five quarterly surveys.

Manufacturing Barometer: Business outlook report PwC
5
Business outlook, next 12 months among industrial manufacturers 2013 2014 Change Page
2Q ’13 3Q ’13 4Q ’13 1Q ’14 2Q ’14 1Q – 2Q ’14
Optimistic about US economy 63% 60% 68% 71% 65% 11
Optimistic about world economy 31% 40% 47% 41% 38% 13
Expect positive revenue growth 82% 82% 85% 82% 77% 23
Average growth rate expected 4.6% 4.2% 5.4% 5.3% 5.2% = 23
Planning major new investments 40% 48% 43% 39% 52% 27
New investments as a % of sales 4.0% 6.5% 4.8% 5.4% 5.7% 27
Planning to hire 42% 58% 60% 56% 48% 25
New workers as a % of workforce (net) 0.9% 0.7% 0.5% 0.4% 0.5% = 25
Expected barriers to growth:
• Legislative/regulatory pressures 53% 58% 47% 38% 47% 29
• Lack of demand 47% 45% 42% 44% 42% = 29
• Competition from foreign markets 30% 32% 27% 25% 28% 29
• Oil/energy prices 22% 28% 25% 26% 28% = 29
• Decreasing profitability 24% 15% 20% 28% 27% = 29
• Lack of qualified workers 13% 22% 20% 28% 25% 29
• Taxation policies 32% 22% 22% 23% 25% = 29
• Capital constraints 13% 20% 17% 28% 17% 29
• Monetary exchange rate 15% 13% 12% 18% 15% 29
• Pressure for increased wages 10% 8% 10% 12% 7% 29
• Higher interest rates 10% 13% 5% 8% 3% 29
Key indicators for the business outlook
Chart 1.1 Key indicators for the business outlook
A quarter-over-quarter comparison of the survey’s key indicators shows how the 12-month outlook has changed each quarter. The change column indicates the movement of opinion of those surveyed over the past two quarters.

Manufacturing Barometer: Business outlook report PwC
6
PwC global manufacturing current assessment and outlook indices
Most components of the current assessment and outlook indices remained in-line with their longer-term and post-recession averages with a few notable exceptions. For example, assessments of current pricing and gross margins both dipped in the second quarter. Since fewer respondents indicate that costs were up this quarter, gross margin contraction seems to be explained by a relative lack of pricing power. This is interesting because, for most of the two years prior, increasing numbers of executives had indicated that prices were rising. So while sentiment toward pricing has shifted, we are hesitant at this point to interpret it as the harbinger of a sustained reversal.
Respondents’ optimism toward the global economy remains relatively weak, with a decline in those who believe that the global economy is growing or is expected to grow over the next year. In addition, the relative optimism over the current and future prospects of the US economy has continued. We shared
last quarter that this divergence in assessments of US and global economic performance was likely the result of anchoring. We also note that general macroeconomic measures would tend to support a view that the US manufacturing sector is outperforming several other major economies.
We close with a positive note from this quarter’s survey. Executives told us during the second quarter that they have boosted, and are planning to further increase, capital expenditures. This spending had lagged an improvement in other forms of spending in recent quarters. Whether this is a type of mean reversion in the form of delayed replacement CAPEX or it represents an expansion of total production is yet unclear. However, it is encouraging that the majority of manufacturers now expect to make major investments over the next year, and this percentage has reached a level not seen since early 2012.
0
10
20
30
40
50
60
70
80
20
07
-2Q
20
07
-3Q
20
07
-4Q
20
08
-1Q
20
08
-2
Q
20
08
-3
Q
20
08
-4
Q
20
09
-1Q
20
09
-2
Q
20
09
-3
Q
20
09
-4
Q
20
10 -
1Q
20
10 -
2Q
20
10 -
3Q
20
10 -
4Q
20
11 -
1Q
20
11 -
2Q
20
11 -
3Q
20
11 -
4Q
20
12 -
1Q
20
12 -
2Q
20
12-3
Q
20
12-4
Q
20
13-1
Q
20
13-2
Q
20
13-3
Q
20
13-4
Q
20
14-1
Q
20
14-2
Q
Global Manufacturing Current Assessment Global Manufacturing Outlook

Manufacturing Barometer: Business outlook report PwC
7
PwC global manufacturing current assessment and outlook indices
Background/methodology
PwC has surveyed global manufacturing executives since 2003 with the results published in our Manufacturing Barometer publication. The responses to these survey questions have been used to measure the sentiment of manufacturers by creating current assessment and outlook indices. The Global Manufacturing Current Assessment Index measures current trends in pricing, margins, employment, and capital expenditures, while the Global Manufacturing Outlook Index measures expectations for revenue, employment, operational spending, and capital expenditures. These results are calculated as a four-quarter moving average of diffusion indices which measure the degree to which their equal-weighted components move in the same direction at the same time. The indices are scaled between 1 and 100 with above 50 indicating more positive sentiment and below 50 indicating more negative sentiment.

Economic views

Manufacturing Barometer: Business outlook report PwC
9
2 0 0 0 3
26 22
28 21
29
72 78
72 79
68
0%
20%
40%
60%
80%
100%
2Q '13 3Q '13 4Q '13 1Q '14 2Q '14
Growing
Unchanged
Declining
View of the US economy, this quarter
Which best describes your view of the US economy this quarter?
In second-quarter 2014, 68 percent of US industrial manufacturers surveyed believed the US economy was growing, off 11 points from the prior quarter’s 79 percent. Three percent believed it was declining, and 29 percent saw no change from first-quarter 2014.
Economic views
Note: In 2Q 2014 total respondents = 60
Industrial manufacturers
Chart 2.1 View of the US economy, this quarter

Manufacturing Barometer: Business outlook report PwC
10
View of the US economy, next 12 months
Looking at the next 12 months, how do you feel about the prospects for the US economy?
Looking ahead, 65 percent of respondents expressed optimism about the 12-month outlook for the US economy, off 6 points from the prior quarter’s 71 percent. None were pessimistic (off 2 points), while 35 percent were uncertain. A year ago, a similar number, 63 percent, were optimistic (2 points lower).
Economic views
7 5 3 2 0
30 35 29 27 35
63 60 68 71
65
0%
20%
40%
60%
80%
100%
2Q '13 3Q '13 4Q '13 1Q '14 2Q '14
Optimistic
Uncertain
Pessimistic
Industrial manufacturers
Chart 2.2 View of the US economy, next 12 months
Note: In 2Q 2014 total respondents = 60

Manufacturing Barometer: Business outlook report PwC
11
View of the world economy, this quarter
Which best describes your view of the world economy this quarter? (international marketers only)
In second-quarter 2014, 30 percent of the panelists marketing abroad viewed the world economy as growing, a decrease of 10 points from the prior quarter’s 40 percent. Eighteen percent believed it was declining (up 6 points from the prior quarter), and 52 percent said they saw no change.
22
10 11 12 18
43 59
38
48
52
35 31
51
40 30
0%
20%
40%
60%
80%
100%
2Q '13 3Q '13 4Q '13 1Q '14 2Q '14
Growing
Unchanged
Declining
Industrial manufacturers
Chart 2.3 View of the world economy, this quarter
Note: In 2Q 2014 those marketing abroad = 56
Economic views

Manufacturing Barometer: Business outlook report PwC
12
View of the world economy, next 12 months
Looking at the next 12 months, how do you feel about the prospects for the world economy? (international marketers only)
Looking ahead, 38 percent of US-based industrial manufacturers who market abroad are optimistic about the prospects for the world economy over the next 12 months, off 3 points from the prior quarter’s 41 percent. Five percent are pessimistic (off 4 points), while 57 percent are uncertain. A year ago, only 31 percent were optimistic, 7 points lower.
Economic views
10 12 7 9 5
59 48
46 50 57
31 40
47 41 38
0%
20%
40%
60%
80%
100%
2Q '13 3Q '13 4Q '13 1Q '14 2Q '14
Optimistic
Uncertain
Pessimistic
Industrial manufacturers
Chart 2.4 View of the world economy, next 12 months
Note: In 2Q 2014 those marketing abroad = 56

Company performance

Manufacturing Barometer: Business outlook report PwC
14
Company revenue growth, calendar year
What is your company’s estimated revenue growth rate for the calendar year?
The composite average growth estimate for own-company revenue in the calendar year 2014 was at 4.5 percent, similar to the 4.6 percent in the first quarter for calendar year 2014. Seventy-five percent of respondents said they expect positive own-company growth, with 13 percent expecting double-digit growth and 62 percent single-digit growth. Eight percent were on the negative side, while 14 percent expected zero growth, and 3 percent was not reported.
3 2 1 1 3 7 8 7 7
8
17 8 12 15
14
64
69 65 62 62
9 13 15 15 13
0%
20%
40%
60%
80%
100%
2Q '13 3Q '13 4Q '13 1Q '14 2Q '14
10% or greater
Between 0 and 10%
Zero
Negative
Not reported
Mean +3.8% +4.0% +4.3% +4.6 % +4.5%
Company performance
Industrial manufacturers
Chart 3.1 Company revenue growth, calendar year
Note: In 2Q 2014 total respondents = 60
Manufacturing Barometer: Business outlook report PwC
15
Industry growth, calendar year
What is your industry’s estimated growth rate for the calendar year?
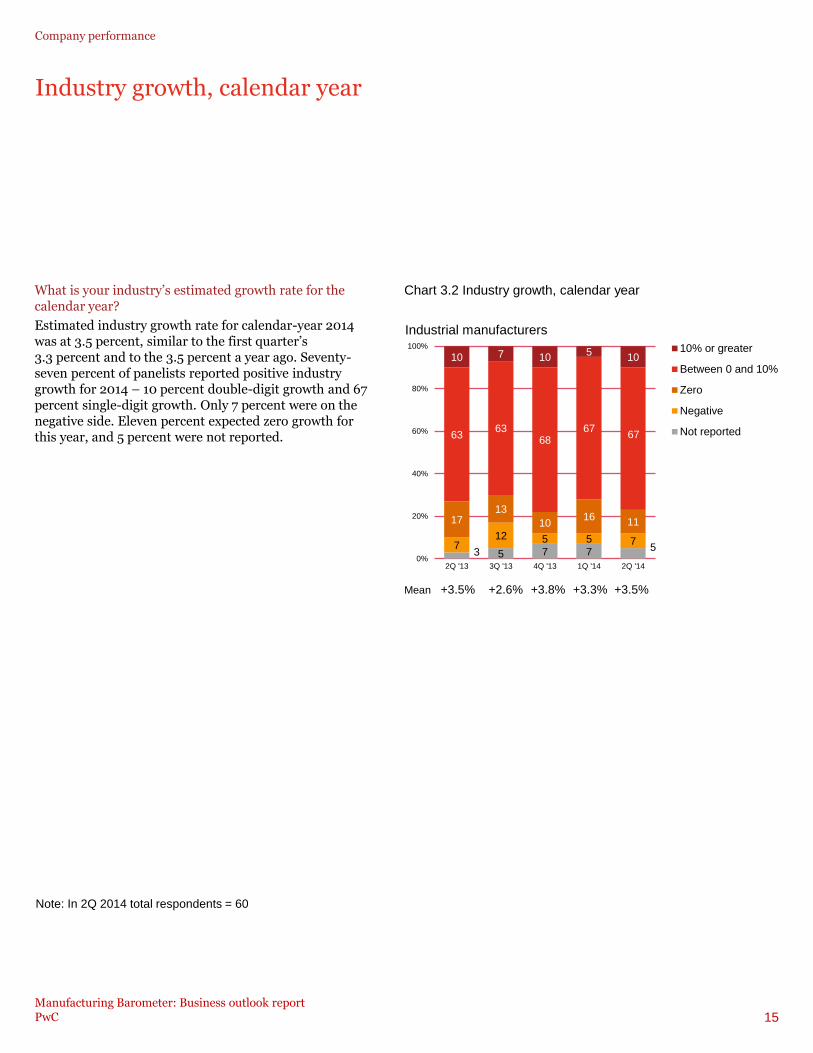
Estimated industry growth rate for calendar-year 2014 was at 3.5 percent, similar to the first quarter’s 3.3 percent and to the 3.5 percent a year ago. Seventy-seven percent of panelists reported positive industry growth for 2014 – 10 percent double-digit growth and 67 percent single-digit growth. Only 7 percent were on the negative side. Eleven percent expected zero growth for this year, and 5 percent were not reported.
Company performance
3 5 7 7 5 7 12 5 5 7
17 13
10 16
11
63 63
68 67
67
10 7 10 5
10
0%
20%
40%
60%
80%
100%
2Q '13 3Q '13 4Q '13 1Q '14 2Q '14
10% or greater
Between 0 and 10%
Zero
Negative
Not reported
Industrial manufacturers
Chart 3.2 Industry growth, calendar year
Note: In 2Q 2014 total respondents = 60
Mean +3.5% +2.6% +3.8% +3.3% +3.5%

Manufacturing Barometer: Business outlook report PwC
16
International sales
Are international sales up, down, or the same compared with three months ago? (international marketers only)
US-based industrial manufacturers that sell abroad reported a moderate positive movement in international revenue in second-quarter 2014, with 25 percent reporting an increase in sales (off 5 points), and 14 percent reporting a decrease (4 points more) or 11 percent increasers (9 points lower). The remaining 61 percent said sales stayed about the same quarter to quarter.
Company performance
14 18 12 10 14
64 64
59 60 61
22 18
29 30 25
0%
20%
40%
60%
80%
100%
2Q '13 3Q '13 4Q '13 1Q '14 2Q '14
Up
Same
Down
Industrial manufacturers
Chart 3.3 International sales
Note: In 2Q 2014 those marketing abroad = 56

Manufacturing Barometer: Business outlook report PwC
17
Changes in gross margins
Are gross margins up, down, or the same compared with three months ago?
In second-quarter 2014, gross margins were lower but remained positive. They were higher for 25 percent of panelists (off 6 points) and lower for 17 percent (up 4 points), for a net plus 8 percent, 10 points lower than the prior quarter’s plus 18 percent. Fifty-eight percent stayed about the same.
Company performance
18 15 17 13 17
57 52
55 56
58
25 33
28 31 25
0%
20%
40%
60%
80%
100%
2Q '13 3Q '13 4Q '13 1Q '14 2Q '14
Up
Same
Down
Net +7% +18% +11% +18% +8%
Industrial manufacturers
Chart 3.4 Changes in gross margins
Note: In 2Q 2014 total respondents = 60

Manufacturing Barometer: Business outlook report PwC
18
Changes in costs and prices
Are costs up, down, or the same compared with three months ago? prices?
In second-quarter 2014, costs and prices increased. Twenty-five percent of US-based industrial manufacturers reported higher costs (off 8 points), and 8 percent reported lower costs (off 4 points), for a net plus 17 percent higher, 4 points below the prior quarter’s 21 percent. On the price side, a similar 25 percent raised prices (off 8 points) and 8 percent lowered them (off 2 points), for a net plus 17 percent reporting higher prices (6 points lower than the prior quarter).
Company performance
13 13 8 12 8
62 54 70 55 67
25 33 22 33 25
0%
20%
40%
60%
80%
100% Up
Same
Down
10 5 10 10 8
58 63 60 57 67
32 32 30 33 25
0%
20%
40%
60%
80%
100%
2Q '13 3Q '13 4Q '13 1Q '14 2Q '14
Up
Same
Down
Industrial manufacturers
Costs
Prices
Net +12% +20% +14% +21% +17%
Net +22% +27% +20% +23% +17%
Chart 3.5 Changes in costs and prices
Note: In 2Q 2014 total respondents = 60
Manufacturing Barometer: Business outlook report PwC
19
Inventory movement
Are finished inventories as a percentage of sales up, down, or the same compared with three months ago?
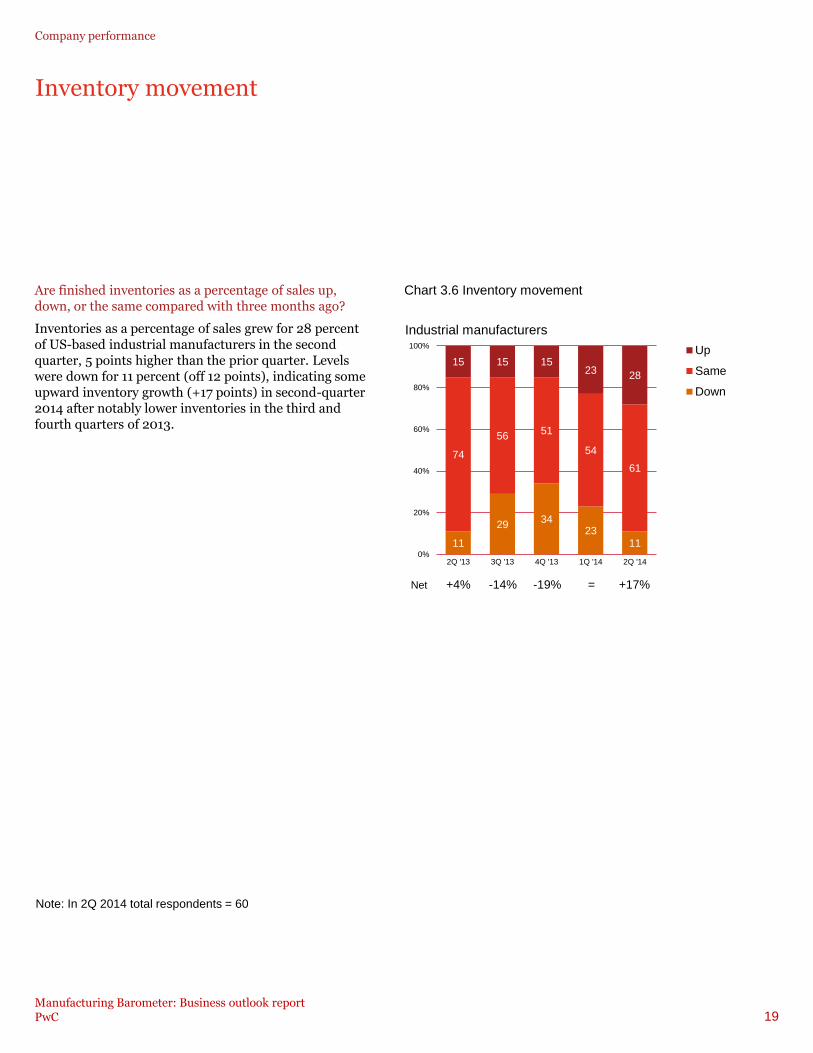
Inventories as a percentage of sales grew for 28 percent of US-based industrial manufacturers in the second quarter, 5 points higher than the prior quarter. Levels were down for 11 percent (off 12 points), indicating some upward inventory growth (+17 points) in second-quarter 2014 after notably lower inventories in the third and fourth quarters of 2013.
Company performance
11
29 34
23 11
74
56 51
54
61
15 15 15 23
28
0%
20%
40%
60%
80%
100%
2Q '13 3Q '13 4Q '13 1Q '14 2Q '14
Up
Same
Down
Industrial manufacturers
Chart 3.6 Inventory movement
Net +4% -14% -19% = +17%
Note: In 2Q 2014 total respondents = 60
Manufacturing Barometer: Business outlook report PwC
20
Level of operating capacity
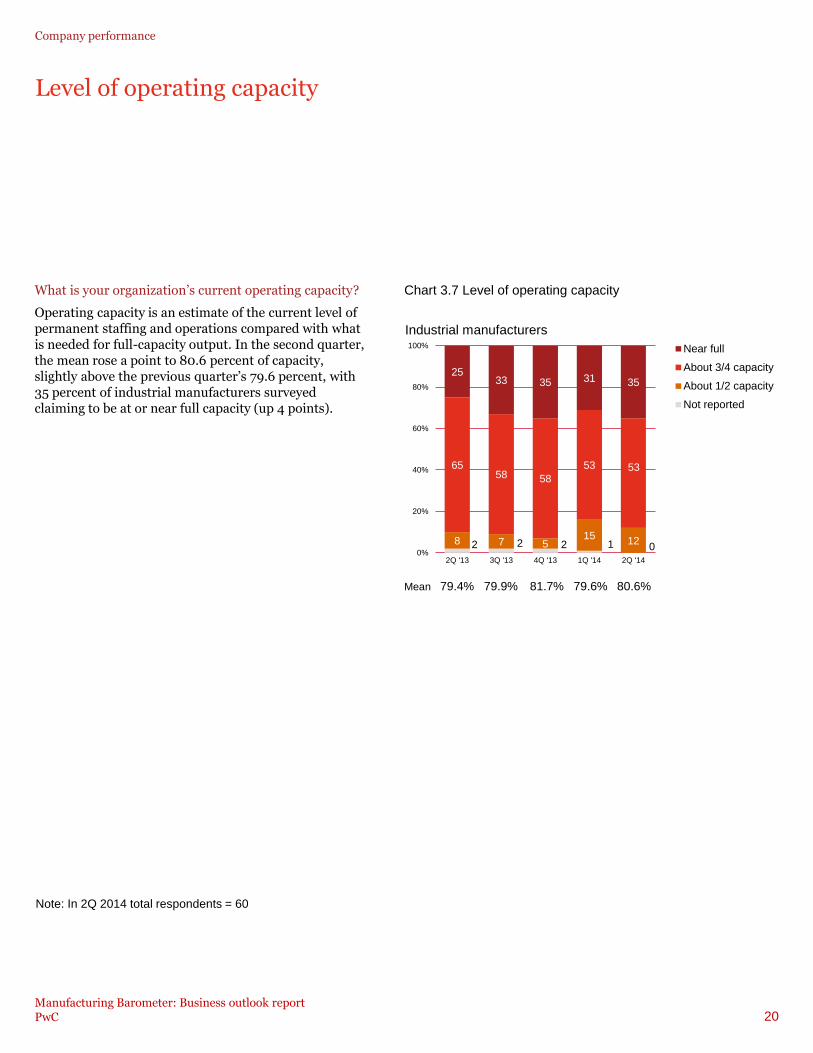
What is your organization’s current operating capacity?
Operating capacity is an estimate of the current level of permanent staffing and operations compared with what is needed for full-capacity output. In the second quarter, the mean rose a point to 80.6 percent of capacity, slightly above the previous quarter’s 79.6 percent, with 35 percent of industrial manufacturers surveyed claiming to be at or near full capacity (up 4 points).
Company performance
Industrial manufacturers
Chart 3.7 Level of operating capacity
Note: In 2Q 2014 total respondents = 60
2 2 2 1 0 8 7 5
15 12
65 58 58
53 53
25 33 35 31 35
0%
20%
40%
60%
80%
100%
2Q '13 3Q '13 4Q '13 1Q '14 2Q '14
Near full
About 3/4 capacity
About 1/2 capacity
Not reported
Mean 79.4% 79.9% 81.7% 79.6% 80.6%

Business outlook, next 12 months
Manufacturing Barometer: Business outlook report PwC
22
Revenue growth, next 12 months
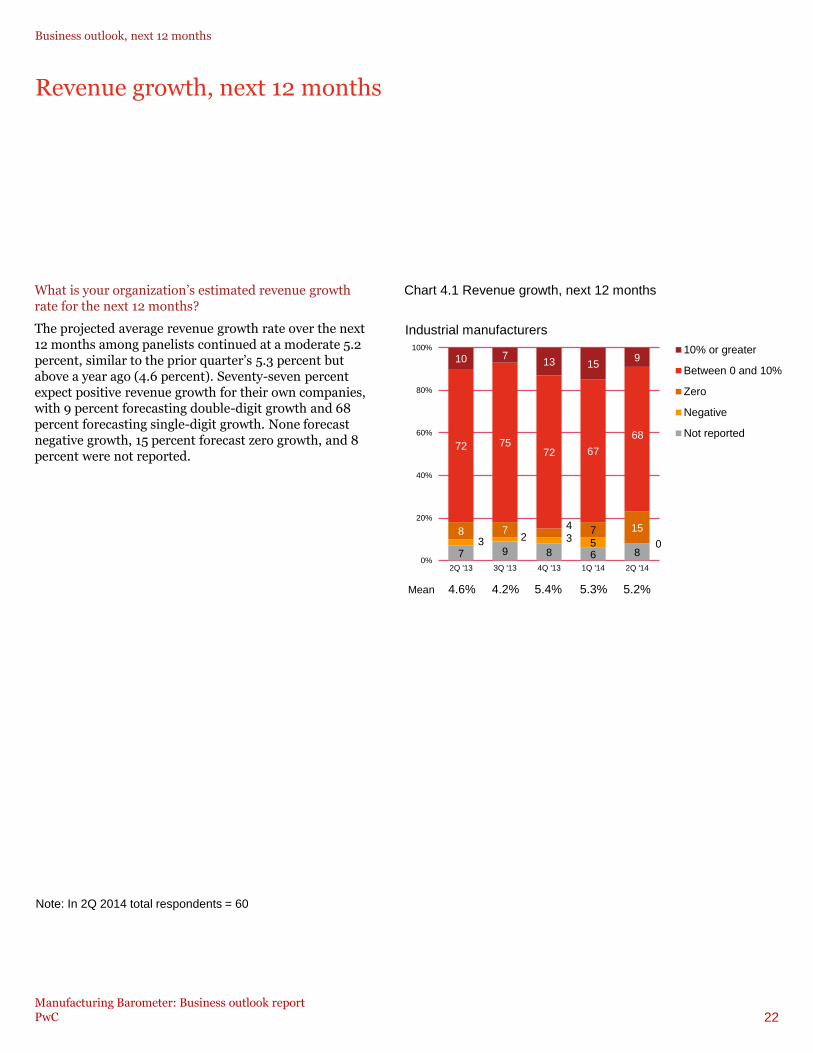
What is your organization’s estimated revenue growth rate for the next 12 months?
The projected average revenue growth rate over the next 12 months among panelists continued at a moderate 5.2 percent, similar to the prior quarter’s 5.3 percent but above a year ago (4.6 percent). Seventy-seven percent expect positive revenue growth for their own companies, with 9 percent forecasting double-digit growth and 68 percent forecasting single-digit growth. None forecast negative growth, 15 percent forecast zero growth, and 8 percent were not reported.
Business outlook, next 12 months
7 9 8 6 8 3 2 3 5 0
8 7 4 7 15
72 75 72 67
68
10 7 13 15
9
0%
20%
40%
60%
80%
100%
2Q '13 3Q '13 4Q '13 1Q '14 2Q '14
10% or greater
Between 0 and 10%
Zero
Negative
Not reported
Mean 4.6% 4.2% 5.4% 5.3% 5.2%
Industrial manufacturers
Chart 4.1 Revenue growth, next 12 months
Note: In 2Q 2014 total respondents = 60

Manufacturing Barometer: Business outlook report PwC
32 30 31
33 32
0%
10%
20%
30%
40%
2Q '13 3Q '13 4Q '13 1Q '14 2Q '14
23
International sales, next 12 months
What percentage of your business’s total revenue over the next 12 months do you expect to be derived from international sales? (international marketers only)
Of respondents selling abroad, the projected contribution of international sales to total revenue over the next 12 months was 32 percent, similar to the prior quarter and the 32 percent level a year ago.
Industrial manufacturers
Business outlook, next 12 months
Chart 4.2 International sales, next 12 months
Note: In 2Q 2014 those marketing abroad = 56

Manufacturing Barometer: Business outlook report PwC
24
Percent planning to hire
Do you plan to add or reduce the number of full-time equivalent employees over the next 12 months?
A drop-off in the number planning new hiring was reported as 48 percent industrial manufacturers surveyed plan to add employees to their workforce over the next 12 months, off 8 points from first-quarter 2014 estimates, but above a year ago (42 percent). Seven percent plan to reduce the number of full-time equivalent employees, and 45 percent will stay about the same. Total net workforce projection was 0.5 percent, similar to the last quarter’s plus 0.4 percent but below last year’s 0.9 percent, indicating continued moderate hiring among these industrial manufacturing firms.
5 3 3 3 7
53
39 37 41 45
42
58 60 56 48
0%
20%
40%
60%
80%
100%
2Q '13 3Q '13 4Q '13 1Q '14 2Q '14
Add
Same
Reduce
Industrial manufacturers
Net +0.9% +0.7% +0.5% +0.4% +0.5%*
Business outlook, next 12 months
Chart 4.3 Percent planning to hire
Note: In 2Q 2014 total respondents = 60
* Percent (%) reported for US hiring, 84%
Manufacturing Barometer: Business outlook report PwC
25
Percent planning to hire by type of employee
Industrial manufacturers
2Q
’13
3Q
’13
4Q
’13
1Q
’14
2Q
’14
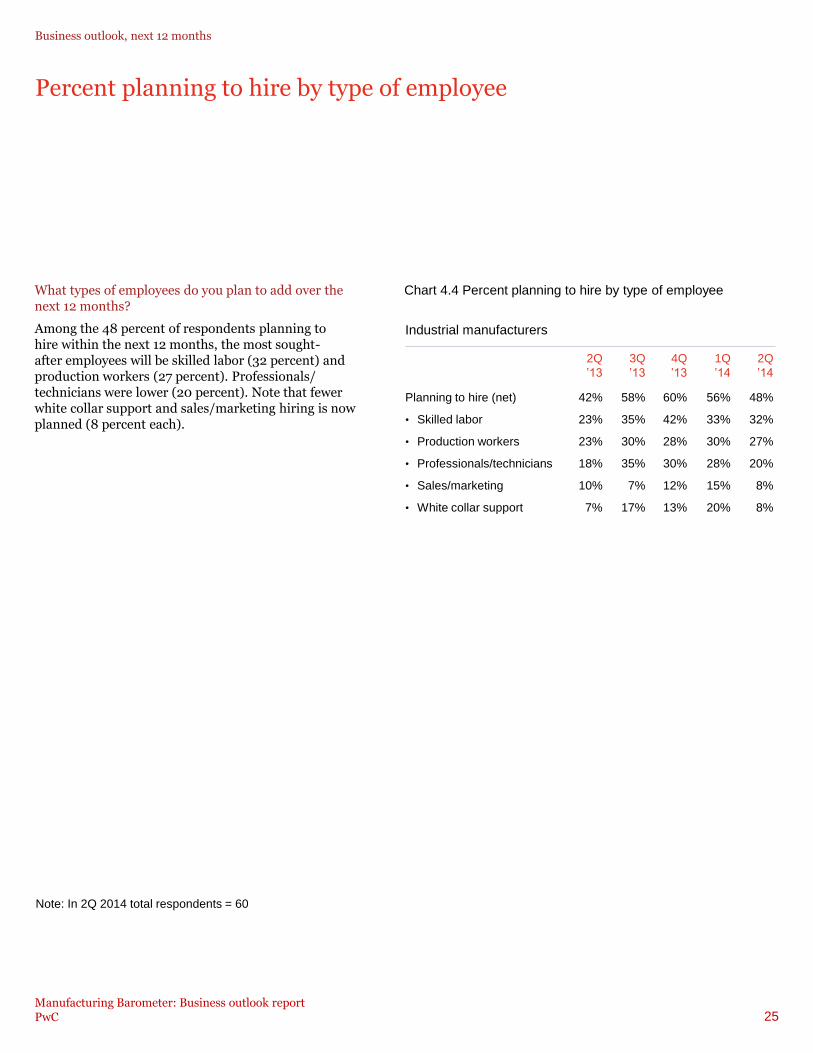
Planning to hire (net) 42% 58% 60% 56% 48%
• Skilled labor 23% 35% 42% 33% 32%
• Production workers 23% 30% 28% 30% 27%
• Professionals/technicians 18% 35% 30% 28% 20%
• Sales/marketing 10% 7% 12% 15% 8%
• White collar support 7% 17% 13% 20% 8%
What types of employees do you plan to add over the next 12 months?
Among the 48 percent of respondents planning to hire within the next 12 months, the most sought- after employees will be skilled labor (32 percent) and production workers (27 percent). Professionals/ technicians were lower (20 percent). Note that fewer white collar support and sales/marketing hiring is now planned (8 percent each).
Business outlook, next 12 months
Chart 4.4 Percent planning to hire by type of employee
Note: In 2Q 2014 total respondents = 60
Manufacturing Barometer: Business outlook report PwC
26
Percent planning major new investments of capital
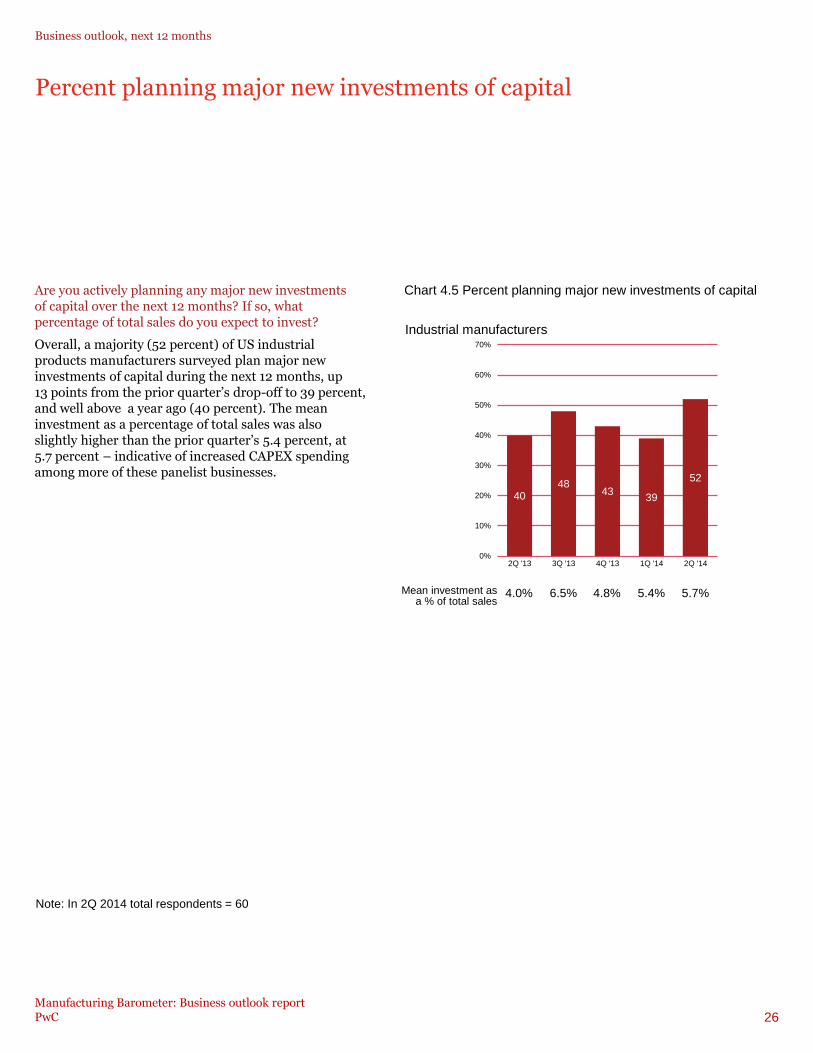
Are you actively planning any major new investments of capital over the next 12 months? If so, what percentage of total sales do you expect to invest?
Overall, a majority (52 percent) of US industrial products manufacturers surveyed plan major new investments of capital during the next 12 months, up 13 points from the prior quarter’s drop-off to 39 percent, and well above a year ago (40 percent). The mean investment as a percentage of total sales was also slightly higher than the prior quarter’s 5.4 percent, at 5.7 percent – indicative of increased CAPEX spending among more of these panelist businesses.
Business outlook, next 12 months
Mean investment as a % of total sales
Industrial manufacturers
Chart 4.5 Percent planning major new investments of capital
Note: In 2Q 2014 total respondents = 60
40 48
43 39
52
0%
10%
20%
30%
40%
50%
60%
70%
2Q '13 3Q '13 4Q '13 1Q '14 2Q '14
4.0% 6.5% 4.8% 5.4% 5.7%

Manufacturing Barometer: Business outlook report PwC
27
Percent planning to increase operational spending
Over the next 12 months, where do you expect to increase spending?
Looking at the next 12 months, shorter-term spending remained high: 75 percent of respondents plan to increase operational spending, same as the first quarter. Leading increased expenditures were research and development (45 percent, up 11 points), new product or service introductions (43 percent), and information technology (33 percent). Plans for geographic expansion remained at 22 percent, while business acquisitions rose 6 points to 27 percent. Marketing and sales promotion and advertising remained low.
Business outlook, next 12 months
Chart 4.6 Percent planning to increase operational spending
Note: In 2Q 2014 total respondents = 60
Industrial manufacturers
2Q
’13
3Q
’13
4Q
’13
1Q
’14
2Q
’14
Percent planning to increase
spending (net)
73% 78% 73% 75% 75%
• Research and development 38% 38% 37% 34% 45%
• New product or service
introduction
45% 55% 45% 44% 43%
• Information technology 28% 35% 32% 38% 33%
• Business acquisition 20% 15% 17% 21% 27%
• Geographic expansion 15% 23% 18% 21% 22%
• Facilities expansion 20% 30% 23% 21% 20%
• Marketing and sales
promotion
17% 15% 13% 13% 5%
• Advertising 7% 8% 2% 3% 5%
• Internet commerce 7% 2% 2% 2% 2%

Manufacturing Barometer: Business outlook report PwC
28
Expected barriers to business growth
Over the next 12 months, will any of the following represent barriers to business growth?
Legislative/regulatory pressures rose 9 points to 47 percent and is the leading potential barrier to growth over the next 12 months. Lack of demand remained high at 42 percent. Declining this quarter was capital constraints, 17 percent (off 11 points). Concern about oil/energy prices rose slightly (28 percent). Decreasing profitability remained at 27. Lack of qualified workers was off 3 points to 25 percent.
Business outlook, next 12 months
Chart 4.7 Expected barriers to business growth
Note: In 2Q 2014 total respondents = 60
Industrial manufacturers
10
10
15
13
32
13
24
22
30
47
53
13
8
13
20
22
22
15
28
32
45
58
5
10
12
17
22
20
20
25
27
42
47
8
12
18
28
23
28
28
26
25
44
38
3
7
15
17
25
25
27
28
28
42
47
2Q ‘14
1Q ‘14
4Q ‘13
3Q ‘13
2Q ‘13
Monetary exchange rate
Pressure for increased wages
Higher interest rates
Lack of demand
Legislative/ regulatory pressures
Competition from foreign markets
Taxation policies
Capital constraints
Decreasing profitability
Oil/energy prices
Lack of qualified workers

Manufacturing Barometer: Business outlook report PwC
29
Plans for M&A and other business initiatives
Over the next 12 months, do you expect to participate in any of the following new business initiatives?
Importantly, more panelists are planning M&A activity over the next 12 months, up 10 points to 38 percent. Most of these, 35 percent, are looking at purchasing another business, while 8 percent plan to sell part or all of their own business. Plans for expansion to new markets abroad was off 6 points to 12 percent. New strategic alliances was cited by 17 percent, and new joint ventures are planned by 15 percent. On the debit side, reductions abroad were reported by a net 8 percent, with closing/reduction of facilities abroad cited by 8 percent. There are a similar number of closing and reducing facilities abroad to those expanding – 8 percent and 10 percent, respectively.
Business outlook, next 12 months
Chart 4.8 Plans for M&A and other business initiatives
Industrial manufacturers
2Q
’13
3Q
’13
4Q
’13
1Q
’14
2Q
’14
New business initiatives (net) 50% 58% 47% 53% 47%
• M&A activity (net) 23% 22% 23% 28% 38%
- Purchase another business 18% 17% 20% 25% 35%
- Sell part/all own business 10% 8% 8% 7% 8%
- Equity carve-out/spin-off 2% 3% 5% 3% 3%
• New strategic alliance 20% 27% 22% 23% 17%
• New joint venture 10% 33% 13% 12% 15%
• Expand to new markets
abroad
18% 18% 20% 18% 12%
• New facilities abroad 12% 8% 8% 13% 10%
• Close/reduce facilities abroad 7% 8% 10% 8% 8%
• Reduce activity in markets
abroad
3% 5% 5% 7% 3%
Note: In 2Q 2014 total respondents = 60

Manufacturing Barometer: Business outlook report PwC
30
Survey demographics and research methodology
Demographics
Who Senior executives of US-based industrial manufacturing organizations
Interview dates April 3, 2014 to June 27, 2014
Industrial manufacturers (60)
Average number of
employees at location
8,845
Average business unit revenue $3.44 billion
Average enterprise revenue $9.99 billion
Market capitalization $12.43 billion
Industry sectors Products 100%
Manufacturing 100%
Methodology
PwC’s Manufacturing Barometer is a quarterly telephone survey conducted by the
independent research firm BSI Global Research Inc. Our regular survey panel
consists of senior executives from a geographically balanced sample of large
companies in the United States. Ninety-five percent of the panelists hold titles such
as president, CEO, CFO, VP of finance, treasurer, controller, internal audit
director, or other related title.

www.pwc.com/manufacturing
About the research: The Manufacturing Barometer is one in a series of quarterly business outlook surveys from PwC. The survey provides a view on the 12-month outlook for revenue growth, new investments, new hiring plans, emerging business barriers and more. In addition to the business outlook, we hear from our panelists about special issues they face as the business climate changes. Results of the quarterly business outlook surveys and special issue surveys are available at www.barometersurveys.com. Visit: www.barometersurveys.com Mobile: wap.barometersurveys.com Email: [email protected]
PricewaterhouseCoopers has exercised reasonable professional care and diligence in the collection, processing, and reporting of this information. However, the data used is from third-party sources and PricewaterhouseCoopers has not independently verified, validated, or audited the data. PricewaterhouseCoopers makes no representations or warranties with respect to the accuracy of the information, nor whether it is suitable for the purposes to which it is put by users. PricewaterhouseCoopers shall not be liable to any user of this report or to any other person or entity for any inaccuracy of this information or any errors or omissions in its content, regardless of the cause of such inaccuracy, error or omission. Furthermore, in no event shall PricewaterhouseCoopers be liable for consequential, incidental or punitive damages to any person or entity for any matter relating to this information. © 2014 PricewaterhouseCoopers LLP. All rights reserved. “PricewaterhouseCoopers” and “PwC” refer to PricewaterhouseCoopers LLP or, as the context requires, the PricewaterhouseCoopers global network or other member firms of the network, each of which is a separate and independent legal entity. This document is for general information purposes only, and should not be used as a substitute for consultation with professional advisors.
Industry contacts: Bobby Bono US Industrial Manufacturing Leader +1 704 350 7993 Jennifer Flunker US Industrial Products Senior Manager +1 614 227 3236


