29
ENERGY FORUM Consumers’ Perspective on Energy Issues By Philip Tan Representing FMM August 9, 2010 Sheraton Imperial Hotel, KL

ENERGY FORUM
Consumers’ Perspective on Energy Issues
By Philip TanRepresenting FMM
August 9, 2010
Sheraton Imperial Hotel, KL
2222
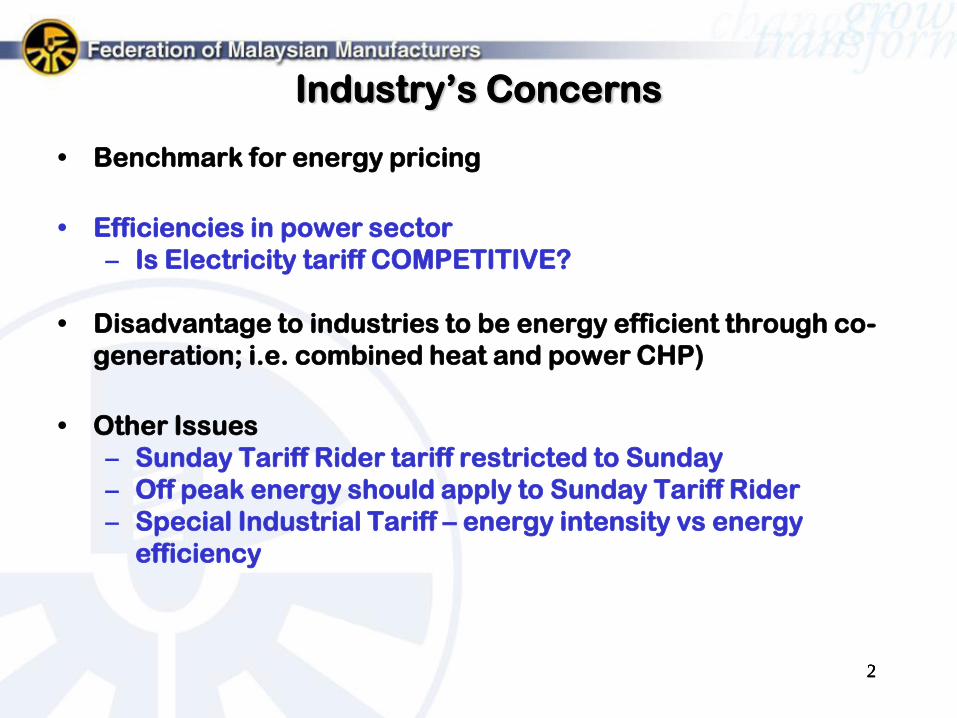
Industry’s Concerns
• Benchmark for energy pricing
• Efficiencies in power sector
– Is Electricity tariff COMPETITIVE?
• Disadvantage to industries to be energy efficient through co-
generation; i.e. combined heat and power CHP)
• Other Issues
– Sunday Tariff Rider tariff restricted to Sunday
– Off peak energy should apply to Sunday Tariff Rider
– Special Industrial Tariff – energy intensity vs energy
efficiency
3
ENERGY PRICING
• FMM recognizes that energy pricing should be at
market rate.
• However adjustment to market price must be gradual and
pre-announced to give sufficient time for adjustment.
• Have a transparent and consistent pricing formula for both
natural gas and electricity tariffs to allow the industry to
estimate future price increases.
• Market price of indigenous fuel such as NG should be
benchmarked against an appropriate alternative fuel.
44
35.9937.0135.26
35.44
31.43
26.91
22.74
23.7523.41
37.52
39.70
MFO (RM)
39.65
10.70
Gas to Power
22.06
Gas to Industry
15.00
42.35
36.95
30.48
22.5621.47
20.65
18.69
22.69
24.38
26.2026.55
LNG Export
29.82
18.28
US Industrial
NG Price
USD/RM=3.5
18.72
16.34
12.9714.6715.3715.3614.81
17.09
19.4121.76
25.30
0
5
10
15
20
25
30
35
40
45
Jan 09 Feb 09 Mar 09 Apr 09 May 09 June 09 July 09 Aug 09 Sept 09 Oct 09 Nov 09 Dec 09
RM/mmBtu
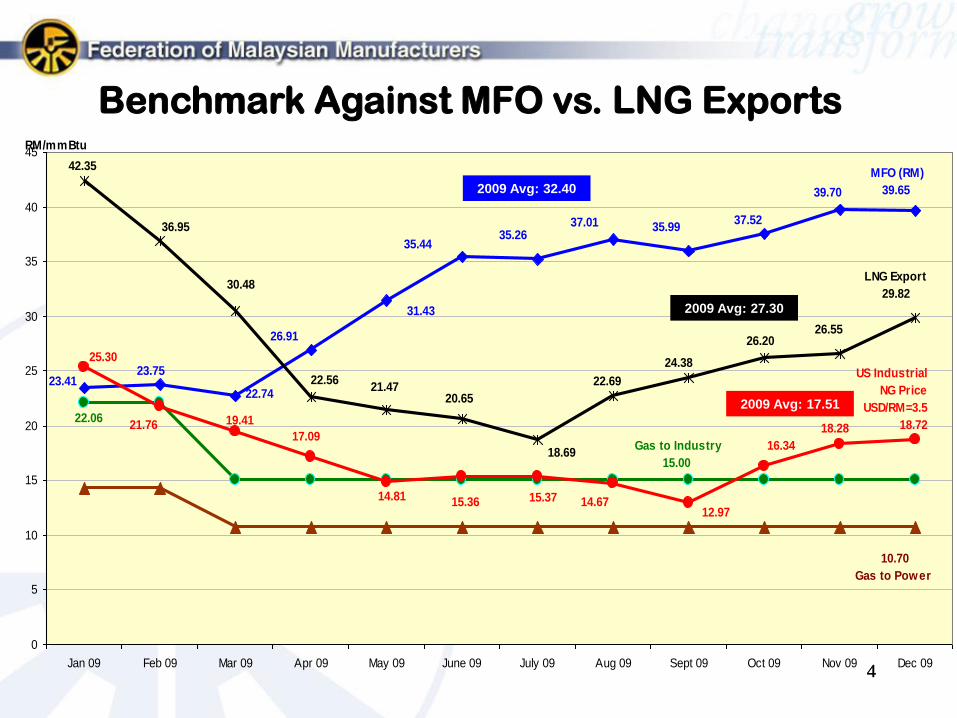
Benchmark Against MFO vs. LNG Exports
2009 Avg: 27.30
2009 Avg: 32.40
2009 Avg: 17.51
5
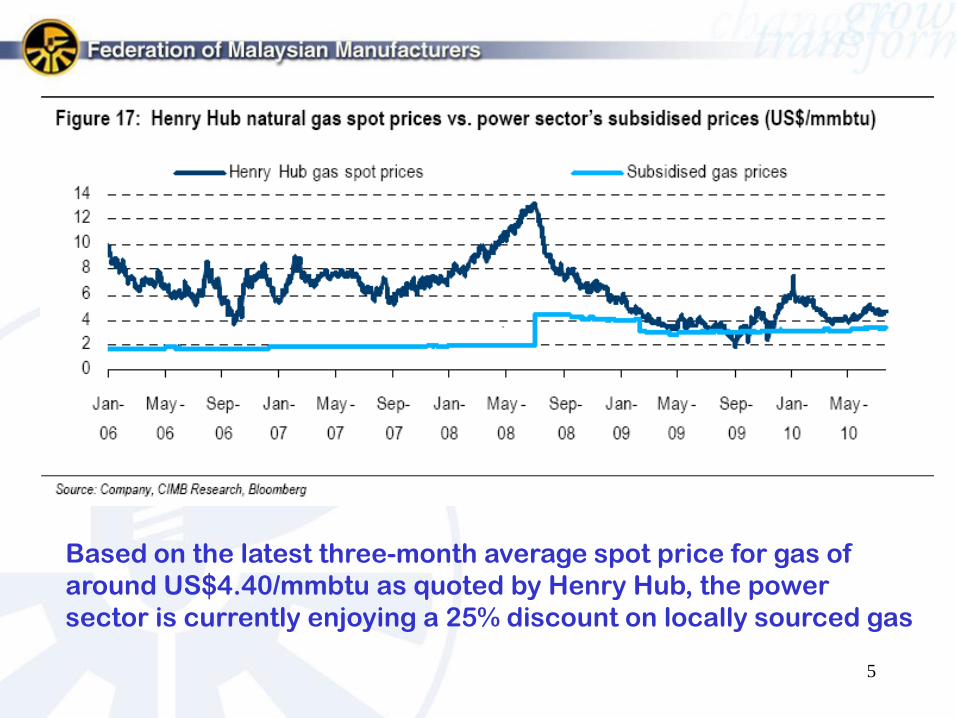
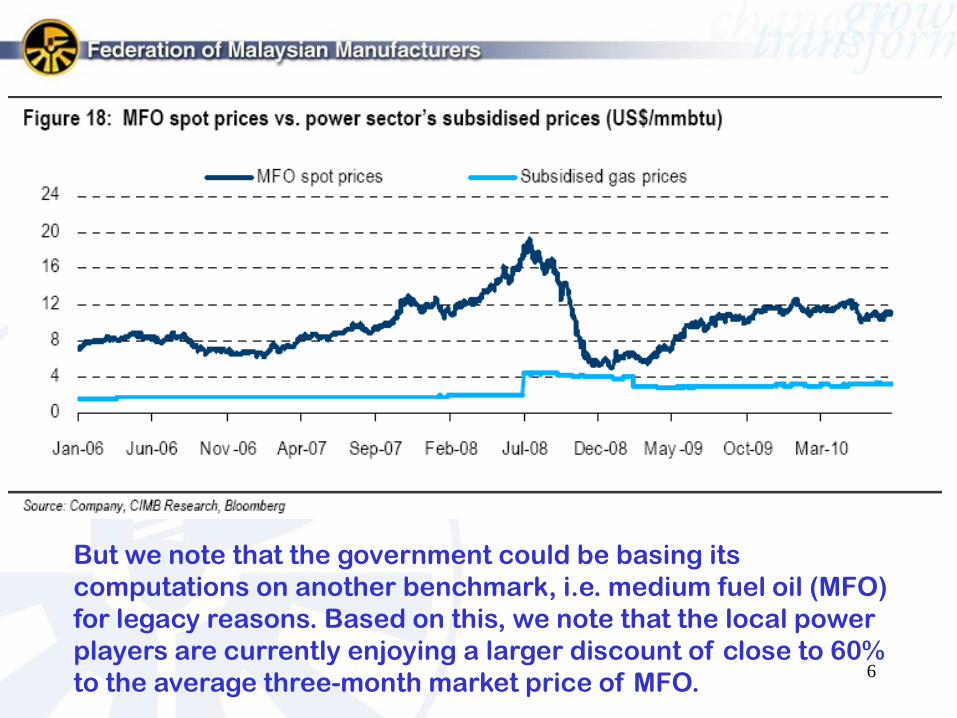
Based on the latest three-month average spot price for gas of
around US$4.40/mmbtu as quoted by Henry Hub, the power
sector is currently enjoying a 25% discount on locally sourced gas
6
But we note that the government could be basing its
computations on another benchmark, i.e. medium fuel oil (MFO)
for legacy reasons. Based on this, we note that the local power
players are currently enjoying a larger discount of close to 60%
to the average three-month market price of MFO.
7
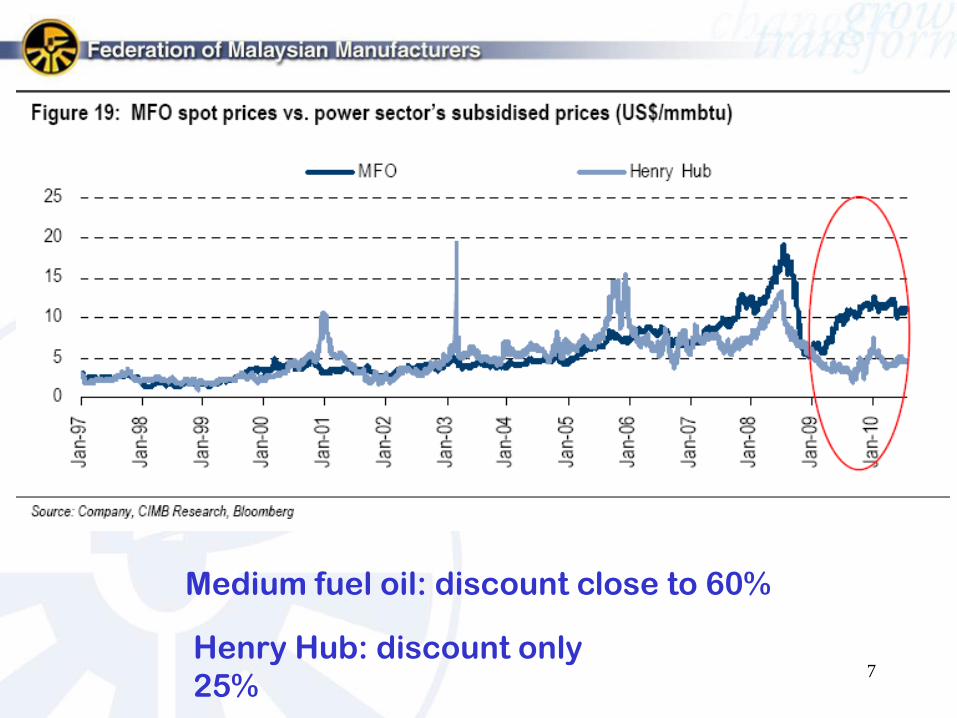
Medium fuel oil: discount close to 60%
Henry Hub: discount only
25%

8
Why MFO?
“We gather that the MFO benchmark has been in place since the 1990s. Back then, MFO prices were used because most of the power plants were running on MFO. Also, looking back at historical prices, MFO and gas prices were generally in sync (Figure 19). But since Jan 09, there has been a clear decoupling of the two benchmarks as MFO prices generally moved in tandem with crude oil prices.”
CIMB Research Report 27 July 2010
9
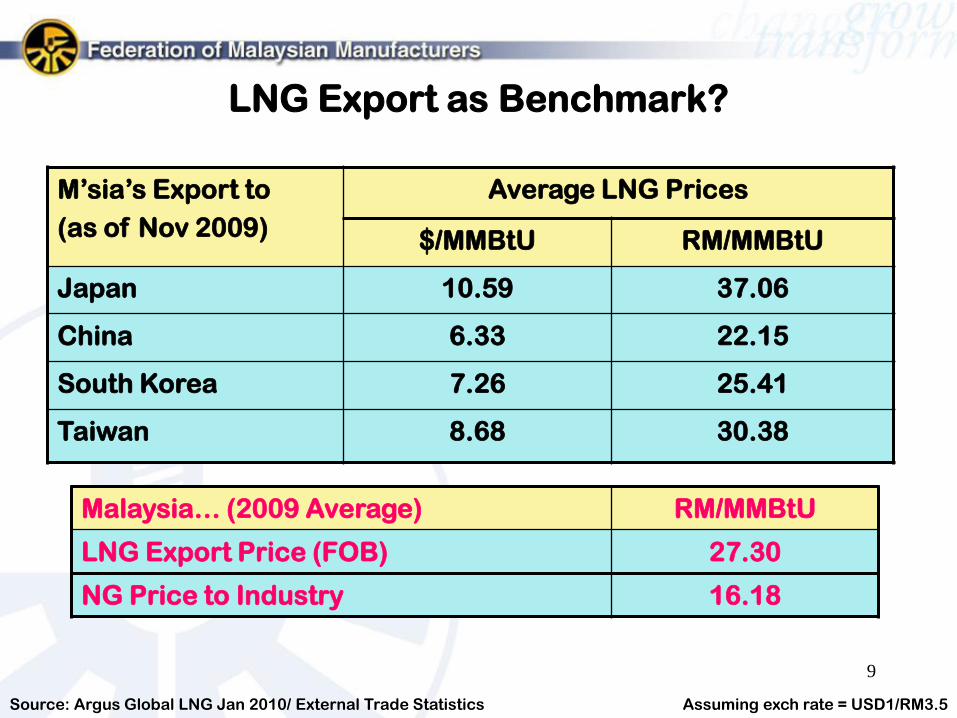
LNG Export as Benchmark?
M’sia’s Export to
(as of Nov 2009)
Average LNG Prices
$/MMBtU RM/MMBtU
Japan 10.59 37.06
China 6.33 22.15
South Korea 7.26 25.41
Taiwan 8.68 30.38
Assuming exch rate = USD1/RM3.5
Malaysia… (2009 Average) RM/MMBtU
LNG Export Price (FOB) 27.30
NG Price to Industry 16.18
Source: Argus Global LNG Jan 2010/ External Trade Statistics
10
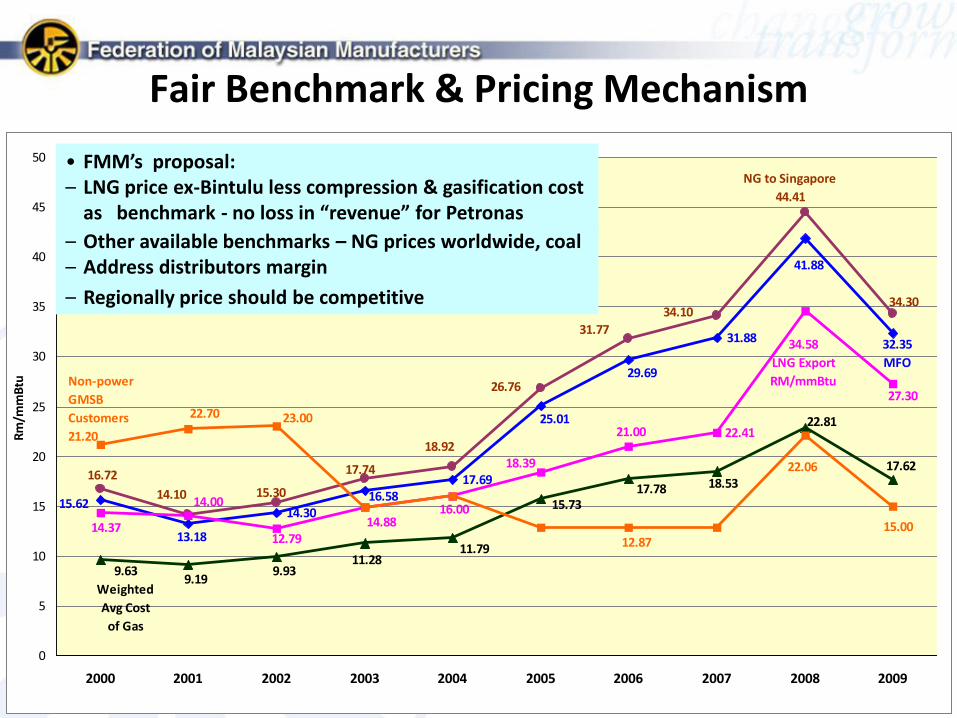
Fair Benchmark & Pricing Mechanism
14.30
17.69
31.88
22.41
41.88
15.62
13.18
16.58
25.01
29.69
32.35
MFO
34.30
16.72
15.30
17.74
18.92
26.76
31.77
34.10
14.10
NG to Singapore
44.41
22.81
18.53
9.63
Weighted
Avg Cost
of Gas
9.199.93
11.2811.79
15.7317.78
17.62
27.30
14.00
14.37
21.00
18.39
12.7914.88
16.00
34.58
LNG Export
RM/mmBtu
15.00
22.06
23.0022.70
Non-power
GMSB
Customers
21.20
12.87
0
5
10
15
20
25
30
35
40
45
50
2000 2001 2002 2003 2004 2005 2006 2007 2008 2009
Rm
/mm
Btu
• FMM’s proposal: – LNG price ex-Bintulu less compression & gasification cost
as benchmark - no loss in “revenue” for Petronas
– Other available benchmarks – NG prices worldwide, coal– Address distributors margin
– Regionally price should be competitive

11
Efficiencies in Power Sector

12121212
Current Malaysian NG price LOWEST –but HIGH electricity tariff
10.70
20.00
33.56
19.40
29.45
34.40 33.03
20.76
34.6033.59
44.17
0
5
10
15
20
25
30
35
40
45
50
Gas to Power (RM/mmBtu) Electricity HT(sen/kWh) Electricity LT(sen/kWh)
Ma
lays
ia
Ma
lays
ia
Ma
lays
ia
Th
ail
an
d
Th
ail
an
d
Th
ail
an
d
Sin
ga
po
re
Ind
on
esia
Sin
ga
po
re
Sin
ga
po
re
Ind
on
esia
M’sian NG price• 1/3 Singapore• 1/2 Thailand
M’sian electricity (High Tension)• 90% Singapore• 86% Thailand
M’sian electricity(Low Tension) • 78% Singapore• 103% Thailand
Note: As of 2009

13
SAHA’s Study Review of Future Tariff
Proposal
• SAHA met with FMM during their study to design a future tariff
structure in Peninsular Malaysia and Sabah
• FMM understands that future tariff structure could be based on
incentive based regulation as against cost of service regulation.
• Towards this end the tariff rates associated for the regulated assets
for distribution and for transmission would be separately
identified.
• Understand only the regulated assets for transmission and
distribution would be considered. Tariffs justification would be
made known and subjected to consultation, review and written
comments/arguments by all stakeholders including FMM.

14
Transparency in Cost and Price
• FMM recognizes that companies (including utilities and IPPs) need to
earn reasonable return for their investment. As utilities' tariffs are not
subjected to competition but are of general public interest (including to
members of FMM) the costs and prices for various parts of the supply
chain be must transparent so that any inefficiencies could be identified
and hopefully corrected.
• Towards transparency FMM believes that the cost and prices for the
following should be available and published:
a. Non fuel IPPs’ unit cost and utility margin;
b. Power utilities own non fuel generation cost and price per unit,
c. Transmission cost and price per unit,
d. Distribution cost and price per unit,
e. Gas utilities’ cost and price of transmission.

15
Transparency in IPPs’ Costs
• FMM believes that each IPP’s costs for non-fuel and non fuel, generation amount sold to utilities should be made available to the public.
• With incentive based regulation, FMM believe that the following monetary values should be treated as follow:
a. Deduction of payments for not meeting guarantees not be to the sole benefit of the utilities but to the consumers as well,
b. Fuel advantages should shared on a win-win-win arrangement without setback to IPPs when gas was at RM6.40/MMBTU as follow:
- Allow offline water washing without imposition of UOR,
- Share fuel advantage in proportion 1:1:2 among IPP, TNB and consumers.

16
Historical Baggage Still in Place
that Discourages Co-generation

17
Support for CO-GENERATION• Co-generation or Combined Heat and Power (“CHP”) - most effective
way with regards to energy efficiency
• Because we produce electricity and capture waste heat from power generation to steam simultaneously rather than wasting it.
• Non recovered losses of generation: Gas Turbine: 62% at exhaust Conventional Power Plant : 49.5% at condenser Combined Cycle : 33% at condenser GT/HRSG as Cogeneration : 11% of input
• Remove impediments to co-generation activities High standby charges – barrier to entry (RM25/kW/month) Penalty for exceeding demand
No support for buying firm excess supply TNB buys excess electricity at uneconomical price set at lowest avoided cost
Co-generation can achieve efficiency greater than 80%
1818
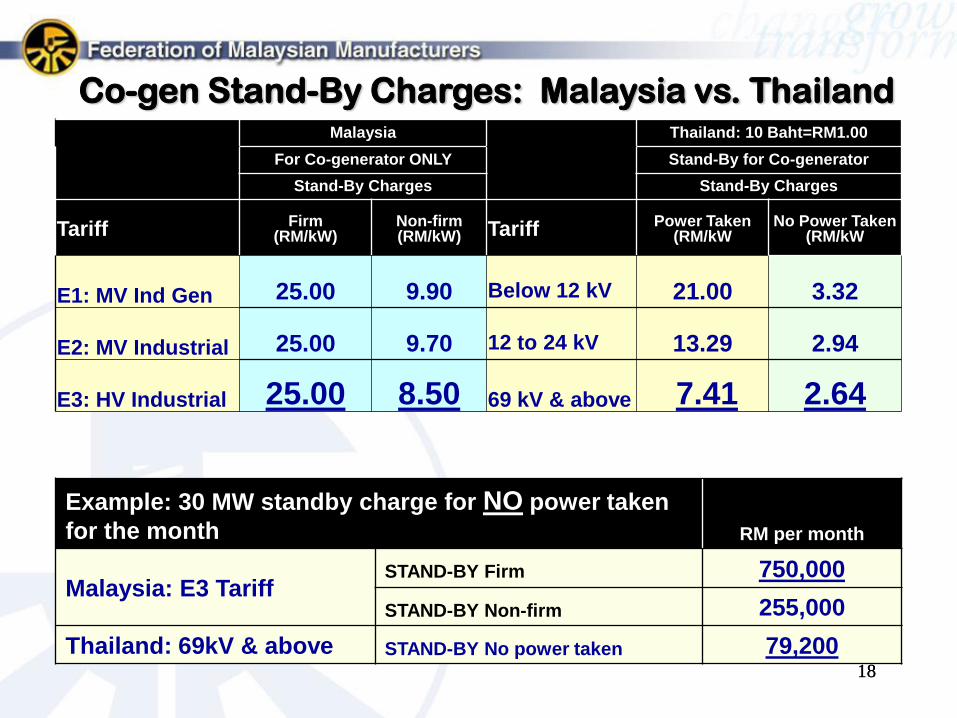
Co-gen Stand-By Charges: Malaysia vs. ThailandMalaysia Thailand: 10 Baht=RM1.00
For Co-generator ONLY Stand-By for Co-generator
Stand-By Charges Stand-By Charges
Tariff Firm(RM/kW)
Non-firm(RM/kW) Tariff Power Taken
(RM/kWNo Power Taken
(RM/kW
E1: MV Ind Gen 25.00 9.90 Below 12 kV 21.00 3.32
E2: MV Industrial 25.00 9.70 12 to 24 kV 13.29 2.94
E3: HV Industrial 25.00 8.50 69 kV & above 7.41 2.64
Example: 30 MW standby charge for NO power taken
for the month RM per month
Malaysia: E3 TariffSTAND-BY Firm 750,000
STAND-BY Non-firm 255,000
Thailand: 69kV & above STAND-BY No power taken 79,200

19
Rules for Charging Standby
• Firm Standby Rates should not be more than 20% of TNB’s actual
price of capacity charge rate for each Tariff Category.
• No Non-Firm Standby Rates to be charged for Non-Firm Standby.
If electricity is used within any month, the tariff for use is to
follow the respective Tariff Category.
• Top-up consumers to follow the electricity tariff as for normal
consumers for each Tariff Category.
• No additional penalty charge for standby and top-up consumers
that take electricity higher than the Average Load Factor of
Respective Tariff Category.
• Equitable measures to be drawn up to protect TNB from gaming
by customers and for standby customers not able to maintain at
reference plant availability (90%).
20
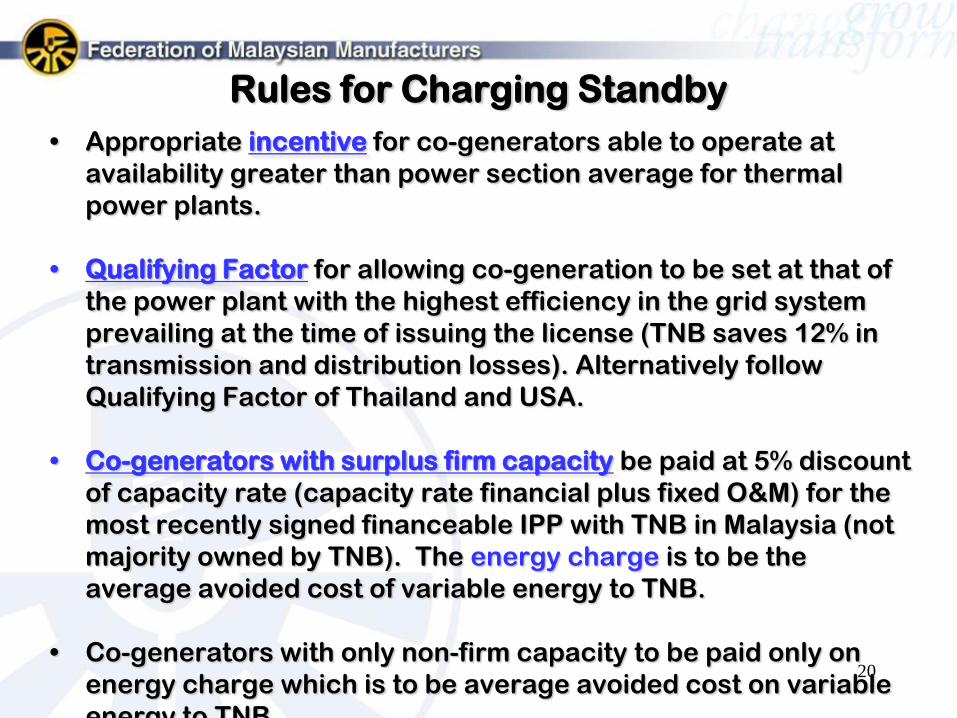
Rules for Charging Standby
• Appropriate incentive for co-generators able to operate at
availability greater than power section average for thermal
power plants.
• Qualifying Factor for allowing co-generation to be set at that of
the power plant with the highest efficiency in the grid system
prevailing at the time of issuing the license (TNB saves 12% in
transmission and distribution losses). Alternatively follow
Qualifying Factor of Thailand and USA.
• Co-generators with surplus firm capacity be paid at 5% discount
of capacity rate (capacity rate financial plus fixed O&M) for the
most recently signed financeable IPP with TNB in Malaysia (not
majority owned by TNB). The energy charge is to be the
average avoided cost of variable energy to TNB.
• Co-generators with only non-firm capacity to be paid only on
energy charge which is to be average avoided cost on variable
energy to TNB.
21
Sunday Tariff Rider
• When the Sunday Tariff Rider was offered, FMM initially thought
that Sunday usage would be considered as off-peak rates.
• When then, when FMM ask at MITI dialogue with presence of
utility, that the Rider be applied to Saturday. FMM was told
Saturday demand pattern is similar to weekday.
• When FMM met with the previous Chairman on the matter, FMM
was told otherwise. FMM was supplied the demand patterns in
the next couple of slides.
• Subsequently, on closer examination, FMM realized that only
Maximum Demand recorded is not counted under the Sunday
Tariff Rider. Peak energy charge still applies. Where is the
benefit?

2222
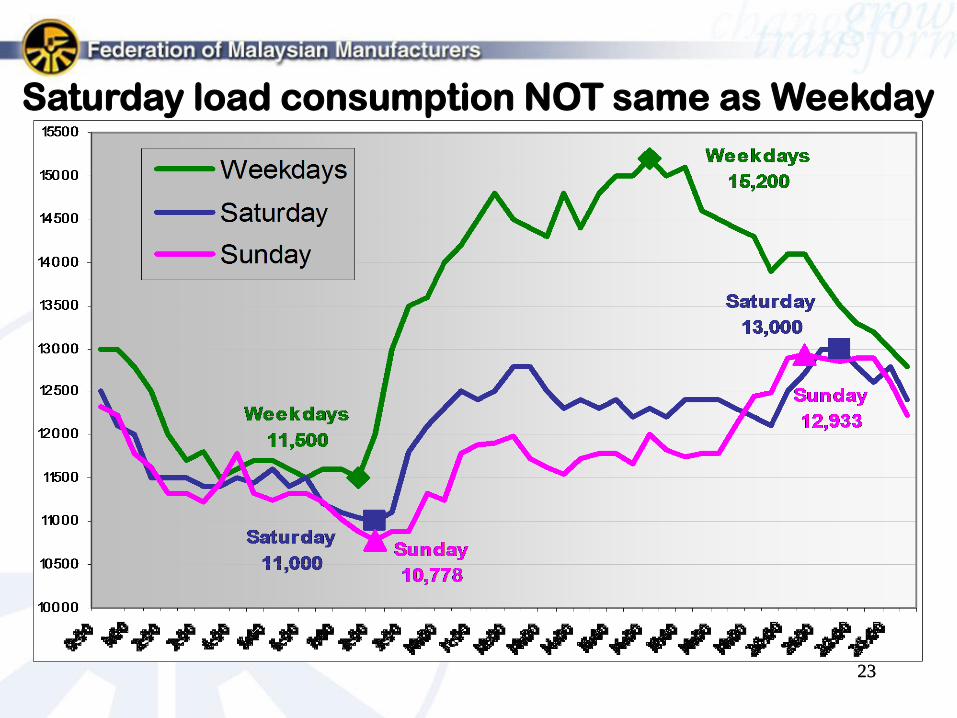
Saturday & Sunday load consumption similar pattern
but Sunday Tariff Rider only for Sunday
2323
Saturday load consumption NOT same as Weekday
24
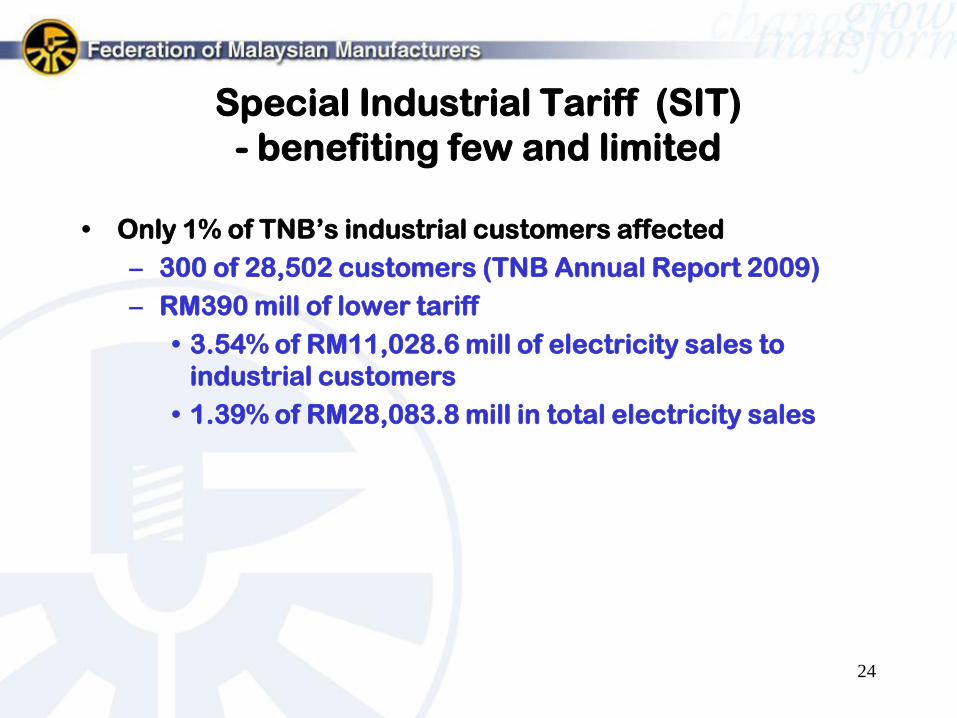
Special Industrial Tariff (SIT)
- benefiting few and limited
• Only 1% of TNB’s industrial customers affected
– 300 of 28,502 customers (TNB Annual Report 2009)
– RM390 mill of lower tariff
• 3.54% of RM11,028.6 mill of electricity sales to
industrial customers
• 1.39% of RM28,083.8 mill in total electricity sales

25
PRESS RELEASE BY FMM
on March 3, 2010
FMM recognizes that energy pricing should be at market rate. However, as with all changes to policies that have an impact on operating costs, FMM had requested the Government to ensure that the move to market price should:
• Be gradual and pre-announced to give sufficient time for adjustment;
• Have a transparent and consistent pricing formula for both natural gas and electricity tariffs to allow the industry to estimate future price increases;

26
Continued
• Be fair: i.e. to benchmark against an appropriate
alternative fuel and to ensure that supply chain
inefficiencies are not passed through to users.
FMM’s view is that an appropriate benchmark should be
the free-on-board price of liquefied natural gas that
Malaysia itself exports to other countries from Bintulu,
which is lower than the current domestic market price after
deducting transportation and gasification/degasification
costs!
FMM is also strongly of the view that the power sector
should ONLY be allowed to pass through increase in fuel
prices to consumers – not their other operating
inefficiencies.
27
Continued
• Practice domestic market obligation (DMO): i.e. to
ensure sufficient supply of the country’s natural fuel
resources for use by industries in Malaysia to increase
value-add and higher economic returns. In this respect,
FMM has also been calling on the Government to review
the export quantum to address the shortfall of fuel
resources in Peninsula Malaysia as well as to conserve the
national stockpile.

28
Recommendations• Improve efficient use of natural resources
• Establish effective subsidy transition programme
• Pre-announced review of prices, consistent & transparent formula
• Reference to a fair benchmark
– LNG price ex-Bintulu net back to price of natural gas cost supplied to LNG plant
• Maintain minimum of WACC for regulated assets because:
–NG is national resource – competitive advantage
–Spin-off and multiplier effects from industry
–Power sector provides basic energy – electricity
• Priority of supply - domestic market obligation
• Support co-gen among users of NG, reward efficient users
• Reform energy sector – market liberalization
• Address LEAKAGES – utilities efficiency, distributors margins

Thank You

![FMM / RCWA [S-Matrix] - LightTrans · 2020. 6. 8. · FMM / RCWA [S-Matrix] For the Grating Component VirtualLab Fusion Technology – Solvers and Functions. 2 Abstract The FMM/RCWA](https://static.documents.pub/doc/80x56/5fde654591cfa4041813fdb7/fmm-rcwa-s-matrix-lighttrans-2020-6-8-fmm-rcwa-s-matrix-for-the-grating.jpg)


