MANUFACTURING OF SYNTHETIC SODA ASH BY TAKALANI MADIMA Thesis presented in fulfillment of the requirements for the degree of Master of Sciences at the University of the Western Cape. Supervisor: Prof. D. Knoesen Department of Physics University of the Western Cape Co-supervisor: Dr. S. Jongens Nampak Research and Development February 2009
Transcript
MANUFACTURING OF SYNTHETIC SODA ASH
BY
TAKALANI MADIMA
Thesis presented in fulfillment of the requirements for the degree of Master of
Sciences at the University of the Western Cape.
Supervisor: Prof. D. Knoesen
Department of Physics
University of the Western Cape
Co-supervisor: Dr. S. Jongens
Nampak Research and Development
February 2009
DECLARATION
I, the undersigned, hereby declare that the work contained in this thesis is my
own original work and that I have not previously in its entirety or in part
submitted it at any university for a degree.
Signature: ………………………………………………………
Date: ……………………………………………………………
Takalani Madima February 2009
v
KEYWORDS
MANUFACTURING OF SYNTHETIC SODA ASH
Soda ash
Solvay process
Modified Solvay process
Leblanc process
ZAF factor
Elemental composition
vi
ABSTRACT
“Manufacturing of synthetic soda ash”
Takalani Madima
MSc. Thesis, Department of Physics, University of the Western Cape
The aim of the project was to study the manufacturing of synthetic soda ash
(sodium carbonate, Na2CO3) on an industrial scale. Currently all Soda ash
that is used in South Africa for manufacturing glass is imported at a high cost,
and the company Nampak Wiegand Glass (South Africa) is investigating the
possibility to locally manufacture synthetic soda ash.
About 75% of soda ash is synthetically produced from either the Leblanc
process, Solvay process, Modified Solvay (Dual) process or dry lime process.
This study concentrated on the Solvay process on a laboratory scale for
eventual input into a larger pilot plant.
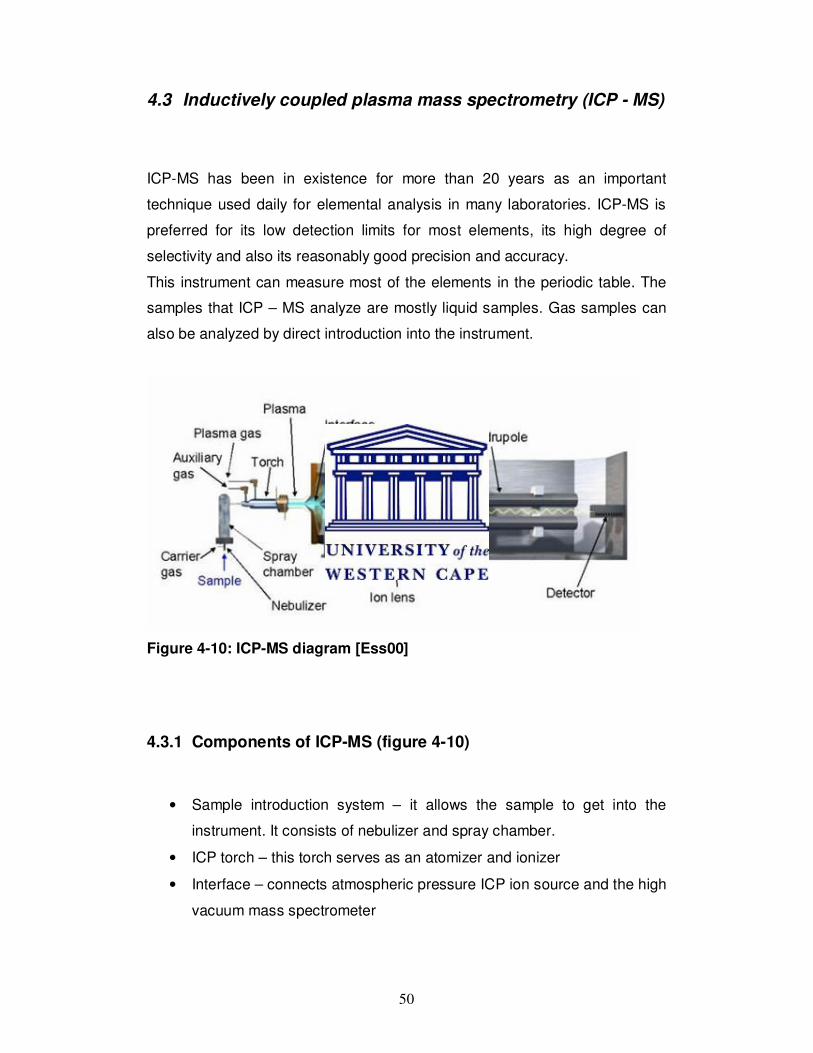
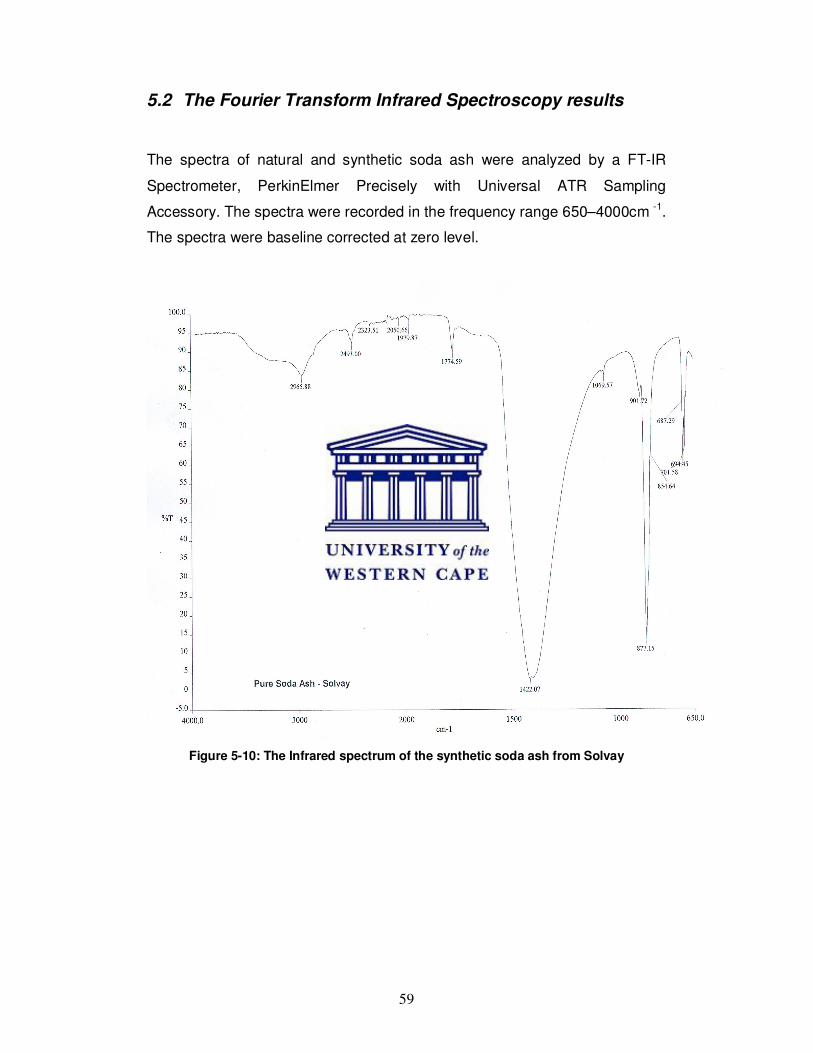
The produced material was analyzed using analytical techniques such as
FTIR (Fourier Transform Infrared spectroscopy), Scanning Electron
Microscopy and Energy Dispersive X-ray Spectroscopy, Inductively Coupled
Plasma Mass Spectrometry (ICP-MS) and Inductively Coupled Plasma Atomic
Emission spectroscopy (ICP-AES). There are certain standard requirements
for impurities in the soda ash, and this needed to be measured and
determined what changes to the process will bring the impurities to the
required minimum standard. Environmental issues around the manufacturing
process were also studied.
After completing of the laboratory experiments and the extraction of required
data from the results, Nampak will use the information to decide on a follow-
up to the building of a small pilot plant to further test and develop the
engineering and economical aspects of a full plant. If successful a full scale
manufacturing plant can be developed in South Africa for producing soda ash.
vii
This study thus will not only help Nampak Wiegand Glass in finalizing the
decision to go ahead, but its result will also benefit other companies that use
the soda ash in oil refining, water treatment, pulp and paper, chemical industry
etc. Some parts of the work done will be proprietary to Nampak and subject to
confidentiality agreement.
viii
ACKNOWLEDGEMENTS
Firstly I would like to thank my creator, God Almighty for making it possible for
me to complete this project and for answering my prayers.
I am grateful to the following people without their support and guidance; this
thesis would have been impossible.
Stoney Steenkamp of Nampak Wiegand Glass for initiating the project and
financial support in getting market report.
Nampak Research and Development for giving me the opportunity to do this
project.
Prof. Dirk Knoesen of the Department of Physics at the University of the
Western Cape for his supervision, valuable comment, guidance and support
throughout this investigation.
Dr Sharon Jongens of Nampak R & D who acted as co-supervisor, for her
support, valuable suggestions and guidance throughout the investigation.
Prof. Farouk Ameer of the Department of Chemistry at the University of the
Western Cape for allowing me to use the laboratory and apparatus for my
experiments.
Mr Timothy Lesch, of the Department of Chemistry at UWC, for his assistance
with the experimental set-up and providing apparatus.
Tendamudzimu Ramulifho for showing interest in my project and also for her
assistance with my first experiment.
Bronwyn Kroon of Nampak R&D for assistance with FTIR measurements,
providing chemicals and suggestions in ICP-MS analysis.
ix
Charles Hepburn and Johan Visser of Nampak R & D for showing interest in
the project and being optimistic.
The National Research Foundation and Ithemba LABS for financial assistance
received during the course of the investigation.
Angus Phala and Tankiso Thamahane of Nampak R & D for their suggestions.
Riana Rossouw of the Department of Geology at the Stellenbosch University
for her assistance with the ICP-MS and ICP-AES measurements.
The staff and Manus / Matsci students of the Department of Physics at the
University of the Western Cape for their support and encouragements.
Mthobisi Cele for his love, support and suggestions.
My friends Thobeka Wittes, Tshepo Dinoko, Fulu Maphiri, Gloria Mavhutha,
David Mphaphuli, for their love support and encouragements.
All my friends, Thabelo, Wanani, Farwi, Stacey, Mamello, Priscilla Bartus,
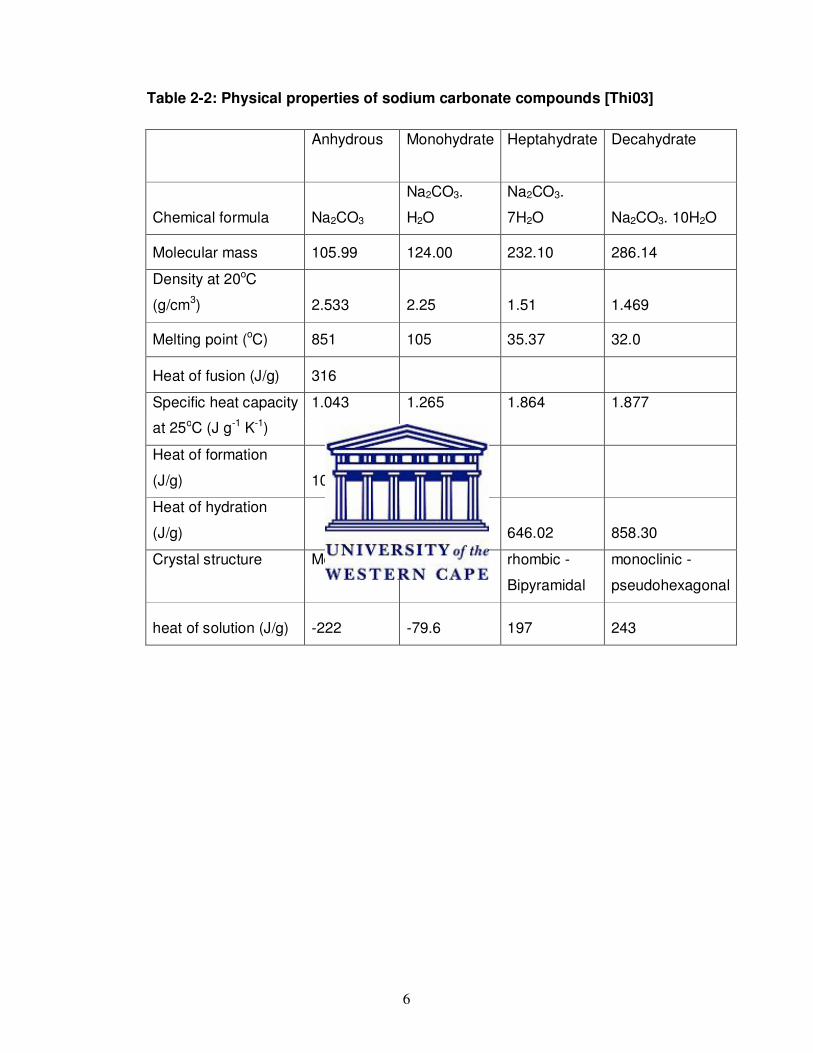
Table 2-3: Solubility of the hydrates of sodium carbonate [Örg03]. ............................ 7
Table 2-4: Percentage breakdown of volume sales of soda ash in different countries for year 2005 [Glo08]…………………………………………………………………….…10 Table 2-5: USA. natural soda ash production [Kos08] ............................................. 24
Table 2-6: USA Exports of soda ash [Kos08]……………………………………………25 Table 4-1: Detailed values of ZAF correction factor of natural soda ash .................. 41
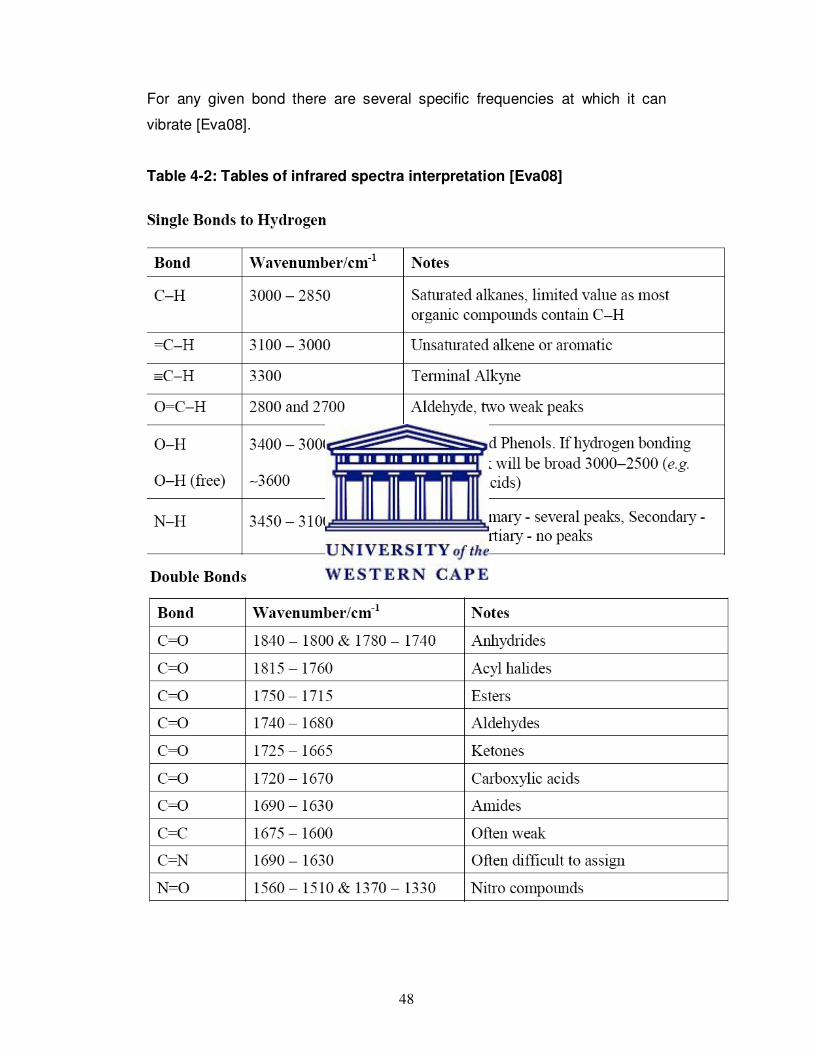
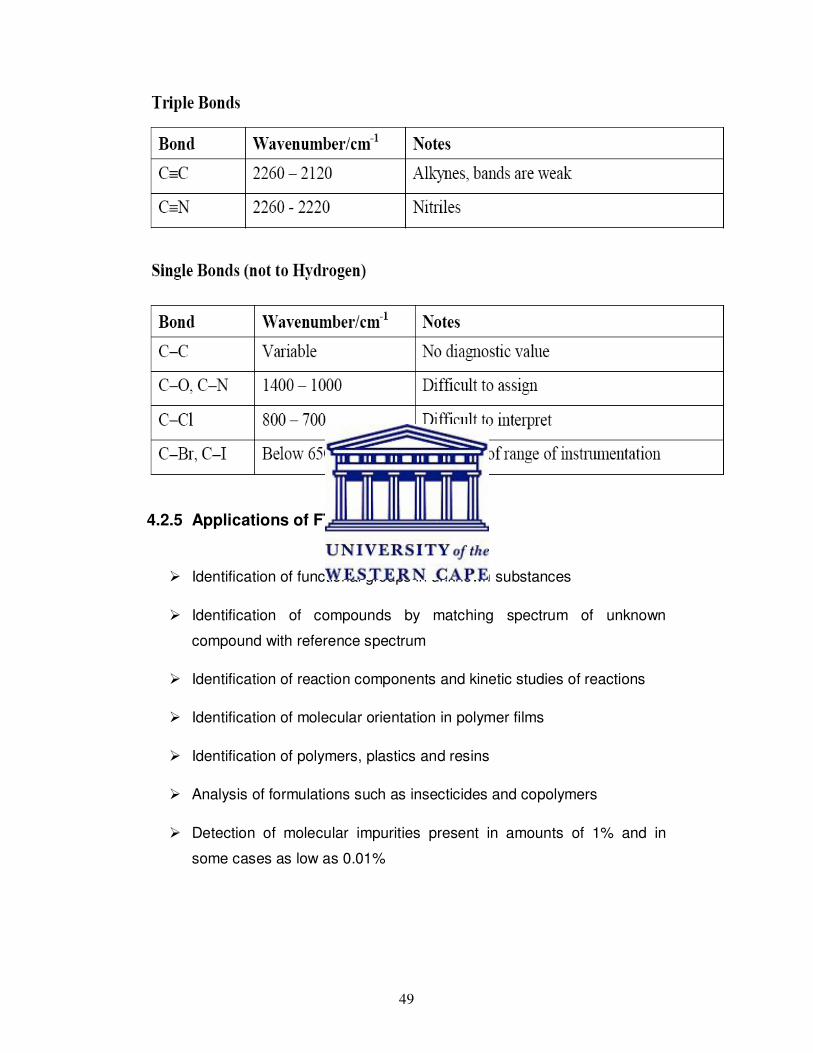
Table 4-2: Tables of infrared spectra interpretation [Eva08] .................................... 48
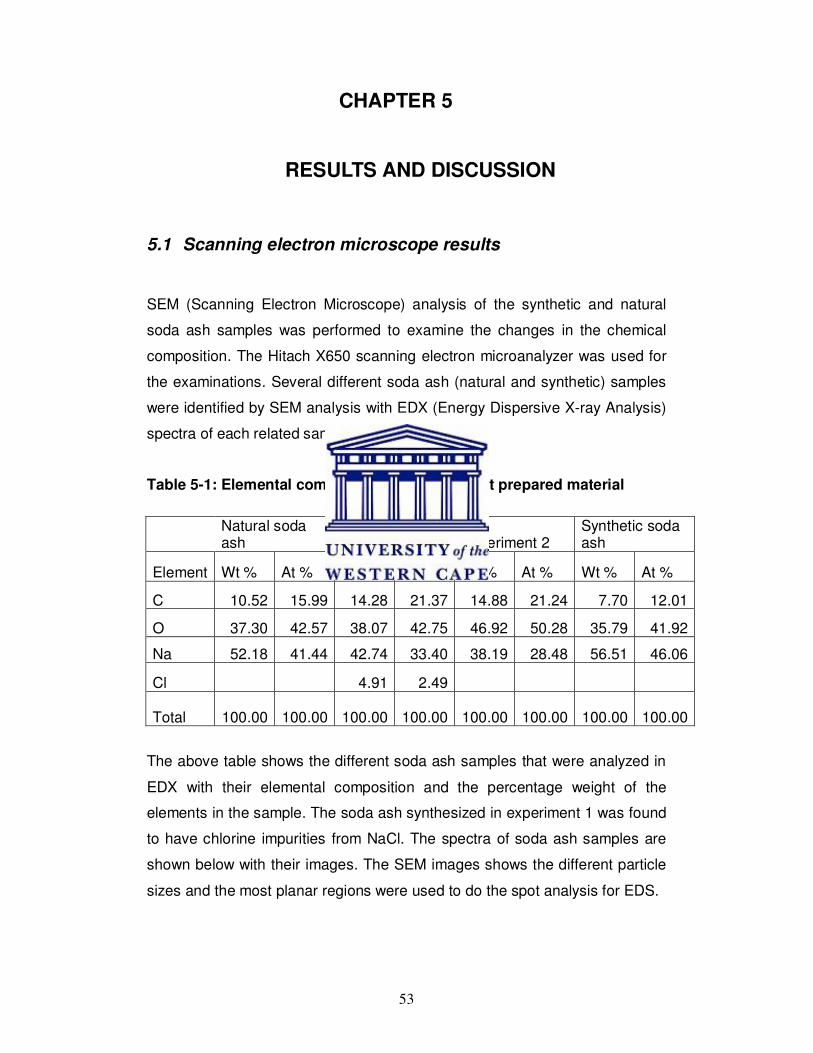
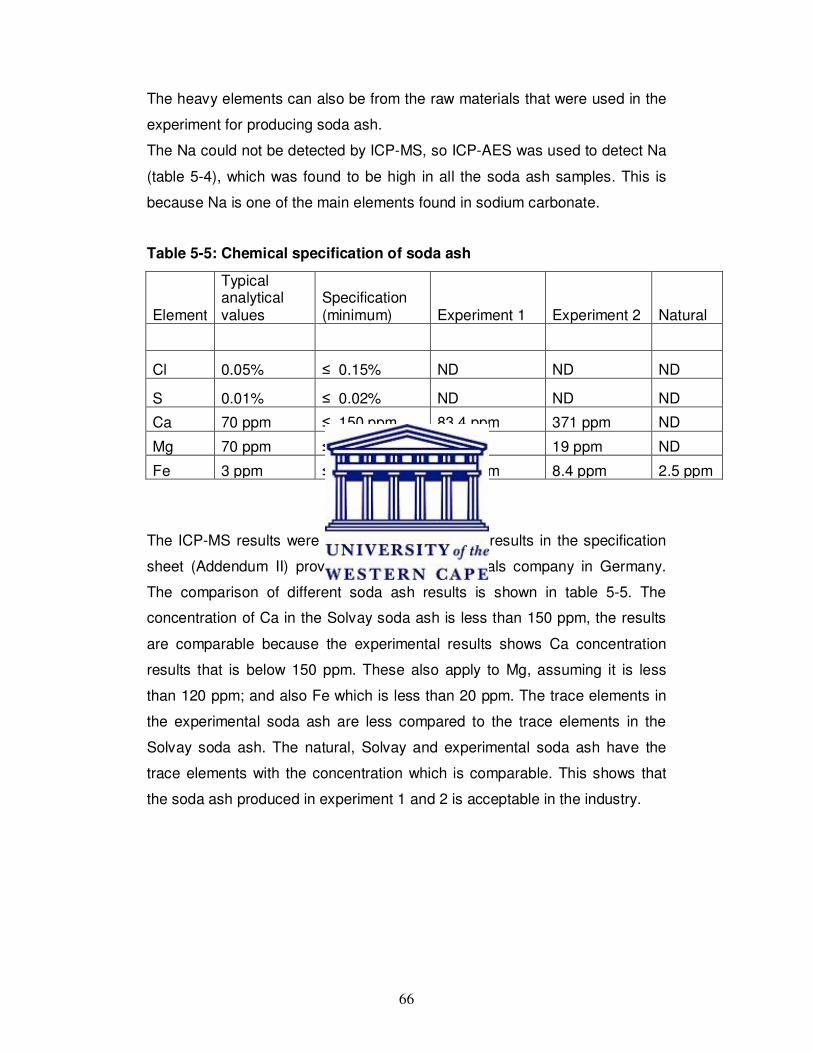
Table 5-1: Elemental composition of the different prepared material ....................... 53
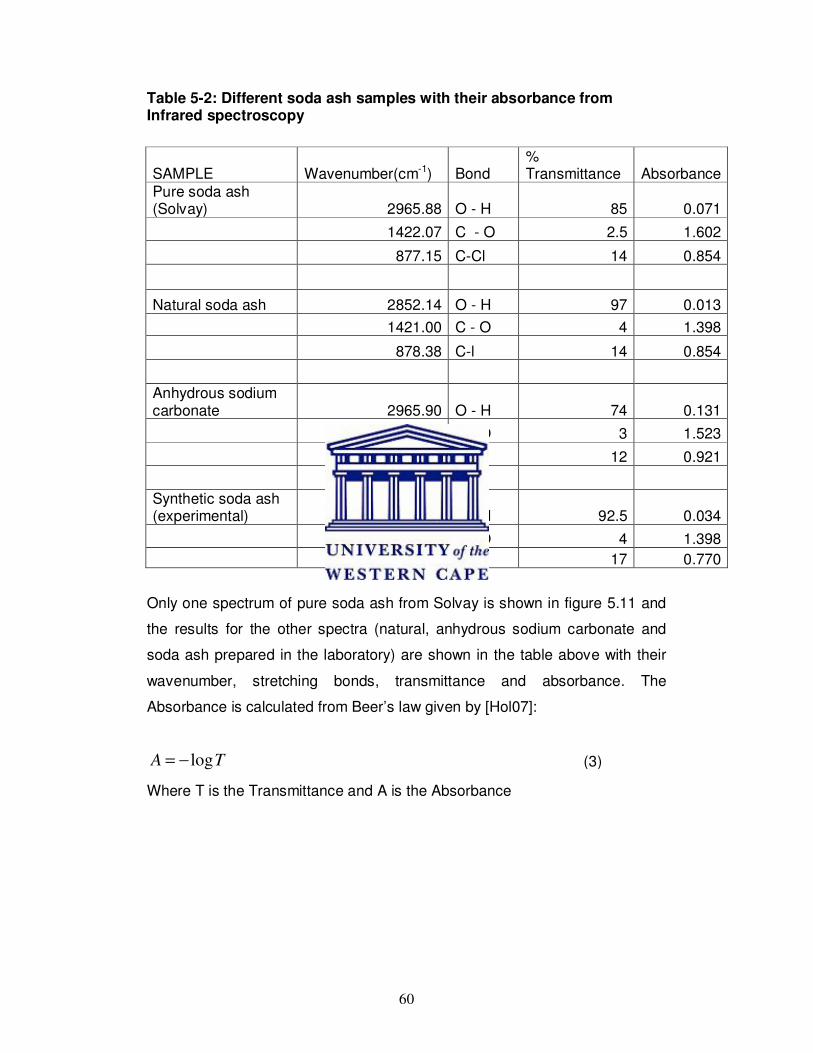
Table 5-2: Different soda ash samples with their absorbance from Infrared
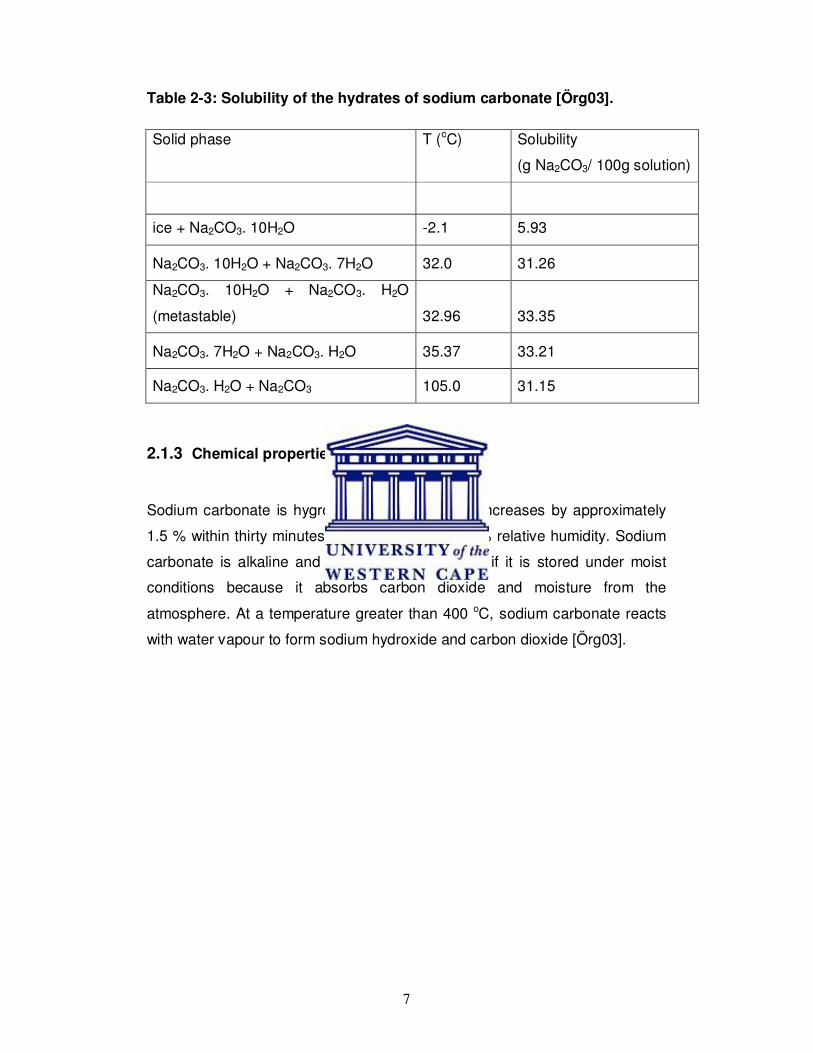
bichromate, Sodium sesquicarbonate (bath salts and water softener),
9
Sodium percarbonate (it is a bleaching agent and is also used in
cosmetology), chemically pure sodium carbonate (pharmaceuticals
industry, fine chemicals, cosmetics and food industry), sodium
bicarbonates in water ,flue and leather treatment, detergent and
cleaning products, plastic foaming, paper industry, fire extinguisher
powder, food products and animal feeds, pharmaceutical applications,
domestic uses and drilling mud to improve fluidity .
3. Soaps and detergents - Soda ash acts as a builder or water softener in
the formulation of soaps, detergents and other cleaning products. Soda
ash also acts as a source of alkalinity for adjusting the pH.
4. Steel industry - Soda ash is used in steel industry as a flux,
desulfurizer, dephosphorizer and denitrider.
5. Non-ferrous metallurgy industry – Soda ash is used in treatment of
uranium ores, oxidizing calcination of chrome ore, lead recycling from
discarded batteries, recycling of aluminium and zinc.
6. Other applications – production of various chemical fertilizers,
production of synthetic detergents, production of artificial sodium
bentonites, organic and inorganic colouring industry, petroleum industry
and natural gas refining, enamelling industry and fats, glue and gelatine
industry, etc. [Örg03], [Bac07], [Eur03], [Glo08].
10
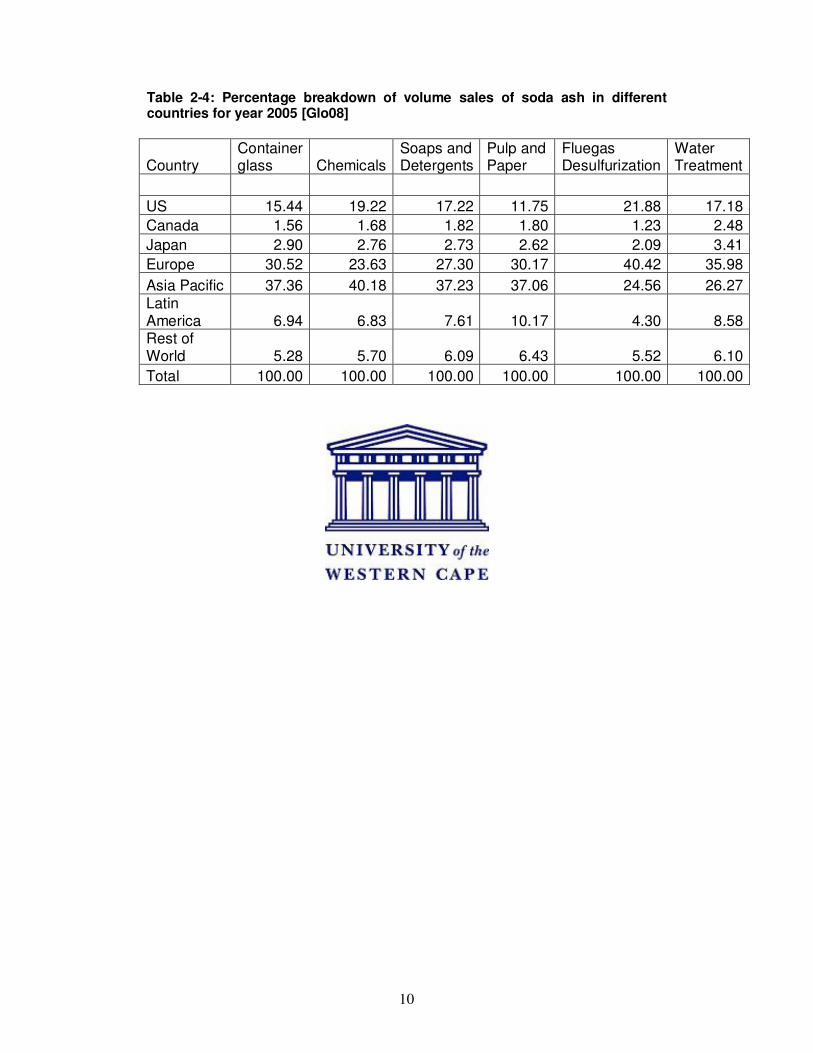
Table 2-4: Percentage breakdown of volume sales of soda ash in different countries for year 2005 [Glo08]
Country Container glass Chemicals
Soaps and Detergents
Pulp and Paper
Fluegas Desulfurization
Water Treatment
US 15.44 19.22 17.22 11.75 21.88 17.18 Canada 1.56 1.68 1.82 1.80 1.23 2.48 Japan 2.90 2.76 2.73 2.62 2.09 3.41 Europe 30.52 23.63 27.30 30.17 40.42 35.98 Asia Pacific 37.36 40.18 37.23 37.06 24.56 26.27 Latin America 6.94 6.83 7.61 10.17 4.30 8.58 Rest of World 5.28 5.70 6.09 6.43 5.52 6.10 Total 100.00 100.00 100.00 100.00 100.00 100.00
11
2.3 Manufacturing methods
Historically, soda ash was produced by extracting the ashes of certain plants,
such as Spanish Barilla [Cur91]. The land plants and the seaweed were
harvested, dried and burned, the ashes were then washed with water to form
an alkali solution. The solution was boiled dry to produce the final product,
soda ash. The concentration of sodium carbonate in soda ash varied very
widely, from 2-3 % for the seaweed (kelp) to 30% for the barilla from land
plants in Spain [Sod08].
2.3.1 Synthetic processes
2.3.1.1 Leblanc process
The Leblanc or black ash process was discovered in the period around
between 1825 and 1890 by the French physician Nicolas Leblanc [Eur03].
This synthetic process was named after its inventor [Kie02]. In this process,
soda ash was produced from common salt, sulfuric acid, coal and limestone.
Sodium chloride reacts with sulfuric acid to produce sodium sulfate and
hydrochloric acid. The sodium sulfate is then roasted with limestone and coal
and results into sodium carbonate and calcium sulfide mixture. The sodium
carbonate and calcium sulfide mixture is also known as black ash. Black ash
is then leached with water to extract the sodium carbonate [Örg03]. The
Leblanc process which is now of only historical interest, is based on the
following chemical reactions:
2NaCl + H2SO4 Na2SO4 + 2HCl (1)
Na2SO4 + 2C Na2S + 2CO2 (2)
Na2S + CaCO3 Na2CO3 + CaS (3)
12
The letter that was published in the Liverpool Mercury in October 1827 stated
that the Muspratt’s works poured out volumes of sulphurous smoke which
made the whole atmosphere dark, and also changed the stone colour to dark
[Hea96].
The smoke also affected the health of the people staying nearby [Hea96].
The other environmental impact was the emission of the large quantities of
hydrochloric acid gas and the production of calcium sulfide which emit
poisonous gas. This process was rediscovered and perfected by Ernest
Solvay in 1861 [Eur03]. The last Leblanc plant was closed down in 1923
[Örg03].
2.3.1.2 Solvay process
The Solvay process is also known as the ammonia soda process. The Solvay
process was developed by the Belgian Ernest Solvay (1838 – 1932) in 1861.
This process reduced the operating cost and environmental impact [Eur03].
The Solvay process is the most accepted technology for producing synthetic
soda ash because the investment and maintenance costs are low compared
to other processes [Dsi95]. The Solvay process is still the dominant
production route for soda ash [Cur91]. The basic raw materials that are used
in this process include salt, limestone and coke or natural gas and also
ammonia as a cyclic reagent [Wag92].
In this process the ammonia reacts with carbon dioxide and water to form
ammonium bicarbonate. The ammonium bicarbonate is then reacted with salt
to form sodium bicarbonate, which is calcinated to form sodium carbonate.
Chloride is formed as a byproduct and is neutralized with lime to produce
calcium chloride. Almost all the ammonia used in the reactions is recovered
and recycled. The Solvay process can be summarized by the following
theoretical global chemical reaction, which involves two main components
which are sodium chloride and calcium carbonate [Eur03] [Wag92].
2NaCl + CaCO3 Na2CO3 + CaCl2 (4)
13
The above reaction can not be applied directly in practice, the Solvay process
needs the use of other substances and also many different process steps
before getting to the final product which is soda ash [Eur03].
The Solvay process includes the following stages:
1. Production of a saturated salt solution
NaCl + H2O (5)
2. Burning of limestone and the CO2 recovered which is used in stage 4
while CaO is used in stage 7.
CaCO3 CaO + CO2 (6)
3. Saturation of the salt solution with ammonia
NaCl + H2O + NH3 + CO2 (7)
4. Precipitation of bicarbonate by adding carbon dioxide (from stage 2 and
6)
NaCl + H2O + NH3 + CO2 NH4Cl + NaHCO3 (8)
5. Filtration and washing of sodium bicarbonate
6. Thermal decomposition of sodium bicarbonate to sodium carbonate (the
carbon dioxide that is given off is recycled to stage 4)
2NaHCO3 Na2CO3 + H2O + CO2 (9)
7. Production of milk of lime
CaO + H2O Ca(OH)2 (10)
14
8. Recovery of ammonia by distillation of the mother liquor from stage 4
with milk of lime ( the ammonia that is released is recycled to stage 3)
2NH4Cl + Ca(OH)2 2NH3 + CaCl2 + 2H2O (11)
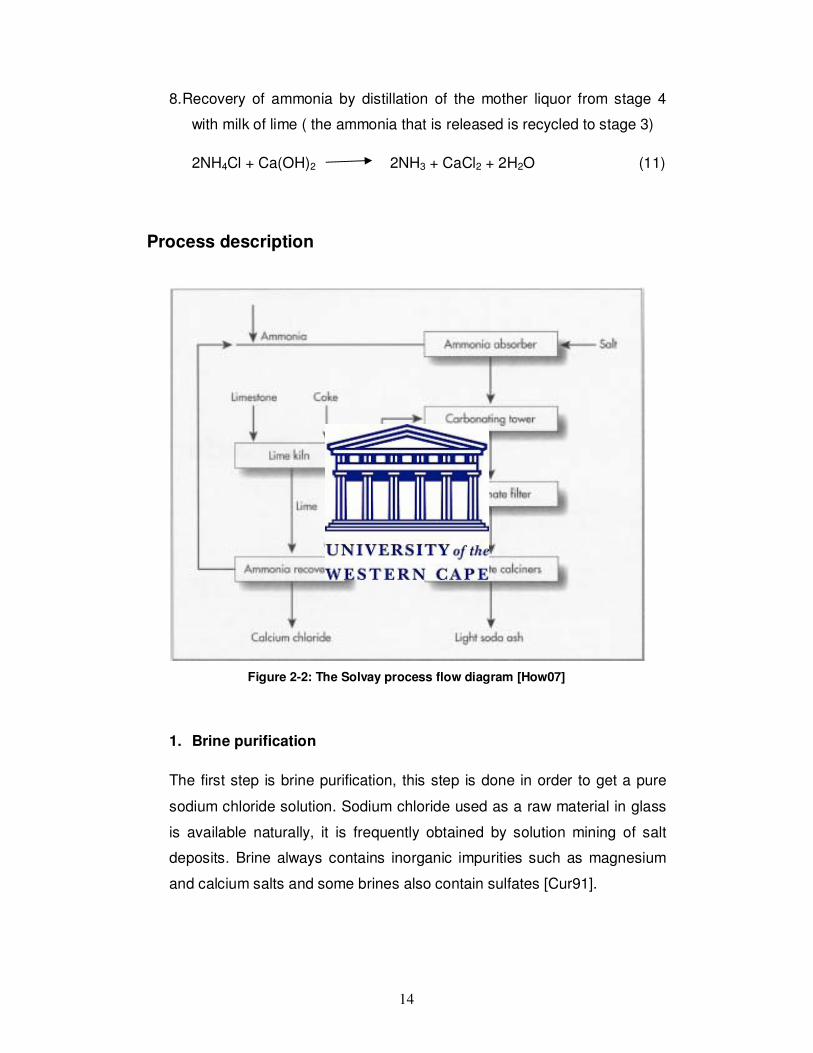
Process description
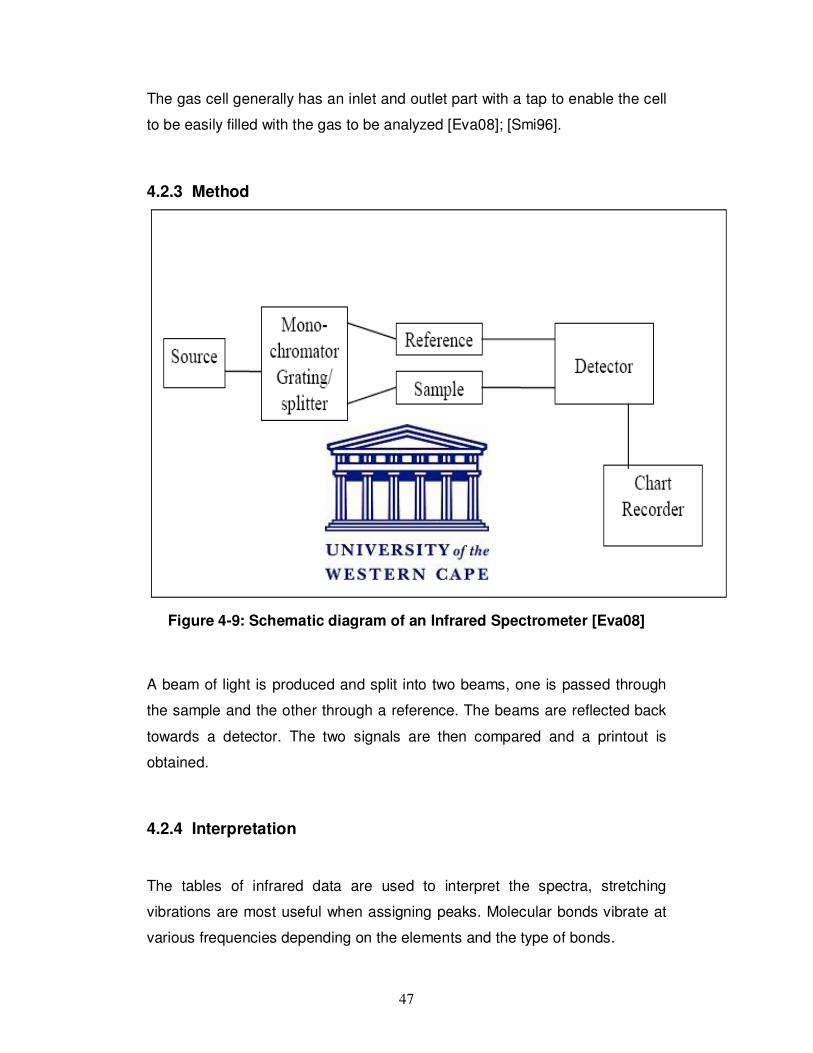
Figure 2-2: The Solvay process flow diagram [How07]
1. Brine purification
The first step is brine purification, this step is done in order to get a pure
sodium chloride solution. Sodium chloride used as a raw material in glass
is available naturally, it is frequently obtained by solution mining of salt
deposits. Brine always contains inorganic impurities such as magnesium
and calcium salts and some brines also contain sulfates [Cur91].
15
If the impurities are not removed they cause production problems: they
react with alkali and carbon dioxide to produce insoluble salts, and also
affect the quality of the finally produced soda ash [Thi03], [Eur03].
The purification of the brine is carried out by the lime - soda treatment or
lime – soda process. In the lime – soda process, magnesium ions are
precipitated as hydroxide with milk of lime (Ca (OH)2 concentration: 170 –
185 kg/m3) and calcium ions are precipitated as carbonate with soda ash
(Na2CO3 concentration: 65 – 80 kg/m3). The lime – soda process is given
by the chemical reactions:
Mg2+ + Ca (OH) 2 Mg (OH) 2 + Ca2+ (12)
Ca2+ + Na2CO3 CaCO3 + 2Na+ (13)
The brine is transferred to the ammonia absorbers after the separation
form the precipitated impurities.
2. Limestone burning and lime slaking
The acceptable limestone must be of very high purity (SiO2: < 3% ; Fe3O3
– Al2O3: < 1.5%) or contain low concentration of impurities. The limestone
must be hard and strong with the same coarse size. The limestone is
frequently mixed with about 7 % of metallurgical – grade coke or coal and
burned in vertical shaft kilns. The limestone is calcinated with coke to
produce carbon dioxide which is used in the carbonation stage and it also
produces calcium oxide which is used for the distillative recovery of
ammonia. The burning of the limestone (CaCO3) is carried out at a
temperature between 950oC and 1100oC.
Carbon dioxide is produced by decomposition of limestone and also by
combustion of carbon in the fuel:
CaCO3 CaO + CO2 (burning of limestone in lime kilns) (14)
16
The kiln gases are diluted with nitrogen from the combustion air.
The gas contains 37 – 42% CO2, stone dust, ash particles and other
gaseous impurities. The hot gas is cooled and cleaned by direct contact
with water. The gas is then transferred to the Carbon dioxide compressors
and then passed through to the carbonating columns. The lime from the
kiln is cooled by the air which is entering the lower parts of the shaft kiln.
After the cooling, the lime is discharged from the kiln and reacted with
used cooling water (50 – 65oC) to produce a thick suspension of calcium
hydroxide (Ca (OH)2) in water (concentrated milk of lime at temperature
range of 90 – 100oC):
CaO + H2O Ca (OH)2 (Lime slaking) (15)
The calcium oxide (CaO) content of the milk of lime can get to 5.5 mol/L in
favourable conditions. The milk of lime is added to the distillation step in
the recovery of ammonia. Before milk of lime is added to the distillation
step, coarse sand and unburnt limestone are removed by sieves, mixed
with new limestone and recycled to the kiln.
3. Ammonia absorption
The gas from the distillation step contains ammonia (NH3) and carbon dioxide
(CO2) and is saturated with water vapour in an absorption tower. At this stage
of ammonia absorption, the gas is absorbed by purified brine. The obtained
ammoniacal brine consists of 85 – 90 kg/m3 ammonia and 40 – 50 kg/m3
carbon dioxide.
The sodium chloride content is decreased from 300 g/L to 260 g/L because of
the increase in the specific volume of the liquor caused by the addition of
ammonia and by dilution with water. The reactions occurring in the absorption
stage are strongly exothermic and given by the chemical equations:
NH3 + H2O NH4OH + amount of heat = -34 900kJ (16)
2NH4OH + CO2 (NH4)2CO3 + H2O + amount of heat = - 90 850kJ(17)
17
The reaction requires cooling of the liquid. The brine needs cooling (394
kcal/kg) of the product soda ash during ammoniation. This process is done at
slightly less than atmospheric pressure.
4. Precipitation of bicarbonate
The precipitation of sodium carbonate is an exothermic process.
NaCl + NH4HCO3 NaHCO3 + NH4Cl + energy (18)
This reaction involves the reaction of ammoniated brine and carbon dioxide.
The ammoniated brine comes from the absorption stage whereas carbon
dioxide comes from the lime kiln or from the calcination stage. The
ammoniated brine is pumped to the top of one of the columns that is used to
precipitate bicarbonate (NaHCO3). Lime kiln gas is compressed to about 414
kPa, enters the bottom of the column and bubbles up through the solution and
also absorbs a large amount of carbon dioxide. The concentration of carbon
dioxide that is in the liquid leaving the column is kept below the bicarbonate
precipitation level .The liquid is then placed in parallel to the top of the other
columns. One of the columns is a cleaning column. The temperature in the
columns is 50 – 60 oC. The precipitation of sodium bicarbonate happens after
making the columns to receive the mixture of kiln gas and bicarbonate
calciner gas that bubbles up through the solution. The suspension of
bicarbonate in mother liquor leaves the carbonation stage at a temperature of
30oC.
Nitrogen gas and some carbon dioxide and ammonia are vented from the
crystallizing tower columns and collected before they are recycled to the
absorption stage ([Cur91], [Thi03].)
18
5. Filtration of Bicarbonate
Bicarbonate crystals are normally separated from the mother liquor by the use
of vacuum filters, band filters and centrifuges.
When filters are used vacuum pumps pull the air through the cake and after
that, the gas that is carrying ammonia and some carbon dioxide gas is
cleaned and released to the atmosphere.
The filter cake is washed carefully with water and the remaining mother liquor
chloride is eliminated. The mother liquor chloride is sent to a calcination stage
and the mother liquor in liquid phase is sent to the distillation stage for the
recovery of ammonia [Eur03], [Thi03], [Cur91].
6. Calcination of Bicarbonate to soda ash
Calcination of bicarbonate is usually performed in rotary calciners. The rotary
calciners are heated externally with coal, oil or gas or internally with steam.
Thermal decomposition of crude bicarbonate to carbonate gives out carbon
dioxide, ammonia and water vapour. The carbonate product is technical-grade
soda ash that contains sodium chloride. The main reaction is
2NaHCO3 CO2 + H2O + Na2CO3 (19)
and other reactions are
NH4HCO3 NH3 + CO2 + H2O (20)
NaHCO3 + NH4Cl NH3 + CO2 + H2O + NaCl (21)
Heat is required for the calcinations of bicarbonate. The amount of heat that is
needed is 0.92 GJ/t of soda ash but the stated value does not include the
amount of heat required for drying the product. The total heat required for
calcinations of bicarbonate in rotary calciners is 3.7 GJ/t of soda ash.
19
The heat is provided at a temperature of 180oC. The temperature for the
decomposition of sodium bicarbonate (NaHCO3) is 87.7oC.
Gases removed from the rotary calciners contain carbon dioxide, ammonia,
water, some leakage air and large amounts of sodium carbonate and
bicarbonate dust.
The gas is cooled and also washed with brine and water to remove ammonia
to condense water before it is used in the carbonation stage. The
condensates that are formed are sent to the distillation stage for the recovery
of ammonia [Thi03].
7. Recovery of Ammonia
The filtered liquor contains unreacted sodium chloride, hydrogencarbonate
and ammonia as ammonium carbonate, they are recovered by distillation
followed by absorption. (NH4)2CO3 and NH4HCO3 are decomposed
completely at the temperature between 85oC and 90oC and also gives out all
the carbon dioxide and small part of ammonia from the solution. NH4Cl react
with milk of lime to release ammonia.
2NH4Cl + Ca(OH)2 2NH3 + 2H2O + CaCl2 (22)
The above reaction comes after the thermal decomposition of (NH4)2CO3 and
NH4HCO3 to avoid precipitation of calcium carbonate and taking in of
additional milk of lime. Ammonia can be fixed or free. Fixed ammonia
corresponds stoichiometrically to the precipitated sodium carbonate.
Distillation gas which contains ammonia and carbon dioxide is cooled to a
temperature between 55oC and 60oC in the still condenser and still preheater.
20
2.3.1.3 DUAL (Modified Solvay process)
DUAL process is also known as modified Solvay process because the
producers made several modifications to the original Solvay process. DUAL
process was developed and operated in Japan. The modified Solvay process
came in commercial use in 1980 [Wag92]. This synthetic process combines
the production of soda ash with the production of ammonium chloride. The
ammonium chloride produced is crystallized by cooling and through the
addition of solid sodium chloride unlike in the Solvay process. The importance
of the DUAL process in Japan is due to the high cost of imported rock salt and
the use of the ammonium chloride as a fertilizer especially in rice cultivation
[Örg03]. There are several plants that are using the DUAL process in other
parts of the world, most of the plants are situated in China.
DUAL process uses mainly salt (sodium chloride), carbon dioxide and
ammonia as raw materials. This process does not require limestone, an
important raw material that is used in the Solvay process [Wag92]. The
ammonium chloride is formed through the following chemical reaction:
NaCl + NH4 + CO2 + H2O NaHCO3 + NH4Cl (23)
Ammonia is recovered in the Solvay process. In the modified Solvay process
ammonium chloride is retained and crystallized out and separated by adding
sodium chloride.
Sodium bicarbonate is calcined to form soda ash in both processes:
2NaHCO3 Na2CO3 + CO2 + H2O (24)
21
Process description
1. Ammonia absorption
NH3 + H2O NH4OH (25)
2NH4OH + CO2 (NH4)2CO3 + H2O (26)
2. Carbonation of the ammonia brine and production of sodium
bicarbonate and ammonium chloride
(NH4)2CO3 + CO2 + H2O 2NH4HCO3 (NH4)HCO3 + NaCl NaHCO3
+ NH4Cl (27)
3. Filtration of sodium bicarbonate
4. Crystallization and separation of ammonium chloride
5. Decomposition of bicarbonate into soda ash and recovery of carbon
dioxide [Wag92], [Wip07]
2NaHCO3 + Heat Na2CO3 + H2O + CO2 (28)
2.3.1.4 Environmental impacts of synthetic processes
The Solvay process results in the production of liquid, gas and solid wastes.
The liquid and solid wastes are usually discharged into rivers, lakes and sea.
Gaseous effluents
Particulate dust
During the production of soda ash dust is released in limited quantities. The
dust is emitted from handling process of the raw materials (carbon from coke;
CaO from burnt lime; CaCO3, Al2O3 and SiO2 from limestone and sand),
handling of soda ash and the production of dense soda ash from light soda
ash and also limestone conversion in kilns.
22
Carbon monoxide and carbon dioxide
During the burning of limestone (CaCO3) to produce CaO inside the limekilns,
carbon dioxide (CO2) and carbon monoxide (CO) are produced from the
combustion of coke and from the burning of limestone.
Nitrogen oxides
During the combustion, nitrogen oxides are produced by oxidation of nitrogen
inside the kiln.
Sulphur oxides
Sulphur oxides are produced by the oxidation of compounds that contain
sulphur in the limestone and coke.
Ammonia
Atmospheric emissions containing ammonia is released from the filtration of
sodium bicarbonate, the precipitation of sodium bicarbonate, from filters and
handling and processing of distillation effluent.
Liquid effluent
Liquid effluents in soda ash production are normally from wastewater from
distillation, wastewater from brine purification, cooling water from lime kiln gas
washer, cooling of CO2, cooling in absorption and distillation towers and also
calcilnation.
Solid effluent
Solid effluents produced in soda ash production are normally from fines of raw
limestone from screening and also non recycled stone grits at slaker [Eur03],
[Ste07].
23
2.3.2 Natural processes
Apart from synthetic processes, soda ash can also be produced from natural
soda reserves and production from lake waters [Örg03]. Natural soda ash-
containing brines and deposits were found in the United States at Searles
Lake, Carlifonia and Green River, Wyoming in the late 1800s. During the first
half of the 1900s the Searles Lake deposit was commercialized and the
production facilities improved and expanded.
In 1938 large deposits of trona, Na2CO3.NaHCO3.2H2O were found in the
Green River basin [Cur91]. Deposits of sodium carbonate are found in large
quantities in Botswana, China, Egypt, India, Kenya, Mexico, Peru, Turkey, and
the USA.
The major natural sodium carbonate deposits include trona from Green River,
Wyoming, USA (operated by FMC Industrial Chemicals, General Chemical
Industrial Products Inc., OCI Chemical Corp. and Solvay Chemicals Inc.)
(check Table 2-4 and 2-5 for the soda ash production in U.S.), brine from
Searles lake, California, USA (Searles Valley Minerals Inc.), brines from Lake
Magadi, Kenya (Magadi Soda Co., a wholly owned subsidiary of Brunner
Mond, which has been bought by Tata Chemicals Ltd, India) and brines from
Sua pan in Botswana (Botswana Ash or Botash) [Bac07].
24
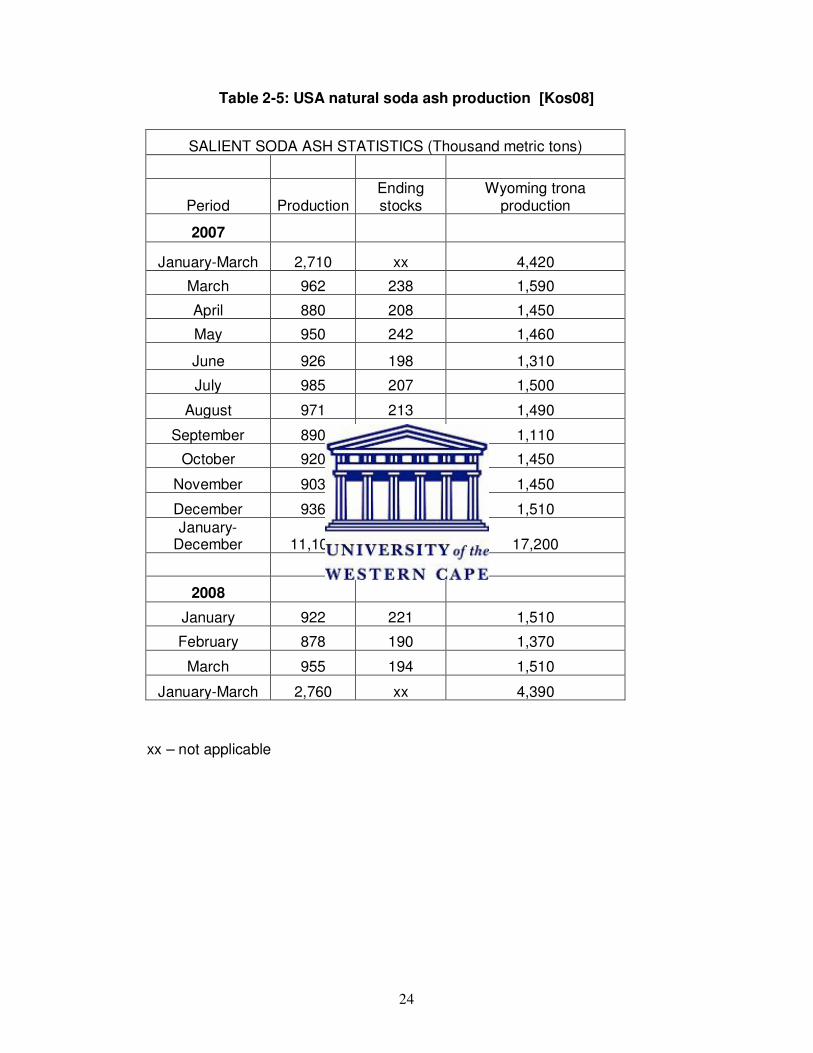
Table 2-5: USA natural soda ash production [Kos08]
SALIENT SODA ASH STATISTICS (Thousand metric tons)
Period Production Ending stocks
Wyoming trona production
2007
January-March 2,710 xx 4,420
March 962 238 1,590
April 880 208 1,450
May 950 242 1,460
June 926 198 1,310
July 985 207 1,500
August 971 213 1,490
September 890 251 1,110
October 920 203 1,450
November 903 158 1,450
December 936 206 1,510 January-
December 11,100 xx 17,200
2008
January 922 221 1,510
February 878 190 1,370
March 955 194 1,510
January-March 2,760 xx 4,390
xx – not applicable
25
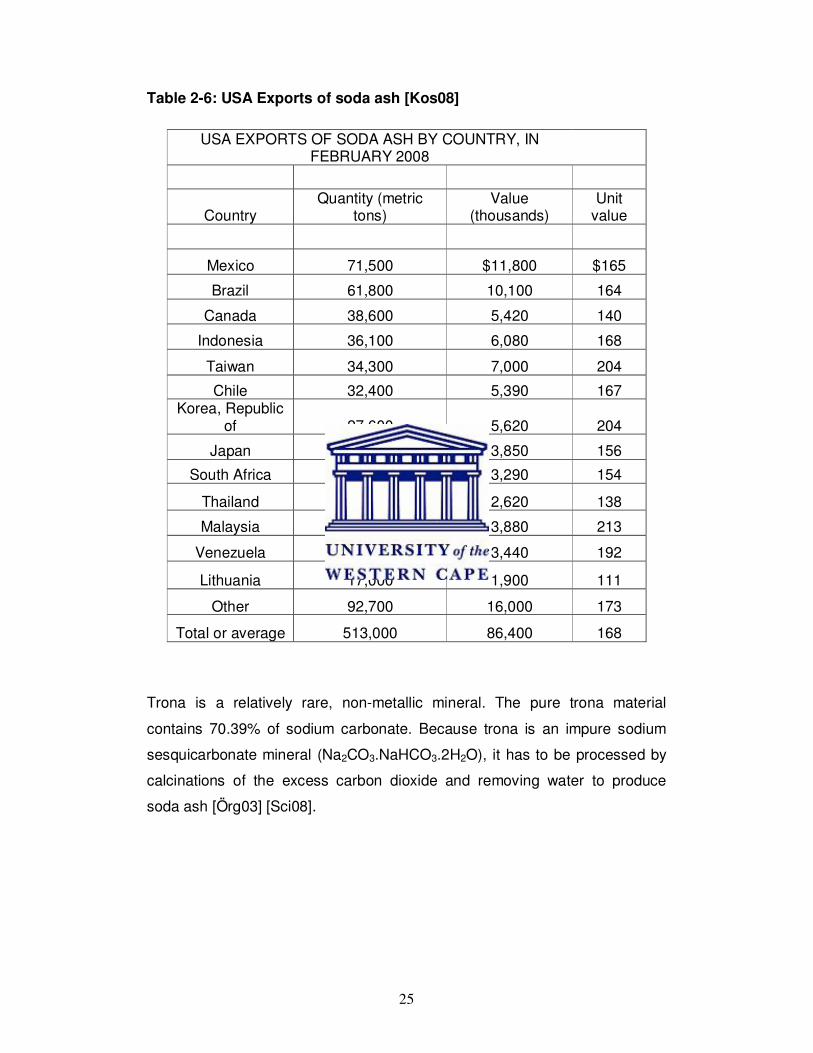
Table 2-6: USA Exports of soda ash [Kos08]
USA EXPORTS OF SODA ASH BY COUNTRY, IN FEBRUARY 2008
Country Quantity (metric
tons) Value
(thousands) Unit
value
Mexico 71,500 $11,800 $165
Brazil 61,800 10,100 164
Canada 38,600 5,420 140
Indonesia 36,100 6,080 168
Taiwan 34,300 7,000 204
Chile 32,400 5,390 167 Korea, Republic
of 27,600 5,620 204
Japan 24,700 3,850 156
South Africa 21,400 3,290 154
Thailand 19,000 2,620 138
Malaysia 18,200 3,880 213
Venezuela 17,900 3,440 192
Lithuania 17,000 1,900 111
Other 92,700 16,000 173
Total or average 513,000 86,400 168
Trona is a relatively rare, non-metallic mineral. The pure trona material
contains 70.39% of sodium carbonate. Because trona is an impure sodium
sesquicarbonate mineral (Na2CO3.NaHCO3.2H2O), it has to be processed by
calcinations of the excess carbon dioxide and removing water to produce
soda ash [Örg03] [Sci08].
26
2.3.2.1 Trona purification processes
The raw trona can be processed by the use of different methods:
sesquicarbonate process, monohydrate process, alkali extraction process and
carbonation process.
The two processes (monohydrate process and sesquicarbonate process) are
mainly used to produce refined soda ash (sodium carbonate (Na2CO3)) from
trona. Both processes entail the same unit operations only in different
sequences.
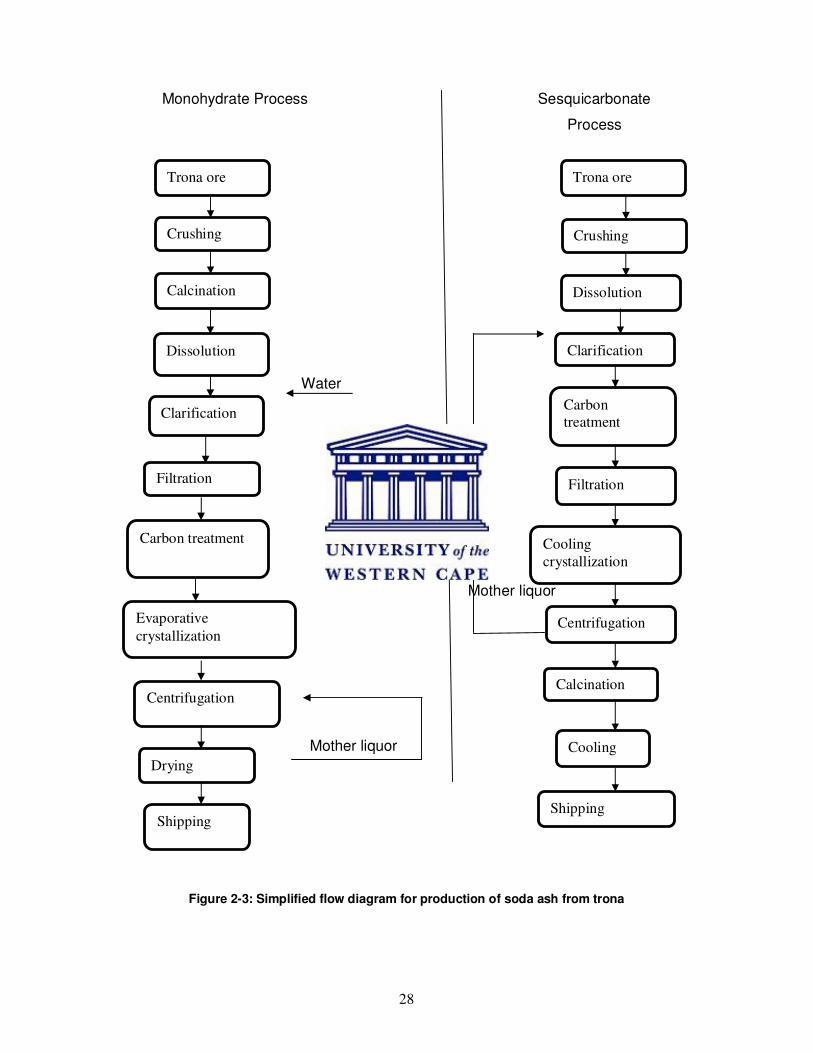
Most soda ash is made using the monohydrate process. Figure 2-3 shows a
simplified flow diagram for monohydrate process and sesquicarbonate
process [Örg03], [Cur91].
Monohydrate Process
This process involves crushing and screening of trona ore. Trona ore contains
sodium carbonate (Na2CO3) and sodium bicarbonate (NaHCO3) and also
some impurities such as silicates and organic matter. After the screening of
the trona ore, it is calcined (heated) at the temperature between 150oC and
300oC using rotary gas-fired and coal grate-fired calciners to convert sodium
bicarbonate to sodium carbonate.
The crude soda ash is then dissolved in hot, clear recycled liquor which is
then clarified and filtered to separate the solution from the insoluble solids.
Sometimes the liquor is sent through activated carbon beds before
crystallization to remove dissolved organic matter which may affect the
crystallizer performance by foaming and colour problems in the final product
[Neu98].
Sodium carbonate monohydrate is precipitated by evaporative crystallization
[Örg03]. The monohydrate slurry is centrifuged and the monohydrate crystals
are then sent to dryers to produce soda ash.
27
Sesquicarbonate process
In this process trona ore is dissolved in hot liquor, clarified, filtered to remove
insolubles and then sent to be crystallized by cooling to form sodium
sesquicarbonate, Na2CO3.NaHCO3.2H2O [Cur91]. The sesquicarbonate
crystals are then separated from the mother liquor, centrifuged and calcined to
produce soda ash (anhydrous sodium carbonate) ([Örg03], [Cur91]).
28
Monohydrate Process Sesquicarbonate
Process
Water
Mother liquor
Mother liquor
Mother liquor
Figure 2-3: Simplified flow diagram for production of soda ash from trona
Crushing
Trona ore
Calcination
Dissolution
Clarification
Filtration
Carbon treatment
Evaporative
crystallization
Centrifugation
Drying
Shipping
Trona ore
Crushing
Dissolution
Clarification
Carbon
treatment
Filtration
Cooling
crystallization
Centrifugation
Calcination
Cooling
Shipping
29
CHAPTER 3
EXPERIMENTS
3.1 Introduction
The Solvay process involves the saturation of brine solution by ammonia and
carbon dioxide gas and also shows the difference in solubility between
ammonium and sodium bicarbonate that is produced in the reaction. The final
products produced in the Solvay process are sodium carbonate and calcium
chloride (figure 3-1).
Na NaHCO3 NH4Cl
Figure 3-1: Simplified flow diagram of the Solvay process
All the reactions involved in the Solvay process are important and simple.
Examples of the experiments that investigate the synthesis of sodium
carbonate by the Solvay process in the laboratory are rare to find.
The known experiments have little similarity to the unitary operations that
occur in the industrial continuous process.
NaCl CaCO3(s)
CaO
CO2 gas NH3 gas
NaHCO3
NH4Cl
CaCl2
H2O vapour
Na2CO3(s)
30
One of those experiments was done in the laboratory and it is explained
below. The other experiment which was also done in the laboratory explained
the new arrangement from those mentioned above, this experiment allows the
accurate reproduction and it uses simple laboratory apparatus. The
experiment involves the brine ammonization and carbonation process
followed by the precipitation of sodium bicarbonate.
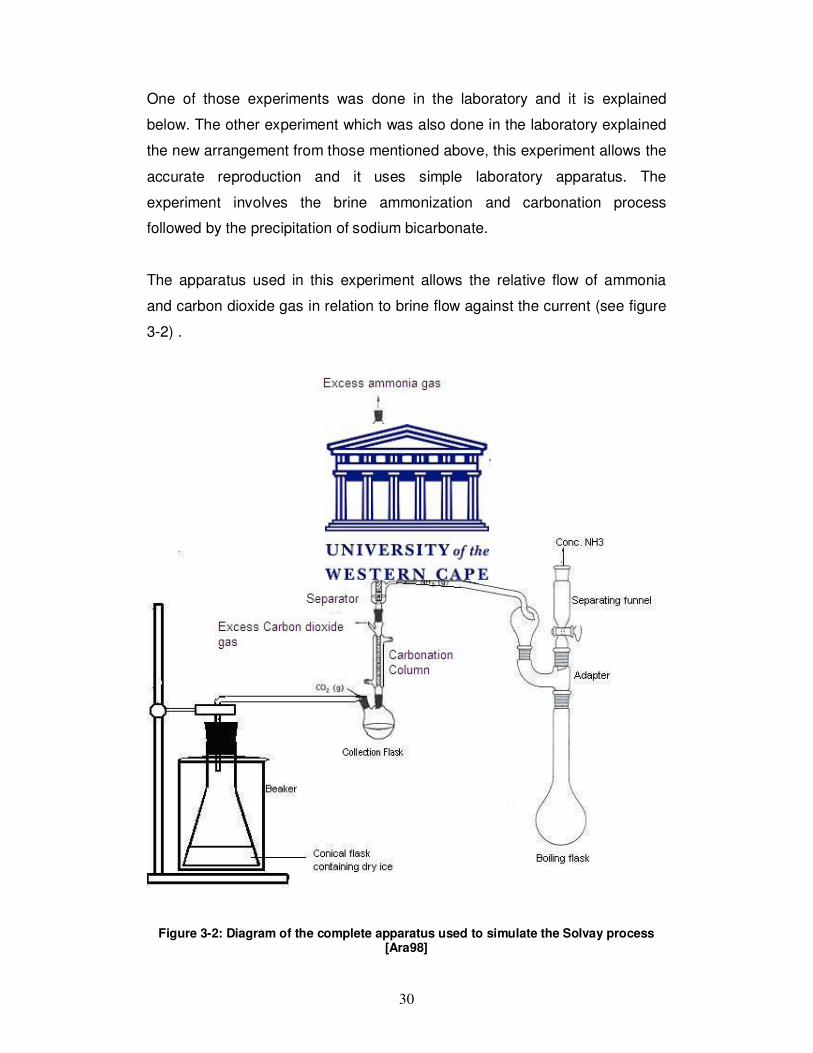
The apparatus used in this experiment allows the relative flow of ammonia
and carbon dioxide gas in relation to brine flow against the current (see figure
3-2) .
Figure 3-2: Diagram of the complete apparatus used to simulate the Solvay process
[Ara98]
31
3.2 SOLVAY PROCESS EXPERIMENT
3.2.1 Experimental procedure
3.2.1.1 Preparation of sodium bicarbonate
Figure 3-3: The photographic representation of the experiment
The 40 ml of 4 M ammonia solution was measured with the measuring
cylinder and transferred to a 250 ml conical flask.
A 20.0467 g of Sodium chloride, weighed using an analytical balance, was
added to the ammonia solution. The mixture was swirled for a few minutes
until all NaCl dissolved.
32
The filter paper was folded and fitted in the funnel. When the solution was
saturated the excess solid was filtered out and the clear solution drained in
the reaction test tube.
A 100 ml of powdered dry ice was added in the conical flask. The 600 ml
beaker was used to hold a 250 ml conical flask containing dry ice. A gas
delivering tube and a stopper were used. The gas delivery tube was extended
from the conical flask to the bottom of the test tube.
Bubbles started to appear when carbon dioxide gas was transferred to react
with the ammonia solution. The clamp was put above the gas generating
conical flask surrounding the rubber tube. Another clamp was also put above
the reaction test tube.
The reaction proceeded for 30 minutes until the significant amount of the
precipitate started to form. The reaction proceeded for another 15 minutes at
room temperature and a fairly heavy precipitate of sodium bicarbonate
formed. After the 15 minutes period was over a 400 ml beaker was put under
the reaction tube and the reaction was cooled to 0oC by adding ice and water
to the beaker. About 7 ml of distilled water was put in a large test tube and
cooled in a 250 ml beaker containing ice and some water.
The carbon dioxide continued bubbling into the cooled reaction test tube for
an additional 15 minutes, more sodium bicarbonate formed as more carbon
dioxide reacted with ammonia and more of the already formed sodium
bicarbonate precipitated out (see figure 3-2). After 15 minutes the stopper at
the top of the reaction test tube was carefully disconnected.
The cold precipitated sodium bicarbonate was collected in a clean Buchner
funnel, filter flask and filter paper using a suction filtration. Some of the filtered
mother liquor was used to rinse out sodium bicarbonate in the test tube. The
suction ran for 1 minute and the vacuum was shut off.
A 3 ml volume of ice cold distilled water prepared in the test tube was added
and distributed around the filter cake. After 10 seconds the vacuum was
turned on.
33
The washing procedure was repeated to complete the removal of the mother
liquor which contains impurities such as sodium chloride and ammonia
chloride.
The filter paper was used to press the crystals with the suction on to dry them.
The crystals of sodium bicarbonate were left for five minutes with the suction
on and then the crystals were placed on a clean watch glass and allowed to
dry in the laboratory locker.
3.2.1.2 Converting the sodium bicarbonate to sodium carbonate
The dry sodium bicarbonate on the watch glass was put in the mortar and
ground in the clean and dry mortar with a pestle. The 0.7012 g of sodium
bicarbonate was weighed in a dry clean test tube using an analytical balance.
With the sodium carbonate at the bottom of the test tube, the test tube was
held with the test tube holder.
The test tube and its contents were heated with the Bunsen burner. The test
tube was heated gently until all the carbon dioxide and water were driven off.
The test tube was heated below red heat for a few minutes continuously
moving the tube in the flame.
After a few minutes of heating the test tube and its contents were left to cool
to room temperature and the sodium carbonate was weighed using an
analytical balance to be 0.3954 g.
34
3.3 SIMULATION OF SOLVAY PROCESS IN THE LABORATORY
Figure 3-4: The photographic representation of the Solvay process experiment
35
Method
The ammonization and carbonation processes are carried out using the flow
against current method, similar to the industrial process. The apparatus
includes two columns. The columns are connected by means of a bell-glass
type separator which allows the drainage of the column above to the lower
column due to gravity, and prevents the rise of CO2 to the ammonization
column (see figure 3-4.).
50g of Sodium chloride was weighed and 100ml of water was added to the
NaCl salt. The solution was stirred with the magnetic stirrer until almost all
sodium chloride dissolved. The experimental set-up was done as shown in the
diagram (see figure 3-2). The ammonia gas was also generated by adding
concentrated ammonia in drops over sodium hydroxide pellets. The carbon
dioxide gas was generated by heating dry ice. The brine solution was added
in drops to the top column. The experiment was left to run for five hours.
The sodium bicarbonate was filtered under suction, the crystals were washed
by cold distilled water. The final product was weighed to be 0.2 g.
3.4 Second simulation of Solvay process in the laboratory
The experiment was conducted as the one in section 3.3, a carbon dioxide
gas cylinder was used instead of generating carbon dioxide gas from dry ice
and ammonia gas cylinder was also used instead of generating ammonia gas
from concentrated ammonia solution. The gases were difficult to control as
they were not flowing at the same rate.
36
CHAPTER 4
ANALYTICAL TECHNIQUES
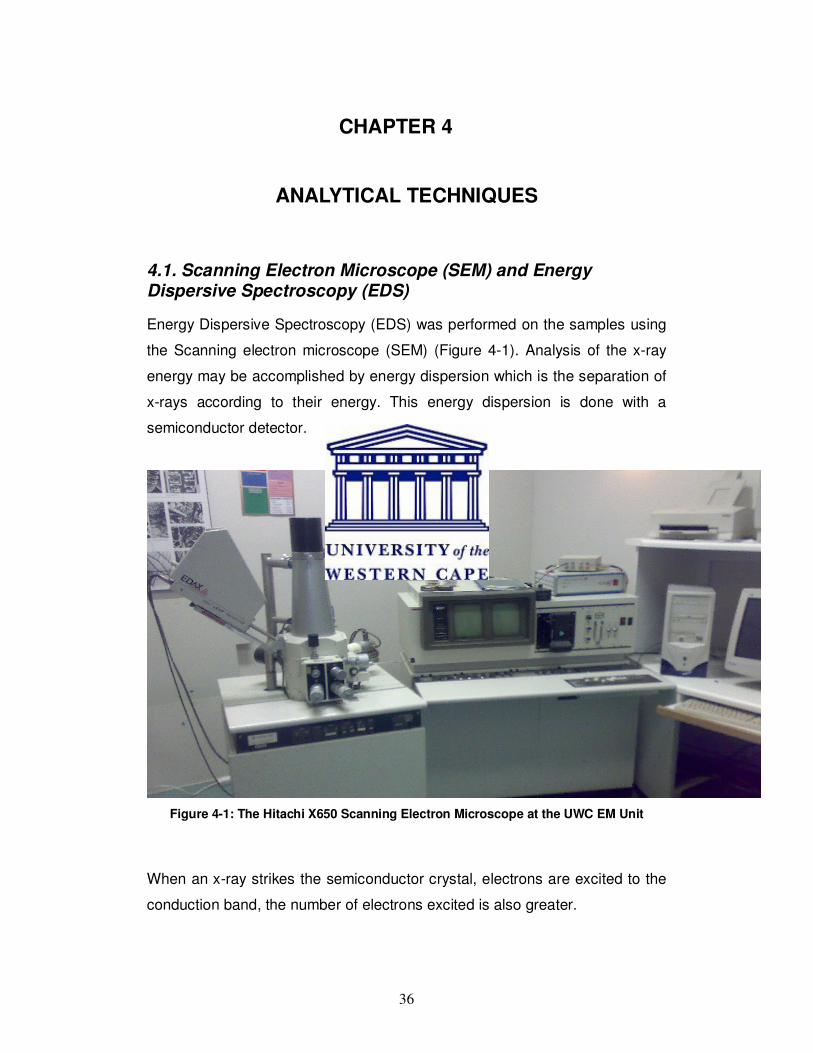
4.1. Scanning Electron Microscope (SEM) and Energy Dispersive Spectroscopy (EDS)
Energy Dispersive Spectroscopy (EDS) was performed on the samples using
the Scanning electron microscope (SEM) (Figure 4-1). Analysis of the x-ray
energy may be accomplished by energy dispersion which is the separation of
x-rays according to their energy. This energy dispersion is done with a
semiconductor detector.
Figure 4-1: The Hitachi X650 Scanning Electron Microscope at the UWC EM Unit
When an x-ray strikes the semiconductor crystal, electrons are excited to the
conduction band, the number of electrons excited is also greater.
37
An electric count pulse is generated closer to a high voltage applied over the
semiconductor. The electric pulse is proportional to the energy of the x-ray.
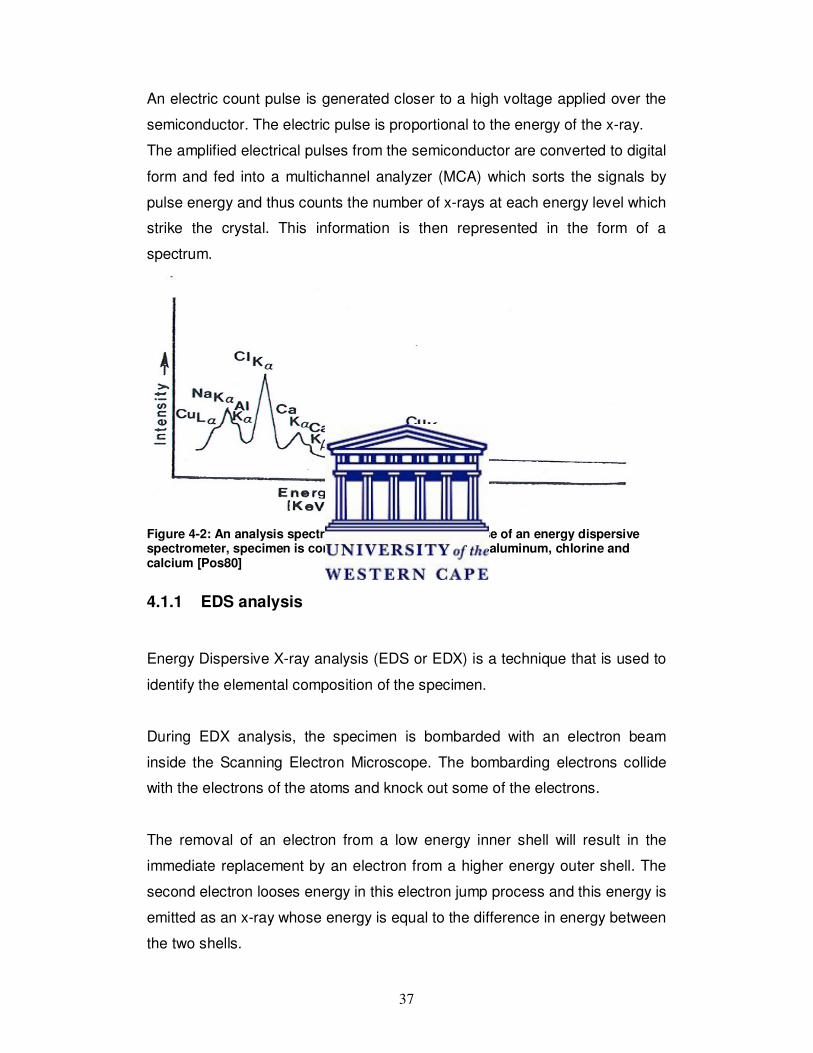
The amplified electrical pulses from the semiconductor are converted to digital
form and fed into a multichannel analyzer (MCA) which sorts the signals by
pulse energy and thus counts the number of x-rays at each energy level which
strike the crystal. This information is then represented in the form of a
spectrum.
Figure 4-2: An analysis spectrum obtained through the use of an energy dispersive spectrometer, specimen is composed of copper, sodium, aluminum, chlorine and calcium [Pos80]
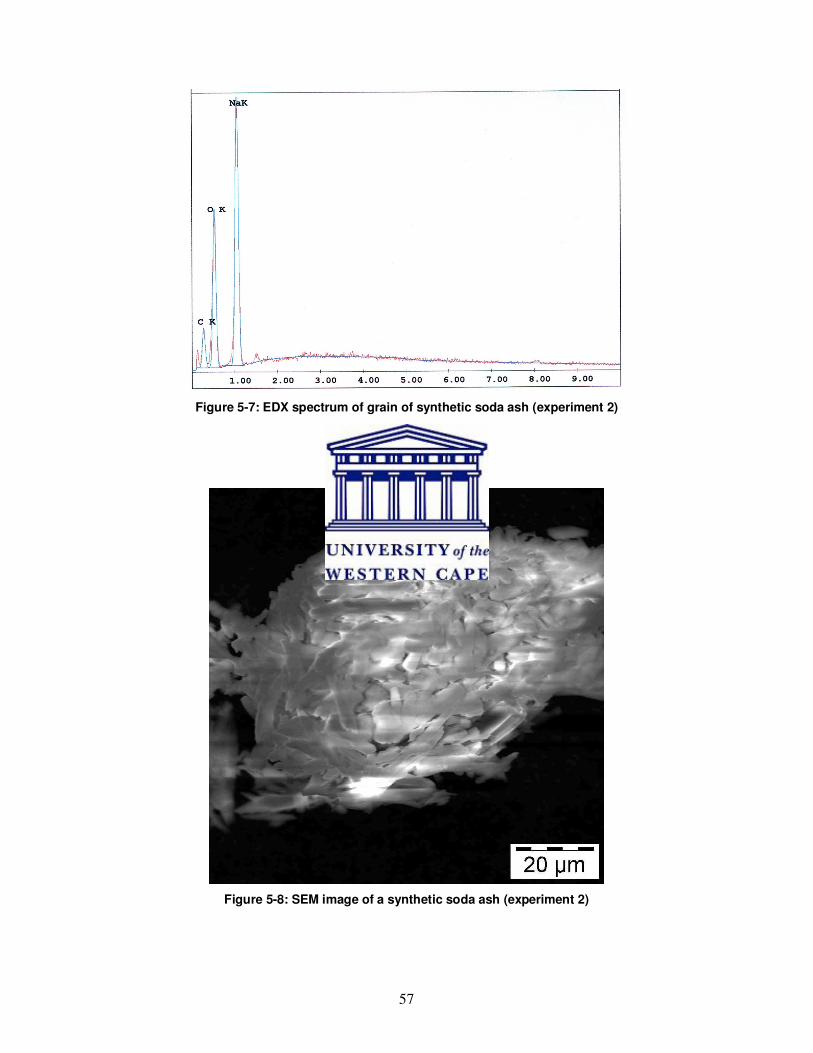
4.1.1 EDS analysis
Energy Dispersive X-ray analysis (EDS or EDX) is a technique that is used to
identify the elemental composition of the specimen.
During EDX analysis, the specimen is bombarded with an electron beam
inside the Scanning Electron Microscope. The bombarding electrons collide
with the electrons of the atoms and knock out some of the electrons.
The removal of an electron from a low energy inner shell will result in the
immediate replacement by an electron from a higher energy outer shell. The
second electron looses energy in this electron jump process and this energy is
emitted as an x-ray whose energy is equal to the difference in energy between
the two shells.
38
The atom of every element emits x-rays with unique amounts of energy
depending on the energy levels of the atom. The identity of the atom from
which the x-ray was emitted is found by measuring the energy of the x-rays
being released by a specimen during electron beam bombardment. The
output of an EDX analysis is the EDX spectrum. The EDX spectrum normally
displays peaks corresponding to the energy levels for which the most x-rays
had been received. Each of the peaks is unique to an atom and corresponds
to the specific element. The higher the peak is in the spectrum, the more the
concentration of the element in the specimen.
The EDX software does not only identify the element corresponding to the
peak, it also shows the energy level to which it corresponds. A peak
corresponds to the amount of energy possessed by x-ray emitted by an
electron in the L-shell moving down to the K-shell is identified as a K-Alpha
peak. The peak that corresponds to x-rays emitted by M-shell electrons
moving down to the K-shell is identified as a K-Beta peak (Figure 4-3).
Figure 4-3: The spectrum of x-rays that may be generated from a single element
α
α
α
β β
α
K L M N
M Series
L Series
K Series
39
Quantitative energy dispersive analysis is the determination of the elemental
composition of a sample as a percentage of the total detectable sample
composition. The elemental analysis would be simple if the relative intensities
of the spectral peaks shown on the multichannel analyzer (MCA) were equal
to the relative abundance of atoms of the corresponding elements in the
specimen. In that condition, peak’s intensity’s ratio to the sum of intensities of
all peaks would be equal to the composition of the element as a percentage of
the whole specimen. However peak intensity is not a direct measure of the
specimen composition.
Elemental abundance is one of the many factors that affect the relative peak
intensity. There are other several factors that affect relative peak intensity:
1. The rate of x-ray production varies with atomic number (Z) and
accelerating potential e.g. heavy elements produce more x-rays than
light elements.
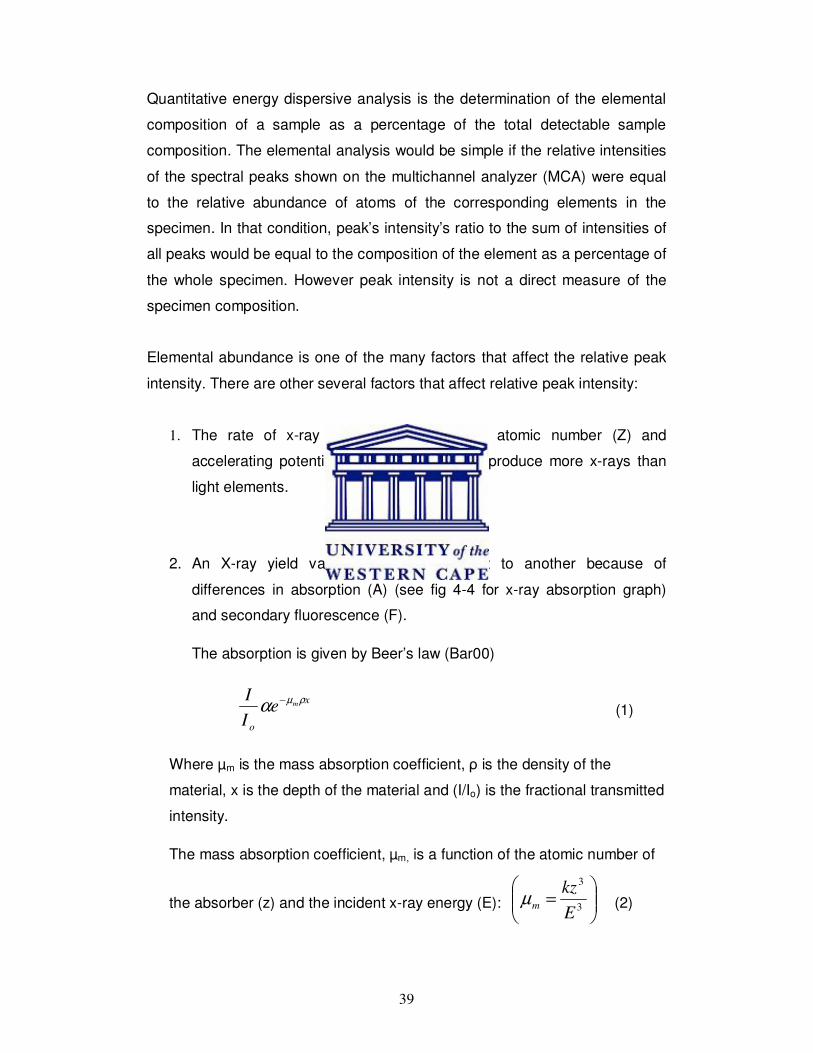
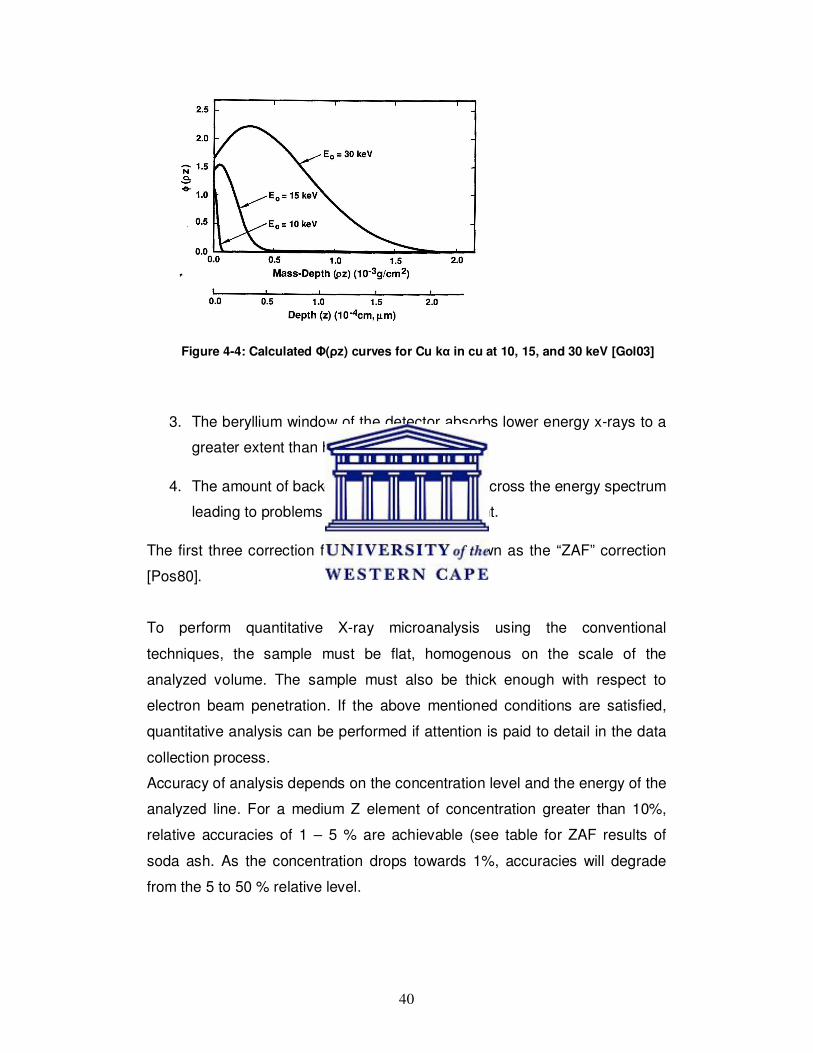
2. An X-ray yield varies from one element to another because of
differences in absorption (A) (see fig 4-4 for x-ray absorption graph)
and secondary fluorescence (F).
The absorption is given by Beer’s law (Bar00)
x
o
meI
I ρµα
−
(1)
Where µm is the mass absorption coefficient, ρ is the density of the
material, x is the depth of the material and (I/Io) is the fractional transmitted
intensity.
The mass absorption coefficient, µm, is a function of the atomic number of
the absorber (z) and the incident x-ray energy (E):
=
3
3
E
kzmµ (2)
40
Figure 4-4: Calculated Φ(ρz) curves for Cu kα in cu at 10, 15, and 30 keV [Gol03]
3. The beryllium window of the detector absorbs lower energy x-rays to a
greater extent than high energy x-rays.
4. The amount of background radiation varies across the energy spectrum
leading to problems of intensity measurement.
The first three correction factors are together known as the “ZAF” correction
[Pos80].
To perform quantitative X-ray microanalysis using the conventional
techniques, the sample must be flat, homogenous on the scale of the
analyzed volume. The sample must also be thick enough with respect to
electron beam penetration. If the above mentioned conditions are satisfied,
quantitative analysis can be performed if attention is paid to detail in the data
collection process.
Accuracy of analysis depends on the concentration level and the energy of the
analyzed line. For a medium Z element of concentration greater than 10%,
relative accuracies of 1 – 5 % are achievable (see table for ZAF results of
soda ash. As the concentration drops towards 1%, accuracies will degrade
from the 5 to 50 % relative level.
41
Below 1 %, results are often considered semi quantitative only. A general rule
of thumb, to be used for rough estimations is that accuracies of ± 1 %
absolute are achievable for concentrations in excess of 1% [Bar00].
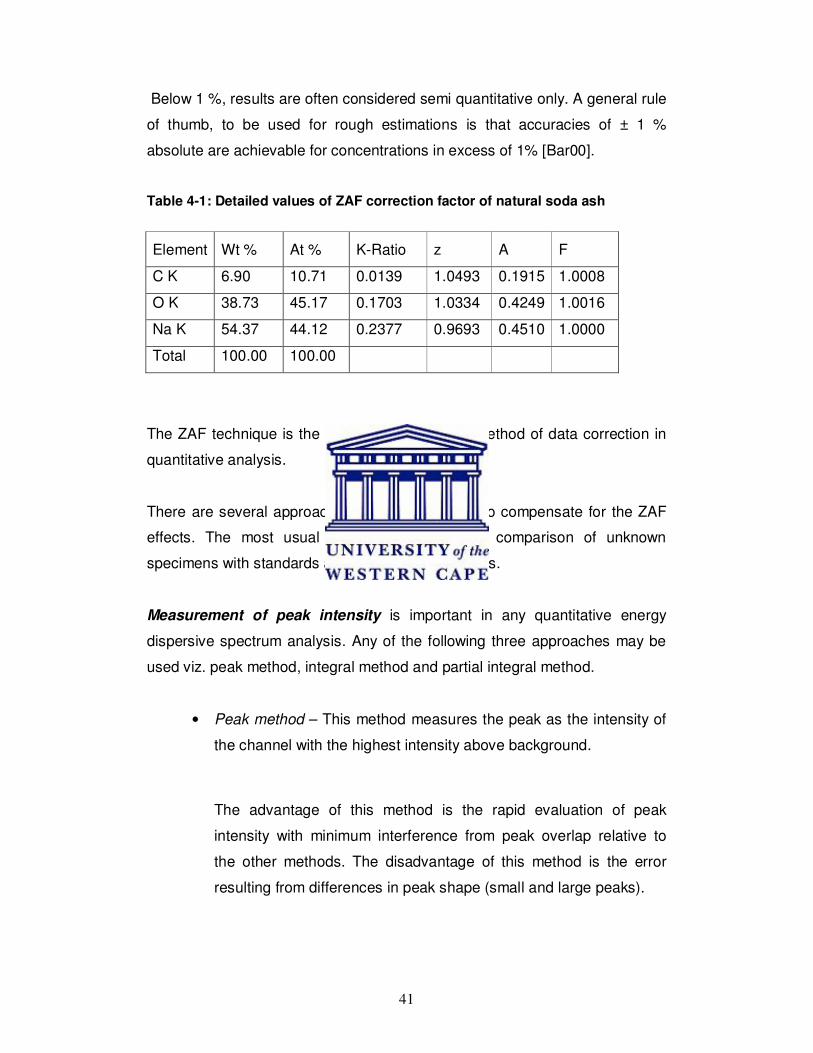
Table 4-1: Detailed values of ZAF correction factor of natural soda ash
Element Wt % At % K-Ratio z A F
C K 6.90 10.71 0.0139 1.0493 0.1915 1.0008
O K 38.73 45.17 0.1703 1.0334 0.4249 1.0016
Na K 54.37 44.12 0.2377 0.9693 0.4510 1.0000
Total 100.00 100.00
The ZAF technique is the most commonly used method of data correction in
quantitative analysis.
There are several approaches that may be used to compensate for the ZAF
effects. The most usual approach used is the comparison of unknown
specimens with standards and computed corrections.
Measurement of peak intensity is important in any quantitative energy
dispersive spectrum analysis. Any of the following three approaches may be
used viz. peak method, integral method and partial integral method.
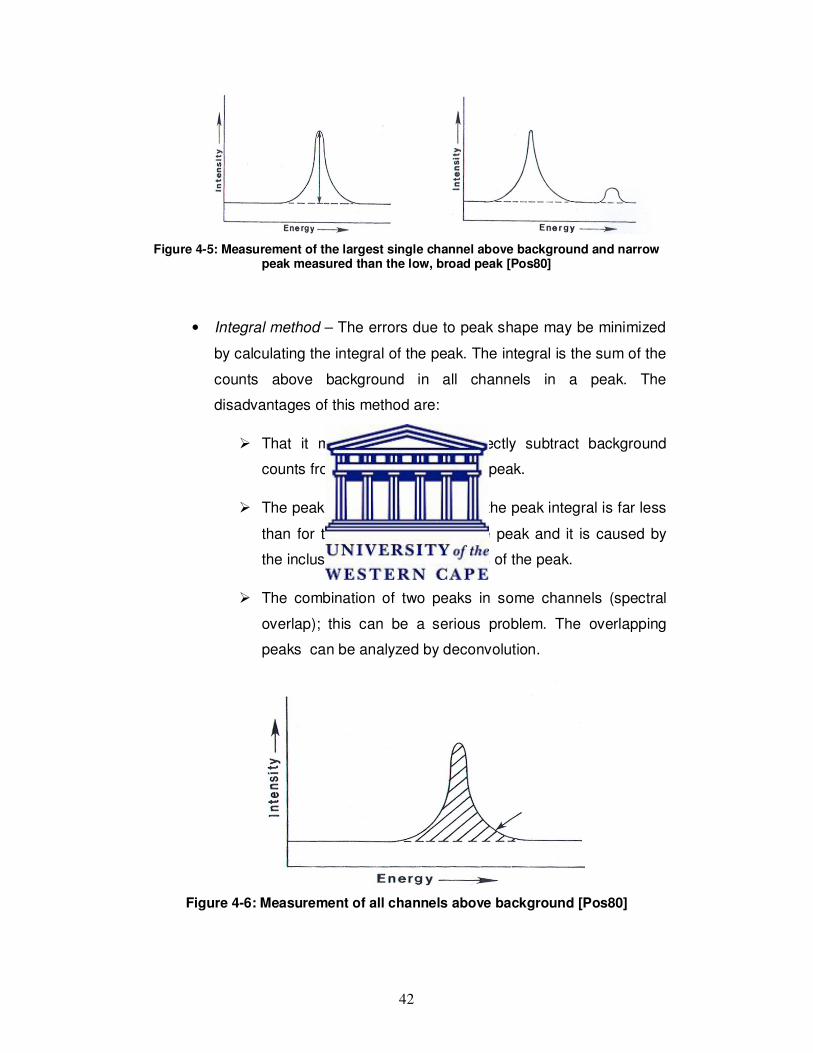
• Peak method – This method measures the peak as the intensity of
the channel with the highest intensity above background.
The advantage of this method is the rapid evaluation of peak
intensity with minimum interference from peak overlap relative to
the other methods. The disadvantage of this method is the error
resulting from differences in peak shape (small and large peaks).
42
Figure 4-5: Measurement of the largest single channel above background and narrow
peak measured than the low, broad peak [Pos80]
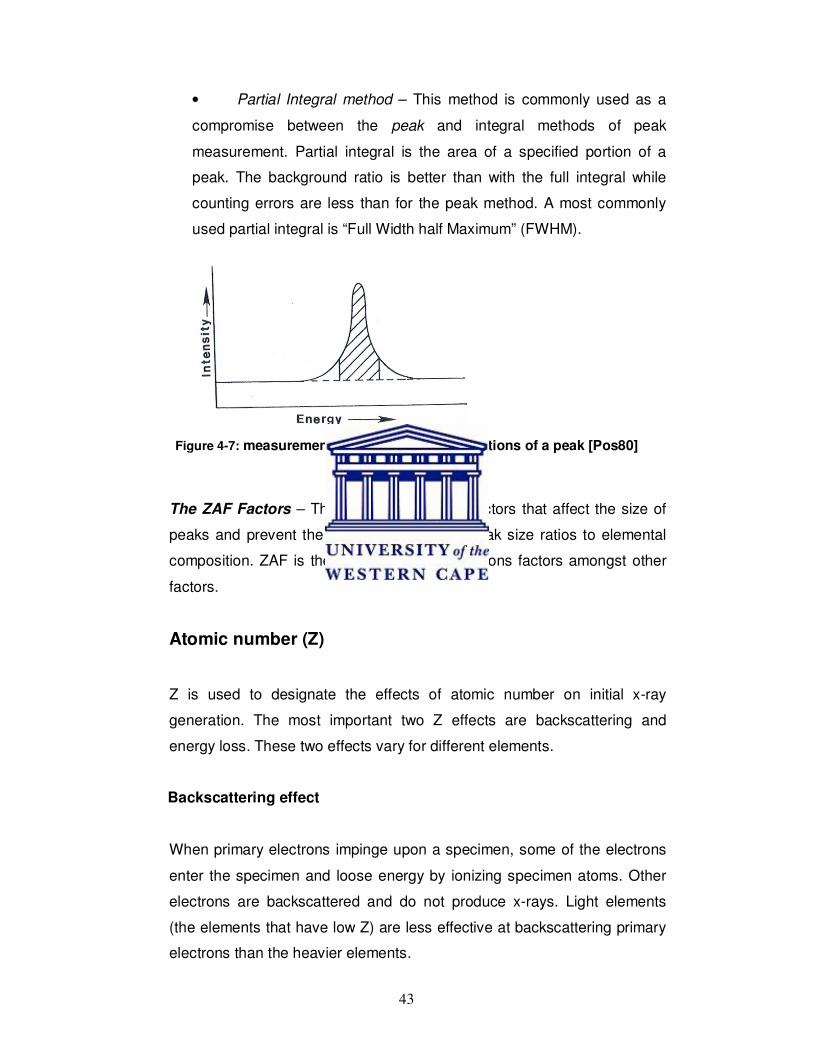
• Integral method – The errors due to peak shape may be minimized
by calculating the integral of the peak. The integral is the sum of the
counts above background in all channels in a peak. The
disadvantages of this method are:
� That it may be difficult to correctly subtract background
counts from the counts due to the peak.
� The peak-to background ratio for the peak integral is far less
than for the single channel at the peak and it is caused by
the inclusion of low intensity wings of the peak.
� The combination of two peaks in some channels (spectral
overlap); this can be a serious problem. The overlapping
peaks can be analyzed by deconvolution.
Figure 4-6: Measurement of all channels above background [Pos80]
43
• Partial Integral method – This method is commonly used as a
compromise between the peak and integral methods of peak
measurement. Partial integral is the area of a specified portion of a
peak. The background ratio is better than with the full integral while
counting errors are less than for the peak method. A most commonly
used partial integral is “Full Width half Maximum” (FWHM).
Figure 4-7: measurement of the most intense portions of a peak [Pos80]
The ZAF Factors – There are a number of factors that affect the size of
peaks and prevent the direct conversion of peak size ratios to elemental
composition. ZAF is the most common corrections factors amongst other
factors.
Atomic number (Z)
Z is used to designate the effects of atomic number on initial x-ray
generation. The most important two Z effects are backscattering and
energy loss. These two effects vary for different elements.
Backscattering effect
When primary electrons impinge upon a specimen, some of the electrons
enter the specimen and loose energy by ionizing specimen atoms. Other
electrons are backscattered and do not produce x-rays. Light elements
(the elements that have low Z) are less effective at backscattering primary
electrons than the heavier elements.
44
The proportion of electrons that penetrate a specimen and ionize
specimen atoms is higher for light elements.
Energy-loss effect
While atoms of light elements are easily ionized by collisions with primary
electrons, light elements are less likely to have these collisions than the
heavier elements. An electron that is not backscattered is more likely to
generate x-rays in a heavier element than in a light element.
A backscattering and energy loss correction may be determined
theoretically for each element using Monte Carlo theory. Overall Z
correction is small, it is often ignored in empirical techniques using
standards.
Absorption (A)
A is used to designate absorption effects. X-rays are generated throughout
the volume of primary excitation. A significant fraction of these x-rays are
reabsorbed by the specimen atoms. Absorption is minor for light elements
and low accelerating voltages. Absorption is large for heavy elements and
high accelerating voltages. Absorption is one of the most important factors
affecting Energy Dispersive spectrum (EDS) quantification.
Absorption correction may be determined using a computer, the following
must be considered: the size and shape of the volume of primary
excitation, the take-off angle (figure 4-8) and angle of the specimen
surface relative to the primary electron beam.
45
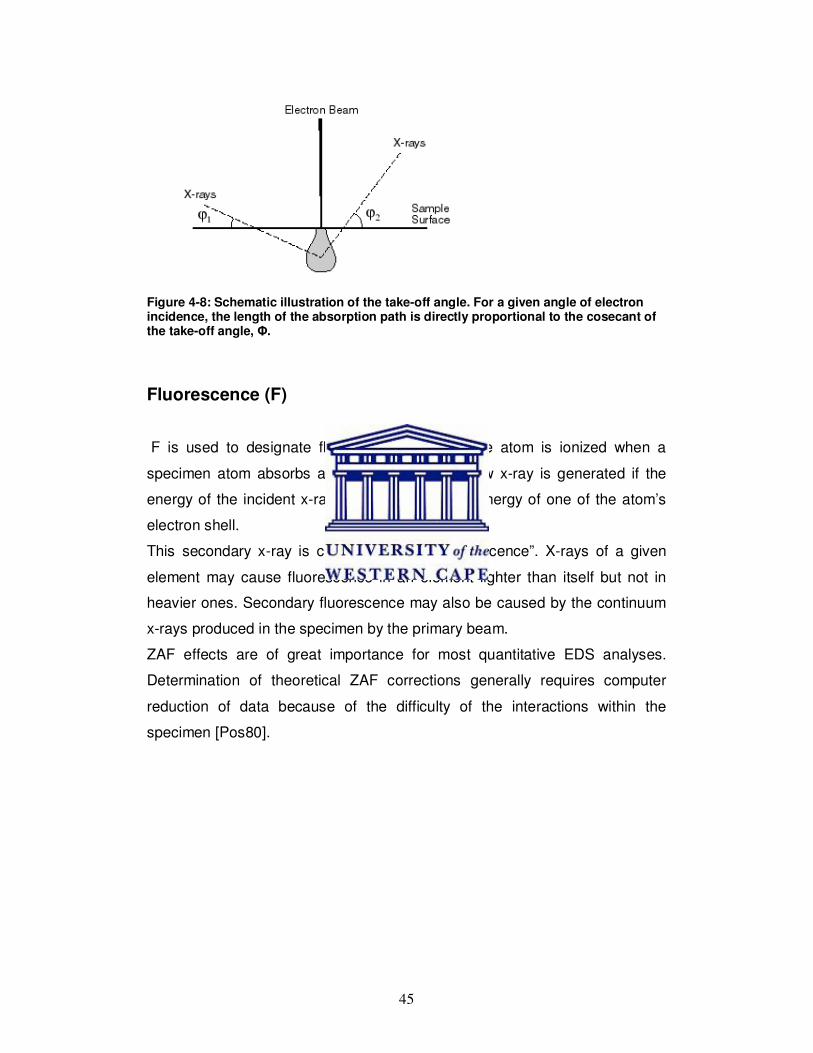
Figure 4-8: Schematic illustration of the take-off angle. For a given angle of electron incidence, the length of the absorption path is directly proportional to the cosecant of the take-off angle, Φ.
Fluorescence (F)
F is used to designate fluorescence effects. The atom is ionized when a
specimen atom absorbs a generated x-ray. A new x-ray is generated if the
energy of the incident x-ray exceeds the critical energy of one of the atom’s
electron shell.
This secondary x-ray is called “secondary fluorescence”. X-rays of a given
element may cause fluorescence in an element lighter than itself but not in
heavier ones. Secondary fluorescence may also be caused by the continuum
x-rays produced in the specimen by the primary beam.
ZAF effects are of great importance for most quantitative EDS analyses.
Determination of theoretical ZAF corrections generally requires computer
reduction of data because of the difficulty of the interactions within the