Turning Process Excellence into a Competitive Advantage Turning Process Excellence into a Competitive Advantage Manufacturing Process Excellence Manufacturing Process Excellence Developed By: John Bero 1/07
Transcript
Turning Process Excellence into a Competitive AdvantageTurning Process Excellence into a Competitive Advantage
Manufacturing Process Excellence
Manufacturing Process Excellence
Developed By: John Bero 1/07
2
Manufacturing Process Excellence
Training Scope
To teach the following Six Sigma methodologies using the D.M.A.I.C process:
• Characteristic Matrix
• Process Map
• Process FMEA
Ishikawa (Fishbone) Diagram
5 Why’s
• Control Plan• Manufacturing Instructions
Inputs
3
To implement Six Sigma methodologies to:
•Reduce overall escapes to customers (DPPM)
Reduce Scrap and Rework.
Improve Internal Yield.
Reduce Final Inspection Rejects.
• Encourage Relentless Root Cause Analysis & Mistake-Proofing.
• Reduce variation in critical to quality features.
• Proactively control cost of poor quality.
• Turn actions into systemic process improvements.
Training Objective
Manufacturing Process Excellence
4
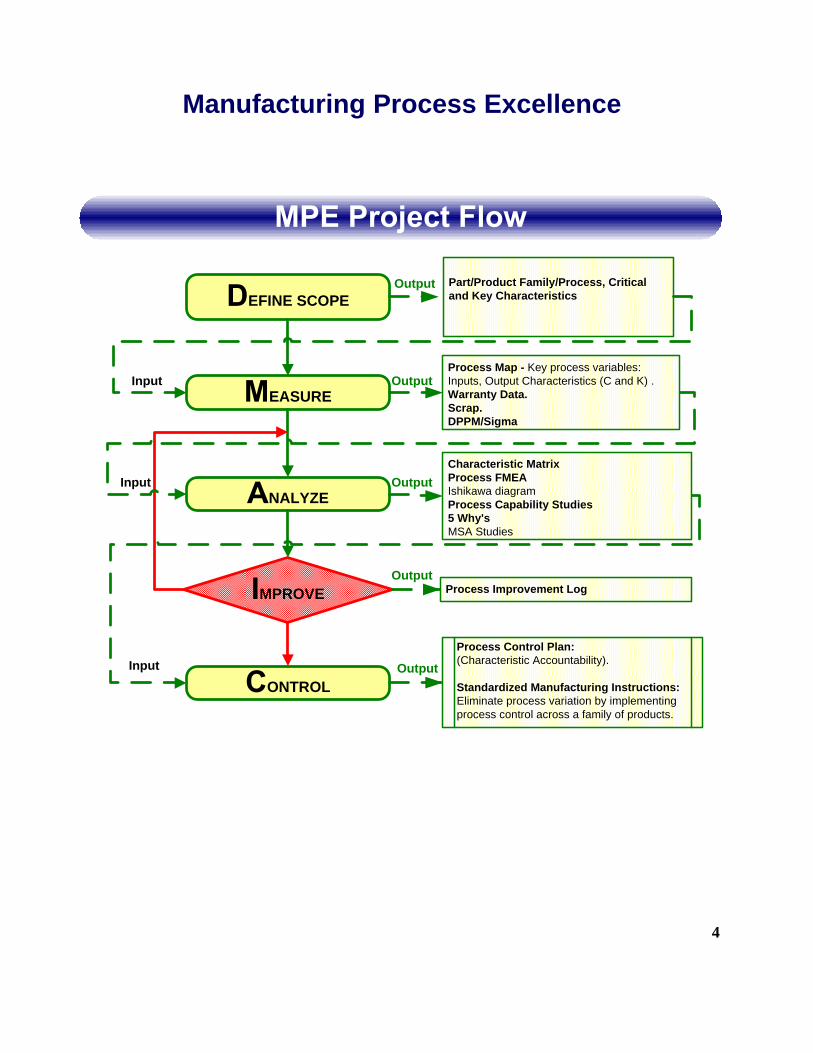
Manufacturing Process Excellence
Part/Product Family/Process, Critical and Key CharacteristicsEFINE SCOPE
EASURE
NALYZE
ONTROL
MPROVE
Process Control Plan:(Characteristic Accountability).
Standardized Manufacturing Instructions:Eliminate process variation by implementing process control across a family of products.
Input
Output
Output
Input Output
Output
Input Output
Process Map - Key process variables: Inputs, Output Characteristics (C and K) .Warranty Data.Scrap.DPPM/Sigma
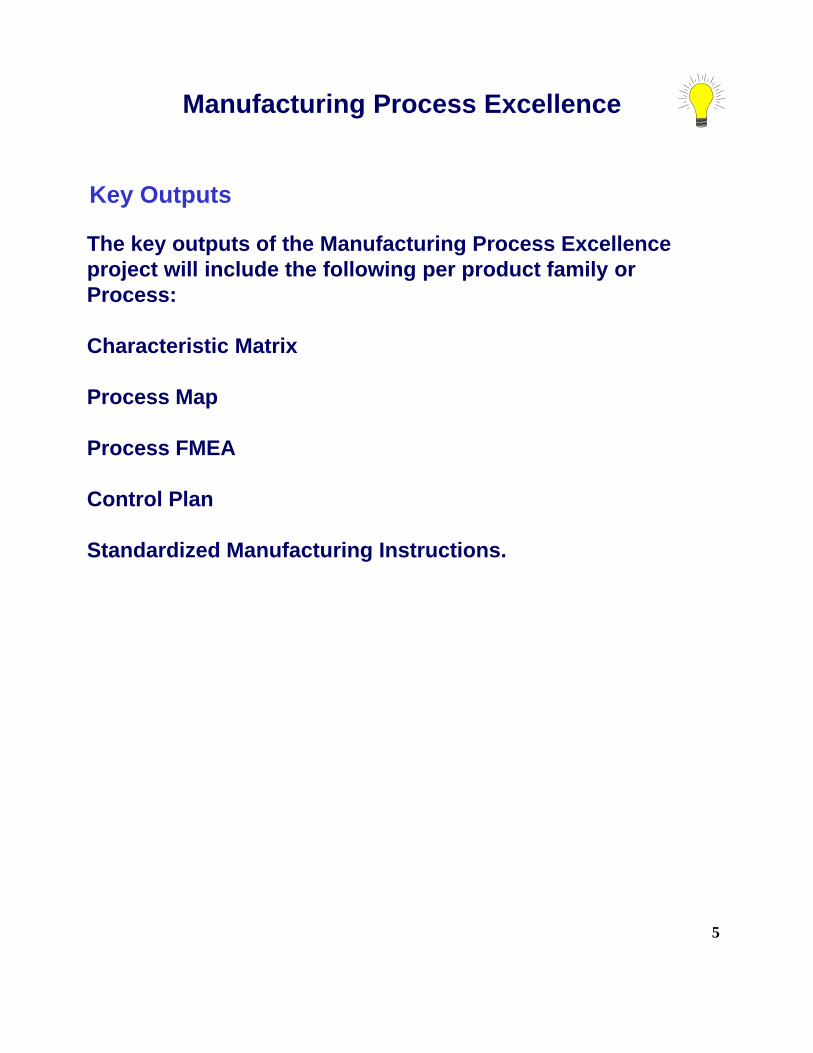
The key outputs of the Manufacturing Process Excellence project will include the following per product family or Process:
Characteristic Matrix
Process Map
Process FMEA
Control Plan
Standardized Manufacturing Instructions.
Manufacturing Process Excellence
6
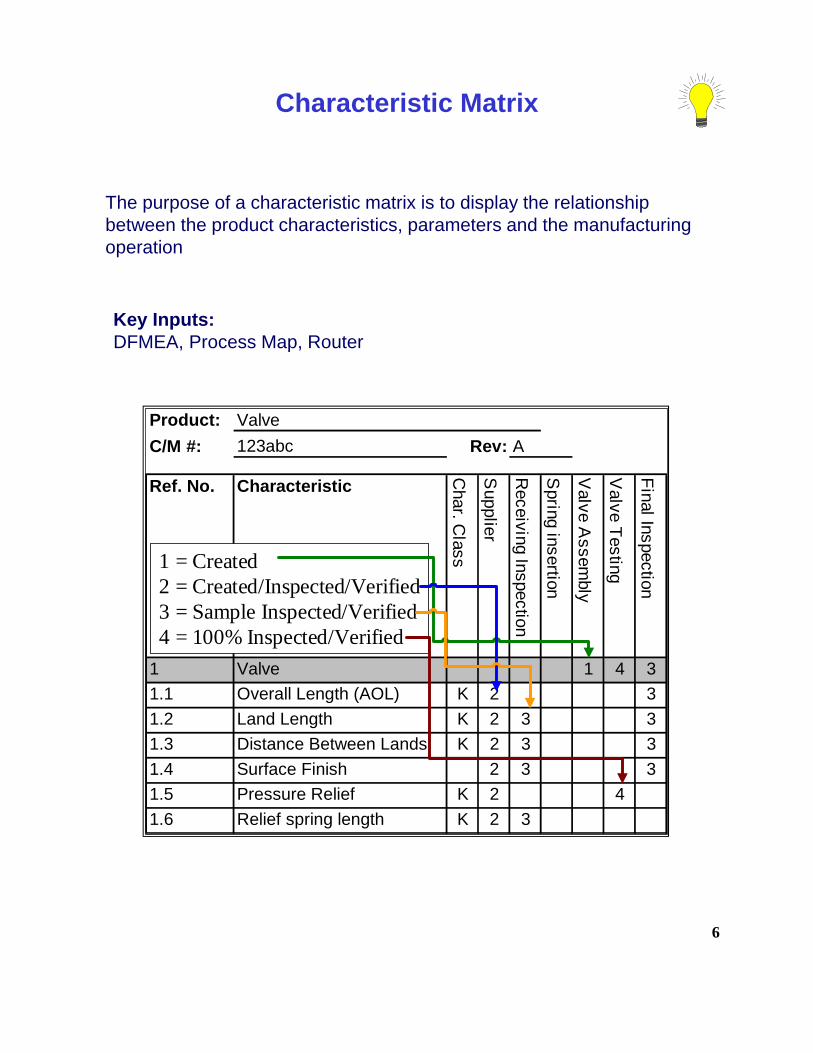
Characteristic Matrix
The purpose of a characteristic matrix is to display the relationship between the product characteristics, parameters and the manufacturing operation
Key Inputs:DFMEA, Process Map, Router
Product:C/M #: 123abc
Ref. No. Characteristic
Char. C
lass
Supplier
Receiving Inspection
Spring insertion
Valve A
ssembly
Valve Testing
Final Inspection
1 Valve 1 4 31.1 Overall Length (AOL) K 2 31.2 Land Length K 2 3 31.3 Distance Between Lands K 2 3 31.4 Surface Finish 2 3 31.5 Pressure Relief K 2 41.6 Relief spring length K 2 3
Used to get an overall understanding of the process flow and interactions.
Is the basic tool used in the analysis of a process by looking at each step’s Key Process Output Variables and determining which Inputs can be controlled and which ones we have to /choose to live with.
Minimum Requirements:Software - Microsoft Visio (Basic Flow Chart Shapes).Complete Process Flow.Key process variables
Process Inputs.Process Outputs.
8
Process Map
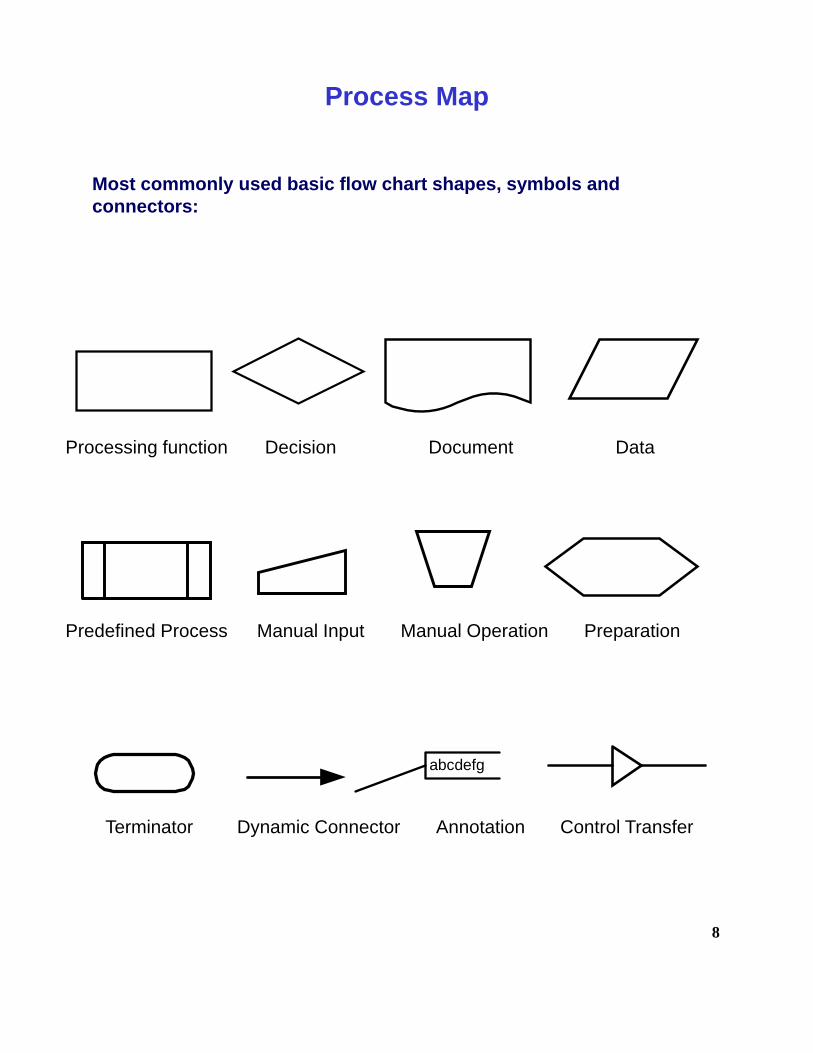
Most commonly used basic flow chart shapes, symbols and connectors:
Processing function Decision Document Data
Predefined Process Manual Input Manual Operation Preparation
Input Definitions C-Controllable- Those inputs that we can change-Speed, feeds, thickness, machine,…..N-Noise- Those inputs that we cannot control or too costly too. Humidity, temperature,nonstandard thickness,….
Input (X)TravelerPopulated wave soldered brd.with active flux residue
Output (Y)Populated wave solderedbrd. without active fluxresidue
Top Level Process Example
12
Process Failure Mode and Effect Analysis
Process FMEA
Aerospace PROCESS FAILURE MODE AND EFFECT ANALYSIS
Product/Part Number/Area Core Team: FMEA Number Original Date:
Process Responsibility Approval: Revision Date:
Plant: Revision:
Process Step / Name
Potential Failure Mode
Potential Failure Effects
Sev
Class
Potential CausesOcc
Current Controls Prevent (P) Detect (D)
Det
RPN
Recommended Actions
Person Responsible Target Date
Actions TakenSev
Occ
Det
RPN
Prepared by
Sensing and Controls 24 East Glenolden Avenue, Glenolden PA 19036-2107 Quality Assurance Manager Manufacturing Engineer Manager
Prototype Pre-Launch Production
Creating a Process FMEA:
Use a cross functional Team; Typically Manufacturing, Manufacturing Engineering, Quality Assurance and Design Engineering.
Follow the flow of the process map.
Include the entire process flow in the FMEA.
Do not overlook any characteristic. Remember a product is nonconforming if it fails to meet any requirement.
13
Process FMEA
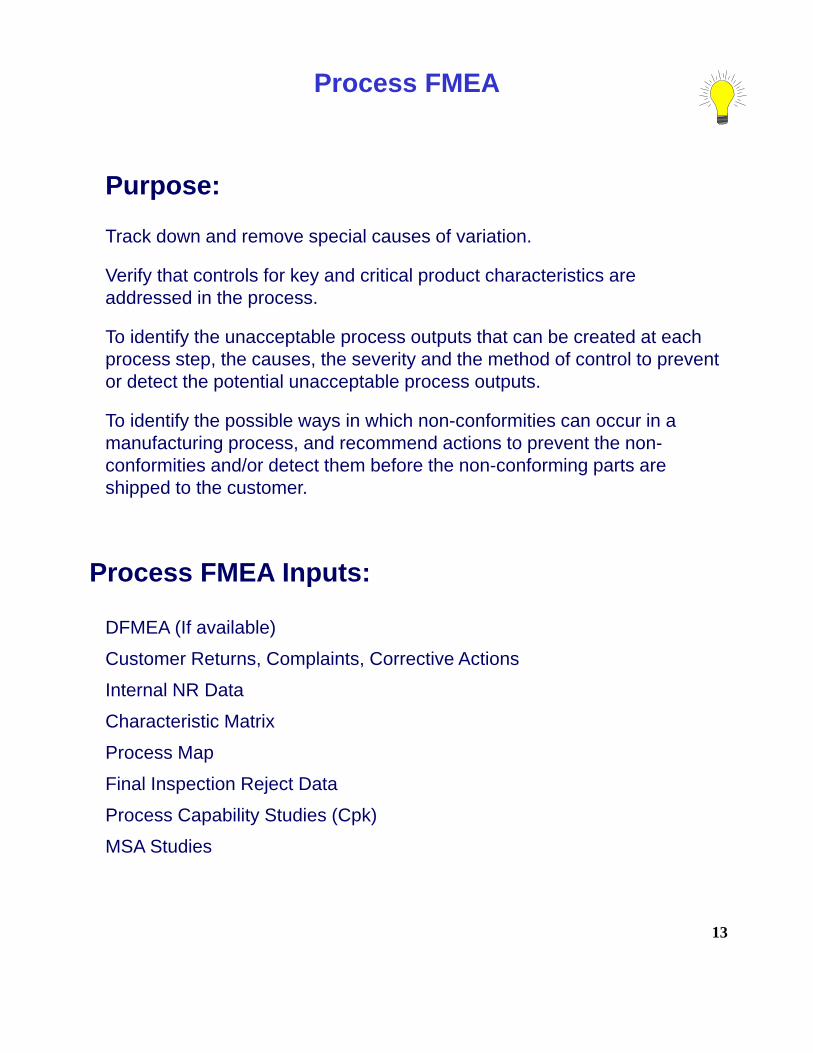
Purpose:
Track down and remove special causes of variation.
Verify that controls for key and critical product characteristics are addressed in the process.
To identify the unacceptable process outputs that can be created at each process step, the causes, the severity and the method of control to prevent or detect the potential unacceptable process outputs.
To identify the possible ways in which non-conformities can occur in a manufacturing process, and recommend actions to prevent the non-conformities and/or detect them before the non-conforming parts are shipped to the customer.
Brainstorming tools that will assist with developing a process FMEA:• Ishikawa Diagrams (Fish Bone)• Five Why’s
15
Process FMEA
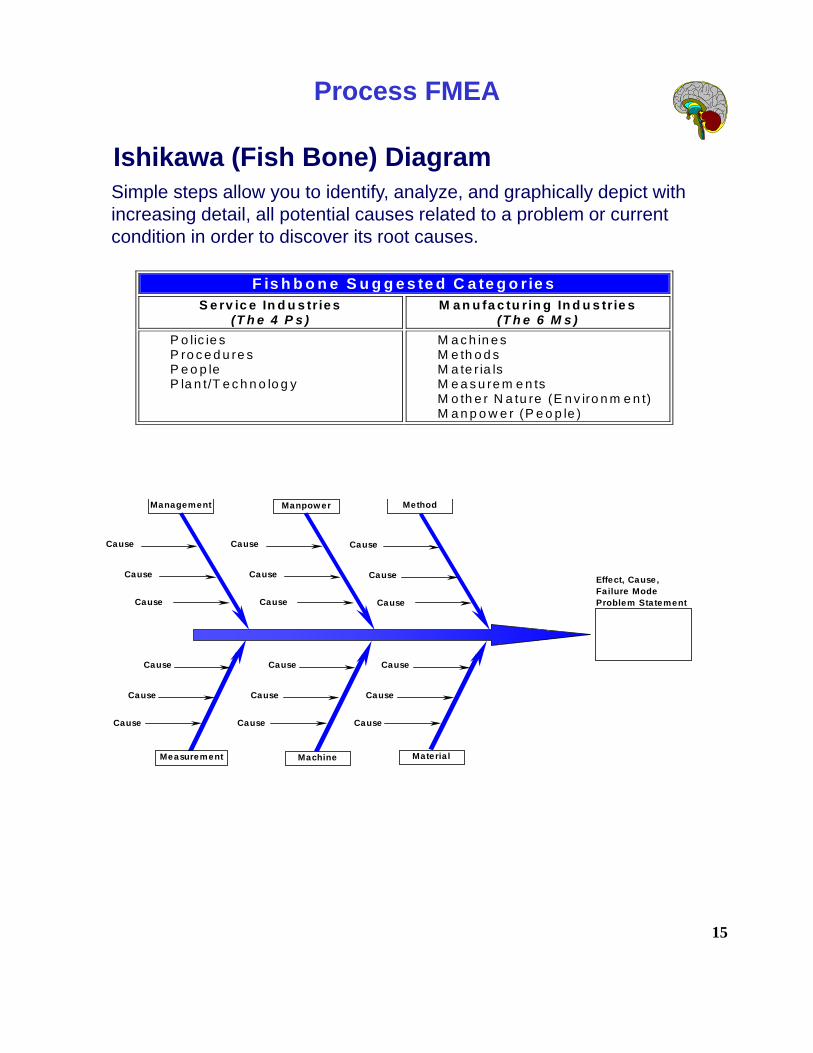
Simple steps allow you to identify, analyze, and graphically depict with increasing detail, all potential causes related to a problem or current condition in order to discover its root causes.
Ishikawa (Fish Bone) Diagram
F is h b o n e S u g g e s te d C a te g o rie s S e rv ic e In d u s tr ie s
(T h e 4 P s ) M a n u fa c tu r in g In d u s tr ie s
(T h e 6 M s ) P o lic ie s P ro c e d u re s P e o p le P la n t/T e c h n o lo g y
M a c h in e s M e th o d s M a te r ia ls M e a s u re m e n ts M o th e r N a tu re (E n v iro n m e n t) M a n p o w e r (P e o p le )
Management Manpow er Method
Measurement Machine Materia l
Cause
Cause
Cause
Cause
Cause
Cause
Cause
Cause
Cause
Cause
Cause
Cause
Cause
Cause
Cause
Cause
Cause
Cause
Effect, Cause, Failure ModeProblem Statement
16
Process FMEA
How To Complete The 5 Whys:
1. Write down the specific problem. Writing the issue helps you formalize the problem and describe it completely. It also helps a team focus on the same problem.
2. Ask Why the problem happens and write the answer.
3. If the answer you just provided doesn't identify the root cause of the problem that you wrote down in step 1, ask Why again and write that answer down.
4. Loop back to step 3 until the team is in agreement that the problem's root cause is identified. Again, this may take fewer or more times than five Whys.
5 Why Example:Problem Statement: You are on your way home from work and your car stops
in the middle of the road.
1. Why did your car stop?- Because it ran out of gas.
2. Why did it run out of gas?- Because I didn't buy any gas on my way to work.
3. Why didn't you buy any gas this morning?- Because I didn't have any money.
4. Why didn't you have any money?- Because I lost it all last night in a poker game.
5. Why did you lose your money in last night's poker game?- Because I'm not very good at "bluffing" when I don't have a good hand.
17
Process FMEA
How to complete an FMEA?
18
Process Step/NameProcess S tep /
Nam eWhat is the process Name / Function?
Enter the specific process or workstation name that is being evaluated, multiple workstations should be reflected as separate PFMEA line items. Example: • TESTING (Air Decay)• ASSEMBLY (Press Fit)
1) MILLING(Mounting Pads)
NOTE: The numbering sequence must match the Process Map numbering for each process.
How could this process/product fail to meet it's intended function?
NOTE: A Failure mode at one operation can be an effect of a failure mode in a previous (upstream) operation.
Process FMEA
19
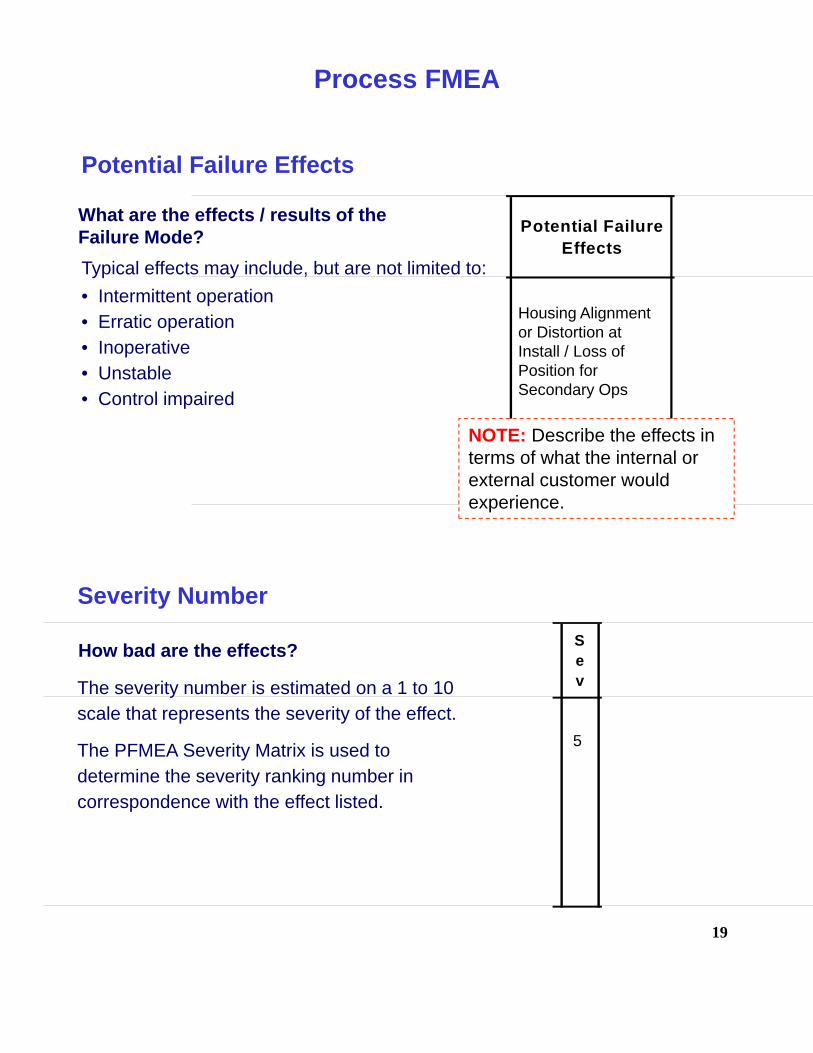
Potential Failure Effects
Potential Failure Effects
What are the effects / results of the Failure Mode?Typical effects may include, but are not limited to:• Intermittent operation• Erratic operation• Inoperative• Unstable• Control impaired
Housing Alignment or Distortion at Install / Loss of Position for Secondary Ops
NOTE: Describe the effects in terms of what the internal or external customer would experience.
Severity Number
How bad are the effects?
The severity number is estimated on a 1 to 10 scale that represents the severity of the effect.
The PFMEA Severity Matrix is used to determine the severity ranking number in correspondence with the effect listed.
Sev
5
Process FMEA
20
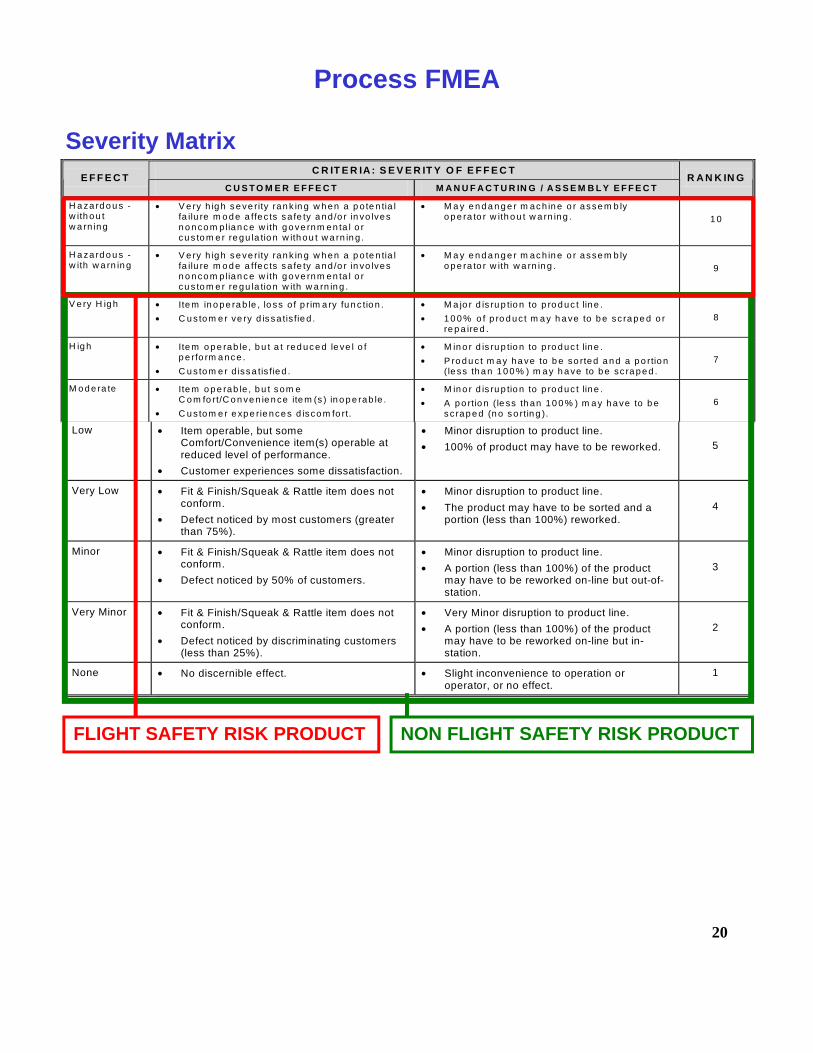
Low • Item operable, but some Comfort/Convenience item(s) operable at reduced level of performance.
• Customer experiences some dissatisfaction.
• Minor disruption to product line. • 100% of product may have to be reworked.
5
Very Low • Fit & Finish/Squeak & Rattle item does not conform.
• Defect noticed by most customers (greater than 75%).
• Minor disruption to product line. • The product may have to be sorted and a
portion (less than 100%) reworked.
4
Minor • Fit & Finish/Squeak & Rattle item does not conform.
• Defect noticed by 50% of customers.
• Minor disruption to product line. • A portion (less than 100%) of the product
may have to be reworked on-line but out-of-station.
3
Very Minor • Fit & Finish/Squeak & Rattle item does not conform.
• Defect noticed by discriminating customers (less than 25%).
• Very Minor disruption to product line. • A portion (less than 100%) of the product
may have to be reworked on-line but in-station.
2
None • No discernible effect. • Slight inconvenience to operation or operator, or no effect.
1
C R IT E R IA : S E V E R IT Y O F E F F E C T E F F E C T
C U S T O M E R E F F E C T M A N U F A C T U R IN G / A S S E M B L Y E F F E C T R A N K IN G
H a za rd o u s - w ith o u t w a rn in g
• V e ry h ig h s e ve rity ran k in g w h en a p o te n tia l fa ilu re m o d e a ffec ts s a fe ty a nd /o r in vo lves n o n co m p lian c e w ith g o ve rn m en ta l o r cu s to m e r re gu la tio n w ith ou t w a rn in g .
• M a y e n d a n g e r m ac h in e o r a sse m b ly o p e ra to r w ith o u t w a rn ing .
1 0
H a za rd o u s - w ith w a rn in g
• V e ry h ig h s e ve rity ran k in g w h en a p o te n tia l fa ilu re m o d e a ffec ts s a fe ty a nd /o r in vo lves n o n co m p lian c e w ith g o ve rn m en ta l o r cu s to m e r re gu la tio n w ith w a rn in g .
• M a y e n d a n g e r m ac h in e o r a sse m b ly o p e ra to r w ith w a rn in g .
9
V e ry H ig h • Ite m in o pe ra b le , lo ss o f p rim a ry fu n c tio n . • C u s to m e r ve ry d is sa tis fie d .
• M a jo r d is ru p tio n to p ro d uc t line . • 1 0 0 % o f p ro d uc t m a y h a ve to b e sc ra pe d o r
re p a ire d .
8
H ig h • Ite m o p e rab le , b u t a t red uc e d le ve l o f p e rfo rm a nc e .
• C u s to m e r d issa tis fie d .
• M in o r d is ru p tio n to p ro d uc t line . • P ro d u c t m a y ha ve to b e so rted a n d a p o rtio n
( le ss th a n 10 0 % ) m a y h a ve to b e sc ra p e d .
7
M o d e ra te • Ite m o p e rab le , b u t som e C o m fo rt/C o n ve n ie n ce ite m (s ) in o p e rab le .
• C u s to m e r e xp e rie nce s d isco m fo rt.
• M in o r d is ru p tio n to p ro d uc t line . • A p o rtio n ( le ss th an 10 0 % ) m a y h a ve to b e
s c rap e d (n o s o rtin g ).
6
Severity Matrix
FLIGHT SAFETY RISK PRODUCT NON FLIGHT SAFETY RISK PRODUCT
Process FMEA
21
Characteristic Class
Sev
Class
Critical (C) The letter C indicates a Critical characteristic. A product or process characteristic for which reasonably anticipated variation could significantly affect the product’s safety or its compliance with governmental regulations. Such as Hazardous without warning, flammability, occupant or operator protection, loss of control etc.
NOTE: A Critical Characteristic (C) would be considered a Flight Safety Risk and would be associated with severity rankings of 8, 9 and 10.
C
Key (K) The letter K indicates a Key characteristic. A product or process characteristic for which reasonably anticipated variation is likely to significantly affect customer satisfaction with a product (other than safety considerations) such as its fit, partial function, mounting, or the ability to process or build the product.
Standard (“ “) Leaving the column blank/empty indicates a standard characteristic. A product or process characteristic for which reasonably anticipated variation would not affect a product’s safety, fit/function or compliance with governmental regulations. Would include minor issues such as appearance, marking, administrative errors.
Process FMEA
22
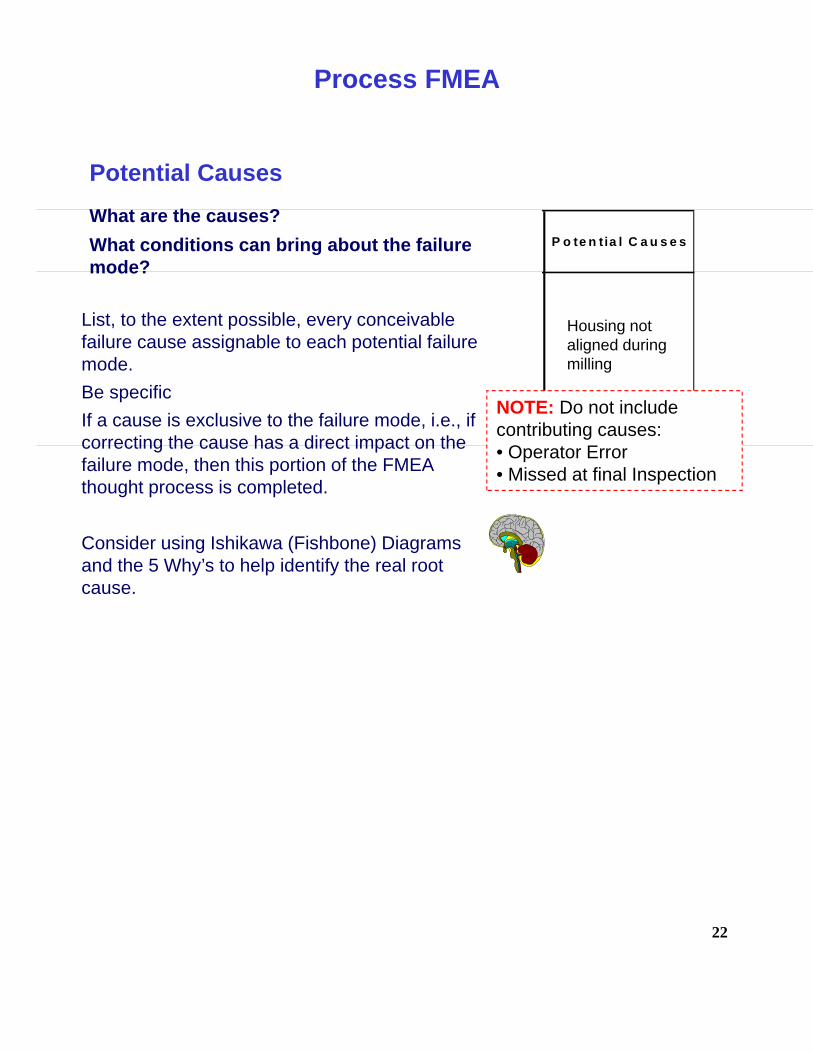
Potential Causes
P o te n tia l C a u s e s
What are the causes?What conditions can bring about the failure mode?
NOTE: Do not include contributing causes:• Operator Error• Missed at final Inspection
List, to the extent possible, every conceivable failure cause assignable to each potential failure mode.Be specific If a cause is exclusive to the failure mode, i.e., if correcting the cause has a direct impact on the failure mode, then this portion of the FMEA thought process is completed.
Consider using Ishikawa (Fishbone) Diagrams and the 5 Why’s to help identify the real root cause.
Housing not aligned during milling
Process FMEA
23
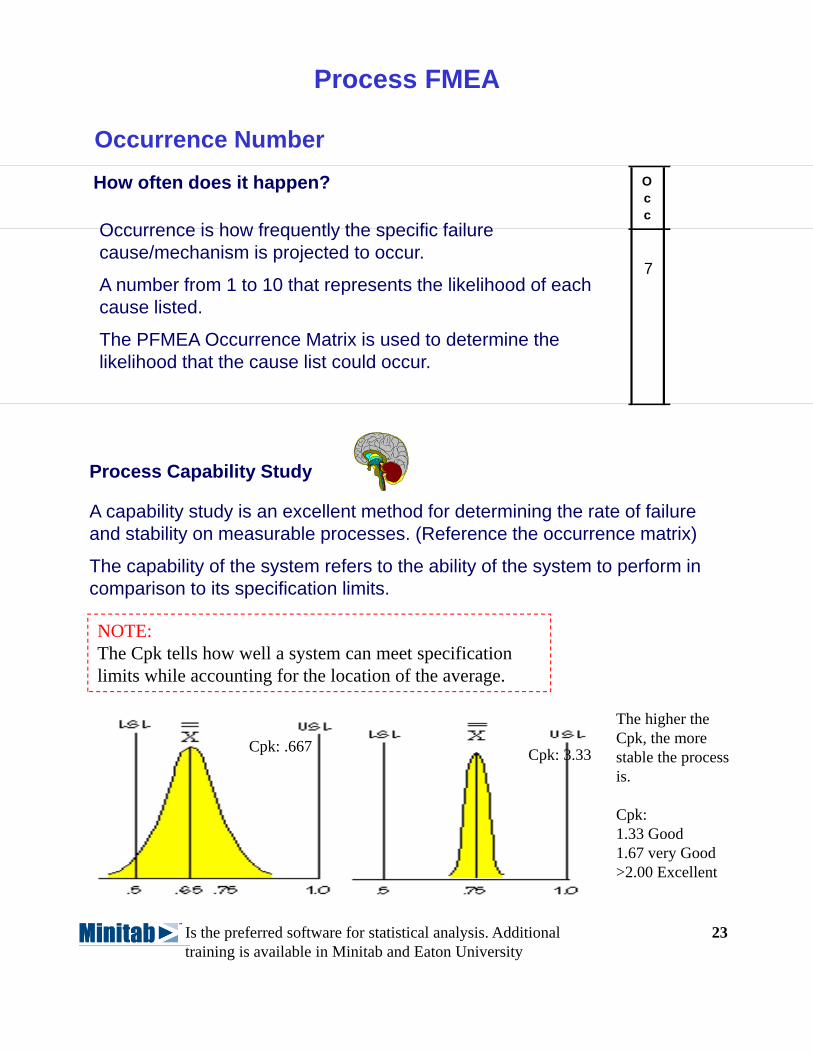
Occurrence NumberHow often does it happen? O
cc
Occurrence is how frequently the specific failure cause/mechanism is projected to occur.
A number from 1 to 10 that represents the likelihood of each cause listed.
The PFMEA Occurrence Matrix is used to determine the likelihood that the cause list could occur.
7
Process FMEA
Process Capability Study
A capability study is an excellent method for determining the rate of failure and stability on measurable processes. (Reference the occurrence matrix)
The capability of the system refers to the ability of the system to perform in comparison to its specification limits.
NOTE:The Cpk tells how well a system can meet specification limits while accounting for the location of the average.
Cpk: 3.33Cpk: .667
Is the preferred software for statistical analysis. Additional training is available in Minitab and Eaton University
The higher the Cpk, the more stable the process is.
Cpk:1.33 Good1.67 very Good>2.00 Excellent
24
P ro b a b ility o f F a ilu re P o s s ib le F a ilu re R a te s C p k R a n k in g
= /> 5 1 % < 0 .3 3 1 0 V e ry H ig h : P e rs is te n t F a ilu re s
3 3 % to 5 0 % = /> 0 .3 3 9
1 2 .5 % to 3 3 % = /> 0 .5 1 8 H ig h : F re q u e n t F a ilu re s
5 % to 1 2 .5 % = /> 0 .6 7 7
1 .2 5 % to 5 % = /> 0 .8 3 6
.2 5 % to 1 .2 5 % = /> 1 .0 0 5 M o d e ra te : O cca s io n a l F a ilu re s
.0 5 % to .2 5 % = /> 1 .1 7 4
.0 1 % to .0 5 % = /> 1 .3 3 3 L o w : R e la tive ly F e w F a ilu re s
.0 0 2 % to .0 1 % = /> 1 .5 0 2
R e m o te : F a ilu re is U n lik e ly < .0 0 2 % = /> 1 .6 7 1
PFMEA Occurrence Matrix
Process FMEA
25
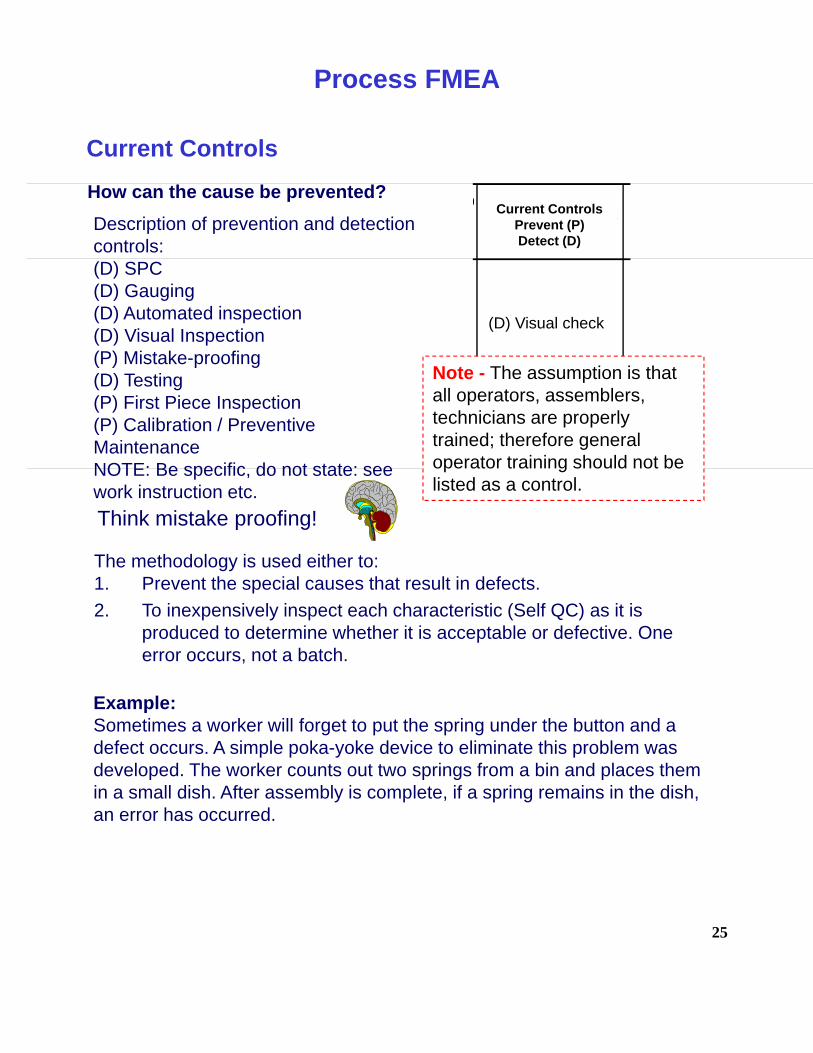
Current Controls
Description of prevention and detection controls:(D) SPC(D) Gauging(D) Automated inspection(D) Visual Inspection(P) Mistake-proofing(D) Testing (P) First Piece Inspection(P) Calibration / Preventive MaintenanceNOTE: Be specific, do not state: see work instruction etc.
How can the cause be prevented? OCurrent Controls Prevent
(P) Detect (D)
Current ControlsPrevent (P) Detect (D)
(D) Visual check
Note - The assumption is that all operators, assemblers, technicians are properly trained; therefore general operator training should not be listed as a control.
Think mistake proofing!
The methodology is used either to: 1. Prevent the special causes that result in defects.2. To inexpensively inspect each characteristic (Self QC) as it is
produced to determine whether it is acceptable or defective. One error occurs, not a batch.
Example:Sometimes a worker will forget to put the spring under the button and a defect occurs. A simple poka-yoke device to eliminate this problem was developed. The worker counts out two springs from a bin and places them in a small dish. After assembly is complete, if a spring remains in the dish, an error has occurred.
Process FMEA
26
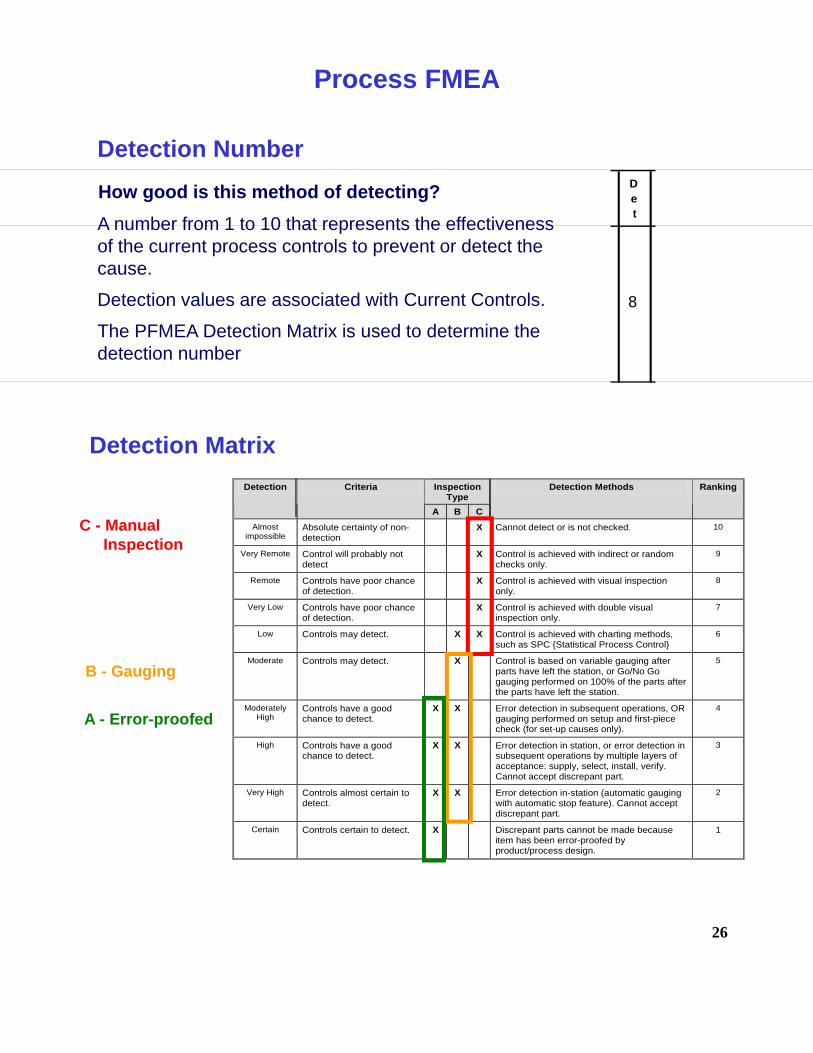
Detection Number How good is this method of detecting? D
et
8
A number from 1 to 10 that represents the effectiveness of the current process controls to prevent or detect the cause.
Detection values are associated with Current Controls.
The PFMEA Detection Matrix is used to determine the detection number
Inspection Type
Detection Criteria
A B C
Detection Methods Ranking
Almost impossible
Absolute certainty of non-detection
X Cannot detect or is not checked. 10
Very Remote Control will probably not detect
X Control is achieved with indirect or random checks only.
9
Remote Controls have poor chance of detection.
X Control is achieved with visual inspection only.
8
Very Low Controls have poor chance of detection.
X Control is achieved with double visual inspection only.
7
Low Controls may detect. X X Control is achieved with charting methods, such as SPC {Statistical Process Control}
6
Moderate Controls may detect. X Control is based on variable gauging after parts have left the station, or Go/No Go gauging performed on 100% of the parts after the parts have left the station.
5
Moderately High
Controls have a good chance to detect.
X X Error detection in subsequent operations, OR gauging performed on setup and first-piece check (for set-up causes only).
4
High Controls have a good chance to detect.
X X Error detection in station, or error detection in subsequent operations by multiple layers of acceptance: supply, select, install, verify. Cannot accept discrepant part.
3
Very High Controls almost certain to detect.
X X Error detection in-station (automatic gauging with automatic stop feature). Cannot accept discrepant part.
2
Certain Controls certain to detect. X Discrepant parts cannot be made because item has been error-proofed by product/process design.
1
C - Manual Inspection
B - Gauging
A - Error-proofed
Detection Matrix
Process FMEA
27
Risk Priority Number (RPN)
What is the risk?
The product of Occurrence X Severity X Detection = RPN
The higher the RPN, the higher the calculated risk is for producing undesirable process outcomes.
For higher RPN’s the team should undertake efforts to reduce the calculated risk through corrective actions.
RPN
280
Any process step with an RPN of 125 or greater, or a severity rating of 8 or higher will require an MSA and process capability study (if applicable/capable) for all key and critical characteristics.
Required Actions:
Process FMEA
28
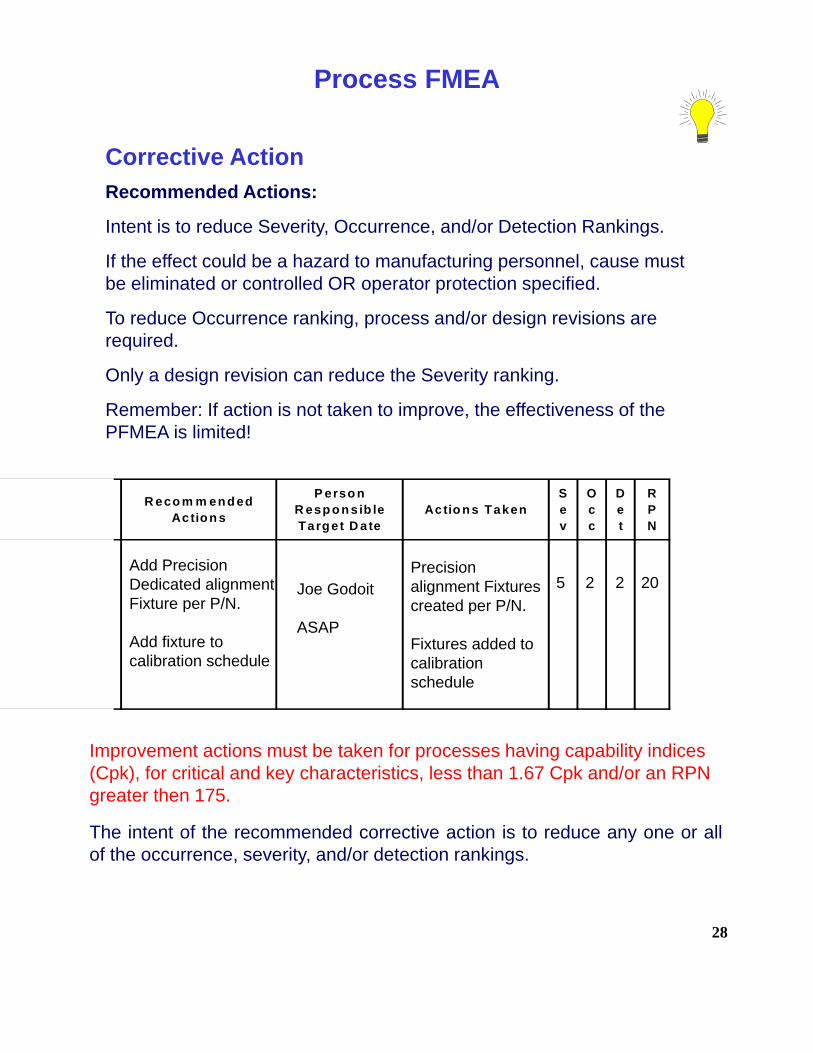
Corrective ActionRecommended Actions:
Intent is to reduce Severity, Occurrence, and/or Detection Rankings.
If the effect could be a hazard to manufacturing personnel, cause must be eliminated or controlled OR operator protection specified.
To reduce Occurrence ranking, process and/or design revisions are required.
Only a design revision can reduce the Severity ranking.
Remember: If action is not taken to improve, the effectiveness of the PFMEA is limited!
R eco m m en d ed Actio n s
P erso n R esp o n sib le Targ et D a te
Actio n s TakenSev
Occ
Det
RPN
Add Precision Dedicated alignment Fixture per P/N.
Add fixture to calibration schedule
Joe Godoit
ASAP
Precision alignment Fixtures created per P/N.
Fixtures added to calibration schedule
5 2 2 20
Improvement actions must be taken for processes having capability indices (Cpk), for critical and key characteristics, less than 1.67 Cpk and/or an RPN greater then 175.
The intent of the recommended corrective action is to reduce any one or allof the occurrence, severity, and/or detection rankings.
Process FMEA
29
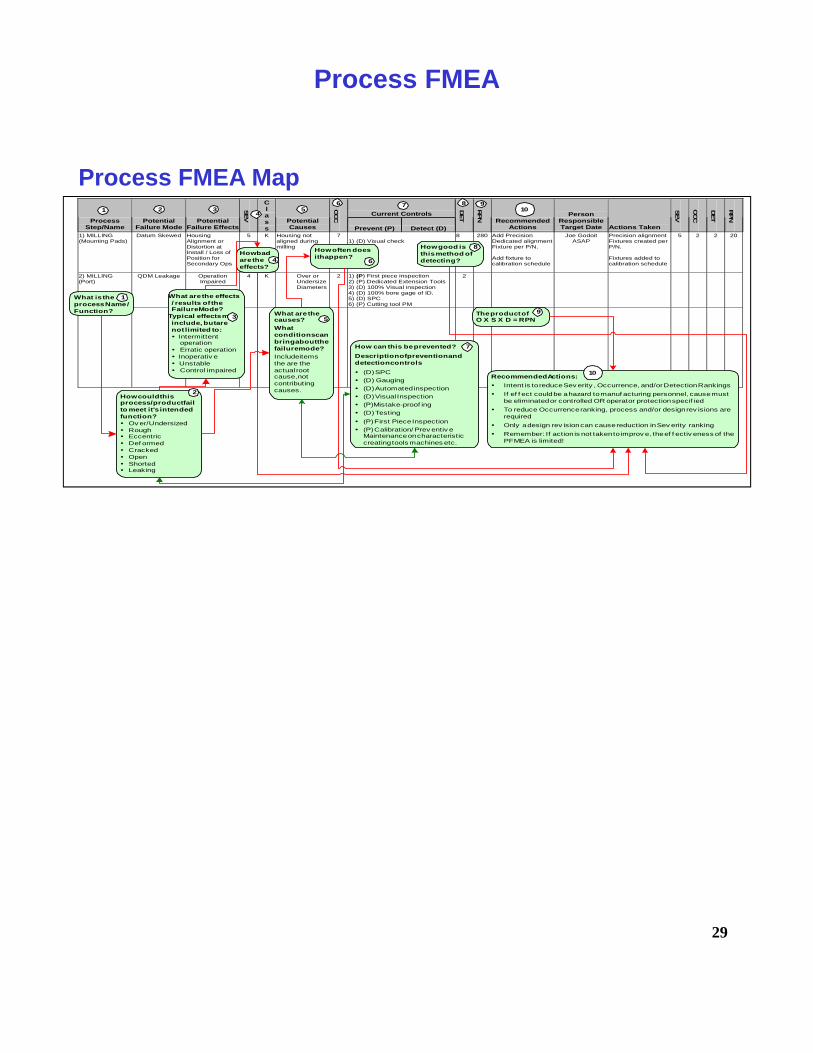
Current Controls Process
Step/Name Potential
Failure Mode Potential
Failure Effects
SEV
C l a s s
Potential Causes
OCC
Prevent (P) Detect (D)
DET
RPN
Recommended Actions
Person Responsible Target Date Actions Taken
SEV
OCC
DET
RPN
1) MILLING (Mounting Pads)
Datum Skewed Housing Alignment or Distortion at Install / Loss of Position for Secondary Ops
5 K Housing not aligned during milling
7 1) (D) Visual check
8 280 Add Precision Dedicated alignment Fixture per P/N. Add fixture to calibration schedule
Joe Godoit ASAP
Precision alignment Fixtures created per P/N. Fixtures added to calibration schedule
How could thisprocess/product failto meet it's intendedfunction?
Ov er/Under sizedRoughEccentricDef ormedCrackedOpenShortedLeaking
What are the effects/ results of theFailure Mode?
Typical effects mayinclude, but arenot limited to:
Intermittentoperation
Erratic operation Inoperativ e Unstable Control impaired
1
2
3
How badare theeffects?
4
What are thecauses?Whatconditions canbring about thefailure mode?Include itemsthe are theactual rootcause, notcontributingcauses.
5
How often doesit happen?
How can this be prevented?Description of prevention anddetection controls
(D) SPC(D) Gauging(D) Automated inspection(D) Visual Inspection(P) Mistake-proof ing(D) Testing(P) First Piece Inspection(P) Calibration / Prev entiv eMaintenance on characteristiccreating tools machines etc.
How good isthis method ofdetecting?
The product ofO X S X D = RPN
Recommended Actions:Intent is to reduce Sev erity , Occurrence, and/or Detection RankingsIf ef f ect could be a hazard to manuf acturing personnel, cause mustbe eliminated or controlled OR operator protection specif iedTo reduce Occurrence ranking, process and/or design rev isions arerequiredOnly a design rev ision can cause reduction in Sev erity rankingRemember: If action is not taken to improv e, the ef f ectiv eness of thePFMEA is limited!
1
6
7
8
9
10
2 34
56 7 8 9
10
Process FMEA
Process FMEA Map
30
PROCESS CONTROL PLANS
PROCESS CONTROL PLAN
C o nt ro l Plan C at ego ry Key Contact Name: Date (Orig); Date (Rev) Revision:
C o nt ro l Plan N umb er; Core Team: Customer Engineering Approval (If Req'd) Date (If Req'd)
M anufacturing Engineering M anager Approval / Date: Customer Quality Approval (If Req'd) Date (If Req'd)
Part N ame / D escr ip t io n: Quality Assurance M anager Approval / Date: Other Approval (If Req'd) Date (If req'd)
Other Approval Date (If Req'd): Other Approval (If Req'd) Date (If req'd)
Characterist ics M ethods
Proc #Process Name /
Operat ion descript ionM achine, Device, Jig,
Tools For M fg. No. Product ProcessSpecial Char.
Class.
Product / Process Specif icat ion /
Tolerance
Evaluat ion / M easurement
Technique
Sample Size
Sample Freq. Control M ethod Reaction Plan
Aerospace
Part N umber:
Plant :
Prototype Pre-Launch Production
31
Process Control Plan
Purpose;
To aid in the manufacturing of products according to customer and design requirements.
To focus resources on controlling special product and process characteristics.
Control plans are developed to create part number or product family specific and systemic controls of product/process characteristics to aid in the development of robust documentation.
The Control Plan describes the actions that are required at each phase of the process to assure that all process outputs will be in a state of control.
Creating a Control Plan:
Use a cross functional team.
Key Inputs: Design FMEA, Characteristic Matrix, Process Map, Process FMEA.
Control Plans are a living document; the control plan must reflect the current process documentation.
32
PROCESS CONTROL PLANS
How to complete a control plan
33
Process Number and Name
Pro c #Pro ces s Name /
Op erat io n d es crip t io n
What is the process number? The sequence of the process should line up with the process map and PFMEA
What is the process name?The process name should line up with the process map and PFMEA
1 MILLING(Mounting Pads)
Machine, Device, Jig, Tools for Mfg.
M a c hine , D e v ic e , J ig , T o o ls F o r M f g .
CNC Alignment Fixture per Part Number
What significant machines or tools are used?
List the processing equipment, e.g., machine, device, jig, or other tools for manufacturing, as appropriate
Process Control Plan
34
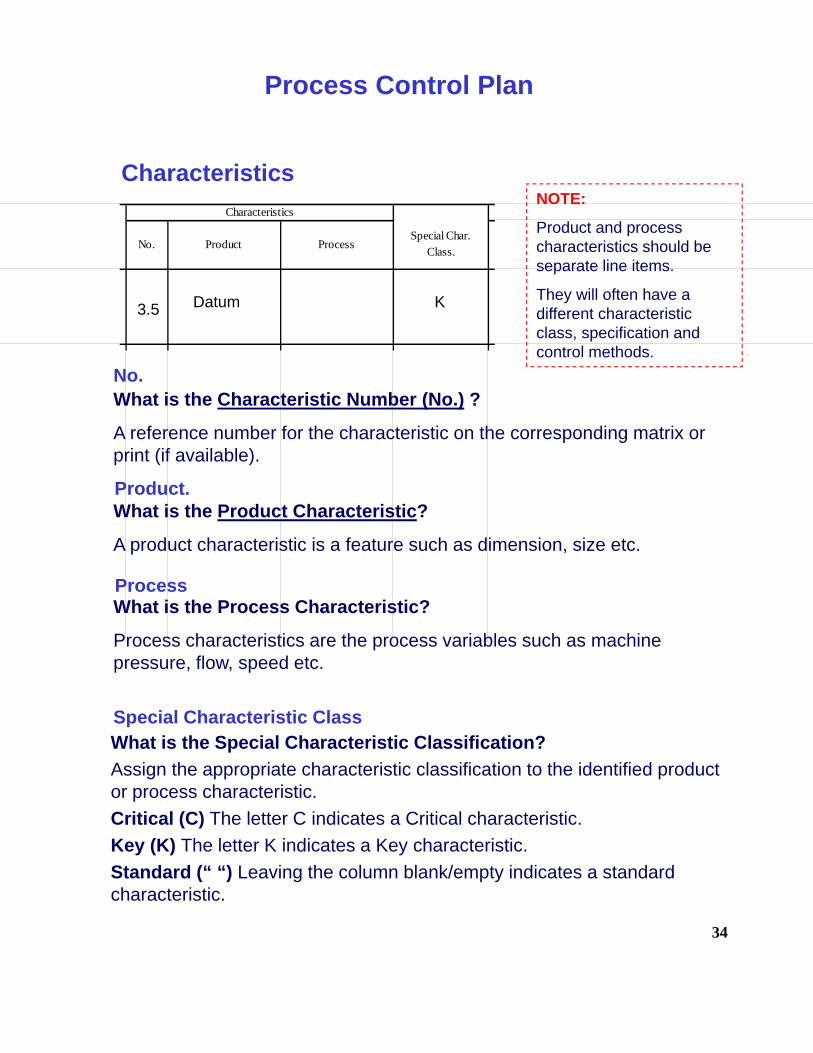
Characteristics
What is the Characteristic Number (No.) ?
A reference number for the characteristic on the corresponding matrix or print (if available).
Characteristics
No. Product ProcessSpecial Char.
Class.
3.5
What is the Product Characteristic?
A product characteristic is a feature such as dimension, size etc.
What is the Process Characteristic?
Process characteristics are the process variables such as machine pressure, flow, speed etc.
Datum
What is the Special Characteristic Classification? Assign the appropriate characteristic classification to the identified product or process characteristic. Critical (C) The letter C indicates a Critical characteristic.Key (K) The letter K indicates a Key characteristic. Standard (“ “) Leaving the column blank/empty indicates a standard characteristic.
K
NOTE:
Product and process characteristics should be separate line items.
They will often have a different characteristic class, specification and control methods.
Process Control Plan
No.
Product.
Process
Special Characteristic Class
35
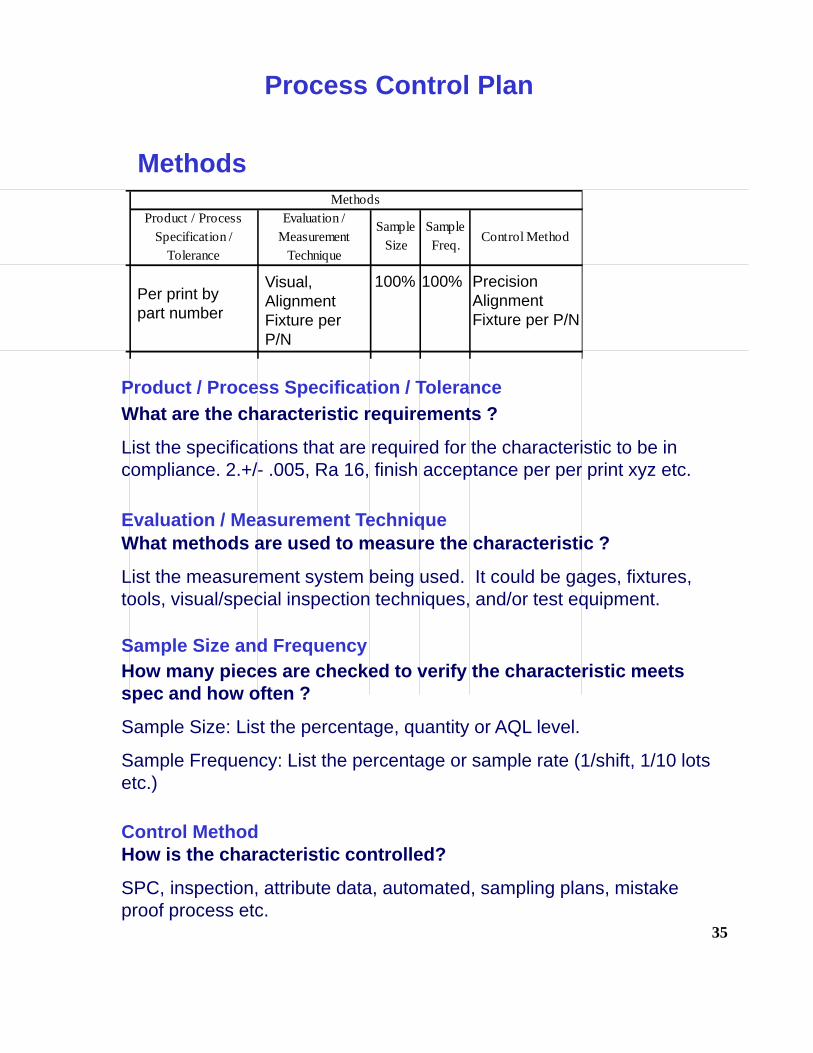
MethodsMethods
Product / Process Specification /
Tolerance
Evaluation / Measurement
Technique
Sample Size
Sample Freq. Control Method
What are the characteristic requirements ?
List the specifications that are required for the characteristic to be in compliance. 2.+/- .005, Ra 16, finish acceptance per per print xyz etc.
Product / Process Specification / Tolerance
What methods are used to measure the characteristic ?
List the measurement system being used. It could be gages, fixtures, tools, visual/special inspection techniques, and/or test equipment.
Evaluation / Measurement Technique
How many pieces are checked to verify the characteristic meets spec and how often ?
Sample Size: List the percentage, quantity or AQL level.
Sample Frequency: List the percentage or sample rate (1/shift, 1/10 lots etc.)
Sample Size and Frequency
How is the characteristic controlled?
SPC, inspection, attribute data, automated, sampling plans, mistake proof process etc.
Per print by part number
Visual,Alignment Fixture per P/N
100% 100% Precision Alignment Fixture per P/N
Control Method
Process Control Plan
36
Reaction plan
What does the operator do if the characteristic does not meet specifications ? Example: reject, scrap, repair process/print number referenced, rework, readjust device/machine, reevaluate process, segregate, tag nonconforming product and notify leader for disposition.
Reaction Plan
Contact Cell Leader.Repeat Set-up.Scrap per NCM Process.
Process Control Plan
37
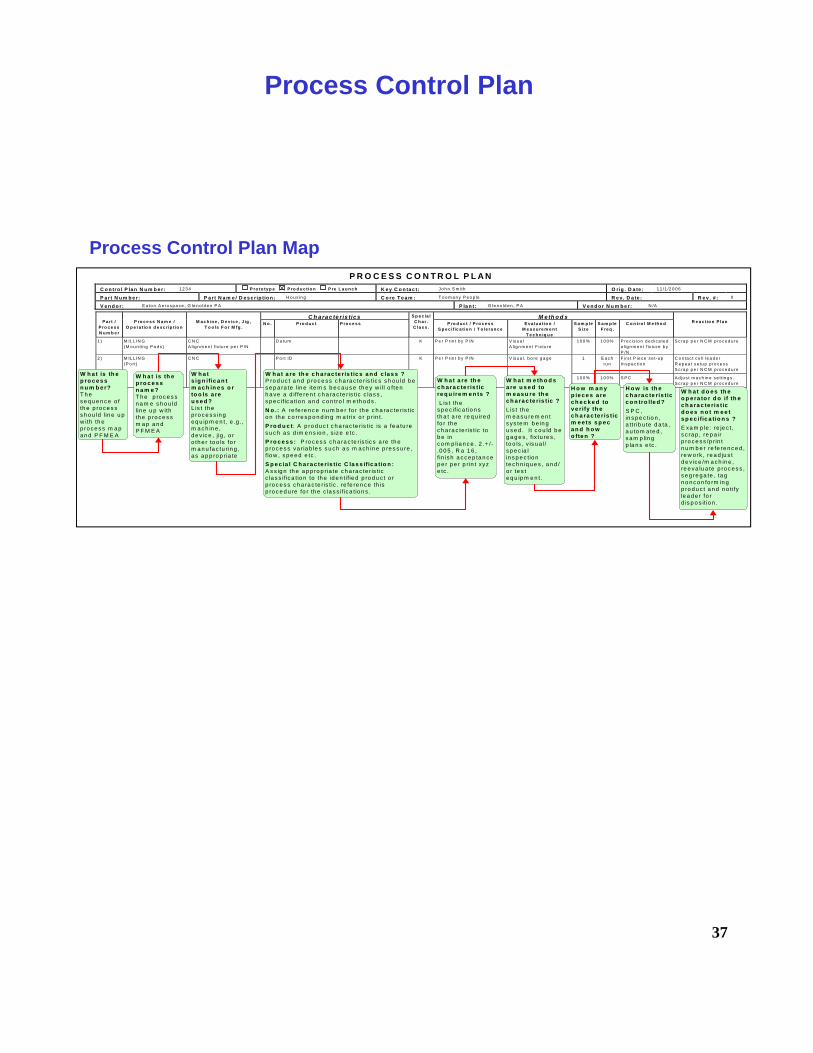
Process Control Plan
P R O C E S S C O N T R O L P L A N C o n tro l P la n N u m b e r: 1 2 3 4 P ro to typ e P ro d u c t io n P re L a u n c h K e y C o n ta c t: J o h n S m ith O rig . D a te : 1 1 /1 /2 0 0 6
P a r t N u m b e r : P a r t N a m e / D e s c rip tio n : H o u s in g C o re T e a m : T o o m a n y P e o p le R e v . D a te : R e v . # : 0
V e n d o r : E a to n A e ro s p a ce , G le n o ld e n P A P la n t: G le n o ld e n , P A V e n d o r N u m b e r : N /A
C h a ra c te r is tic s M e th o d s P a rt /
P ro c e s s N u m b e r
P ro c e s s N a m e /
O p e ra tio n d e s c rip tio n
M a c h in e , D e v ic e , J ig ,
T o o ls F o r M fg . N o . P ro d u c t P ro c e s s
S p e c ia l C h a r. C la s s .
P ro d u c t / P ro c e s s S p e c ific a t io n / T o le ra n c e
E va lu a tio n / M e a s u re m e n t
T e c h n iq u e
S a m p le S ize
S a m p le F re q .
C o n tro l M e th o d
R e a c t io n P la n
1 ) M IL L IN G (M o u n tin g P a d s )
C N C A l ig n m e n t fix tu re p e r P /N
D a tu m K P e r P r in t b y P /N V is u a l A lig n m e n t F ix tu re
1 0 0 % 1 0 0 % P re c is io n d e d ica te d a lig n m e n t f ix tu re b y P /N .
S c ra p p e r N C M p ro c e d u re
1 E a c h ru n
F irs t P ie ce s e t-u p In sp e c tio n
C o n ta c t c e l l le a d e r R e p e a t s e tu p p ro ce ss S c ra p p e r N C M p ro c e d u re
2 ) M IL L IN G (P o rt)
C N C P o r t ID K P e r P r in t b y P /N V is u a l, b o re g a g e
1 0 0 % 1 0 0 % S P C A d ju s t m a ch in e s e ttin g s . S c ra p p e r N C M p ro c e d u re
W h a t is th ep ro c e s sn u m b e r?T h es e q u e n c e o fth e p ro c e s ss h o u ld lin e u pw ith th ep ro c e s s m a pa n d P F M E A
W h a t is th ep ro c e s sn a m e ?T h e p ro c e s sn a m e s h o u ldlin e u p w ithth e p ro c e s sm a p a n dP F M E A
W h a ts ig n ific a n tm a c h in e s o rto o ls a reu s e d ?L is t th ep ro c e s s in ge q u ip m e n t, e .g .,m a c h in e ,d e v ic e , jig , o ro th e r to o ls fo rm a n u fa c tu rin g ,a s a p p ro p ria te
W h a t a re th e c h a ra c te ris tic s a n d c la s s ?P ro d u c t a n d p ro c e s s c h a ra c te ris t ic s s h o u ld b es e p a ra te lin e ite m s b e c a u s e th e y w ill o fte nh a ve a d iffe re n t c h a ra c te ris t ic c la s s ,s p e c if ic a tio n a n d c o n tro l m e th o d s .N o .: A re fe re n c e n u m b e r fo r th e c h a ra c te ris t ico n th e c o rre s p o n d in g m a trix o r p rin t.P ro d u c t : A p ro d u c t c h a ra c te ris t ic is a fe a tu res u c h a s d im e n s io n , s ize e tc .P ro c e s s : P ro c e s s c h a ra c te ris t ic s a re th ep ro c e s s va ria b le s s u c h a s m a c h in e p re s s u re ,f lo w , s p e e d e tc .S p e c ia l C h a ra c te ris tic C la s s ific a tio n :A s s ig n th e a p p ro p ria te c h a ra c te r is t icc la s s if ic a tio n to th e id e n tif ie d p ro d u c t o rp ro c e s s c h a ra c te ris t ic . re fe re n c e th isp ro c e d u re fo r th e c la s s if ic a tio n s .
W h a t a re th ec h a ra c te r is ticre q u ire m e n ts ? L is t th es p e c if ic a tio n sth a t a re re q u ire dfo r th ec h a ra c te ris t ic tob e inc o m p lia n c e . 2 .+ /-.0 0 5 , R a 1 6 ,f in is h a c c e p ta n c ep e r p e r p rin t xyze tc .
W h a t m e th o d sa re u s e d tom e a s u re th ec h a ra c te r is tic ?L is t th em e a s u re m e n ts ys te m b e in gu s e d . It c o u ld b eg a g e s , f ix tu re s ,to o ls , v is u a l/s p e c ia lin s p e c tio nte c h n iq u e s , a n d /o r te s te q u ip m e n t.
H o w m a n yp ie c e s a rec h e c k e d tov e r ify th ec h a ra c te r is ticm e e ts s p e ca n d h o wo fte n ?
H o w is th ec h a ra c te ris ticc o n tro lle d ?S P C ,in s p e c tio n ,a ttr ib u te d a ta ,a u to m a te d ,s a m p lin gp la n s e tc .
W h a t d o e s th eo p e ra to r d o if th ec h a ra c te ris ticd o e s n o t m e e ts p e c ific a tio n s ?E xa m p le : re je c t,s c ra p , re p a irp ro c e s s /p rin tn u m b e r re fe re n c e d ,re w o rk , re a d ju s td e v ic e /m a c h in e ,re e va lu a te p ro c e s s ,s e g re g a te , ta gn o n c o n fo rm in gp ro d u c t a n d n o tifyle a d e r fo rd is p o s it io n .
Process Control Plan Map
38
Manufacturing Instructions
Purpose:To define the requirements for developing comprehensive and supplemental Manufacturing Instructions (MI) for product, process, or activity to be produced which is to be applied at each operation or workstation.