Manufacturing Strategy Linked to Product Life Cycle Edna Ferro García Luna Application Engineering - Performance Axiem – Engineering Services 76140 Querétaro, Mexico [email protected]Tel.: +52.5. Ruth Sara Aguilar-Savén Department of Production Economics Linköping Institute of Technology S-581 83 Linköping, Sweden [email protected]Tel. +46.13.285785 Paper submitted to: Second World Conference on POM and 15th Annual POM Conference, Cancun, Mexico, April 30 - May 3, 2004. Abstract (number: 002-0302) The article deals with the decision problem faced when a firm is producing items with different life cycles, and/or in different cycle phases. Then, deciding on a Manufacturing Strategy (MS) becomes especially difficult, because usually different manufacturing processes are considered optimum for different products. An analysis of the suitable manufacturing process can result in that a coexistence of more than one should be implemented. This may signify a higher investment, and thus costs. The higher the number of suitable manufacturing processes required the more complex the definition of an adequate Manufacturing Strategy is. One could design the MS based on the analysis of all existing alternatives that permit to combine different manufacturing processes if there existed the process and clear criterion to choosing among them. There are some partial solutions in this matter pointed out in the literature, such as focused facilities or lean manufacturing. Unfortunately, no framework that permits to include, analyse, compare and decide among different solutions was found, nor any proposal for deciding which one of them to use when. Therefore, this paper first presents briefly these solutions and explains how they interact. Then, a generic decision methodology and criteria to define the Manufacturing Strategy for a firm with products presenting different life cycles are proposed and described. Key words: Manufacturing Strategy, Product Life cycle, Focused Facilities, Lean M
Transcript
Manufacturing Strategy Linked to Product Life Cycle
Edna Ferro García Luna Application Engineering - Performance
Ruth Sara Aguilar-Savén Department of Production Economics Linköping Institute of Technology S-581 83 Linköping, Sweden [email protected] Tel. +46.13.285785
Paper submitted to: Second World Conference on POM and 15th Annual POM
Conference, Cancun, Mexico, April 30 - May 3, 2004.
Abstract (number: 002-0302)
The article deals with the decision problem faced when a firm is producing items with different
life cycles, and/or in different cycle phases. Then, deciding on a Manufacturing Strategy (MS)
becomes especially difficult, because usually different manufacturing processes are considered
optimum for different products. An analysis of the suitable manufacturing process can result in
that a coexistence of more than one should be implemented. This may signify a higher
investment, and thus costs. The higher the number of suitable manufacturing processes
required the more complex the definition of an adequate Manufacturing Strategy is. One could
design the MS based on the analysis of all existing alternatives that permit to combine different
manufacturing processes if there existed the process and clear criterion to choosing among
them. There are some partial solutions in this matter pointed out in the literature, such as
focused facilities or lean manufacturing. Unfortunately, no framework that permits to include,
analyse, compare and decide among different solutions was found, nor any proposal for
deciding which one of them to use when. Therefore, this paper first presents briefly these
solutions and explains how they interact. Then, a generic decision methodology and criteria to
define the Manufacturing Strategy for a firm with products presenting different life cycles are
proposed and described.
Key words: Manufacturing Strategy, Product Life cycle, Focused Facilities, Lean M
1. Problem Definition
Operations management is the activity of managing the resources and processes that produce
and deliver goods and services. Every organisation, whether for-profit or not-for-profit, has an
operations function because every organisation produces some mix of goods and services,
Slack and Lewis (2002). Whereas, Operations strategy is the total pattern of decisions which
shape the long-term capabilities of any type operation and their contribution to overall
strategy, Slack and Lewis (2002). Firms and companies which focus is on the production of
goods use to refer their operations as Manufacturing. Thus, Manufacturing Strategy (MS)
comprises a series of decisions concerning process and infrastructure investments of a
production firm, i.e. what the manufacturing has and what it does. It aims to provide the
necessary support to develop strategic competences, which will enable the company to
develop a sustainable competitive advantage in its markets. Competitive advantages that
might be considered as qualifiers (Q), those that get and keep the company in the
marketplace, or as order winners (OW), those that let the company win orders in the
marketplace, Hill (2000).
All manufacturing capabilities should be decided close related to what kind of products will
manufacture. Every product has its own physical features designed according to the market
requirements and its volumes will change, sometimes even some of the features, according to
different phases along the product life. A product, similarly to any other organism alive, goes
through different phases along its life, which are referred to as the product life cycle (PLC).
Waller (1999) defines the following PLC stages:
• Development: this is a period prior to commercialisation, in which the product is being
designed and tested.
• Introduction: phase when the consumer starts to see the product as it is
commercialised and launched to the market.
• Growth: period when the product is well accepted in the market, revenues are growing
rapidly and support costs decline somewhat as the product starts to become self-
marketing.
• Maturity: in this phase the product is at a point where its existence is never given a
second thought.
• Decline and death: phase when the product reaches the end of its life and is eventually
retired.
Life cycle stage Demand rate Return rate Introduction Increases Almost zero
Growth Further increases Slowly starts to increase Maturity Stable situation Stable situation Decline Decreases rapidly Slowly starts to decrease Terminal or death No demands occur May still be positive
Table 1 Demand and return rate over life cycle stages
Hayes and Wheelwright (1979) separated the life cycle concept from a related but different
issue that they called process life cycle. They proposed a product-process matrix (PPMX)
where for each PLC stage there should be a proper match to the choice of the production
process forming the process life cycle. The product-process matrix has been recently
examined, see Ahmad and Schroeder (2002). The use of innovative management and
technological approaches can eliminate or at least minimise some of the trade-offs suggested
in the PPMX framework. When examined empirically, it can be seen that, e.g. a group of
plants with assembly line processes that originally were designed to produce large quantities
of a narrow range of products, may use some new flexible processing technology and be able
to produce a wide variety of products although still in large quantities, and then minimising
the trade-off between production volume and product variety. Furthermore, when a firm
produces items with different PLCs, customer requirements are not accomplished by one all
embracing strategy because customer requirements are very diverse and vary not only from
marketplace to marketplace, but also from one life cycle phase to another, i.e. the production
volumes and the competitive priorities for a firm change as a product goes through its
different life cycle stages.
PLC therefore needs to be considered as an important factor to decide on an appropriate
manufacturing strategy. There is still a big hole to fulfil in this matter cause the most common
decision methodologies choose a manufacturing strategy without considering PLC. Not
considering PLC can lead; on the one hand, to an unnecessary investment, e.g. in a line that
will not be used very long, and on the other hand, to high production costs that could be
lowered if a more suitable manufacturing strategy were implemented. Therefore, the aim of
this work is to establish a clear path to go through the decision problem that emerges when
considering life cycles in the manufacturing strategy. If this objective is achieved, the task to
define an appropriate Manufacturing Strategy considering the PLC factor will be facilitated.
The methodology proposed in this paper is based on the result of an analysis of more than 65
scientific references related to Manufacturing Strategy. For further details and documentation
of the present work, see Ferro (2002).
2. Products with Different Life Cycles
Customer requirements are to be satisfied which often makes a firm to produce items with
different life cycles. Magnan et. al. (1999) conducted a study in which, through a survey, a list
of competitive priorities by PLC stage is found. The results are interpreted and summarised in
Table 2. For example, generic food and groceries have long PLCs and relatively stable
demand patterns. There may be changes only during special promotions. Another common
example for products with a long life cycle, relatively low variety, and reasonably predictable
demand, are white socks, for which forecasting errors are low. In contrast, ice creams have a
very well defined seasonal demand, and they remain the same every year. Toys have seasonal
demand too, and a low level of innovation. On the other hand, ski jackets are innovative
products, but also have seasonal demand. In difference, computers and mobile phones have
very short PLCs with high levels of innovation; models are sold during a short period of time,
although they typically reach high volumes.
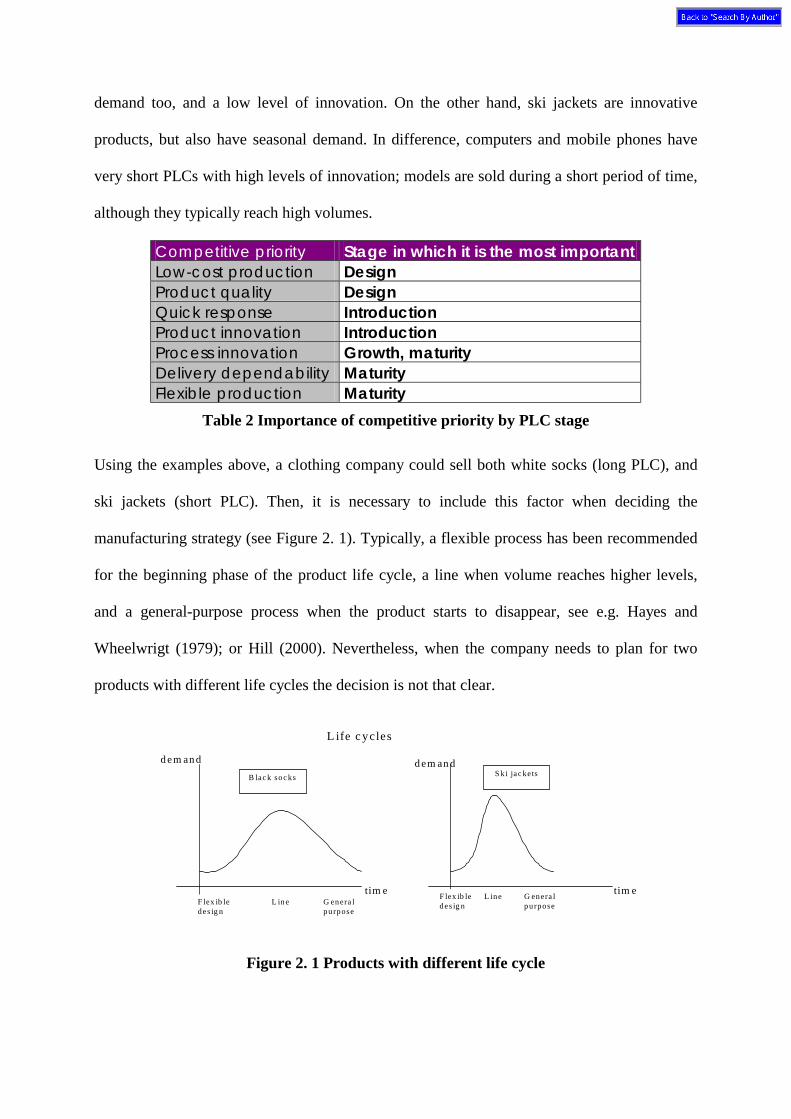
Competitive priority Stage in which it is the most important Low-cost production Design Product quality Design Quick response Introduction Product innovation Introduction Process innovation Growth, maturity Delivery dependability Maturity Flexible production Maturity
Table 2 Importance of competitive priority by PLC stage
Using the examples above, a clothing company could sell both white socks (long PLC), and
ski jackets (short PLC). Then, it is necessary to include this factor when deciding the
manufacturing strategy (see Figure 2. 1). Typically, a flexible process has been recommended
for the beginning phase of the product life cycle, a line when volume reaches higher levels,
and a general-purpose process when the product starts to disappear, see e.g. Hayes and
Wheelwrigt (1979); or Hill (2000). Nevertheless, when the company needs to plan for two
products with different life cycles the decision is not that clear.
L ife c ycles
F lex ib le des ig n
L ine G enera l pu rpose
B lac k soc ks S k i jac ke ts
F lex ib le des ig n
L ine G enera l pu rpose
d em an d d em an d
tim e tim e
Figure 2. 1 Products with different life cycle
The decision problem can be taken still further when a company plans to produce more than
two products with different life cycles. In Figure 2. 2, this problem is illustrated with only
three products, P1, P2, and P3. If the typical recommendation explained before was followed,
then different production processes would co-exist in the same company. In Figure 2. 2, L
shows the points in time when a line process would suit best, and G shows when a general-
purpose process would fit (according to the typical recommendations). This means that it
would be convenient to have at the same time a line and a general-purpose process which in
turn results in higher investments. Therefore, it might be better to have only a general-purpose
process, capable of producing the three different products although this means to loose the
advantages of economies of scale to produce high volumes in a line. Or it might be better to
have a different line for each product even when this might results in high cost for the
introduction phases. In any case what to do with P3, which never reaches a high volume?
L LG G G
P1P2
P3
Revenues
Time
Figure 2. 2 More than two products with different life cycle
Two different paths to follow were identified in the literature:
• Deciding if it is convenient to have focused or non-focused facilities
• Deciding among lean or agile manufacturing
These four alternatives and even their combinations can be used to deal with the decision
problem explained before. Next sections will briefly describe them.
3. Focused vs. Non-focused Facilities
According to Peters and McGinnis (2000), when considering the production of an evolving
family of similar products, each having a defined life cycle, two distinct strategies can be
followed in configuring production facilities:
• Focused facilities where a facility is dedicated to one product at a time, and it may be
reassigned.
• Non-focused facilities where they exploit the flexibility of the equipment by producing
a variety of products during a single planning period.
The selection of one of these strategies, or a hybrid one, is a fundamental decision for an
enterprise, see Olhager and West (2002).
Skinner (1974) developed the focused factory concept in contrast to what is still a common
practice of production units that have a broad range of objectives. He said that unless the
factory concentrates on a narrow range of manufacturing objectives it would not achieve
optimum levels of effectiveness. He argued that factories attempt to perform too many
conflicting production tasks within one inconsistent set of manufacturing objectives. This
brings out the need of setting up factories which have only a limited number of production
technologies, meet only a few market demands, do not mix long production runs with
specials, only make products with common quality objectives, and have a limited number of
manufacturing tasks. Factory focus facilitates a response for differentiation (Walters, 1999).
The question is not if the plant and machinery are capable of producing too many objectives,
but if it is economic to keep changing.
The main advantage of the focused factory is simplicity. Focused factories are easy to
manage, operate and control. There are no scheduling problems, and as a single product is
being made, set-ups are eliminated. Learning and continuous improvement are facilitated by
concentrating on a single item. But still, focused factories have several disadvantages. They
may be inefficient if PLCs are very short or if product demand is small. Excess capacity can
be seen as a waste. The creation of a new focused factory for a new product could be
expensive. And finally, it is complicated to decide when to convert the facility to a new
product.
The apparent duplication of buildings and machinery caused by the separation can be
compensated with lower costs, and better service to customers. However, where it is not
feasible to have separate facilities, it is suggested the factory within a factory: establishing
quite separate units within the same buildings and organisation (Hussey, 1998).
The second strategy is to develop non-focused or flexible factories; this is, to exploit the
flexibility of the equipment by producing a variety of products during a single planning
period. A non-focused facility produces a range of items, each at different points of PLC, so it
should require less production capacity than a corresponding set of focused facilities. But,
non-focused facilities will suffer some inefficiency due to issues such as equipment set-ups,
lot scheduling and tracking. A hybrid strategy is to have some focused facilities and at least
one non-focused one (Peters and McGinnis, 2000).
Flexibility concerns not only the ability of a process to manufacture low quantities, but also to
deal with demand increases. However, flexibility should not be used as a means to cover
uncertainty. The decision to use flexible equipment must be taken after evaluating the
alternatives and considering the market situation.
4. Lean vs. Agile Manufacturing
The focus of the lean approach has been essentially on the elimination of waste (Christopher
and Towill, 2001). Agile manufacturing (or agility) requires the ability to respond to
unpredictable changes in the market or customer demands; it aims to minimise the time from
making the concept to getting the money. This can be interpreted as zero waste of total time,
and zero waste of information flow. Reducing lead times, compressing the total cycle time
(TCT) is seen as a key lever. However, in the agile supply chain information flow must be
improved. It is not enough to concentrate just on the material flow (Mason-Jones and Towill,
1999).
Leanness, or lean production, is developing a value stream to eliminate all waste, including
time (Shi et al, 1997). Lean production encompasses practices such as: JIT (Just-in-time)
maintenance, JIT purchasing and supplier development. These practices have been identified
as critical antecedents to time-based performance (Jayaram et al, 1999).
As product life cycles continue to shorten and technological developments occur increasingly,
products need to innovate and manufacturing processes need to improve. These changes are
creating the need of competing beyond flexibility. Flexible changes are responses to known
situations where the procedures are ready to manage the change. Agility extends this
capability by requiring the ability to respond to unpredictable changes in the market or
customer demands. A company needs to be sufficiently competent at being able to manage
changes to well-defined conditions before it can extend its capabilities to responding to
unpredicted changes.
It might seem that agility is better than leanness. Agile manufacturing has been recently
highlighted as an alternative to leanness. It has also been suggested that agility is the next step
after leanness. This could lead to the idea that, once leanness has been achieved, a firm should
fight for agility or even that agility should be the goal of a company and leanness as a primary
objective should be forgotten. But, actually, leanness can still be a good alternative. Thinking
that agility is better in every case would oversimplify the situation. That idea forgets to take
into consideration the product type and hence the business environment and response
requirements needed for an adequate match (Mason-Jones et al, 2000). These paradigms are
simply different, and the point is to choose the correct one, according to the situation. Some
authors have compared them to facilitate this decision. E.g. according to Mason-Jones et. al.
(2000), typical products of lean and agile production are commodities and fashion goods
respectively. Commodities are basic products, which have relatively long life PLCs and low
demand uncertainty, since they tend to be well-established products with known consumption
pattern. Whereas, fashion products have a short life cycle and high demand uncertainty.
Lean/agile Hybrid Strategies
Pareto/80:20
An analysis of a business will typically show that the 80/20 rule holds. Thus, 80% of the total
volume will be generated from just 20% of the total product variety. The way in which this
20% are managed should probably be different from the way the remaining 80% are managed.
For instance, it could happen that the top 20% of products are more predictable and then they
are good candidates for following lean principles. While the slow moving 80% will typically
be less predictable and will require a more agile mode of management (Christopher and
Towill, 2001). Thus, the idea is to select the 20% of the products that are responsible for the
80% of the total volume, and make them following the lean paradigm, while the rest of the
items are made using the agile paradigm.
De-coupling point
Shi et. al. (1997) combine lean and agile concepts within a total supply chain, obtaining the
leagile paradigm. This means that, for the first production steps, the products are standardised,
and they can be made using the lean approach. Afterwards, when products are customised, at
the de-coupling point, agile production is used. In other words, Christopher and Towill (2001)
explain that combination of lean and agile paradigms can be achieved through the creation of
a de-coupling point using what may be termed strategic inventory. The idea is to hold
inventory in some generic or modular form and only complete the final assembly or
configuration when the precise customer requirement is known. Using lean methods up to the
de-coupling point and agile methods beyond it would do this.
Surge/base demand separation
Christopher and Towill (2001) mention other lean/agile hybrid strategies that have been
successfully employed, and that are based on the separation of demand patterns into base and
surge elements. Agile supply chains are usually dominated by surge (wave) flows rather than
base (constant) flows. Surge flows result from demand uncertainty (Mason-Jones and Towill,
1999). Base demand forecast can be obtained from past history while surge demand typically
cannot. Thus, base demand can be met through classic lean procedures to achieve economies
of scale, whereas surge demand is provided through more flexible, and probably higher cost,
processes.
5. Methodology Proposal to define a MS
The general methodology proposed to decide a manufacturing strategy is based on Hill (2000)
and summarised in Figure 5. 1; for a detailed description of this methodology refer to Ferro
(2002). Even when it is presented as sequential steps, it should in reality be an iterative
process. This methodology involves decisions at different levels of the organisation, which
need to go well together. The aim of the methodology is to assure that all-important factors
during the design of a MS are considered, and that the objectives of the MS are congruent
with the objectives of the marketing and corporate strategies. By doing this, it is easier to get a
manufacturing strategy that leads to achieve the order winners and qualifiers established for
every product and market segment. What is new is that the proposal considers all the
important factors to decide the manufacturing strategy including the PLC in order to facilitate
the decision of the MS of a firm having products with different life cycles or in different
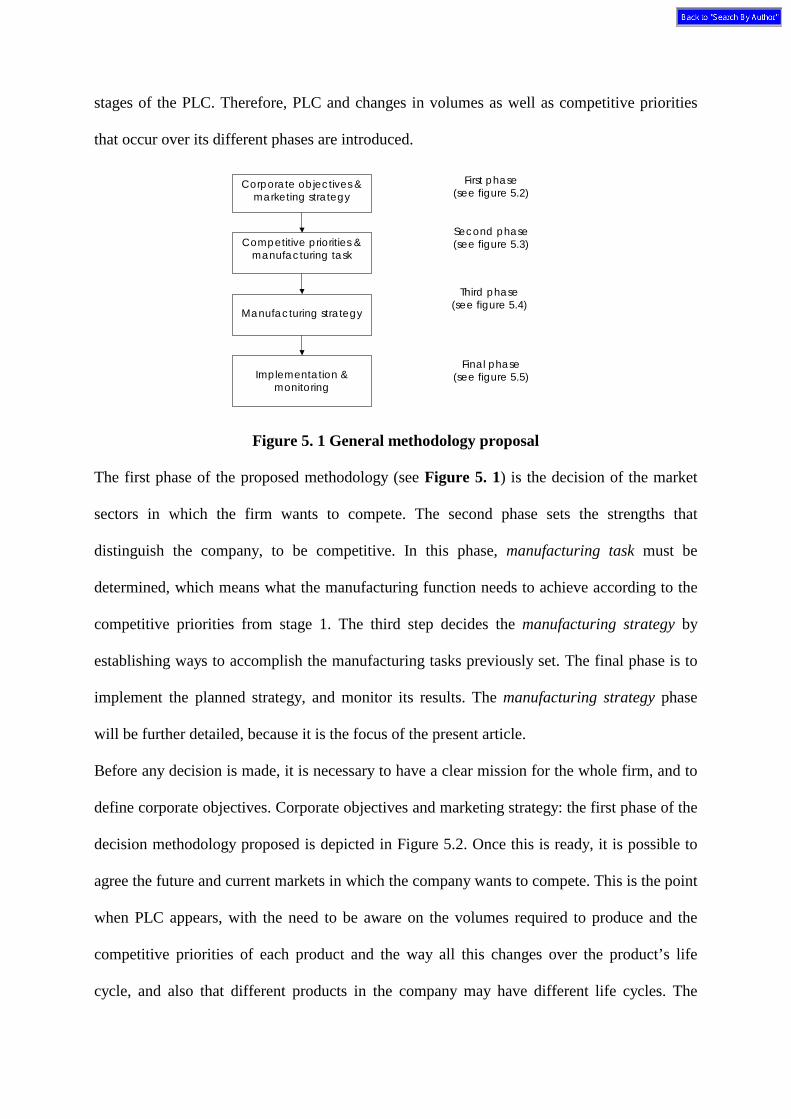
stages of the PLC. Therefore, PLC and changes in volumes as well as competitive priorities
that occur over its different phases are introduced.
Corporate objectives & marketing strategy
Competitive priorities & manufacturing task
Manufacturing strategy
Implementation & monitoring
First phase(see figure 5.2)
Second phase(see figure 5.3)
Third phase(see figure 5.4)
Final phase(see figure 5.5)
Figure 5. 1 General methodology proposal
The first phase of the proposed methodology (see Figure 5. 1) is the decision of the market
sectors in which the firm wants to compete. The second phase sets the strengths that
distinguish the company, to be competitive. In this phase, manufacturing task must be
determined, which means what the manufacturing function needs to achieve according to the
competitive priorities from stage 1. The third step decides the manufacturing strategy by
establishing ways to accomplish the manufacturing tasks previously set. The final phase is to
implement the planned strategy, and monitor its results. The manufacturing strategy phase
will be further detailed, because it is the focus of the present article.
Before any decision is made, it is necessary to have a clear mission for the whole firm, and to
define corporate objectives. Corporate objectives and marketing strategy: the first phase of the
decision methodology proposed is depicted in Figure 5.2. Once this is ready, it is possible to
agree the future and current markets in which the company wants to compete. This is the point
when PLC appears, with the need to be aware on the volumes required to produce and the
competitive priorities of each product and the way all this changes over the product’s life
cycle, and also that different products in the company may have different life cycles. The
steps presented in this first phase are all at the corporate level. It is in the following phase
when it becomes a matter of operations strategy (see Figure 5.3).
Strategic planCorporate objectives
GrowthSurvivalProfitROI, etc.
Mission
Marketing strategy to meet these objectivesConsider:
Environmental uncertaintiesStrengths and weaknessesOpportunities and threatsIndustry practices and trendsKey competitors and business’s relative position
Determine:⇒ might change through PLCDifferent market segments, and objectives for
each→end user characteristics and buying behaviourRange or width of product lineMixVolume (current and future)Standardisation vs. CustomisationLevel of innovationLeader vs. follower
Quality
How much
can we invest?
Figure 5.2 Corporate objectives and marketing strategy: the first phase.
Once Marketing Strategy is defined, it is necessary to determine the order winners (OW) and
qualifiers (Q) for each market segment both, today and in the future, and to state their relative
importance. Afterwards, the need is to translate the relevant OW and Q into the equivalent
manufacturing tasks. Then, the manufacturing strategy is decided in the following phase.
Qualifying and order winning criteriaCompetitive priorities:Relative importance
•Price•Quality conformance•Delivery (speed, reliability)•Colour range•Product range•Design•Brand image•Technological support•After-sales support
Operations planActivities (critical and non-critical) SequencesTime and cost estimations
Core capabilities need to fulfil competitive priorities
Figure 5.3 Operations strategy: the second phase
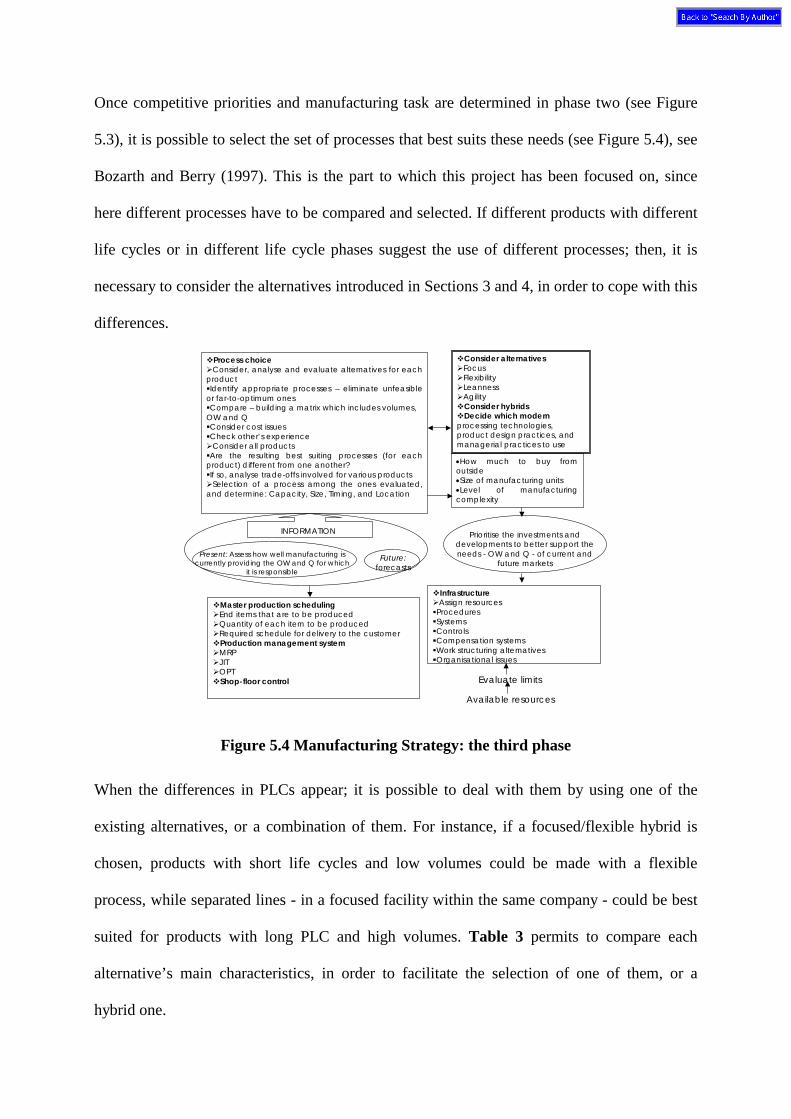
Once competitive priorities and manufacturing task are determined in phase two (see Figure
5.3), it is possible to select the set of processes that best suits these needs (see Figure 5.4), see
Bozarth and Berry (1997). This is the part to which this project has been focused on, since
here different processes have to be compared and selected. If different products with different
life cycles or in different life cycle phases suggest the use of different processes; then, it is
necessary to consider the alternatives introduced in Sections 3 and 4, in order to cope with this
differences.
INFORMATION Prioritise the investments and developments to better support the needs - OW and Q - of current and
future markets
Process choiceConsider, analyse and evaluate alternatives for each
or far-to-optimum onesCompare – building a matrix which includes volumes,
OW and QConsider cost issuesCheck other’s experienceConsider all products
Are the resulting best suiting processes (for each product) different from one another?If so, analyse trade-offs involved for various productsSelection of a process among the ones evaluated,
and determine: Capacity, Size, Timing, and Location
Consider alternativesFocusFlexibilityLeannessAgilityConsider hybridsDecide which modern
processing technologies, product design practices, and managerial practices to use
•How much to buy from outside•Size of manufacturing units•Level of manufacturing complexity
Master production schedulingEnd items that are to be producedQuantity of each item to be producedRequired schedule for delivery to the customerProduction management systemMRPJITOPTShop-floor control
Present: Assess how well manufacturing is currently providing the OW and Q for which
it is responsible
Future: forecasts
Available resources
Evaluate limits
Figure 5.4 Manufacturing Strategy: the third phase
When the differences in PLCs appear; it is possible to deal with them by using one of the
existing alternatives, or a combination of them. For instance, if a focused/flexible hybrid is
chosen, products with short life cycles and low volumes could be made with a flexible
process, while separated lines - in a focused facility within the same company - could be best
suited for products with long PLC and high volumes. Table 3 permits to compare each
alternative’s main characteristics, in order to facilitate the selection of one of them, or a
hybrid one.
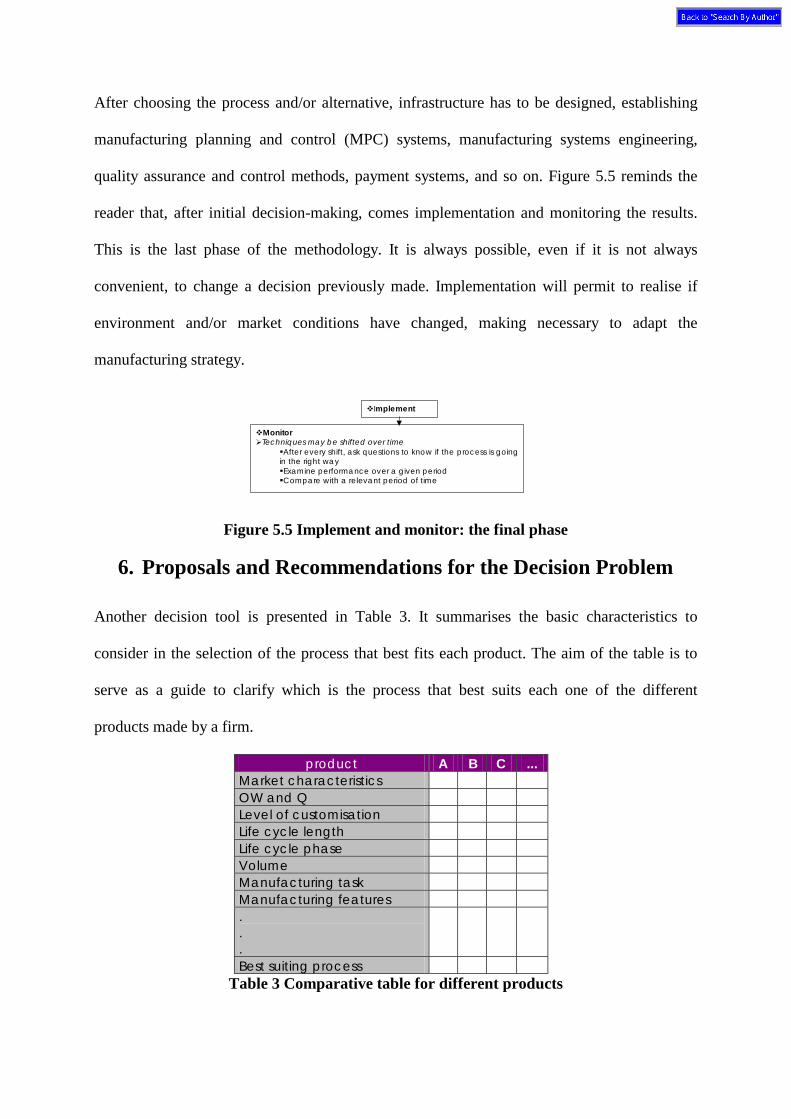
After choosing the process and/or alternative, infrastructure has to be designed, establishing
manufacturing planning and control (MPC) systems, manufacturing systems engineering,
quality assurance and control methods, payment systems, and so on. Figure 5.5 reminds the
reader that, after initial decision-making, comes implementation and monitoring the results.
This is the last phase of the methodology. It is always possible, even if it is not always
convenient, to change a decision previously made. Implementation will permit to realise if
environment and/or market conditions have changed, making necessary to adapt the
manufacturing strategy.
Implement
MonitorTechniques may be shifted over time
After every shift, ask questions to know if the process is goingin the right wayExamine performance over a given periodCompare with a relevant period of time
Figure 5.5 Implement and monitor: the final phase
6. Proposals and Recommendations for the Decision Problem
Another decision tool is presented in Table 3. It summarises the basic characteristics to
consider in the selection of the process that best fits each product. The aim of the table is to
serve as a guide to clarify which is the process that best suits each one of the different
products made by a firm.
product A B C ... Market characteristics OW and Q Level of customisation Life cycle length Life cycle phase Volume Manufacturing task Manufacturing features . . .
Best suiting process Table 3 Comparative table for different products
Table 3 includes some basic characteristics, but it can be complemented with as much as is
needed according to the situation. The idea is that, filling in this table, these characteristics,
which determine the best processes for each product, are brought out, and then those best
processes are identified. If the ones making the decision are very lucky, all the products will
need the same kind of process. But, as this is very unlikely to happen, this could be the initial
step leading to a more difficult decision. The problem is to decide whether it is better to
implement a different production process for each product, or to have a process flexible
enough able to produce all of them, or if it should be chosen a hybrid process.
When trying to solve the decision problem explained just above, possible solutions will
follow one of three basic paths (see Figure 5.6):
• Go for one single process either using flexibility, and/or agility.
• Go for different processes; this would be achieved with a focused factory for each one
of them; this is usually linked with the use of lean production, although it can include
a flexible part.
• The hybrid option, which usually is leagility, or combining, focus for the high volume
products – the ones in the maturity stage – and flexible for the rest, the ones in low
volume phases.
1 single process
Flexible
Agile
Hybrid
Leagile
Different processes
Focused
Lean
Figure 5.6 The three basic paths to solve the decision problem
Once the basic paths to follow have been identified, the question would be: how to choose one
of them. For this purpose a comparative matrix is proposed and shown in Table 4. The aim is
to summarise and clarify the most important characteristics of the main alternatives, and when
they give best results.
alternative Focus Flexibility Leanness Agility Aim Concentrate on
a narrow range of
manufacturing objectives
Exploit the equipment by producing a
variety of items during a single
planning period
Eliminate waste Minimise the time from
making the concept to getting the
money PLC Not very short Short Long Short Customer drivers
Any, but common
Delivery speed and reliability
Cost Availability
Production technologies
Limited General purpose
Flow-line Project, jobbing
Market demands met
Only a few Many Only a few Many
Quality objectives
Common Different Common Different
Manufacturing tasks
Limited Wide Limited Varying
Advantages Simplicity. Can become
very efficient.
Set-ups are eliminated.
Learning and continuous
improvement.
Good use of capacity. Deals with
predictable changes.
Compressed total cycle time
(TCT). Time-based
performance.
Deals with unpredictable changes in a
volatile market. Short lead
times.
Disadvantages A new focused factory can be
expensive. It is
complicated to decide when to
convert the facility to a new
product.
Inefficiencies due to
equipment set-ups, lot
scheduling, tracking, etc.
Concentrates just on the
material flow.
Inefficiencies due to set-ups,
scheduling, and so on.
Can make manufacturing
function too complex.
Ideal for Separating products with
specific life cycles,
production volumes and/or customer drivers
Short PLCs, low volume phases,
and environments
sensitive to market entry
time
Producing commodities in a predictable market; low
product variety; long life cycle
Producing fashion goods in
a volatile market; high
product variety; short life cycle
Table 4 Comparison of each alternative’s main characteristics
It is possible to choose among the alternatives presented in Table 4 the one that best suits a
determined situation, or it is possible to combine them, i.e. with a hybrid, such as
focused/flexible, Pareto, de-coupling point (leagility), or surge/base. For instance, the concept
of leagility, already introduced in Section 4, combines lean and agile paradigms through the
creation of a de-coupling point, using a strategic inventory. Pareto is another approach to
combine leanness and agility (see Section 4).
Another combined solution could be to use focus, separating the products in a high volume
phase from the ones in a low volume phase. In the first case, a low cost process can be used,
maybe following lean paradigm, in order to achieve low prices. In the latter, flexibility is
recommended, so the capacity of this area is better utilised, moving it from making one
product to another one.
Although, it is always possible to go for an apparently easy solution, such as just go on
producing with the mismatch, it is not recommended, because once the mismatch is detected,
it is better to face the problem and do something that will facilitate the production process
afterwards. At least, it could be reasonable to follow the 80/20 rule in the simplest way:
adapting the manufacturing strategy to the needs of the 20% of the products responsible for
the 80% of the total volume.
After selecting a few number – let’s say, around three – of good alternatives or combinations
of them, Table 5 can be used as another decision tool in which it is possible to compare the
alternatives selected so far, to choose the best one, according to the factors considered in it.
To use Table 5, the one deciding needs to go line by line, grading the results expected for
each one of the alternatives chosen so far. Some of these results cannot be measured if the
studied situation is still on project. Anyway, it is possible to estimate the expected results,
according to forecasts and available information. As the analysis is not supposed to be
quantitative, it is sufficient to write distinctive numbers to state which practices are better.
The procedure would then be to assign number 3 for the alternative with best results in a
determined line, number 2 for the next one, and number 1 for the alternative with lowest
results in that line. If the whole table is filled that way, then it becomes very easy to compare.
If the results for each column are added, the one with the highest score will be the best fitting
alternative.
Alternative or combination A B C How suitable is it for the existing level of match or mismatch? Current and future performance Traditional performance measures ROI, ROA, ROS Purchase price variances Sales per employee Profit per unit production Productivity
Modern performance measures Corporate objectives Marketing objectives – markets and competitors Financial objectives Business unit operational objectives Departmental level operation measures
Customer perspective - OW and Q, which change through PLC Quality conformance Cost supply Lead times Width of product range Order size Delivery reliability
Innovation and learning
Investment Infrastructure requirements Support systems Overheads Complexity Inventory increase
Expected cash flows in facilities Plant Equipment Installation
Other initial expenditures Risk
Cost estimates Supporting working capital Overheads necessary to provide an appropriate level of service
and support
Table 5 Proposed factors to compare among alternatives/combinations
If only two alternatives are to be compared, Table 5 will only need A and B columns (not C).
The same way, if more than three alternatives are to be compared, it is possible to add more
columns (D, E). It is possible to compare as many alternatives as needed. However, it is not
recommended to compare more than three of them at this stage. There is supposed to be a
previous selection before getting to this point. The rows in Table 5 can be adjusted, as well.
Thus, if more aspects are to be considered when comparing among the alternatives, it is
possible to add more lines. The same way, if any of the decision factors listed in the table is
not regarded as important for a specific situation, it can be taken out.
7. Concluding Remarks and Future Research
Typically, when a product is in a low-volume phase, it is recommended to produce with a
general-purpose process, which allows the production of many different items, to make better
use of the capacity of the equipment. Whereas, if a product is in a high-volume phase,
production is usually recommended with a dedicated process, which is better to achieve low
cost production. Nevertheless, if there is a mix of different products with different life cycles,
or in different life cycle phases, it is more difficult to decide. The decision then is not only
which process to use for each product, but also how to combine the processes.
There is a number of alternatives to solve this problem, from the possibility of just
establishing a process and continue producing, even with the existence of a mismatch, to the
focused factory, or flexibility, or the combination of both of them, going through the selection
of lean production, agility, or leagility.
In order to facilitate the choice some recommendations and proposal of some decision tools
are presented. In general, the idea is to follow these steps:
1. Establish and/or clarify the mission of the firm, corporate objectives, and
marketing objectives.
2. Establish and/or clarify the marketing strategy, deciding on products and markets,
and setting order winners and qualifiers for each product, along the life cycle.
3. Examine and evaluate the characteristics of the products and decide which would
be the best production process for each one of them.
4. Evaluate and compare the expected performance of each one of the alternatives for
the whole firm, confronting their main characteristics with the needs of the studied
situation.
5. Choose two or three alternatives that seem to be feasible and good, so far.
6. Make a complete evaluation for these two or three alternatives, considering
performance, satisfaction of competitive priorities, investment needed, and costs,
at least.
7. Choose the best alternative.
8. Implement.
9. Check and monitor results.
10. If necessary, evaluate and select again.
This is a general decision methodology, which can be adapted and enriched with the
information of a firm, and according to its specific needs. Also, as new alternatives and
techniques come out, they can also be considered in this framework.
There are some alternatives that can be adapted to combine different production processes,
e.g. using a focused facility it is possible to have separate production processes for different
products. But it wasn’t found any framework including different alternatives, or any proposal
for deciding which one to use.
As the existing theories and proposals do not seem to be enough, it was necessary to propose
a solution for the problem of deciding a manufacturing strategy for products with different life
cycles. A solution for this decision problem was already proposed and explained in the
present paper. Now the question would be to apply the proposed methodology in real cases, in
several companies, and evaluate the results.
References
1. Ahmad, S. and Schroeder, R.G. (2002). “Refining the Product/Process Matrix”,
International Journal of Operations &Production Management, Vol. 22, No 1, pp
103-124.
2. Bozarth, C.C. and Berry, W.L. (1997). “Measuring the Congruence Between Market
Requirements and Manufacturing: a Methodology and Illustration”, Journal of