November 13, 2014 – Press Release Reporting Third Quarter Results 1 C$ unless otherwise stated TSX/NYSE/PSE: MFC SEHK:945 For Immediate Release November 13, 2014 Manulife Financial reports 3Q14 net income of $1.1 billion, core earnings of $755 million and a regulatory capital ratio of 248% Substantive progress made on growth strategies in the third quarter of 2014: • Developing our Asian opportunity to the fullest – Achieved record insurance sales on a constant currency basis, with double digit growth in Hong Kong, Indonesia and our Asia Other businesses as well as continued success in Japan; continued to build momentum in wealth sales reflecting successful product launches and marketing campaigns; delivered strong growth in core earnings, driven by higher sales volumes and favourable policyholder experience. • Growing our wealth and asset management businesses around the world – Achieved our 24 th consecutive quarter of record funds under management, driven by solid net flows in our asset management and group retirement businesses; delivered continued robust mutual fund sales around the world; Manulife Asset Management achieved record assets under management for external clients. • Building on our balanced Canadian business – Announced our agreement to acquire the Canadian operations of Standard Life plc; achieved solid sales and record funds under management in our mutual fund and group retirement businesses; competitive pressures continued to challenge both large case sales in Group Benefits and growth in Manulife Bank; continued to build momentum in Retail Insurance sales, driven by the success of our recently launched simplified universal life product. • Continuing to drive sustainable earnings and opportunistic growth in the U.S. – Strong mutual fund net flows contributed to record assets under management for John Hancock Investments; continued to face a challenging competitive environment in Retirement Plan Services; delivered improved momentum in life insurance sales, driven by recent product initiatives, despite slow industry sales. TORONTO – Manulife Financial Corporation (“MFC”) announced today net income attributed to shareholders of $1,100 million for the quarter ended September 30, 2014, fully diluted earnings per common share of $0.57 and return on common shareholders’ equity (“ROE”) of 14.8%, compared with $1,034 million, $0.54 and 16.8%, respectively, for the quarter ended September 30, 2013. In 3Q14, MFC generated core earnings 1 of $755 million, fully diluted core earnings per common share 1 of $0.39 and core return on common shareholders’ equity (“Core ROE”) 1 of 10.1%, compared with $704 million, $0.36 and 11.3%, respectively, in 3Q13. Donald Guloien, President and Chief Executive Officer, said, “We had a very strong quarter. Once again we delivered core earnings that were slightly better than planned, achieved outstanding investment results, and had lower-than-expected charges associated with our annual actuarial review. All of these together lead to very strong net income and capital ratio for the quarter.” 1 This item is a non-GAAP measure. See “Performance and Non-GAAP Measures” below.
Transcript
November 13, 2014 – Press Release Reporting Third Quarter Results 1
C$ unless otherwise stated TSX/NYSE/PSE: MFC SEHK:945 For Immediate Release November 13, 2014
Manulife Financial reports 3Q14 net income of $1.1 billion, core earnings of $755 million and a regulatory capital ratio of 248% Substantive progress made on growth strategies in the third quarter of 2014:
• Developing our Asian opportunity to the fullest – Achieved record insurance sales on a constant currency basis, with double digit growth in Hong Kong, Indonesia and our Asia Other businesses as well as continued success in Japan; continued to build momentum in wealth sales reflecting successful product launches and marketing campaigns; delivered strong growth in core earnings, driven by higher sales volumes and favourable policyholder experience.
• Growing our wealth and asset management businesses around the world – Achieved our 24th consecutive quarter of record funds under management, driven by solid net flows in our asset management and group retirement businesses; delivered continued robust mutual fund sales around the world; Manulife Asset Management achieved record assets under management for external clients.
• Building on our balanced Canadian business – Announced our agreement to acquire the Canadian operations of Standard Life plc; achieved solid sales and record funds under management in our mutual fund and group retirement businesses; competitive pressures continued to challenge both large case sales in Group Benefits and growth in Manulife Bank; continued to build momentum in Retail Insurance sales, driven by the success of our recently launched simplified universal life product.
• Continuing to drive sustainable earnings and opportunistic growth in the U.S. – Strong mutual fund net flows contributed to record assets under management for John Hancock Investments; continued to face a challenging competitive environment in Retirement Plan Services; delivered improved momentum in life insurance sales, driven by recent product initiatives, despite slow industry sales.
TORONTO – Manulife Financial Corporation (“MFC”) announced today net income attributed to shareholders of $1,100 million for the quarter ended September 30, 2014, fully diluted earnings per common share of $0.57 and return on common shareholders’ equity (“ROE”) of 14.8%, compared with $1,034 million, $0.54 and 16.8%, respectively, for the quarter ended September 30, 2013. In 3Q14, MFC generated core earnings1 of $755 million, fully diluted core earnings per common share1 of $0.39 and core return on common shareholders’ equity (“Core ROE”)1 of 10.1%, compared with $704 million, $0.36 and 11.3%, respectively, in 3Q13.
Donald Guloien, President and Chief Executive Officer, said, “We had a very strong quarter. Once again we delivered core earnings that were slightly better than planned, achieved outstanding investment results, and had lower-than-expected charges associated with our annual actuarial review. All of these together lead to very strong net income and capital ratio for the quarter.”
1 This item is a non-GAAP measure. See “Performance and Non-GAAP Measures” below.
November 13, 2014 – Press Release Reporting Third Quarter Results 2
Mr. Guloien added, “We achieved satisfactory overall insurance sales, recording substantial growth from both the prior quarter and last year. Our results were highlighted by very strong sales from Asia, partially offset by some weaker results in Canada and the U.S. Owing to widespread global economic uncertainty prevalent in the third quarter, wealth sales were slower in the quarter, but we delivered our 24th consecutive quarter of AUM growth.”
Steve Roder, Chief Financial Officer said, “We completed our annual review of actuarial methods and assumptions in the third quarter, resulting in a net charge of $69 million. We are pleased that the reserve adjustment was below our previous estimate and lower than in prior years. The amount and direction of future reserve adjustments will be based on emerging experience, which we cannot predict.”
“We continued to generate excellent investment-related experience reflecting our high quality asset portfolio, disciplined approach to extending credit and expertise in managing alternative long-duration assets,” added Mr. Roder.
Highlights for the Third Quarter of 2014:
• Reported net income attributed to shareholders of $1,100 million, up $66 million from 3Q13. Our 3Q14 net income benefited by $370 million from strong investment-related experience as well as positive market-related factors of $70 million, partly offset by a net charge of $69 million related to the annual review of actuarial methods and assumptions. Net income attributed to shareholders for the nine months ended September 30, 2014 was $2,861 million as compared with $1,833 million for the first nine months of 2013.
• Generated core earnings of $755 million in 3Q14, up $51 million from 3Q13, and up $54 million from 2Q14.
− The increase compared with 3Q13 was driven by higher fee income on increased assets under management in our wealth businesses, lower net hedging costs and the favourable impact of a higher U.S. dollar, partially offset by the non-recurrence of a favourable tax item.
− The increase compared with 2Q14 was largely due to improved policyholder experience, the impact of higher sales and favourable business mix on new business strain, and higher fee income. Last quarter, core earnings benefited from the release of a legal provision and a number of other items.
− Core earnings for the nine months ended September 30, 2014 was $2,175 million as compared to $1,932 million for the first nine months of 2013.
• Delivered insurance sales2 of $660 million, up 7% from 3Q13. In Asia, we achieved record insurance sales on a constant currency basis 3, driven by continued momentum in corporate products in Japan, a successful start to Hong Kong's annual sales campaign, and double digit growth in Indonesia and our Asia Other businesses. In Canada, the success of a recently launched simplified universal life product contributed to building sales momentum in Retail Insurance; however, lower sales in Group Benefits resulted in a decline in total insurance sales. In the U.S., life insurance sales continued to be challenged by slow overall industry sales, but improved over the prior quarter due to traction with recently launched products.
• Generated strong wealth sales of $11.7 billion, in line with 3Q13. Asia wealth sales continued to build momentum, benefiting from successful product launches, marketing campaigns and improved investor sentiment in Indonesia. In Canada, wealth sales declined reflecting normal variability in large case group retirement sales and lower new bank loan volumes (which we include in wealth sales) due to competitive rate pressures in a slowing residential mortgage market. In the U.S., mutual fund sales continued to be strong, but declined relative to the prior year.
2 This item is a non-GAAP measure. See “Performance and Non-GAAP Measures” below. 3 Growth (declines) in sales, premiums and deposits and funds under management are stated on a constant currency basis. Constant
currency basis is a non-GAAP measure. See “Performance and Non-GAAP Measures” below.
November 13, 2014 – Press Release Reporting Third Quarter Results 3
• Strengthened the Minimum Continuing Capital and Surplus Requirements (“MCCSR”) ratio to 248% for The Manufacturers Life Insurance Company (“MLI”), up 5 points from June 30, 2014, reflecting the contribution of third quarter earnings. As a result of strong third quarter earnings and the favourable impact of a stronger U.S. dollar, the Company’s financial leverage ratio improved from 28.2% at 2Q14 to 27.1%.
• Achieved 24th consecutive quarter of record funds under management5 of $663 billion.
• Announced the proposed acquisition of the Canadian-based operations of Standard Life plc. This transaction, which is subject to regulatory approval, will accelerate our growth strategy for our Canadian business, in particular our wealth and asset management businesses. In addition, the transaction builds our capability to serve customers in all of Canada, and elsewhere in the world, from Quebec.
• Generated strong investment-related experience of $370 million, $50 million of which was included in core earnings. The investment-related experience gains were largely due to fair value gains on alternative long-duration assets (“ALDA”) and the impact of further investments made in higher yielding ALDA on the measurement of our policy liabilities.
− Starting in 2015, we intend to increase the amount of investment-related experience gains included in core earnings to a maximum of $400 million per annum from $200 million per annum, reflecting our recent strong experience and future outlook.4
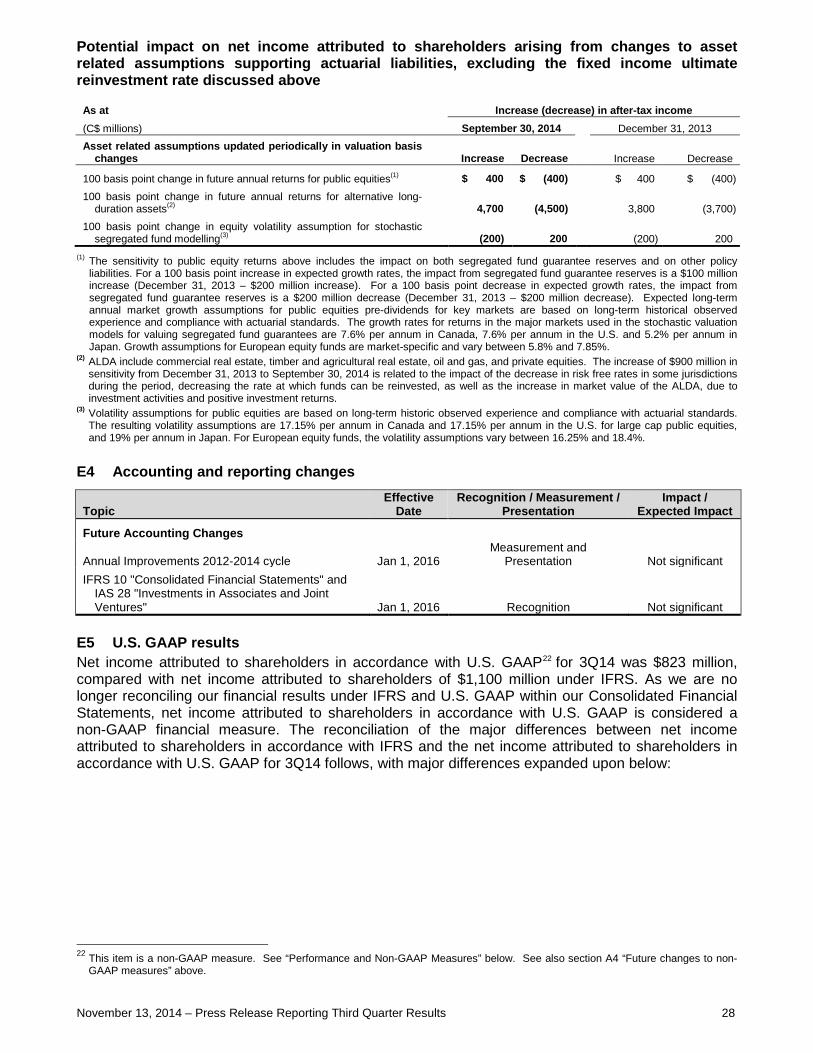
• Strengthened reserves following the annual actuarial review, resulting in a $69 million net charge to net income. Unfavourable changes to lapse assumptions and updates to the calibration criteria for fixed income funds used in the valuation of segregated fund guarantees were partially offset by benefits from updates to mortality assumptions and other annual updates.
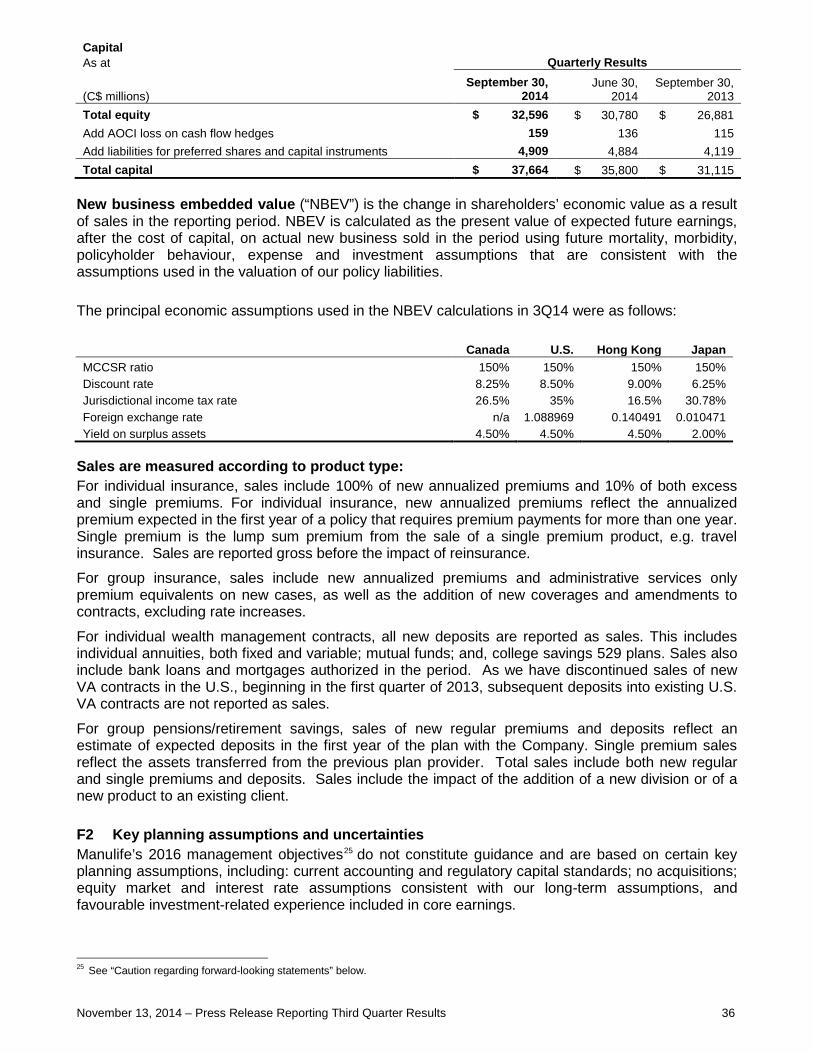
• Generated new business embedded value (“NBEV”)5 of $298 million, up 7% from 3Q13. The increase in NBEV reflects higher sales volumes in Asia, partially offset by the impact of lower interest rates on our insurance businesses.
• Reported $823 million of net income attributed to shareholders in accordance with U.S. GAAP5. As outlined in section A4 below, starting in 4Q14, we are discontinuing use of this U.S. GAAP measure.
4 See section A4 “Future changes to non-GAAP measures” below. 5 This item is a non-GAAP measure. See “Performance and Non-GAAP Measures” below.
November 13, 2014 – Press Release Reporting Third Quarter Results 4
Financial Highlights
(1) This item is a non-GAAP measure. See “Performance and Non-GAAP Measures” below.
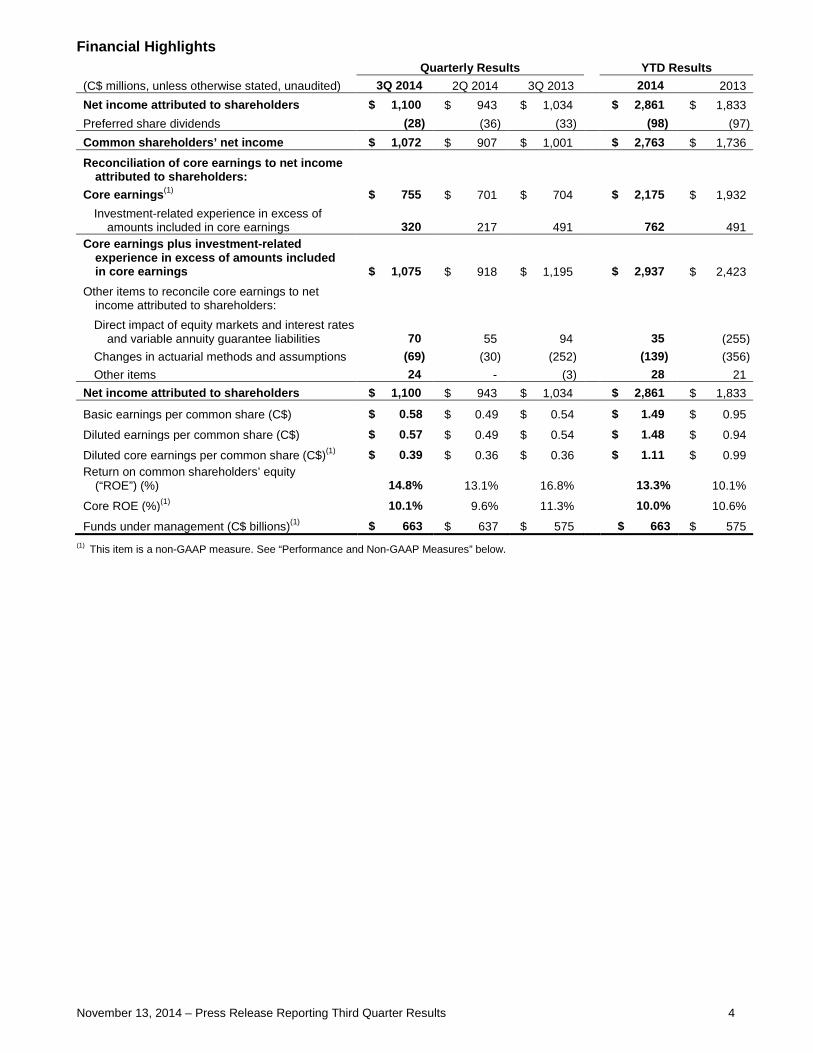
Quarterly Results YTD Results (C$ millions, unless otherwise stated, unaudited) 3Q 2014 2Q 2014 3Q 2013 2014 2013 Net income attributed to shareholders $ 1,100 $ 943 $ 1,034 $ 2,861 $ 1,833 Preferred share dividends (28) (36) (33) (98) (97) Common shareholders’ net income $ 1,072 $ 907 $ 1,001 $ 2,763 $ 1,736
Reconciliation of core earnings to net income attributed to shareholders:
Core earnings(1) $ 755 $ 701 $ 704 $ 2,175 $ 1,932 Investment-related experience in excess of
amounts included in core earnings 320 217 491 762 491 Core earnings plus investment-related
experience in excess of amounts included in core earnings $ 1,075 $ 918 $ 1,195 $ 2,937 $ 2,423
Other items to reconcile core earnings to net income attributed to shareholders: Direct impact of equity markets and interest rates
and variable annuity guarantee liabilities 70 55 94 35 (255) Changes in actuarial methods and assumptions (69) (30) (252) (139) (356) Other items 24 - (3) 28 21
Net income attributed to shareholders $ 1,100 $ 943 $ 1,034 $ 2,861 $ 1,833
Basic earnings per common share (C$) $ 0.58 $ 0.49 $ 0.54 $ 1.49 $ 0.95
Diluted earnings per common share (C$) $ 0.57 $ 0.49 $ 0.54 $ 1.48 $ 0.94
Diluted core earnings per common share (C$)(1) $ 0.39 $ 0.36 $ 0.36 $ 1.11 $ 0.99 Return on common shareholders’ equity
November 13, 2014 – Press Release Reporting Third Quarter Results 5
SALES AND BUSINESS GROWTH
Asia Division Robert Cook, Senior Executive Vice President and General Manager, Asia Division stated, “We have delivered very strong growth in the third quarter with Hong Kong, Indonesia and our other Asia businesses adding to the continued momentum in Japan. Insurance sales were 46% higher than 3Q13, reaching record levels for the division on a constant currency basis. These results reflect the ongoing success of product enhancement initiatives, marketing campaigns and our multi-channel distribution strategy. Our third quarter wealth sales increased 74% compared to 3Q13, reflecting our success in launching new products, marketing campaigns and improved market sentiment.”
Asia Division 3Q14 insurance sales of US$352 million were 46% higher than 3Q13 and year-to-date sales of US$914 million were 32% higher than same period of 2013. (Percentages quoted below are for the period 3Q14 compared with 3Q13, unless stated otherwise.6)
• Japan insurance sales of US$165 million increased 83% driven by the continued momentum of corporate product sales and the launch of new retail products.
• Hong Kong insurance sales of US$81 million increased 37% driven by several product launches in the latter part of 2Q14 and a series of sales campaigns.
• Indonesia insurance sales of US$28 million increased 14% driven by strong growth in our bancassurance channel and a series of sales campaigns.
• Asia Other (excludes Japan, Hong Kong and Indonesia) insurance sales of US$78 million increased 16%. We delivered double digit growth in all markets, except for Singapore, where sales were at a level similar to 3Q13 but showed significant growth over 2Q14.
Asia Division 3Q14 wealth sales of US$2.2 billion were 74% higher than 3Q13 and year-to-date sales of US$5.6 billion were 14% lower than same period of 2013. The decline in our year-to-date sales was due to less favourable market sentiment in several Asian markets in the first half of 2014 compared to the same period of 2013, the very successful launch of the Strategic Income Fund in the first half of 2013 and lower investor demand for our products in Japan. (Percentages quoted below are for the period 3Q14 compared with 3Q13, unless stated otherwise.6)
• Japan wealth sales of US$516 million increased 140% as a result of the successful launch of a floating rate loan fund and the launch of a new single premium product.
• Hong Kong wealth sales of US$366 million increased 50% driven by successful marketing campaigns in the pension and mutual fund businesses.
• Indonesia wealth sales of US$239 million increased 93% reflecting the favourable impact of improved market sentiment on mutual fund sales.
• Asia Other wealth sales of US$1.0 billion increased 57% driven by the increase in mutual fund sales in China, Taiwan and Thailand.
6 Growth (declines) in sales, premiums and deposits and funds under management are stated on a constant currency basis. Constant
currency basis is a non-GAAP measure. See “Performance and Non-GAAP Measures” below.
November 13, 2014 – Press Release Reporting Third Quarter Results 6
Canadian Division Marianne Harrison, Senior Executive Vice President and General Manager, Canadian Division stated, “In the third quarter, our mutual fund and group retirement businesses delivered solid sales and record assets under management. We were excited to announce our agreement to acquire the Canadian operations of Standard Life plc which, if approved, will accelerate our growth plans, particularly in wealth and asset management. With our focus on future innovation, we launched our Manulife RED Lab partnership with Communitech with a contest for Ontario university and college students, inviting their ideas to improve the delivery of financial services through the use of emerging technologies.“ Wealth sales in 3Q14 were $2.6 billion, 15% lower than 3Q13 primarily due to reduced new bank loan volumes as a result of competitive pressures in a slowing residential mortgage market. Year-to-date sales of $8.6 billion were 4% lower than the same period of 2013. (Percentages quoted below are for the period 3Q14 compared with 3Q13, unless stated otherwise.)
• Mutual Funds’ assets under management were a record $31.8 billion at September 30, 2014, increasing 26% year-over-year and outpacing industry growth7. Gross mutual fund deposits8,9 of $1.3 billion in 3Q14 were down 10% as investor preference shifted toward equities where we continue to build our presence. In the quarter we added two global equity mandates to complement our growing suite of equity funds. Increased market volatility in September also put strain on sales.
• Segregated Fund Products10 sales were $353 million in 3Q14, an increase of 13% reflecting steady growth in our repositioned new business portfolio. Fixed Products sales of $72 million in 3Q14 were down 33% reflecting our deliberate rate positioning in this market.
• Group Retirement Solutions sales of $188 million in 3Q14 were 31% lower, reflecting normal variability in the large case group retirement market. Year-to-date, sales of $1.1 billion were 10% higher than the same period of 2013, reflecting continued success in the defined contribution plan market.
• Manulife Bank new lending volumes continue to reflect the impact of intense rate competition driven by the slowdown in the residential mortgage market. New loan volumes for 3Q14 were $927 million, 27% below 3Q13 levels and 3% higher than 2Q14. Net lending assets increased by 4% to $19.4 billion as at September 30, 2014.
Insurance sales in 3Q14 of $143 million were 23% lower than 3Q13 reflecting competitive pressures and our disciplined approach to pricing in the large case group benefits market. Year-to-date sales of $406 million were 58% lower than the same period last year. Excluding Group Benefits, 3Q14 insurance sales were 5% higher than 3Q13 and year-to-date sales were 3% higher than the same period in 2013. (Percentages quoted below are for the period 3Q14 compared with 3Q13, unless stated otherwise.)
• Retail Markets’ insurance sales of $41 million increased 11%, reflecting the success of our new Manulife UL product, a universal life solution for Canadians looking for simplified investment options combined with long-term insurance protection.
• Institutional Markets’ insurance sales of $102 million decreased 32%, reflecting competitive pressures which challenged large case sales in Group Benefits. In the small and mid-sized market, Group Benefits’ sales increased 15%.
U.S. Division
7 Based on publicly available information from Investor Economics and the Investment Funds Institute of Canada as at September 30,
2014. 8 This item is a non-GAAP measure. See “Performance and Non-GAAP Measures” below. 9 Gross mutual fund deposits in 3Q14 included deposits from segregated fund products of $263 million. 10 Segregated fund products include guarantees. These products are also referred to as variable annuities.
November 13, 2014 – Press Release Reporting Third Quarter Results 7
Craig Bromley, Senior Executive Vice President and General Manager, U.S. Division stated, "Sales results for the quarter continued to be mixed but as expected our recent product and business initiatives are gaining traction. In John Hancock Investments, sales were 8% below 3Q13, while retention and net flows were strong, once again contributing to record funds under management. Our strong product line-up, including 39 Four- or Five-Star Morningstar rated mutual funds, continues to drive results in this business11. On the insurance front, product enhancements and targeted pricing changes implemented earlier this year improved John Hancock Life sales compared to 2Q14 despite a sluggish estate planning market.”
Wealth Management sales in 3Q14 of US$6.2 billion decreased 6% compared with 3Q13. Decreased sales in John Hancock Investments (“JH Investments”) were partially offset by an increase in John Hancock Retirement Plan Services (“JH RPS”). Year-to-date sales of US$22.0 billion were 5% higher than in the same period of 2013 as a result of a 7% increase in JH Investments year-to-date sales. (Percentages quoted below are for the period 3Q14 compared with 3Q13, unless stated otherwise.)
• JH Investments 3Q14 sales of US$5.4 billion decreased 8% primarily due to higher mandates from large wirehouse firms in 2013, the impact of the closure to new sales of a top selling fund at the beginning of 2014 and tempered industry sales. On a year-to-date basis, sales continue to outpace the industry in the intermediary channel with an increase of 7% compared to 0.9% for the industry12. Our year-to-date results also continue to outpace the industry on organic growth (net new flows / beginning assets) with a 16% year-to-date growth rate compared to a 2% industry growth rate12.
• JH RPS 3Q14 sales of US$886 million increased 2%. While sales are challenged by a very competitive environment, we are beginning to see momentum and an increased sales pipeline from initiatives launched earlier this year. This includes the Signature 2.0 product within our core market of plans under US$10 million in assets under management, as well as increased distribution capabilities and pricing actions for plans with assets over US$10 million.
Overall U.S. Insurance sales in 3Q14 of US$124 million decreased 19% compared with 3Q13, but were 8% higher compared with 2Q14 due to new product enhancements. Year-to-date sales of US$347 million were 19% lower than same period of 2013. (Percentages quoted below are for the period 3Q14 compared with 3Q13, unless stated otherwise.)
• John Hancock Life (“JH Life”) 3Q14 sales of US$112 million were 19% lower as overall industry sales were challenged in the estate planning market. Compared with 2Q14, sales increased by 10% driven by changes to our Protection Universal Life (“UL”) product and accumulation and indexed UL products.
• John Hancock Long-Term Care 3Q14 sales of US$12 million decreased, as expected, due to recent price increases. Sales were down by US$3 million from 3Q13 and US$1 million from 2Q14.
11 For each fund with at least a 3-year history, Morningstar calculates a Morningstar Rating based on a Morningstar Risk-Adjusted Return
that accounts for variation in a fund’s monthly performance (including effects of sales charges, loads and redemption fees), placing more emphasis on downward variations and rewarding consistent performance. The top 10% of funds in each category, the next 22.5%, 35%, 22.5% and bottom 10% receive 5, 4, 3, 2 or 1 star, respectively. The Overall Morningstar Rating for a fund is derived from a weighted average of the performance associated with its 3-, 5- and 10 year (if applicable) Morningstar Rating metrics. Past performance is no guarantee of future results. The overall rating includes the effects of sales charges, loads and redemption fees, while the load-waived does not. Load-waived rating for Class A shares should only be considered by investors who are not subject to a front-end sales charge.
12 Source: Strategic Insight: ICI Confidential. Direct Sold mutual funds, fund-of-funds and ETF’s are excluded. Organic sales growth rate is calculated as: net new flows divided by beginning period assets. Industry data through September 2014.
November 13, 2014 – Press Release Reporting Third Quarter Results 8
Investment Division Warren Thomson, Senior Executive Vice President and Chief Investment Officer, said, “We experienced exceptional General Fund investment-related results, driven primarily by large positive returns on our private equity and other alternative long-duration asset holdings and the favourable impact of additional investments in real estate, private equity and timberland on the measurement of our policy liabilities. In addition, credit experience continued to be a positive contributor to investment-related experience."
Mr. Thomson continued, “Long-term investment performance continues to be a differentiator for Manulife Asset Management, with the significant majority of public asset classes once again outperforming their benchmarks on a 1, 3, and 5-year basis.”
At September 30, 2014 total assets managed by Manulife Asset Management ("MAM") were $309 billion, including $266 billion managed for external clients. Assets managed for external clients increased $7 billion from June 30, 2014. At September 30, 2014, MAM had a total of 85 Four- or Five-Star Morningstar rated funds, an increase of 3 funds since June 30, 2014.
CORPORATE ITEMS In a separate news release today, MFC announced that the Board of Directors approved a quarterly dividend of 15.5 cents per share on the common shares of MFC, payable on and after December 19, 2014 to shareholders of record at the close of business on November 25, 2014.
The Board of Directors also approved, in respect of MFC’s December 19, 2014 common share dividend payment date and pursuant to MFC’s Canadian Dividend Reinvestment and Share Purchase Plan and its U.S. Dividend Reinvestment and Share Purchase Plan, that the required common shares be purchased on the open market. The purchase price of such shares will be based on the average of the actual cost to purchase such common shares. There are no applicable discounts because the common shares are being purchased on the open market and are not being issued from treasury.
AWARDS & RECOGNITION In the U.S., John Hancock received the 2014 LIMRA LOMA “Social Media Silver Bowl Awards” for “Best use of Twitter” for the #WeRunTogether social-media campaign in support of John Hancock’s Boston marathon sponsorship and “Best of the Best” for the overall John Hancock social media program (Facebook, Twitter, LinkedIn and YouTube). In Hong Kong, Manulife Hong Kong received the “Yahoo! Emotive Brand Award” for the 11th consecutive year. The award aims to recognize the most emotionally appealing brands in the territory, as selected through online public voting.
In Hong Kong, Indonesia and the Philippines, Manulife Asset Management portfolio managers were recognized in The Asset Benchmark Research 2014 (“The Asset”) as “Most Astute Investors in Local Currency Bonds”. This is the 8th year that Manulife Asset Management’s portfolio managers have been ranked at the top of The Asset’s survey. In Canada, Manulife was named to the 2014/2015 “Dow Jones Sustainability North American Index”. This recognition highlights Manulife’s continued commitment to ethical and sustainable business practices, good governance and making positive contributions to the communities it serves. Notes: Manulife Financial Corporation will host a Third Quarter Earnings Results Conference Call at 2:00 p.m. ET on November 13, 2014. For local and international locations, please call 416-340-8530 and toll free in North America please call 1-800-769-8320. Please call in ten minutes before the call starts. You will be required to provide your name and organization to the operator. A replay of this call will be available by 6:00 p.m. ET on November 13, 2014 through November 27, 2014 by calling 905-694-9451 or 1-800-408-3053 (passcode: 6718073).
November 13, 2014 – Press Release Reporting Third Quarter Results 9
The conference call will also be webcast through Manulife Financial’s website at 2:00 p.m. ET on November 13, 2014. You may access the webcast at: www.manulife.com/quarterlyreports. An archived version of the webcast will be available at 4:30 p.m. ET on the website at the same URL as above.
The Third Quarter 2014 Statistical Information Package will also be available on the Manulife Financial website at: www.manulife.com/quarterlyreports. The document may be downloaded before the webcast begins. Media inquiries: Sean B. Pasternak (416) 852-2745 [email protected]
November 13, 2014 – Press Release Reporting Third Quarter Results 10
MANAGEMENT’S DISCUSSION AND ANALYSIS This Management’s Discussion and Analysis (“MD&A”) is current as of November 13, 2014, unless otherwise noted. This MD&A should be read in conjunction with the MD&A and audited Consolidated Financial Statements contained in our 2013 Annual Report.
For further information relating to our risk management practices and risk factors affecting the Company, see “Risk Factors” in our most recent Annual Information Form, “Risk Management and Risk Factors” and “Critical Accounting and Actuarial Policies” in the MD&A in our 2013 Annual Report, and the “Risk Management” note to the Consolidated Financial Statements in our 2013 Annual Report.
In this MD&A, the terms “Company”, “Manulife Financial”, “Manulife” and “we” mean Manulife Financial Corporation (“MFC”) and its subsidiaries.
Contents
A OVERVIEW D RISK MANAGEMENT AND RISK FACTORS UPDATE 1. Q3 highlights 1. Variable annuity and segregated fund guarantees
2. Standard Life transaction 2. Caution related to sensitivities
B FINANCIAL HIGHLIGHTS E ACCOUNTING MATTERS AND CONTROLS 1. Q3 and year-to-date earnings analysis 1. Critical accounting and actuarial policies 2. Premiums and deposits 2. Actuarial methods and assumptions
3. Funds under management 3. Sensitivity of policy liabilities to updates to assumptions
4. Capital 4. Accounting and reporting changes
5. Impact of fair value accounting 5. U.S. GAAP results
C PERFORMANCE BY DIVISION F OTHER
1. Asia 1. Performance and Non-GAAP Measures
2. Canadian 2. Key planning assumptions and uncertainties
3. U.S. 3. Caution regarding forward-looking statements
4. Corporate and Other
A OVERVIEW A1 Q3 highlights Manulife reported 3Q14 net income attributed to shareholders of $1,100 million and core earnings13 of $755 million compared with 3Q13 net income attributed to shareholders of $1,034 million and core earnings of $704 million.
Results included investment-related experience gains of $370 million (of which $50 million is included in core earnings), and a net charge of $69 million related to our annual review of actuarial methods and assumptions and updates to actuarial standards related to bond parameter calibration for stochastic models used to value segregated fund liabilities.
The $51 million increase in core earnings was driven by higher fee income on higher assets under management in our wealth businesses, lower net hedging costs, and the favourable impact of a
13 This item is a non-GAAP measure. See “Performance and Non-GAAP Measures” below.
November 13, 2014 – Press Release Reporting Third Quarter Results 11
stronger U.S. dollar, partially offset by the non-recurrence in 3Q14 of a release of tax provisions from the closure of prior years’ tax filings that benefited 3Q13. The $15 million net increase in items excluded from core earnings included lower charges related to the changes in actuarial methods and assumptions mostly offset by the non-recurrence of a gain related to a specific asset allocation activity in 3Q13.
Net income attributed to shareholders for the 9 months ended September 30, 2014 was $2,861 million, compared with the $1,833 million for the same period of 2013. Four items primarily contributed to the $1,028 million increase: higher core earnings ($243 million), higher investment-related experience ($271 million), a lower charge for changes in actuarial methods and assumptions ($217 million) and the non-recurrence of a charge related to the direct impact of equity markets and interest rates ($255 million).
The Minimum Continuing Capital and Surplus Requirements (“MCCSR”) ratio for The Manufacturers Life Insurance Company (“MLI”) increased 5 points from June 30, 2014 to 248% reflecting the contribution of 3Q14 earnings. As a result of strong 3Q14 earnings and the favourable impact of a stronger U.S. dollar, the Company’s financial leverage ratio improved from 28.2% at 2Q14 to 27.1%.
Insurance sales14 were $660 million in 3Q14, an increase of 7%15 compared with 3Q13 as strong results in Asia were partially offset by mixed results in Canada and the U.S. In Asia, sales rose 46% as increased sales in Hong Kong, Indonesia and Asia Other businesses added to the continued momentum in Japan. Institutional insurance sales in Canada decreased 32%, reflecting competitive pressures, and Retail sales increased 11%, reflecting the success of a recently launched universal life product. U.S. insurance sales in 3Q14, while 19% lower compared with 3Q13, were 8% higher compared with 2Q14 due to new product enhancements. On a year-to-date basis, insurance sales were 19% below the same period of 2013 as the 32% increase in sales in Asia was more than offset by lower sales in Group Benefits and U.S. Insurance.
Wealth sales were $11.7 billion in 3Q14, an increase of 1% compared with 3Q13. In Asia, wealth sales increased 74% reflecting our success in launching new products in combination with marketing campaigns and improved market sentiment. Sales were 15% lower in Canada primarily due to the impact of competitive pressures in a slowing residential mortgage market on new bank loan volumes (which we include in wealth sales) and normal variability in large case group retirement sales. In the U.S., sales were 6% below 3Q13, while retention and net flows were strong. On a year-to-date basis, wealth sales were 1% below the same period of 2013 due to lower new bank loan volumes.
A2 Agreement regarding acquisition of Canadian-based operations of Standard Life plc On September 3, 2014, MLI entered into an agreement with Standard Life Oversea Holdings Limited, a subsidiary of Standard Life plc, and Standard Life plc to acquire the shares of Standard Life Financial Inc. and of Standard Life Investments Inc., collectively the Canadian-based operations of Standard Life plc, for approximately $4 billion in cash at closing, subject to certain adjustments.
The transaction was approved by the shareholders of Standard Life plc on October 3, 2014. The waiting period under the Competition Act (Canada) expired on November 10, 2014. The closing remains subject to the approval of the Canadian Minister of Finance and certain securities regulators. Subject to the receipt of all necessary approvals, the transaction is anticipated to close in the first quarter of 2015.
The acquisition will be funded in part by the issuance of common shares. On September 15, 2014, we completed offerings of approximately $2.26 billion of subscription receipts that will be exchanged for common shares upon closing of the acquisition. The subscription receipt offerings comprised an approximately $1.76 billion public bought deal offering, as well as a concurrent private placement to
14 This item is a non-GAAP measure. See “Performance and Non-GAAP Measures” below. 15 Growth (declines) in sales, premiums and deposits and funds under management are stated on a constant currency basis. Constant
currency basis is a non-GAAP measure. See “Performance and Non-GAAP Measures” below.
November 13, 2014 – Press Release Reporting Third Quarter Results 12
the Caisse de dépôt et placement du Québec for $500 million. The balance of the acquisition funding will be from internal resources and possible future debt and/or preferred share issuances.
This transaction significantly builds the Company’s capability to serve customers in all of Canada, and elsewhere in the world, from Quebec. Based on industry data from the Fraser Group and the Investment Funds Institute of Canada, on a pro forma basis as of December 31, 2013 after giving effect to the transaction, the transaction would add $19.0 billion in assets under administration16 to our group retirement business in Canada, bringing our total group retirement assets under administration as of December 31, 2013 to $40.9 billion16, and would add $5.4 billion in assets under management16 to our mutual funds business in Canada, bringing our total mutual fund assets under management to $33.0 billion as of December 31, 201317. The transaction would, based on information from the Fraser Group, also increase our annual Canadian group benefits premiums and deposits18 from $7.5 billion to $8.3 billion on a pro forma basis for the year ended December 31, 2013 after giving effect to the transaction.18
Transaction highlights19: • Excluding transition and integration costs, after the first year we expect the transaction to be
accretive by approximately 3 cents to earnings per common share (“EPS”) per year over each of the next 3 years. It will also increase our earnings capacity beyond our 2016 core earnings objective of $4 billion.
• The transaction, and the financing, maintain our strong capital position and financial flexibility, and in no way inhibit our ability to pay dividends. In fact, it will enhance our ability to increase dividends in the future.
• We believe the transaction will improve core earnings, however the transition costs reported in core earnings will create a modest, temporary headwind on our core return on common shareholders’ equity (“Core ROE”) objective of 13%.
• Excluding transition and integration costs, the transaction is expected to be marginally accretive to EPS in the 1st year.
• Increases earnings contributions from less capital intensive, fee-based businesses. • Integration costs totaling $150 million post-tax expected to be incurred in the first three years and
we expect revenue synergies which will build over time. • Annual cost savings of $100 million post-tax expected to be largely achieved by the 3rd year. • Targeting MCCSR ratio in the range of 235% to 240% at close. • Targeting financial leverage ratio of approximately 28% at close. • We continue to target a 25% financial leverage ratio over the long-term. • Does not significantly impact our interest rate or equity market risk profile.
A3 Q4 items In the fourth quarter, the Canadian Actuarial Standards Board’s (“ASB”) revisions to the Canadian Actuarial Standards of Practice, issued in May 2014 and related to economic reinvestment assumptions used in the valuation of policy liabilities, will become effective. As noted previously, we estimate that the impact of these revisions will be a charge to net income of up to $200 million.
A4 Future changes to non-GAAP measures Core earnings is a non-GAAP measure which we use to better understand the long-term earnings capacity and valuation of the business. It excludes the direct impact of changes in equity markets and interest rates as well as a number of other items that are considered material and exceptional in nature. Since we introduced this measure in 2012, we have included up to $200 million of favourable 16 Source: Fraser Group, “Pension Universe Report”, data as of December 31, 2013, includes capital accumulation plans only. 17 Source: Investment Funds Institute of Canada, data as of December 31, 2013. 18 Source: Fraser Group, “Group Universe Report”, data for the year ended December 31, 2013. 19 See “Caution regarding forward-looking statements” and “Performance and Non-GAAP Measures” below.
November 13, 2014 – Press Release Reporting Third Quarter Results 13
investment-related experience in core earnings per year. Recent investment–related experience has trended higher than the amount currently included in core earnings and, accordingly, we intend to increase the maximum annual amount included in core earnings to $400 million per year beginning in 2015. Net income attributed to shareholders in accordance with U.S. GAAP and Total equity in accordance with U.S. GAAP – This is the last quarter we will be disclosing U.S. GAAP measures. In the past, we elected to report consolidated U.S. GAAP information because of our large U.S. domiciled investor base and for comparison purposes with our U.S. peers. In the aftermath of the financial crisis, presenting U.S. GAAP measures highlighted the significant impact of fair value accounting on our financial statements under International Financial Reporting Standards (“IFRS”). In 2012, we introduced a core earnings metric which also highlights such impact. This metric has gained acceptance with our stakeholders and, therefore, we will discontinue the use of consolidated U.S. GAAP information starting in 4Q14.
November 13, 2014 – Press Release Reporting Third Quarter Results 14
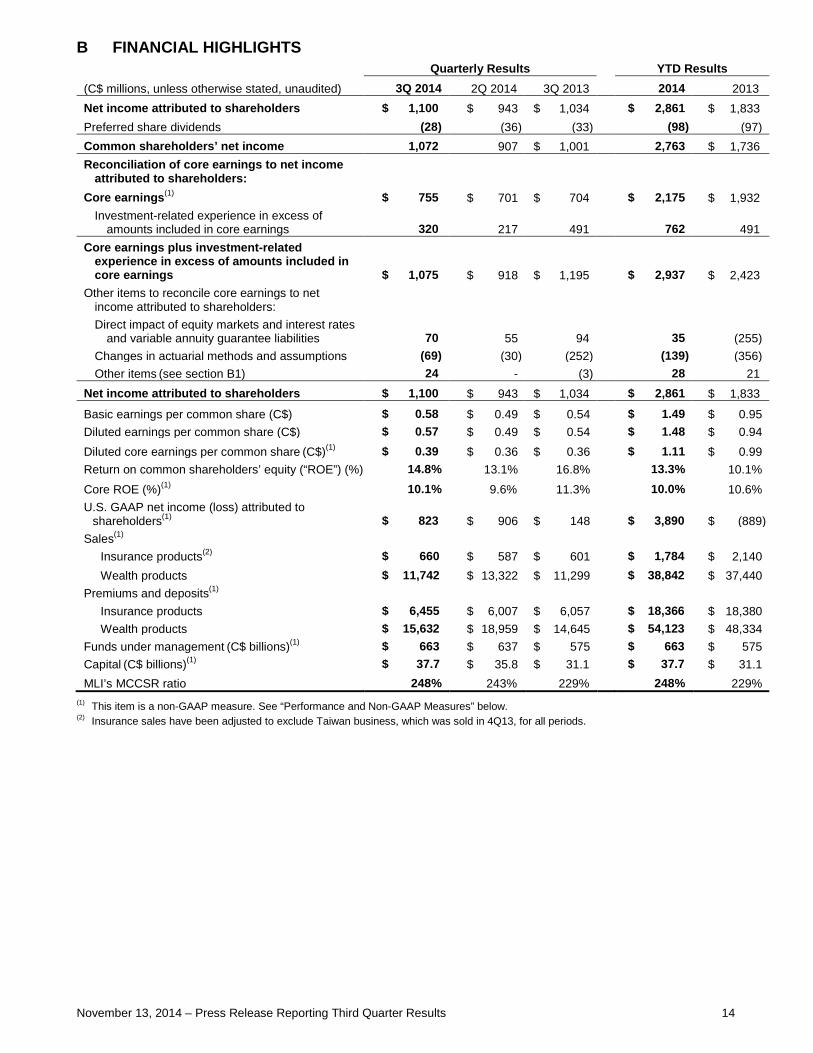
B FINANCIAL HIGHLIGHTS Quarterly Results YTD Results (C$ millions, unless otherwise stated, unaudited) 3Q 2014 2Q 2014 3Q 2013 2014 2013 Net income attributed to shareholders $ 1,100 $ 943 $ 1,034 $ 2,861 $ 1,833 Preferred share dividends (28) (36) (33) (98) (97) Common shareholders’ net income 1,072 907 $ 1,001 2,763 $ 1,736 Reconciliation of core earnings to net income
(1) This item is a non-GAAP measure. See “Performance and Non-GAAP Measures” below. (2) Insurance sales have been adjusted to exclude Taiwan business, which was sold in 4Q13, for all periods.
November 13, 2014 – Press Release Reporting Third Quarter Results 15
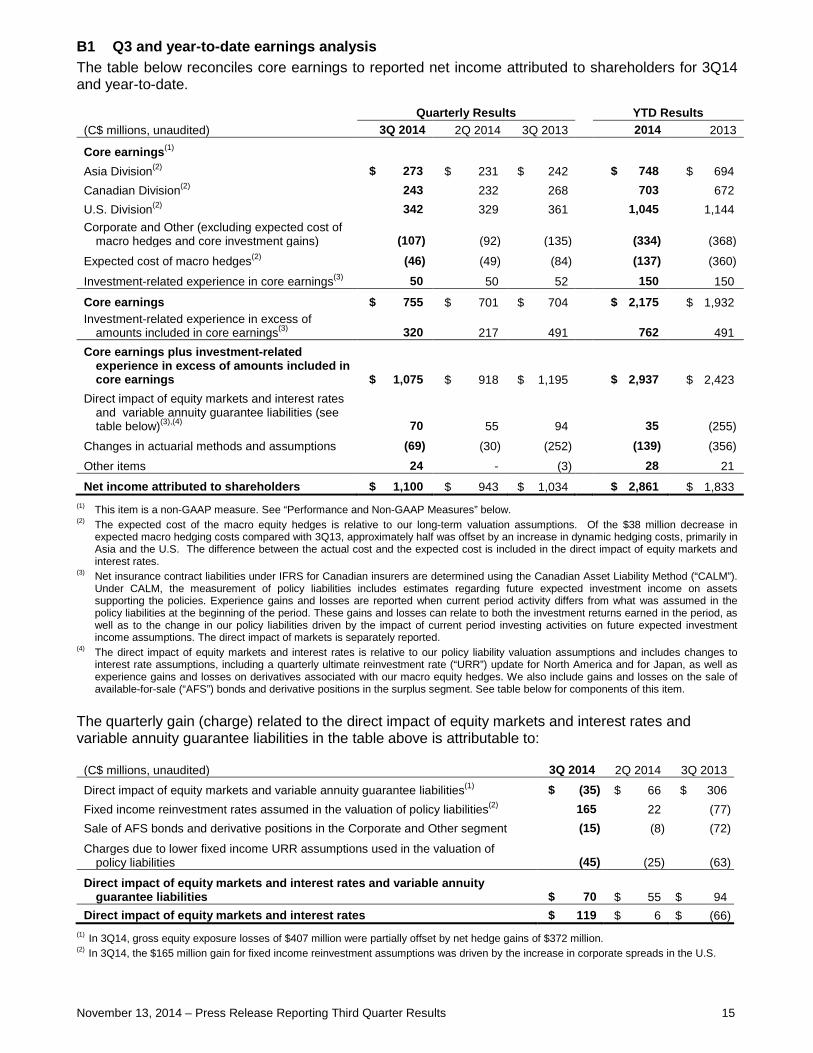
B1 Q3 and year-to-date earnings analysis The table below reconciles core earnings to reported net income attributed to shareholders for 3Q14 and year-to-date.
(1) This item is a non-GAAP measure. See “Performance and Non-GAAP Measures” below. (2) The expected cost of the macro equity hedges is relative to our long-term valuation assumptions. Of the $38 million decrease in
expected macro hedging costs compared with 3Q13, approximately half was offset by an increase in dynamic hedging costs, primarily in Asia and the U.S. The difference between the actual cost and the expected cost is included in the direct impact of equity markets and interest rates.
(3) Net insurance contract liabilities under IFRS for Canadian insurers are determined using the Canadian Asset Liability Method (“CALM”). Under CALM, the measurement of policy liabilities includes estimates regarding future expected investment income on assets supporting the policies. Experience gains and losses are reported when current period activity differs from what was assumed in the policy liabilities at the beginning of the period. These gains and losses can relate to both the investment returns earned in the period, as well as to the change in our policy liabilities driven by the impact of current period investing activities on future expected investment income assumptions. The direct impact of markets is separately reported.
(4) The direct impact of equity markets and interest rates is relative to our policy liability valuation assumptions and includes changes to interest rate assumptions, including a quarterly ultimate reinvestment rate (“URR”) update for North America and for Japan, as well as experience gains and losses on derivatives associated with our macro equity hedges. We also include gains and losses on the sale of available-for-sale (“AFS”) bonds and derivative positions in the surplus segment. See table below for components of this item.
The quarterly gain (charge) related to the direct impact of equity markets and interest rates and variable annuity guarantee liabilities in the table above is attributable to:
(1) In 3Q14, gross equity exposure losses of $407 million were partially offset by net hedge gains of $372 million. (2) In 3Q14, the $165 million gain for fixed income reinvestment assumptions was driven by the increase in corporate spreads in the U.S.
Asia Division(2) $ 273 $ 231 $ 242 $ 748 $ 694 Canadian Division(2) 243 232 268 703 672 U.S. Division(2) 342 329 361 1,045 1,144 Corporate and Other (excluding expected cost of
macro hedges and core investment gains) (107) (92) (135)
(334) (368)
Expected cost of macro hedges(2) (46) (49) (84) (137) (360)
Investment-related experience in core earnings(3) 50 50 52 150 150
Core earnings $ 755 $ 701 $ 704 $ 2,175 $ 1,932 Investment-related experience in excess of
amounts included in core earnings(3) 320 217 491
762 491 Core earnings plus investment-related
experience in excess of amounts included in core earnings $ 1,075 $ 918 $ 1,195
$ 2,937 $ 2,423 Direct impact of equity markets and interest rates
and variable annuity guarantee liabilities (see table below)(3),(4) 70 55 94
35 (255)
Changes in actuarial methods and assumptions (69) (30) (252) (139) (356)
Other items 24 - (3) 28 21
Net income attributed to shareholders $ 1,100 $ 943 $ 1,034 $ 2,861 $ 1,833
(C$ millions, unaudited) 3Q 2014 2Q 2014 3Q 2013
Direct impact of equity markets and variable annuity guarantee liabilities(1) $ (35) $ 66 $ 306 Fixed income reinvestment rates assumed in the valuation of policy liabilities(2) 165 22 (77) Sale of AFS bonds and derivative positions in the Corporate and Other segment (15) (8) (72)
Charges due to lower fixed income URR assumptions used in the valuation of policy liabilities (45) (25) (63)
Direct impact of equity markets and interest rates and variable annuity guarantee liabilities $ 70 $ 55 $ 94
Direct impact of equity markets and interest rates $ 119 $ 6 $ (66)
November 13, 2014 – Press Release Reporting Third Quarter Results 16
B2 Premiums and deposits20 Premiums and deposits for insurance products were $6.5 billion in 3Q14, an increase of 4% on a constant currency basis from 3Q13. Strong sales in Asia and business growth in Canada were partially offset by the slowdown in the U.S. estate planning market.
Premiums and deposits for wealth products were $15.6 billion in 3Q14, an increase of $1 billion or 3% on a constant currency basis, compared with 3Q13. Premiums and deposits increased 70% in Asia and were partially offset by a decline of 2% in Canada and 5% in the U.S.
B3 Funds under management20 Funds under management as at September 30, 2014 were a record $663 billion, an increase of $88 billion from September 30, 2013. The increase was due to positive net flows in North American mutual fund businesses and increases in equity markets.
B4 Capital20
MFC’s total capital as at September 30, 2014 was $37.7 billion, an increase of $1.9 billion from June 30, 2014 and an increase of $6.6 billion from September 30, 2013.
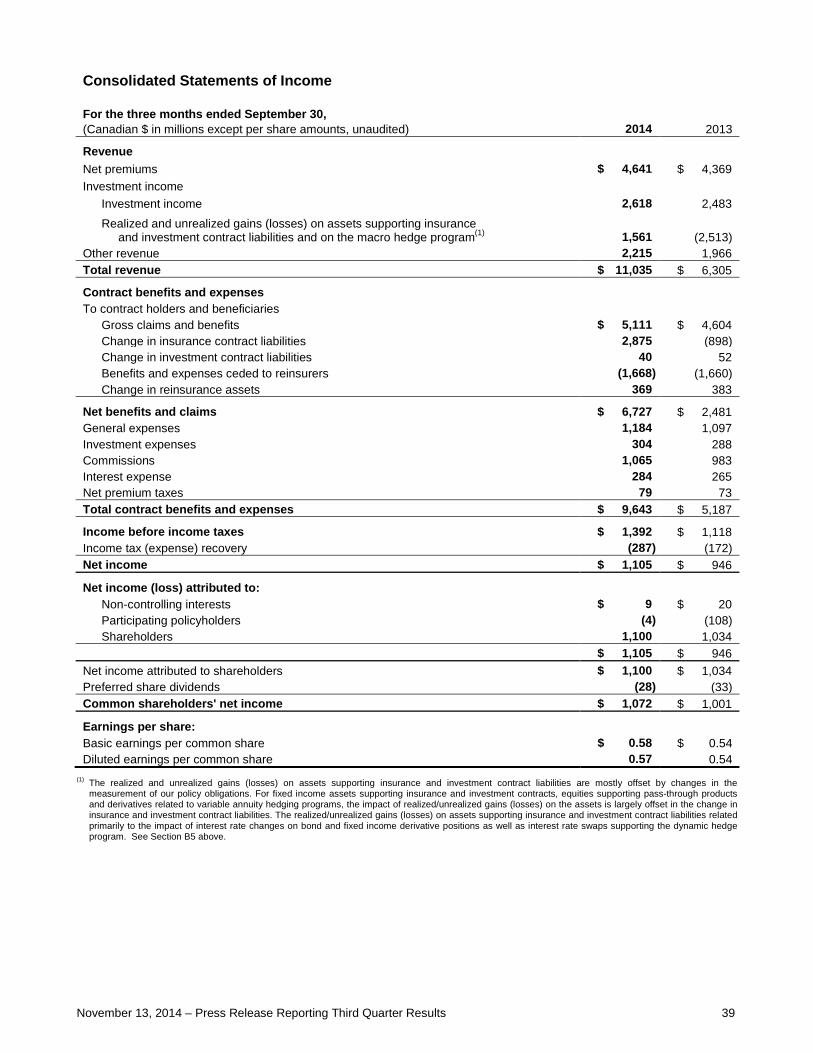
B5 Impact of fair value accounting Fair value accounting policies affect the measurement of both our assets and our liabilities. The impact on the measurement of both assets and liabilities of investment activities and market movements are reported as experience gains (losses) on investments, the direct impact of equity markets and interest rates and variable annuity guarantee liabilities, each of which impacts net income (see section A1 above for discussion of third quarter experience).
Net realized and unrealized gains reported in investment income were $1.6 billion for 3Q14. This amount was primarily driven by the mark-to-market impact of the decrease in interest rates on our bond and fixed income derivative holdings.
As outlined in the “Critical Accounting and Actuarial Policies” in the MD&A in the 2013 Annual Report, net insurance contract liabilities under IFRS are determined using CALM, as required by the Canadian Institute of Actuaries. The measurement of policy liabilities includes the estimated value of future policyholder benefits and settlement obligations to be paid over the term remaining on in-force policies, including the costs of servicing the policies, reduced by the future expected policy revenues and future expected investment income on assets supporting the policies. Investment returns are projected using the current asset portfolios and projected reinvestment strategies. Experience gains and losses are reported when current period activity differs from what was assumed in the policy liabilities at the beginning of the period. We classify gains and losses by assumption type. For example, current period investing activities that increase (decrease) the future expected investment income on assets supporting the policies will result in an investment-related experience gain (loss).
20 This item is a non-GAAP measure. See “Performance and Non-GAAP Measures” below.
November 13, 2014 – Press Release Reporting Third Quarter Results 17
C PERFORMANCE BY DIVISION C1 Asia Division
($ millions, unless otherwise stated) Quarterly Results YTD Results Canadian dollars 3Q 2014 2Q 2014 3Q 2013 3Q 2014 3Q 2013 Net income attributed to shareholders $ 332 $ 337 $ 480 $ 911 $ 1,794 Core earnings(1) 273 231 242 748 694 Premiums and deposits 4,691 4,150 3,218 12,641 12,824 Funds under management (billions) 84.5 81.4 80.1 84.5 80.1
U.S. dollars Net income attributed to shareholders $ 305 $ 308 $ 463 $ 832 $ 1,761 Core earnings 251 212 233 684 677 Premiums and deposits 4,308 3,806 3,099 11,558 12,553 Funds under management (billions) 75.4 76.2 77.9 75.4 77.9
(1) See “Performance and Non-GAAP Measures” for a reconciliation between IFRS net income attributed to shareholders and core earnings.
Asia Division reported 3Q14 net income attributed to shareholders of US$305 million and core earnings of US$251 million compared with 3Q13 net income attributed to shareholders of US$463 million and core earnings of US$233 million. The decline in net income attributed to shareholders of US$158 million was driven by the direct impact of equity markets on variable annuity guarantee liabilities not dynamically hedged.
Core earnings increased US$41 million, or 17%, compared to 3Q13 after adjusting for the increased dynamic hedging costs (there is a corresponding decrease in macro hedging costs in the Corporate and Other segment), the impact of changes in currency rates and the sale of our Taiwan insurance business in 4Q13. The growth in core earnings was driven by higher sales volumes and margins, higher fee income on higher assets under management and favourable policyholder experience.
Year-to-date net income attributed to shareholders was US$832 million in 2014 compared with US$1,761 million for the same period of 2013. The decline of US$929 million was primarily due to the benefit of US$1,062 million in 2013 related to the direct impact of equity markets on variable annuity guarantee liabilities not dynamically hedged. Year-to-date core earnings in 2014 increased US$101 million, an increase of 15% after adjusting for the same items as in the paragraph above, reflecting strong new business and stable in-force growth, improved new business margins following pricing actions in 2013 and favourable policyholder experience.
Premiums and deposits in 3Q14 were US$4.3 billion, an increase of 42% on a constant currency basis compared with 3Q13. Premiums and deposits for insurance products were US$1.7 billion, an increase of 16% compared with 3Q13 (adjusted to exclude the Taiwan Insurance business sold in 4Q13), driven by strong corporate product sales in Japan and in-force business growth in Hong Kong, Japan, Indonesia and China. Wealth management premiums and deposits of US$2.6 billion increased by 70% compared with 3Q13 reflecting improved market sentiment, higher Hong Kong pension deposits, as well as new product and fund launches in Japan and China.
Funds under management as at September 30, 2014 were US$75.4 billion, an increase of 1% on a constant currency basis compared with September 30, 2013. Net policyholder cash inflows of US$2.2 billion and favourable market returns in the past 12 months were largely offset by the US$2 billion impact from the sale of our Taiwan insurance business as well as unfavorable currency movements.
November 13, 2014 – Press Release Reporting Third Quarter Results 18
C2 Canadian Division
($ millions, unless otherwise stated) Quarterly Results YTD Results Canadian dollars 3Q 2014 2Q 2014 3Q 2013 3Q 2014 3Q 2013 Net income (loss) attributed to
(1) See “Performance and Non-GAAP Measures” for a reconciliation between IFRS net income attributed to shareholders and core earnings.
Canadian Division reported 3Q14 net income attributed to shareholders of $286 million and core earnings of $243 million compared with 3Q13 net income attributed to shareholders of $414 million and core earnings of $268 million. The decrease in net income was primarily attributable to a $130 million decline in market and investment-related experience. Increases in core earnings were driven by in-force business growth, including higher fee income from our growing wealth management businesses, were more than offset by lower new business margins and the non-recurrence in 3Q14 of a release of tax provisions from the closure of prior years’ tax filings that benefited 3Q13.
Year-to-date net income attributed to shareholders was $930 million compared with $455 million for the same period of 2013. The increase of $475 million primarily relates to the combination of favourable investment-related experience for the first 9 months of 2014 and higher charges related to the direct impact of equity markets and interest rates for the corresponding period of 2013. Year-to-date core earnings of $703 million were $31 million higher than the first 9 months of 2013 reflecting business growth and improved claims experience partly offset by the release of tax provisions in 2013 noted above.
Premiums and deposits in 3Q14 were $5.1 billion, 4% higher than 3Q13, reflecting volatility in insurance single premiums.
Funds under management were a record $156.0 billion as at September 30, 2014, an increase of 12% from September 30, 2013 driven by business growth and the favourable impact of equity market appreciation and lower interest rates.
November 13, 2014 – Press Release Reporting Third Quarter Results 19
C3 U.S. Division
($ millions, unless otherwise stated) Quarterly Results YTD Results Canadian dollars 3Q 2014 2Q 2014 3Q 2013 3Q 2014 3Q 2013 Net income attributed to shareholders $ 679 $ 559 $ 928 $ 1,641 $ 2,083 Core earnings(1) 342 329 361 1,045 1,144 Premiums and deposits 11,342 12,947 11,473 37,688 34,911 Funds under management (billions) 376.9 360.5 319.9 376.9 319.9 U.S. dollars Net income attributed to shareholders $ 623 $ 513 $ 894 $ 1,502 $ 2,033 Core earnings 314 302 348 955 1,120 Premiums and deposits 10,415 11,873 11,046 34,434 34,125 Funds under management (billions) 336.3 337.7 311.0 336.3 311.0
(1) See “Performance and Non-GAAP Measures” for a reconciliation between IFRS net income attributed to shareholders and core loss.
U.S. Division reported 3Q14 net income attributed to shareholders of US$623 million and core earnings of US$314 million compared with 3Q13 net income attributed to shareholders of US$894 million and core earnings of US$348 million. The majority of the decrease in net income relates to a gain in 3Q13 from a specific asset allocation activity. The US$34 million decrease in core earnings was driven by unfavourable policyholder experience primarily in JH Life, compared with favourable experience in 3Q13, and increased dynamic hedging costs for which there is a corresponding decrease in macro hedging costs in the Corporate and Other segment. In addition, the impact of higher equity markets and risk management activities leading to lower releases of provisions for adverse deviation on variable annuity business and lower new business gains in the Insurance business contributed to the decrease. Partially offsetting these items were higher wealth management fee income due to higher asset levels and lower amortization of deferred acquisition costs due to the on-going run-off of variable annuity business.
Year-to-date net income attributed to shareholders was US$1,502 million in 2014 compared with US$2,033 million for the same period in 2013. Year-to-date core earnings of US$955 million in 2014 were US$165 million lower than the first 9 months of 2013. In addition to the items above, we reported unfavourable claims experience in 1Q14, more favourable tax related items in 2013 and less favourable market and investment-related experience in 2014.
Premiums and deposits for 3Q14 were US$10.4 billion, a decrease of 6% compared with 3Q13. The decrease was driven by lower sales of mutual funds, lower annuity deposits, and lower life insurance premiums consistent with dampened sales partially offset by higher sales of 401(k) plans.
Funds under management as at September 30, 2014 were US$336.3 billion, up 8% from September 30, 2013 levels. The increase was due to positive investment returns and strong net mutual fund sales partially offset by surrender and benefit payments in John Hancock Annuities.
November 13, 2014 – Press Release Reporting Third Quarter Results 20
C4 Corporate and Other
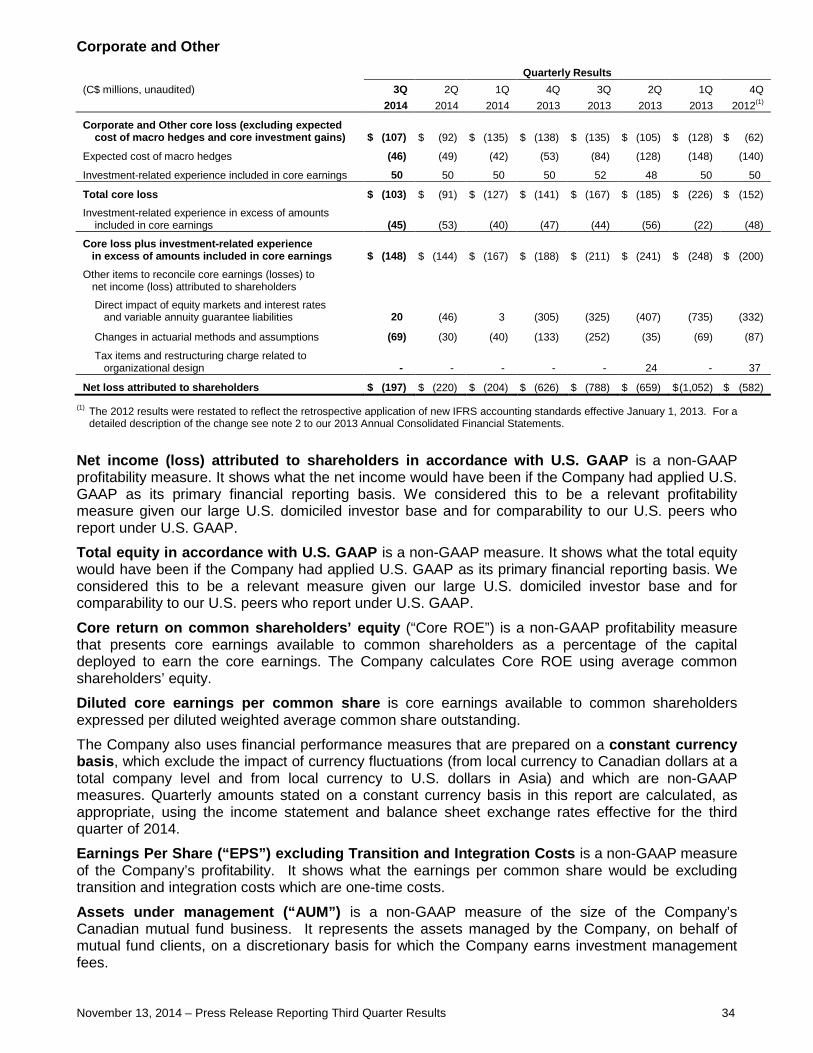
($ millions, unless otherwise stated) Quarterly Results YTD Results Canadian dollars 3Q 2014 2Q 2014 3Q 2013 3Q 2014 3Q 2013 Net loss attributed to shareholders $ (197) $ (220) $ (788) $ (621) $ (2,499) Core loss (excl. macro hedges and core
150 150 Total core loss $ (103) $ (91) $ (167) $ (321) $ (578) Premiums and deposits $ 981 $ 2,800 $ 1,110 $ 5,968 $ 3,082 Funds under management (billions) 45.1 42.0 35.8 45.1 35.8
(1) See “Performance and Non-GAAP Measures” for a reconciliation between IFRS net income attributed to shareholders and core earnings.
Corporate and Other is composed of: Investment performance on assets backing capital, net of amounts allocated to operating divisions and financing costs; Investment Division’s external asset management business; Property and Casualty (“P&C”) Reinsurance business; as well as run-off reinsurance operations including variable annuities and accident and health.
For segment reporting purposes, the impact of updates to actuarial assumptions, settlement costs for macro equity hedges and other non-operating items are included in this segment’s earnings.
Corporate and Other reported a net loss attributed to shareholders of $197 million for 3Q14 compared to a net loss of $788 million for 3Q13. The core loss was $103 million in 3Q14 compared to a core loss of $167 million in 3Q13.
Charges in 3Q14 not included in core earnings totaled $94 million (3Q13 - $621 million):
• $69 million net charge for changes in actuarial methods and assumptions (3Q13 - $252 million), • $15 million of realized losses on AFS bonds and interest rate swaps (3Q13 - $72 million), and • $50 million related to the total company offset included in core investment-related experience. • Partially offsetting these items were $29 million of net experience gains on macro hedges (3Q13 -
$245 million net experience losses) and $11 million of other mark-to-market gains.
The core loss declined by $64 million from 3Q13 due to a decrease in the expected cost of macro hedging and lower interest expense on tax related items.
On a year-to-date basis the net loss attributed to shareholders was $621 million in 2014 compared to a net loss of $2,499 million for the same period of 2013. The improvement primarily relates to lower macro hedging losses, lower realized losses on AFS bonds and related swaps and other mark-to-market items. The year-to-date core loss of $321 million in 2014 was $257 million lower than the same period in 2013, primarily reflecting a decrease in the expected cost of macro hedging (note this is mostly offset by increased dynamic hedge costs in the operating divisions).
Premiums and deposits for 3Q14 of $981 million decreased from $1,110 million in 3Q13 due to the timing of inflows from institutional asset management clients.
Funds under management of $45.1 billion as at September 30, 2014 (September 30, 2013 – $35.8 billion) included record assets managed by Manulife Asset Management on behalf of institutional clients of $38.8 billion (2013 – $30.7 billion) and $11.3 billion (2013 – $7 billion) of the Company’s own funds, partially offset by a $5 billion (2013 – $1.9 billion) total company adjustment related to the reclassification of derivative positions from invested assets to other assets and liabilities. The increase in the Company’s own funds includes the net cash proceeds in escrow from the issuance of common equity by way of offerings of approximately $2.26 billion of subscription receipts, net income earned over the period and the impact of the stronger U.S. dollar.
November 13, 2014 – Press Release Reporting Third Quarter Results 21
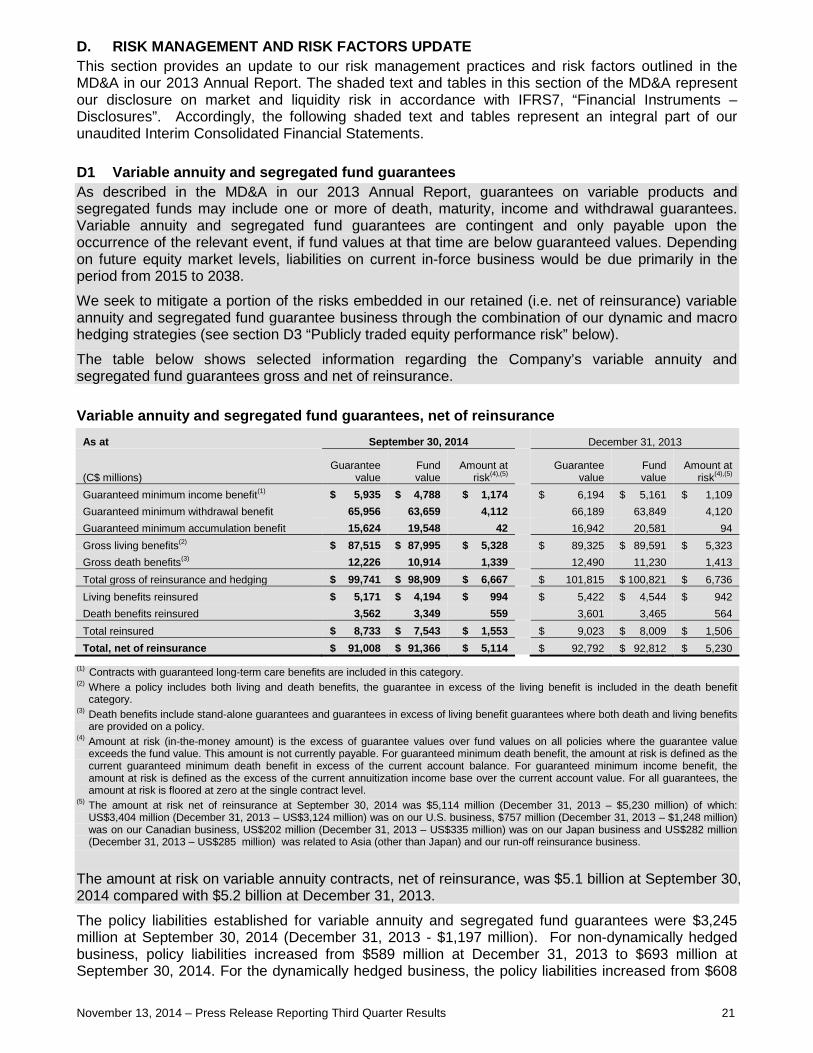
D. RISK MANAGEMENT AND RISK FACTORS UPDATE This section provides an update to our risk management practices and risk factors outlined in the MD&A in our 2013 Annual Report. The shaded text and tables in this section of the MD&A represent our disclosure on market and liquidity risk in accordance with IFRS7, “Financial Instruments – Disclosures”. Accordingly, the following shaded text and tables represent an integral part of our unaudited Interim Consolidated Financial Statements. D1 Variable annuity and segregated fund guarantees As described in the MD&A in our 2013 Annual Report, guarantees on variable products and segregated funds may include one or more of death, maturity, income and withdrawal guarantees. Variable annuity and segregated fund guarantees are contingent and only payable upon the occurrence of the relevant event, if fund values at that time are below guaranteed values. Depending on future equity market levels, liabilities on current in-force business would be due primarily in the period from 2015 to 2038.
We seek to mitigate a portion of the risks embedded in our retained (i.e. net of reinsurance) variable annuity and segregated fund guarantee business through the combination of our dynamic and macro hedging strategies (see section D3 “Publicly traded equity performance risk” below).
The table below shows selected information regarding the Company’s variable annuity and segregated fund guarantees gross and net of reinsurance.
Variable annuity and segregated fund guarantees, net of reinsurance
As at September 30, 2014
December 31, 2013
(C$ millions) Guarantee
value Fund value
Amount at risk(4),(5)
Guarantee value
Fund value
Amount at risk(4),(5)
Guaranteed minimum income benefit(1) $ 5,935 $ 4,788 $ 1,174
$ 9,023 $ 8,009 $ 1,506 Total, net of reinsurance $ 91,008 $ 91,366 $ 5,114
$ 92,792 $ 92,812 $ 5,230
(1) Contracts with guaranteed long-term care benefits are included in this category. (2) Where a policy includes both living and death benefits, the guarantee in excess of the living benefit is included in the death benefit
category. (3) Death benefits include stand-alone guarantees and guarantees in excess of living benefit guarantees where both death and living benefits
are provided on a policy. (4) Amount at risk (in-the-money amount) is the excess of guarantee values over fund values on all policies where the guarantee value
exceeds the fund value. This amount is not currently payable. For guaranteed minimum death benefit, the amount at risk is defined as the current guaranteed minimum death benefit in excess of the current account balance. For guaranteed minimum income benefit, the amount at risk is defined as the excess of the current annuitization income base over the current account value. For all guarantees, the amount at risk is floored at zero at the single contract level.
(5) The amount at risk net of reinsurance at September 30, 2014 was $5,114 million (December 31, 2013 – $5,230 million) of which: US$3,404 million (December 31, 2013 – US$3,124 million) was on our U.S. business, $757 million (December 31, 2013 – $1,248 million) was on our Canadian business, US$202 million (December 31, 2013 – US$335 million) was on our Japan business and US$282 million (December 31, 2013 – US$285 million) was related to Asia (other than Japan) and our run-off reinsurance business.
The amount at risk on variable annuity contracts, net of reinsurance, was $5.1 billion at September 30, 2014 compared with $5.2 billion at December 31, 2013.
The policy liabilities established for variable annuity and segregated fund guarantees were $3,245 million at September 30, 2014 (December 31, 2013 - $1,197 million). For non-dynamically hedged business, policy liabilities increased from $589 million at December 31, 2013 to $693 million at September 30, 2014. For the dynamically hedged business, the policy liabilities increased from $608
November 13, 2014 – Press Release Reporting Third Quarter Results 22
million at December 31, 2013 to $2,552 million at September 30, 2014. The increase in the total policy liabilities for variable annuity and segregated fund guarantees since December 31, 2013 is mainly due to the decline in yield curves and, in the case of dynamically hedged business, is also due to the decrease in swap rates in North America. D2 Caution related to sensitivities In this document, we provide sensitivities and risk exposure measures for certain risks. These include sensitivities due to specific changes in market prices and interest rate levels projected using internal models as at a specific date, and are measured relative to a starting level reflecting the Company’s assets and liabilities at that date and the actuarial factors, investment activity and investment returns assumed in the determination of policy liabilities. The risk exposures measure the impact of changing one factor at a time and assume that all other factors remain unchanged. Actual results can differ significantly from these estimates for a variety of reasons including the interaction among these factors when more than one changes; changes in actuarial and investment return and future investment activity assumptions; actual experience differing from the assumptions, changes in business mix, effective tax rates and other market factors; and the general limitations of our internal models. For these reasons, the sensitivities should only be viewed as directional estimates of the underlying sensitivities for the respective factors based on the assumptions outlined below. Given the nature of these calculations, we cannot provide assurance that the actual impact on net income attributed to shareholders will be as indicated or on MLI’s MCCSR ratio will be as indicated. D3 Publicly traded equity performance risk As outlined in our 2013 Annual Report, our macro hedging strategy is designed to mitigate public equity risk arising from variable annuity guarantees not dynamically hedged and from other products and fees. In addition, our variable annuity guarantee dynamic hedging strategy is not designed to completely offset the sensitivity of policy liabilities to all risks associated with the guarantees embedded in these products (see pages 48 and 49 of our 2013 Annual Report).
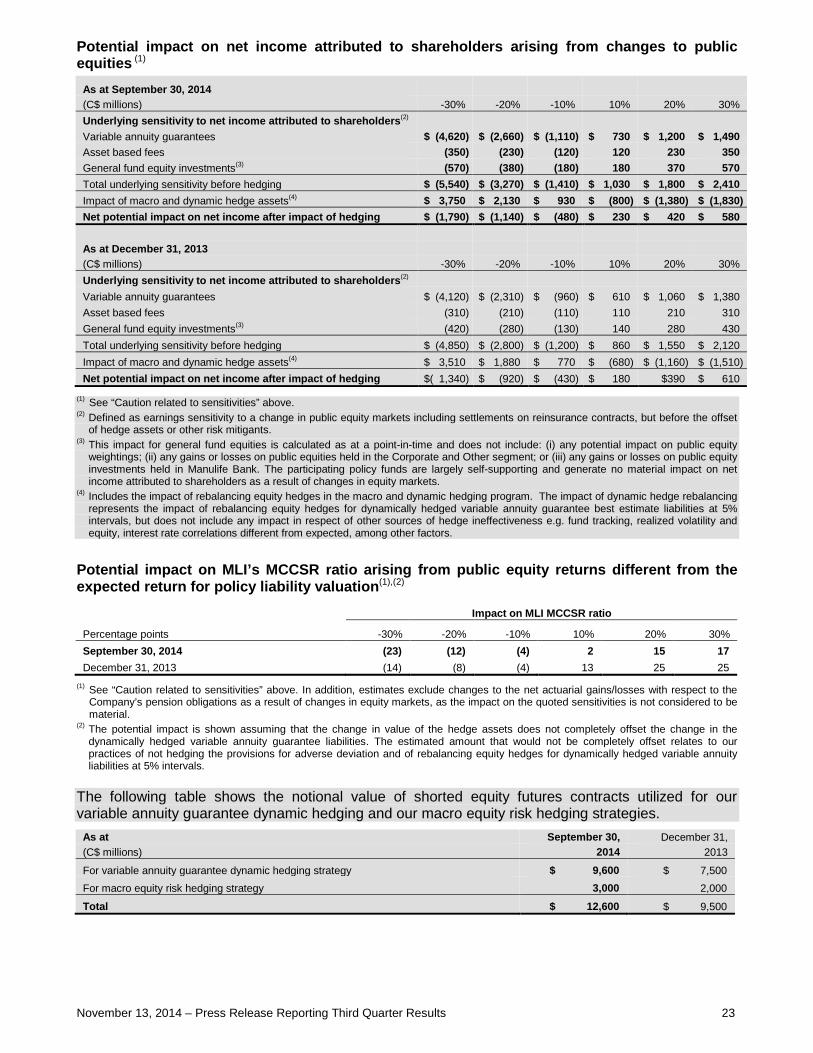
The tables below show the potential impact on net income attributed to shareholders resulting from an immediate 10, 20 and 30 % change in market values of publicly traded equities followed by a return to the expected level of growth assumed in the valuation of policy liabilities. The potential impact is shown after taking into account the impact of the change in markets on the hedge assets. While we cannot reliably estimate the amount of the change in dynamically hedged variable annuity guarantee liabilities that will not be offset by the profit or loss on the dynamic hedge assets, we make certain assumptions for the purposes of estimating the impact on shareholders’ net income.
This estimate assumes that the performance of the dynamic hedging program would not completely offset the gain/loss from the dynamically hedged variable annuity guarantee liabilities. It assumes that the hedge assets are based on the actual position at the period end, and that equity hedges in the dynamic program are rebalanced at 5% intervals. In addition, we assume that the macro hedge assets are rebalanced in line with market changes.
It is also important to note that these estimates are illustrative, and that the hedging program may underperform these estimates, particularly during periods of high realized volatility and/or periods where both interest rates and equity market movements are unfavourable.
This disclosure has been simplified in 2014 to exclude the impact of assuming that the change in the value of dynamic hedge assets completely offsets the change in dynamically hedged variable annuity guarantees, and now shows the impact of macro and dynamic hedge assets in aggregate.
November 13, 2014 – Press Release Reporting Third Quarter Results 23
Potential impact on net income attributed to shareholders arising from changes to public equities (1)
As at September 30, 2014 (C$ millions) -30% -20% -10% 10% 20% 30%
Underlying sensitivity to net income attributed to shareholders(2) Variable annuity guarantees $ (4,620) $ (2,660) $ (1,110) $ 730 $ 1,200 $ 1,490
Asset based fees (350) (230) (120) 120 230 350 General fund equity investments(3) (570) (380) (180) 180 370 570 Total underlying sensitivity before hedging $ (5,540) $ (3,270) $ (1,410) $ 1,030 $ 1,800 $ 2,410 Impact of macro and dynamic hedge assets(4) $ 3,750 $ 2,130 $ 930 $ (800) $ (1,380) $ (1,830) Net potential impact on net income after impact of hedging $ (1,790) $ (1,140) $ (480) $ 230 $ 420 $ 580
As at December 31, 2013 (C$ millions) -30% -20% -10% 10% 20% 30%
Underlying sensitivity to net income attributed to shareholders(2) Variable annuity guarantees $ (4,120) $ (2,310) $ (960) $ 610 $ 1,060 $ 1,380
Asset based fees (310) (210) (110) 110 210 310 General fund equity investments(3) (420) (280) (130) 140 280 430 Total underlying sensitivity before hedging $ (4,850) $ (2,800) $ (1,200) $ 860 $ 1,550 $ 2,120 Impact of macro and dynamic hedge assets(4) $ 3,510 $ 1,880 $ 770 $ (680) $ (1,160) $ (1,510) Net potential impact on net income after impact of hedging $( 1,340) $ (920) $ (430) $ 180 $390 $ 610
(1) See “Caution related to sensitivities” above. (2) Defined as earnings sensitivity to a change in public equity markets including settlements on reinsurance contracts, but before the offset
of hedge assets or other risk mitigants. (3) This impact for general fund equities is calculated as at a point-in-time and does not include: (i) any potential impact on public equity
weightings; (ii) any gains or losses on public equities held in the Corporate and Other segment; or (iii) any gains or losses on public equity investments held in Manulife Bank. The participating policy funds are largely self-supporting and generate no material impact on net income attributed to shareholders as a result of changes in equity markets.
(4) Includes the impact of rebalancing equity hedges in the macro and dynamic hedging program. The impact of dynamic hedge rebalancing represents the impact of rebalancing equity hedges for dynamically hedged variable annuity guarantee best estimate liabilities at 5% intervals, but does not include any impact in respect of other sources of hedge ineffectiveness e.g. fund tracking, realized volatility and equity, interest rate correlations different from expected, among other factors.
Potential impact on MLI’s MCCSR ratio arising from public equity returns different from the expected return for policy liability valuation(1),(2)
(1) See “Caution related to sensitivities” above. In addition, estimates exclude changes to the net actuarial gains/losses with respect to the Company’s pension obligations as a result of changes in equity markets, as the impact on the quoted sensitivities is not considered to be material.
(2) The potential impact is shown assuming that the change in value of the hedge assets does not completely offset the change in the dynamically hedged variable annuity guarantee liabilities. The estimated amount that would not be completely offset relates to our practices of not hedging the provisions for adverse deviation and of rebalancing equity hedges for dynamically hedged variable annuity liabilities at 5% intervals.
The following table shows the notional value of shorted equity futures contracts utilized for our variable annuity guarantee dynamic hedging and our macro equity risk hedging strategies.
As at September 30, December 31, (C$ millions) 2014 2013
For variable annuity guarantee dynamic hedging strategy $ 9,600 $ 7,500 For macro equity risk hedging strategy 3,000 2,000
Total $ 12,600 $ 9,500
November 13, 2014 – Press Release Reporting Third Quarter Results 24
D4 Interest rate and spread risk At September 30, 2014, we estimated the sensitivity of our net income attributed to shareholders to a 100 basis point parallel decline in interest rates to be a charge of $700 million, and to a 100 basis point increase in interest rates to be a benefit of $300 million. The $300 million increase in sensitivity to a 100 basis point decline in interest rates from December 31, 2013 was primarily attributable to interest rate movements during 2014 as well as updates to our valuation assumptions as a result of our annual review of actuarial methods and assumptions.
The 100 basis point parallel decline includes a change of one per cent in current government, swap and corporate rates for all maturities across all markets with no change in credit spreads between government, swap and corporate rates, and with a floor of zero on government rates and corporate spreads, relative to the rates assumed in the valuation of policy liabilities, including embedded derivatives. As the sensitivity to a 100 basis point change in interest rates includes any associated change in the applicable prescribed reinvestment scenario, the impact of changes to interest rates for less than, or more than, the amounts indicated are unlikely to be linear. Furthermore, the reinvestment scenario changes tend to amplify the negative effects of a decrease in interest rates, and dampen the positive effects of an increase in interest rates. For variable annuity guarantee liabilities that are dynamically hedged, it is assumed that interest rate hedges are rebalanced at 20 basis point intervals.
The income impact does not allow for any future potential changes to the URR assumptions or other potential impacts of lower interest rate levels, for example, increased strain on the sale of new business or lower interest earned on our surplus assets. It also does not reflect potential management actions to realize gains or losses on AFS fixed income assets held in the surplus segment in order to partially offset changes in MLI’s MCCSR ratio due to changes in interest rate levels.
Potential impact on net income attributed to shareholders and MLI’s MCCSR ratio of an immediate 1% parallel change in interest rates relative to rates assumed in the valuation of policy liabilities(1),(2),(3),(4)
September 30, 2014
December 31,2013
As at -100bp +100bp
-100bp +100bp
Net income attributed to shareholders (C$ millions) Excluding change in market value of AFS fixed income assets held in the
surplus segment $ (700) $ 300
$ (400) $ - From fair value changes in AFS fixed income assets held in surplus, if
realized 700 (600)
600 (600) MLI's MCCSR ratio (Percentage points)
Before impact of change in market value of AFS fixed income assets held in the surplus segment(5) (16) 13
(13) 18
From fair value changes in AFS fixed income assets held in surplus, if realized 4 (5)
4 (5)
(1) See “Caution related to sensitivities” above. In addition, estimates exclude changes to the net actuarial gains/losses with respect to the Company’s pension obligations as a result of changes in interest rates, as the impact on the quoted sensitivities is not considered to be material.
(2) Includes guaranteed insurance and annuity products, including variable annuity contracts as well as adjustable benefit products where benefits are generally adjusted as interest rates and investment returns change, a portion of which have minimum credited rate guarantees. For adjustable benefit products subject to minimum rate guarantees, the sensitivities are based on the assumption that credited rates will be floored at the minimum.
(3) The amount of gain or loss that can be realized on AFS fixed income assets held in the surplus segment will depend on the aggregate amount of unrealized gain or loss.
(4) Sensitivities are based on projected asset and liability cash flows at the beginning of the quarter adjusted for the estimated impact of new business, investment markets and asset trading during the quarter. Any true-up to these estimates, as a result of the final asset and liability cash flows to be used in the next quarter’s projection, are reflected in the next quarter’s sensitivities. Impact of realizing fair value changes in AFS fixed income assets is as of the end of the quarter.
(5) The impact on MLI’s MCCSR ratio includes both the impact of the change in earnings on available capital as well as the change in required capital that results from a change in interest rates. The potential increase in required capital accounted for 10 of the 16 point impact of a 100 bp decline in interest rates on MLI’s MCCSR ratio this quarter.
November 13, 2014 – Press Release Reporting Third Quarter Results 25
The following table shows the potential impact on net income attributed to shareholders resulting from a change in credit spreads and swap spreads over government bond rates for all maturities across all markets with a floor of zero on the total interest rate, relative to the spreads assumed in the valuation of policy liabilities. Potential impact on net income attributed to shareholders arising from changes to corporate spreads and swap spreads(1),(2),(3)
(1) See “Caution related to sensitivities” above. (2) The impact on net income attributed to shareholders assumes no gains or losses are realized on our AFS fixed income assets held in the
surplus segment and excludes the impact arising from changes in off-balance sheet bond fund value arising from changes in credit spreads. The participating policy funds are largely self-supporting and generate no material impact on net income attributed to shareholders as a result of changes in corporate and swap spreads.
(3) Sensitivities are based on projected asset and liability cash flows at the beginning of the quarter adjusted for the estimated impact of new business, investment markets and asset trading during the quarter. Any true-up to these estimates, as a result of the final asset and liability cash flows to be used in the next quarter’s projection, are reflected in the next quarter’s sensitivities.
(4) Corporate spreads are assumed to grade to an expected long-term average over five years.
As the sensitivity to a 50 basis point decline in corporate spreads includes the impact of a change in prescribed reinvestment scenarios where applicable, the impact of changes to corporate spreads for less than, or more than, the amounts indicated are unlikely to be linear. The potential earnings impact of a 50 basis point decline in corporate spreads related to the impact of the scenario change was not significant at September 30, 2014 and was not significant at December 31, 2013. The $100 million increase in sensitivity to corporate spreads was primarily attributable to interest rate and corporate spread movements during 2014. The $100 million increase in sensitivity to swap spreads was primarily attributable to interest rate and swap spread movements during 2014. Alternative Long-Duration Asset (“ALDA”) Performance Risk The following table shows the potential impact on net income attributed to shareholders resulting from changes in market values of ALDA that differ from the expected levels assumed in the valuation of policy liabilities. Potential impact on net income attributed to shareholders arising from changes in ALDA returns(1),(2),(3),(4)
As at September 30, 2014
December 31, 2013 (C$ millions) -10% 10%
-10% 10%
Real estate, agriculture and timber assets $ (1,200) $ 1,200
$ (1,000) $ 1,000
Private equities and other alternative long-duration assets (1,100) 1,100
(900) 800
Alternative long-duration assets $ (2,300) $ 2,300
$ (1,900) $ 1,800
(1) See “Caution Related to Sensitivities” above. (2) This impact is calculated as at a point-in-time impact and does not include: (i) any potential impact on ALDA, weightings; (ii) any gains or
losses on ALDA held in the Corporate and Other segment; or (iii) any gains or losses on ALDA held in Manulife Bank. (3) The participating policy funds are largely self-supporting and generate no material impact on net income attributed to shareholders as a
result of changes in alternative long-duration asset returns. (4) Net income impact does not consider any impact of the market correction on assumed future return assumptions.
November 13, 2014 – Press Release Reporting Third Quarter Results 26
The increased sensitivity from December 31, 2013 to September 30, 2014 is related to the impact of the decrease in risk free rates in some jurisdictions during the period, decreasing the rate at which funds can be reinvested, as well as the increase in market value of the ALDA, due to investment activities and positive investment returns.
E ACCOUNTING MATTERS AND CONTROLS E1 Critical accounting and actuarial policies Our significant accounting policies under IFRS are described in note 1 to our Consolidated Financial Statements for the year ended December 31, 2013. The critical accounting policies and the estimation processes related to the determination of insurance contract liabilities, fair values of financial instruments, the application of derivative and hedge accounting, the determination of pension and other post-employment benefit obligations and expenses, and accounting for income taxes and uncertain tax positions are described on pages 67 to 75 of our 2013 Annual Report. E2 Actuarial methods and assumptions A comprehensive review of actuarial methods and assumptions is performed annually. The review is designed to reduce the Company’s exposure to uncertainty by ensuring assumptions for both asset-related and liability-related risks remain appropriate. This is accomplished by monitoring experience and selecting assumptions which represent a current best estimate view of expected future experience, and margins that are appropriate for the risks assumed. While the assumptions selected represent the Company’s current best estimates and assessment of risk, the ongoing monitoring of experience and changes in the economic environment are likely to result in future changes to the valuation assumptions, which could be material.
The quantification of the impact of the 2014 comprehensive review of valuation methods and assumptions is as of July 1, 2014 for all lines of business.
In the third quarter of 2014, the completion of the annual review of actuarial methods and assumptions resulted in an increase in insurance and investment contract liabilities of $62 million, net of reinsurance. Net of the income attributed to participating policyholders and non-controlling interests, net income attributed to shareholders decreased by $69 million post-tax.
For the quarter ended September 30, 2014
Change in net insurance and
investment contract liabilities
Change in net income attributed to
shareholders Assumption (C$ millions)
Increase (decrease) Increase (decrease)
Mortality and morbidity updates $ (113) $ 99
Lapses and policyholder behaviour 425 (329)
Updates to actuarial standards Segregated fund bond calibration 217 (157)
Other updates (467) 318
Net impact $ 62 $ (69)
Updates to mortality and morbidity Mortality assumptions were updated across several business units to reflect recent experience. Updates to our Canadian Retail Insurance mortality led to a $273 million increase in net income attributed to shareholders. Other mortality and morbidity updates led to a $136 million increase to net income attributed to shareholders, and were primarily from our JH Annuities business where in aggregate we benefited from updates to mortality assumptions. These were partially offset by updates in JH Life insurance, primarily for policies issued at older ages, which led to a $310 million decrease in net income attributed to shareholders.
November 13, 2014 – Press Release Reporting Third Quarter Results 27
Updates to lapses and policyholder behaviour Lapse rates for several of our Canadian Retail Insurance non-participating whole life and universal life products were updated to reflect recent experience which led to a $224 million decrease in net income attributed to shareholders.
Other updates to lapse and policyholder behaviour assumptions were made across several business units including Indonesia, and Canadian and U.S. variable annuities to reflect updated experience results which led to a $105 million decrease in net income attributed to shareholders.
Updates to actuarial standards Updates to actuarial standards related to bond parameter calibration for stochastic models used to value segregated fund liabilities resulted in a $157 million decrease in net income attributed to shareholders.
Other updates The Company performed an in depth review of the modelling of future tax cash flows for its U.S. insurance business and this review resulted in improvements to the modeling resulting in an increase in net income attributed to shareholders of $489 million.
The Company made a number of model refinements related to the projection of both asset and liability cash flows across several business units which led to a $171 million decrease in net income attributed to shareholders. E3 Sensitivity of policy liabilities to updates and assumptions When the assumptions underlying our determination of policy liabilities are updated to reflect recent and emerging experience or change in outlook, the result is a change in the value of policy liabilities which in turn affects income. The sensitivity of after-tax income to updates to asset related assumptions underlying policy liabilities is shown below, assuming that there is a simultaneous update to the assumption across all business units.
For updates to asset related assumptions, the sensitivity is shown net of the corresponding impact on income of the change in the value of the assets supporting policy liabilities. In practice, experience for each assumption will frequently vary by business and geographic market and assumption updates are made on a business/geographic specific basis. Actual results can differ materially from these estimates for a variety of reasons including the interaction among these factors when more than one changes; changes in actuarial and investment return and future investment activity assumptions; actual experience differing from the assumptions; changes in business mix, effective tax rates and other market factors; and the general limitations of our internal models.
Most participating business is excluded from this analysis because of the ability to pass both favourable and adverse experience to the policyholders through the participating dividend adjustment. The estimated potential impact on net income for the next 5 years and the following 5 years from changes in the fixed income URR driven by changes in risk free rates is not shown here. After the implementation of the revised actuarial standards of practice relating to reinvestment assumptions in 4Q14, we do not anticipate that there will be any further impact on net income due to changes in fixed income URR21.
21 See “Caution related to forward-looking statements” below.
November 13, 2014 – Press Release Reporting Third Quarter Results 28
Potential impact on net income attributed to shareholders arising from changes to asset related assumptions supporting actuarial liabilities, excluding the fixed income ultimate reinvestment rate discussed above
As at Increase (decrease) in after-tax income (C$ millions) September 30, 2014
December 31, 2013
Asset related assumptions updated periodically in valuation basis changes Increase Decrease
Increase Decrease
100 basis point change in future annual returns for public equities(1) $ 400 $ (400)
$ 400 $ (400) 100 basis point change in future annual returns for alternative long-
duration assets(2) 4,700 (4,500)
3,800 (3,700) 100 basis point change in equity volatility assumption for stochastic
segregated fund modelling(3) (200) 200
(200) 200 (1) The sensitivity to public equity returns above includes the impact on both segregated fund guarantee reserves and on other policy
liabilities. For a 100 basis point increase in expected growth rates, the impact from segregated fund guarantee reserves is a $100 million increase (December 31, 2013 – $200 million increase). For a 100 basis point decrease in expected growth rates, the impact from segregated fund guarantee reserves is a $200 million decrease (December 31, 2013 – $200 million decrease). Expected long-term annual market growth assumptions for public equities pre-dividends for key markets are based on long-term historical observed experience and compliance with actuarial standards. The growth rates for returns in the major markets used in the stochastic valuation models for valuing segregated fund guarantees are 7.6% per annum in Canada, 7.6% per annum in the U.S. and 5.2% per annum in Japan. Growth assumptions for European equity funds are market-specific and vary between 5.8% and 7.85%.
(2) ALDA include commercial real estate, timber and agricultural real estate, oil and gas, and private equities. The increase of $900 million in sensitivity from December 31, 2013 to September 30, 2014 is related to the impact of the decrease in risk free rates in some jurisdictions during the period, decreasing the rate at which funds can be reinvested, as well as the increase in market value of the ALDA, due to investment activities and positive investment returns.
(3) Volatility assumptions for public equities are based on long-term historic observed experience and compliance with actuarial standards. The resulting volatility assumptions are 17.15% per annum in Canada and 17.15% per annum in the U.S. for large cap public equities, and 19% per annum in Japan. For European equity funds, the volatility assumptions vary between 16.25% and 18.4%.
E4 Accounting and reporting changes
Topic Effective
Date Recognition / Measurement /
Presentation Impact /
Expected Impact
Future Accounting Changes
Annual Improvements 2012-2014 cycle Jan 1, 2016 Measurement and
Presentation Not significant IFRS 10 "Consolidated Financial Statements" and
IAS 28 "Investments in Associates and Joint Ventures" Jan 1, 2016 Recognition Not significant
E5 U.S. GAAP results Net income attributed to shareholders in accordance with U.S. GAAP22 for 3Q14 was $823 million, compared with net income attributed to shareholders of $1,100 million under IFRS. As we are no longer reconciling our financial results under IFRS and U.S. GAAP within our Consolidated Financial Statements, net income attributed to shareholders in accordance with U.S. GAAP is considered a non-GAAP financial measure. The reconciliation of the major differences between net income attributed to shareholders in accordance with IFRS and the net income attributed to shareholders in accordance with U.S. GAAP for 3Q14 follows, with major differences expanded upon below:
22 This item is a non-GAAP measure. See “Performance and Non-GAAP Measures” below. See also section A4 “Future changes to non-
GAAP measures” above.
November 13, 2014 – Press Release Reporting Third Quarter Results 29
For the quarters ended September 30, Quarterly Results (C$ millions, unaudited) 2014 2013 Net income attributed to shareholders in accordance with IFRS $ 1,100 $ 1,034 Key earnings differences:
Variable annuity guarantee liabilities and related dynamic hedges(1) $ 221 $ (635) Impact of mark-to-market accounting and investing activities on investment income and
policy liabilities(2) (10) (394) New business differences including acquisition costs(3) (223) (210) Changes in actuarial methods and assumptions(4) (335) 175 Other differences 70 178 Total earnings difference $ (277) $ (886) Net income attributed to shareholders in accordance with U.S. GAAP $ 823 $ 148
(1) IFRS follows a predominantly “mark-to-market” accounting approach to measure variable annuity guarantee liabilities while U.S. GAAP only uses “mark-to-market” accounting for certain benefit guarantees. The U.S. GAAP accounting results in an accounting mismatch between the hedge assets supporting the dynamically hedged guarantees and the guarantees not accounted for on a mark-to-market basis. Another difference is that U.S. GAAP reflects the Company’s own credit standing in the measurement of the liability. In 3Q14, we reported a net gain of $178 million (3Q13 – charge of $169 million) in our total variable annuity businesses under U.S. GAAP compared with a charge of $43 million under IFRS (3Q13 – gain of $466 million). Under both accounting bases we reported charges on our macro hedging program of $17 million in 3Q14 (3Q13 – $329 million).
(2) Under IFRS, accumulated unrealized gains and losses arising from fixed income investments and interest rate derivatives supporting policy liabilities are largely offset in the valuation of the policy liabilities. The 3Q14 IFRS impacts of fixed income reinvestment assumptions, general fund equity investments, fixed income and alternative long-duration asset investing totaled a net gain of $455 million (3Q13 – $416 million) compared with U.S. GAAP net realized gains and other investment-related gains of $445 million (3Q13 – $22 million).
(3) Acquisition costs that are related to and vary with the production of new business are explicitly deferred and amortized under U.S. GAAP but are recognized as an implicit reduction in insurance liabilities along with other new business gains and losses under IFRS.
(4) The charge recognized under IFRS from changes in actuarial methods and assumptions of $69 million in 3Q14 (3Q13 – $252 million) compared to a charge of $404 million (3Q13 –$77 million) on a U.S. GAAP basis.
Total equity in accordance with U.S. GAAP23 as at September 30, 2014 was approximately $13.5 billion higher than under IFRS. Of this difference, approximately $7 billion was attributable to the higher cumulative net income on a U.S. GAAP basis. The remaining difference was primarily attributable to the recording of net unrealized gains on fixed income investments and derivatives in a cash flow hedging relationship in Accumulated Other Comprehensive Income (“AOCI”) under U.S. GAAP partially offset by the impact of currency translation on net foreign operations. F Other F1 Performance and Non-GAAP Measures We use a number of non-GAAP financial measures to measure overall performance and to assess each of our businesses. A financial measure is considered a non-GAAP measure for Canadian securities law purposes if it is presented other than in accordance with generally accepted accounting principles used for the Company’s audited financial statements. Non-GAAP measures include: Core Earnings (Loss); Net Income Attributed to Shareholders in Accordance with U.S. GAAP; Total Equity in Accordance with U.S. GAAP; Core ROE; Diluted Core Earnings Per Common Share; Constant Currency Basis; Earnings Per Share (“EPS”) excluding Transition and Integration Costs; Assets under Management (“AUM”); Assets under Administration (“AUA”); Premiums and Deposits; Funds under Management; Capital; New Business Embedded Value; and Sales. Non-GAAP financial measures are not defined terms under GAAP and, therefore, with the exception of Net Income Attributed to Shareholders in Accordance with U.S. GAAP and Total Equity in Accordance with U.S. GAAP (which are comparable to the equivalent measures of issuers whose financial statements are prepared in accordance with U.S. GAAP), are unlikely to be comparable to similar terms used by other issuers. Therefore, they should not be considered in isolation or as a substitute for any other financial information prepared in accordance with GAAP.
23 This item is a non-GAAP measure. See “Performance and Non-GAAP Measures” below. See also section A4 “Future changes to non-
GAAP measures” above.
November 13, 2014 – Press Release Reporting Third Quarter Results 30
Core earnings (loss) is a non-GAAP measure which we use to better understand the long-term earnings capacity and valuation of the business. Core earnings excludes the direct impact of changes in equity markets and interest rates as well as a number of other items, outlined below, that are considered material and exceptional in nature. While this metric is relevant to how we manage our business and offers a consistent methodology, it is not insulated from macro-economic factors, which can have a significant impact.
Any future changes to the core earnings definition referred to below, will be disclosed24. Items that are included in core earnings are: 1. Expected earnings on in-force, including expected release of provisions for adverse deviation, fee
income, margins on group business and spread business such as Manulife Bank and asset fund management.
2. Macro hedging costs based on expected market returns. 3. New business strain. 4. Policyholder experience gains or losses. 5. Acquisition and operating expenses compared to expense assumptions used in the
measurement of insurance and investment contract liabilities. 6. Up to $200 million of favourable investment-related experience reported in a single year which is
referred to as “core investment gains”. 7. Earnings on surplus other than mark-to-market items. Gains on available-for-sale (“AFS”) equities
and seed money investments are included in core earnings. 8. Routine or non-material legal settlements. 9. All other items not specifically excluded. 10. Tax on the above items. 11. All tax related items except the impact of enacted or substantially enacted income tax rate
changes. Items excluded from core earnings are: 1. The direct impact of equity markets and interest rates and variable annuity guarantee liabilities,
consisting of: The earnings impact of the difference between the net increase (decrease) in variable annuity
liabilities that are dynamically hedged and the performance of the related hedge assets. Our variable annuity dynamic hedging strategy is not designed to completely offset the sensitivity of insurance and investment contract liabilities to all risks or measurements associated with the guarantees embedded in these products for a number of reasons, including: provisions for adverse deviation, fund performance, the portion of the interest rate risk that is not dynamically hedged, realized equity and interest rate volatilities and changes to policyholder behaviour.
Gains (charges) on variable annuity guarantee liabilities that are not dynamically hedged. Gains (charges) on general fund equity investments supporting insurance and investment
contract liabilities and on fee income. Gains (charges) on macro equity hedges relative to expected costs. The expected cost of
macro hedges is calculated using the equity assumptions used in the valuation of insurance and investment contract liabilities.
Gains (charges) on higher (lower) fixed income reinvestment rates assumed in the valuation of insurance and investment contract liabilities, including the impact on the fixed income ultimate reinvestment rate (“URR”).
Gains (charges) on sale of AFS bonds and open derivatives not in hedging relationships in the Corporate and Other segment.
24 See section A4 “Future changes to non-GAAP measures” above.
November 13, 2014 – Press Release Reporting Third Quarter Results 31
2. Net favourable investment-related experience in excess of $200 million per annum or net unfavourable investment-related experience on a year-to-date basis. Investment-related experience relates to fixed income trading, alternative long-duration asset returns, credit experience and asset mix changes. This favourable and unfavourable investment-related experience is a combination of reported investment experience as well as the impact of investing activities on the measurement of our insurance and investment contract liabilities. The maximum of $200 million per annum to be reported in core earnings compares with an average of over $80 million per quarter of favourable investment-related experience reported since 1Q07.
3. Mark-to-market gains or losses on assets held in the Corporate and Other segment other than gains on AFS equities and seed money investments in new segregated or mutual funds.
4. Changes in actuarial methods and assumptions. 5. The impact on the measurement of insurance and investment contract liabilities of changes in
product features or new reinsurance transactions, if material. 6. Goodwill impairment charges. 7. Gains or losses on disposition of a business. 8. Material one-time only adjustments, including highly unusual/extraordinary and material legal
settlements or other items that are material and exceptional in nature. 9. Tax on the above items. 10. Impact of enacted or substantially enacted income tax rate changes.
November 13, 2014 – Press Release Reporting Third Quarter Results 32
The following table summarizes for the past eight quarters core earnings and net income (loss) attributed to shareholders. Total Company
Investment-related experience in excess of amounts included in core earnings 320 217 225 215 491 (97) 97 321
Core earnings plus investment-related experience in excess of amounts included in core earnings $ 1,075 $ 918 $ 944 $ 900 $ 1,195 $ 512 $ 716 $ 875
Other items to reconcile core earnings to net income attributed to shareholders:
Direct impact of equity markets and interest rates and variable annuity guarantee liabilities (details below) 70 55 (90) (81) 94 (242) (107) 82
Impact of in-force product changes and recapture of reinsurance treaties 24 - - 261 - - - -
Change in actuarial methods and assumptions (69) (30) (40) (133) (252) (35) (69) (87) Disposition of Taiwan insurance business - - - 350 - - - -
Tax items and restructuring charge related to organizational design - - 4 - (3) 24 - 207
Net income attributed to shareholders $ 1,100 $ 943 $ 818 $ 1,297 $ 1,034 $ 259 $ 540 $ 1,077
Other market-related factors
Direct impact of equity markets and variable annuity guarantee liabilities $ (35) $ 66 $ (71) $ 105 $ 306 $ (196) $ 243 $ 412
Gains (charges) on higher (lower) fixed income reinvestment rates assumed in the valuation of policy liabilities 165 22 9 (105) (77) 151 (245) (290)
Gains (charges) on sale of AFS bonds and derivative positions in the Corporate segment (15) (8) (3) (55) (72) (127) (8) (40)
Charges due to lower fixed income URR assumptions used in the valuation of policy liabilities (45) (25) (25) (26) (63) (70) (97) -
Direct impact of equity markets and interest rates and variable annuity guarantee liabilities $ 70 $ 55 $ (90) $ (81) $ 94 $ (242) $ (107) $ 82
(1) The 2012 results were restated to reflect the retrospective application of new IFRS accounting standards effective January 1, 2013. For a detailed description of the change see note 2 to our 2013 Annual Consolidated Financial Statements.
November 13, 2014 – Press Release Reporting Third Quarter Results 33
Asia Division
Quarterly Results
(C$ millions, unaudited) 3Q 2Q 1Q 4Q 3Q 2Q 1Q 4Q
2014 2014 2014 2013 2013 2013 2013 2012
Asia Division core earnings $ 273 $ 231 $ 244 $ 227 $ 242 $ 226 $ 226 $ 180 Investment-related experience in excess of amounts
included in core earnings 27 18 19 (5) (4) (18) 43 33
Core earnings plus investment-related experience in excess of amounts included in core earnings $ 300 $ 249 $ 263 $ 222 $ 238 $ 208 $ 269 $ 213
Other items to reconcile core earnings to net income attributable to shareholders
Direct impact of equity markets and interest rates and variable annuity guarantee liabilities 32 88 (25) 85 242 178 659 469
Recapture of reinsurance treaty and tax items - - - 68 - - - - Disposition of Taiwan insurance business - - - 350 - - - - Tax items - - 4 - - - - -
Net income attributed to shareholders $ 332 $ 337 $ 242 $ 725 $ 480 $ 386 $ 928 $ 682
Canadian Division
Quarterly Results
(C$ millions, unaudited) 3Q 2Q 1Q 4Q 3Q 2Q 1Q 4Q
2014 2014 2014 2013 2013 2013 2013 2012
Canadian Division core earnings $ 243 $ 232 $ 228 $ 233 $ 268 $ 225 $ 179 $ 233 Investment-related experience in excess of amounts
included in core earnings 19 46 135 106 135 (88) (187) (31) Core earnings plus investment-related experience in
excess of amounts included in core earnings $ 262 $ 278 $ 363 $ 339 $ 403 $ 137 $ (8) $ 202 Other items to reconcile core earnings to net income
(loss) attributable to shareholders Direct impact of equity markets and interest rates and
Recapture of reinsurance treaty and tax items 24 - - - (3) - - -
Net income (loss) attributed to shareholders $ 286 $ 267 $ 377 $ 373 $ 414 $ 103 $ (62) $ 251
U.S. Division
Quarterly Results
(C$ millions, unaudited) 3Q 2Q 1Q 4Q 3Q 2Q 1Q 4Q
2014 2014 2014 2013 2013 2013 2013 2012(1)
U.S. Division core earnings $ 342 $ 329 $ 374 $ 366 $ 361 $ 343 $ 440 $ 293 Investment-related experience in excess of amounts
included in core earnings 319 206 111 161 404 65 263 367
Core earnings plus investment-related experience in excess of amounts included in core earnings $ 661 $ 535 $ 485 $ 527 $ 765 $ 408 $ 703 $ 660
Other items to reconcile core earnings to net income (loss) attributable to shareholders
Direct impact of equity markets and interest rates and variable annuity guarantee liabilities 18 24 (82) 105 163 21 23 (104)
Impact of in-force product changes and recapture of reinsurance treaties - - - 193 - - - -
Tax items - - - - - - - 170
Net income attributed to shareholders $ 679 $ 559 $ 403 $ 825 $ 928 $ 429 $ 726 $ 726
(1) The 2012 results were restated to reflect the retrospective application of new IFRS accounting standards effective January 1, 2013. For a detailed description of the change see note 2 to our 2013 Annual Consolidated Financial Statements.
November 13, 2014 – Press Release Reporting Third Quarter Results 34
Corporate and Other
Quarterly Results
(C$ millions, unaudited) 3Q 2Q 1Q 4Q 3Q 2Q 1Q 4Q
2014 2014 2014 2013 2013 2013 2013 2012(1)
Corporate and Other core loss (excluding expected cost of macro hedges and core investment gains) $ (107) $ (92) $ (135) $ (138) $ (135) $ (105) $ (128) $ (62)
Investment-related experience included in core earnings 50 50 50 50 52 48 50 50
Total core loss $ (103) $ (91) $ (127) $ (141) $ (167) $ (185) $ (226) $ (152)
Investment-related experience in excess of amounts included in core earnings (45) (53) (40) (47) (44) (56) (22) (48)
Core loss plus investment-related experience in excess of amounts included in core earnings $ (148) $ (144) $ (167) $ (188) $ (211) $ (241) $ (248) $ (200)
Other items to reconcile core earnings (losses) to net income (loss) attributed to shareholders
Direct impact of equity markets and interest rates and variable annuity guarantee liabilities 20 (46) 3 (305) (325) (407) (735) (332)
Changes in actuarial methods and assumptions (69) (30) (40) (133) (252) (35) (69) (87)
Tax items and restructuring charge related to organizational design - - - - - 24 - 37
Net loss attributed to shareholders $ (197) $ (220) $ (204) $ (626) $ (788) $ (659) $ (1,052) $ (582)
(1) The 2012 results were restated to reflect the retrospective application of new IFRS accounting standards effective January 1, 2013. For a detailed description of the change see note 2 to our 2013 Annual Consolidated Financial Statements.
Net income (loss) attributed to shareholders in accordance with U.S. GAAP is a non-GAAP profitability measure. It shows what the net income would have been if the Company had applied U.S. GAAP as its primary financial reporting basis. We considered this to be a relevant profitability measure given our large U.S. domiciled investor base and for comparability to our U.S. peers who report under U.S. GAAP.
Total equity in accordance with U.S. GAAP is a non-GAAP measure. It shows what the total equity would have been if the Company had applied U.S. GAAP as its primary financial reporting basis. We considered this to be a relevant measure given our large U.S. domiciled investor base and for comparability to our U.S. peers who report under U.S. GAAP.
Core return on common shareholders’ equity (“Core ROE”) is a non-GAAP profitability measure that presents core earnings available to common shareholders as a percentage of the capital deployed to earn the core earnings. The Company calculates Core ROE using average common shareholders’ equity.
Diluted core earnings per common share is core earnings available to common shareholders expressed per diluted weighted average common share outstanding.
The Company also uses financial performance measures that are prepared on a constant currency basis, which exclude the impact of currency fluctuations (from local currency to Canadian dollars at a total company level and from local currency to U.S. dollars in Asia) and which are non-GAAP measures. Quarterly amounts stated on a constant currency basis in this report are calculated, as appropriate, using the income statement and balance sheet exchange rates effective for the third quarter of 2014.
Earnings Per Share (“EPS”) excluding Transition and Integration Costs is a non-GAAP measure of the Company’s profitability. It shows what the earnings per common share would be excluding transition and integration costs which are one-time costs. Assets under management (“AUM”) is a non-GAAP measure of the size of the Company’s Canadian mutual fund business. It represents the assets managed by the Company, on behalf of mutual fund clients, on a discretionary basis for which the Company earns investment management fees.
November 13, 2014 – Press Release Reporting Third Quarter Results 35
Assets under administration (“AUA”) is a non-GAAP measure of the size of the Company’s Canadian group pension business. It represents the asset base on which the Company provides administrative services such as recordkeeping, custodial and customer reporting services.
Premiums and deposits is a non-GAAP measure of top line growth. The Company calculates premiums and deposits as the aggregate of (i) general fund premiums, net of reinsurance, reported as premiums on the Consolidated Statements of Income, (ii) segregated fund deposits, excluding seed money, (“deposits from policyholders”), (iii) investment contract deposits, (iv) mutual fund deposits, (v) deposits into institutional advisory accounts, (vi) premium equivalents for “administration services only” group benefits contracts (“ASO premium equivalents”), (vii) premiums in the Canadian Group Benefits reinsurance ceded agreement, and (viii) other deposits in other managed funds.
Premiums and deposits Quarterly Results
(C$ millions) 3Q 2014 2Q 2014 3Q 2013 Net premium income $ 4,641 $ 4,232 $ 4,369 Deposits from policyholders 5,509 5,587 5,321 Premiums and deposits per financial statements $ 10,150 $ 9,819 $ 9,690 Investment contract deposits 15 9 9 Mutual fund deposits 8,982 10,524 8,111 Institutional advisory account deposits 962 2,743 1,089 ASO premium equivalents 736 775 723 Group Benefits ceded premiums 1,132 991 981 Other fund deposits 110 105 99 Total premiums and deposits $ 22,087 $ 24,966 $ 20,702 Currency impact - (38) 709 Constant currency premiums and deposits $ 22,087 $ 24,928 $ 21,411
Funds under management is a non-GAAP measure of the size of the Company. It represents the total of the invested asset base that the Company and its customers invest in.
Funds under management As at Quarterly Results
(C$ millions) September 30,
2014 June 30,
2014 September 30,
2013 Total invested assets $ 257,842 $ 244,129 $ 229,221 Segregated funds net assets 250,406 247,186 226,975 Funds under management per financial statements $ 508,248 $ 491,315 $ 456,196 Mutual funds 111,600 105,147 81,049 Institutional advisory accounts (excluding segregated funds) 36,498 35,210 28,686 Other funds 6,185 5,588 8,721 Total funds under management $ 662,531 $ 637,260 $ 574,652 Currency impact - 19,987 33,287 Constant currency funds under management $ 662,531 $ 657,247 $ 607,939
Capital The definition we use for capital, a non-GAAP measure, serves as a foundation of our capital management activities at the MFC level. For regulatory reporting purposes, the numbers are further adjusted for various additions or deductions to capital as mandated by the guidelines used by OSFI. Capital is calculated as the sum of (i) total equity excluding AOCI on cash flow hedges and (ii) liabilities for preferred shares and capital instruments.
November 13, 2014 – Press Release Reporting Third Quarter Results 36
Capital As at Quarterly Results
(C$ millions) September 30,
2014 June 30,
2014 September 30,
2013 Total equity $ 32,596 $ 30,780 $ 26,881 Add AOCI loss on cash flow hedges 159 136 115 Add liabilities for preferred shares and capital instruments 4,909 4,884 4,119 Total capital $ 37,664 $ 35,800 $ 31,115
New business embedded value (“NBEV”) is the change in shareholders’ economic value as a result of sales in the reporting period. NBEV is calculated as the present value of expected future earnings, after the cost of capital, on actual new business sold in the period using future mortality, morbidity, policyholder behaviour, expense and investment assumptions that are consistent with the assumptions used in the valuation of our policy liabilities. The principal economic assumptions used in the NBEV calculations in 3Q14 were as follows:
Sales are measured according to product type: For individual insurance, sales include 100% of new annualized premiums and 10% of both excess and single premiums. For individual insurance, new annualized premiums reflect the annualized premium expected in the first year of a policy that requires premium payments for more than one year. Single premium is the lump sum premium from the sale of a single premium product, e.g. travel insurance. Sales are reported gross before the impact of reinsurance.
For group insurance, sales include new annualized premiums and administrative services only premium equivalents on new cases, as well as the addition of new coverages and amendments to contracts, excluding rate increases.
For individual wealth management contracts, all new deposits are reported as sales. This includes individual annuities, both fixed and variable; mutual funds; and, college savings 529 plans. Sales also include bank loans and mortgages authorized in the period. As we have discontinued sales of new VA contracts in the U.S., beginning in the first quarter of 2013, subsequent deposits into existing U.S. VA contracts are not reported as sales.
For group pensions/retirement savings, sales of new regular premiums and deposits reflect an estimate of expected deposits in the first year of the plan with the Company. Single premium sales reflect the assets transferred from the previous plan provider. Total sales include both new regular and single premiums and deposits. Sales include the impact of the addition of a new division or of a new product to an existing client. F2 Key planning assumptions and uncertainties Manulife’s 2016 management objectives25 do not constitute guidance and are based on certain key planning assumptions, including: current accounting and regulatory capital standards; no acquisitions; equity market and interest rate assumptions consistent with our long-term assumptions, and favourable investment-related experience included in core earnings.
25 See “Caution regarding forward-looking statements” below.
November 13, 2014 – Press Release Reporting Third Quarter Results 37
F3 Caution regarding forward-looking statements From time to time, MFC makes written and/or oral forward-looking statements, including in this document. In addition, our representatives may make forward-looking statements orally to analysts, investors, the media and others. All such statements are made pursuant to the “safe harbour” provisions of Canadian provincial securities laws and the U.S. Private Securities Litigation Reform Act of 1995.
The forward-looking statements in this document include, but are not limited to, statements with respect to the anticipated benefits and costs of the acquisition of the Canadian-based operations of Standard Life plc, the anticipated effect of the acquisition on Manulife’s strategy, operations and financial performance, including its EPS, earnings capacity, capital and MCCSR ratio, dividends, financial leverage, 2016 management objectives for core earnings and Core ROE, products, services and capabilities, earnings contributions, cost savings and transition and integration costs, revenue synergies, statements with respect to the financing structure for the acquisition and the completion of and timing for completion of the acquisition, statements with respect to our 2016 management objectives for core earnings and core ROE, and statements with respect to the potential impact of revisions to the Canadian Actuarial Standards Board standard related to economic reinvestment assumptions used in the valuation of insurance and investment contract liabilities.
The forward-looking statements in this document also relate to, among other things, our objectives, goals, strategies, intentions, plans, beliefs, expectations and estimates, and can generally be identified by the use of words such as “may”, “will”, “could”, “should”, “would”, “likely”, “suspect”, “outlook”, “expect”, “intend”, “estimate”, “anticipate”, “believe”, “plan”, “forecast”, “objective”, “seek”, “aim”, “continue”, “goal”, “restore”, “embark” and “endeavour” (or the negative thereof) and words and expressions of similar import, and include statements concerning possible or assumed future results. Although we believe that the expectations reflected in such forward-looking statements are reasonable, such statements involve risks and uncertainties, and undue reliance should not be placed on such statements and they should not be interpreted as confirming market or analysts’ expectations in any way.
Certain material factors or assumptions are applied in making forward-looking statements, including that: the acquisition financing is completed as outlined in this document; that the acquisition will be completed in the first quarter of 2015; estimates for 2015 and 2016 EPS; estimated after-tax cost savings, including estimated savings as a result of synergies from areas such as information technology, real estate and personnel costs; estimated integration costs; revenue synergies increasing over time; and, in the case of MFC’s 2016 management objectives for core earnings and core ROE, the assumptions described under "Key Planning Assumptions and Uncertainties" in our 2013 Annual Report and in this document, and actual results may differ materially from those expressed or implied in such statements.
Important factors that could cause actual results to differ materially from expectations include but are not limited to: the factors identified in “Key Planning Assumptions and Uncertainties” in our 2013 Annual Report and in this document; general business and economic conditions (including but not limited to the performance, volatility and correlation of equity markets, interest rates, credit and swap spreads, currency rates, investment losses and defaults, market liquidity and creditworthiness of guarantors, reinsurers and counterparties); changes in laws and regulations; changes in accounting standards; our ability to execute strategic plans and changes to strategic plans; downgrades in our or Standard Life Financial Inc.’s or Standard Life Investments Inc.’s insurance subsidiary’s financial strength or credit ratings; our ability to maintain our reputation; impairments of goodwill or intangible assets or the establishment of provisions against future tax assets; the accuracy of estimates relating to morbidity, mortality and policyholder behaviour; the accuracy of other estimates used in applying accounting policies and actuarial methods; our ability to implement effective hedging strategies and unforeseen consequences arising from such strategies; our ability to source appropriate assets to back our long dated liabilities; level of competition and consolidation; our ability to market and distribute products through current and future distribution channels, including through our proposed collaboration arrangements with Standard Life plc; unforeseen liabilities or asset impairments arising from acquisitions and dispositions of businesses, including with respect to the acquisition of the Canadian-based operations of Standard Life plc; the realization of losses arising from the sale of
November 13, 2014 – Press Release Reporting Third Quarter Results 38
investments classified as available-for-sale; our liquidity, including the availability of financing to satisfy existing financial liabilities on expected maturity dates when required; obligations to pledge additional collateral; the availability of letters of credit to provide capital management flexibility; accuracy of information received from counterparties and the ability of counterparties to meet their obligations; the availability, affordability and adequacy of reinsurance; legal and regulatory proceedings, including tax audits, tax litigation or similar proceedings; our ability to adapt products and services to the changing market; our ability to attract and retain key executives, employees and agents; the appropriate use and interpretation of complex models or deficiencies in models used; political, legal, operational and other risks associated with our non-North American operations; acquisitions and our ability to complete acquisitions including the availability of equity and debt financing for this purpose, including with respect to the acquisition and integration of Standard Life Financial Inc. and Standard Life Investments Inc. and their subsidiaries; the failure to realize some or all of the expected benefits of the acquisition of the Canadian-based operations of Standard Life plc; the disruption of or changes to key elements of the Company’s or public infrastructure systems; environmental concerns; and our ability to protect our intellectual property and exposure to claims of infringement.
Additional information about material risk factors that could cause actual results to differ materially from expectations and about material factors or assumptions applied in making forward-looking statements may be found in the body of this document as well as under “Risk Factors” in our most recent Annual Information Form, under “Risk Management”, “Risk Management and Risk Factors” and “Critical Accounting and Actuarial Policies” in the Management’s Discussion and Analysis in our most recent annual report, under “Risk Management and Risk Factors Update” and “Critical Accounting and Actuarial Policies” in the Management’s Discussion and Analysis in our most recent interim report, in the “Risk Management” note to consolidated financial statements in our most recent annual and interim reports and elsewhere in our filings with Canadian and U.S. securities regulators.
There can be no assurance that the proposed acquisition of the Canadian-based operations of Standard Life plc will occur or that the anticipated benefits and effects of the acquisition will be realized. The acquisition is subject to various regulatory approvals, including from the Canadian Minister of Finance and certain securities regulatory authorities, and the fulfillment of certain conditions and there can be no assurance that any such approvals will be obtained and/or any such conditions will be met. The proposed acquisition could be modified, restructured or terminated.
The forward-looking statements in this document are, unless otherwise indicated, stated as of the date hereof and are presented for the purpose of assisting investors and others in understanding our financial position and results of operations, our future operations if the acquisition is completed, as well as our objectives and strategic priorities, and may not be appropriate for other purposes. We do not undertake to update any forward-looking statements, except as required by law.
The pro forma financial information set forth in this document should not be considered to be what the actual financial position or other results of operations would have necessarily been had MFC, Standard Life Financial Inc. and Standard Life Investments Inc. operated as a single combined company as at, or for, the periods stated.
November 13, 2014 – Press Release Reporting Third Quarter Results 39
Consolidated Statements of Income
For the three months ended September 30, (Canadian $ in millions except per share amounts, unaudited) 2014 2013
Revenue Net premiums $ 4,641 $ 4,369
Investment income Investment income 2,618 2,483
Realized and unrealized gains (losses) on assets supporting insurance and investment contract liabilities and on the macro hedge program(1) 1,561 (2,513)
Other revenue 2,215 1,966 Total revenue $ 11,035 $ 6,305
Contract benefits and expenses To contract holders and beneficiaries Gross claims and benefits $ 5,111 $ 4,604
Change in insurance contract liabilities 2,875 (898) Change in investment contract liabilities 40 52 Benefits and expenses ceded to reinsurers (1,668) (1,660) Change in reinsurance assets 369 383
Net benefits and claims $ 6,727 $ 2,481 General expenses 1,184 1,097 Investment expenses 304 288 Commissions 1,065 983 Interest expense 284 265 Net premium taxes 79 73 Total contract benefits and expenses $ 9,643 $ 5,187
Income before income taxes $ 1,392 $ 1,118 Income tax (expense) recovery (287) (172) Net income $ 1,105 $ 946
Net income (loss) attributed to: Non-controlling interests $ 9 $ 20
Net income attributed to shareholders $ 1,100 $ 1,034 Preferred share dividends (28) (33) Common shareholders' net income $ 1,072 $ 1,001
Earnings per share: Basic earnings per common share $ 0.58 $ 0.54
Diluted earnings per common share 0.57 0.54
(1) The realized and unrealized gains (losses) on assets supporting insurance and investment contract liabilities are mostly offset by changes in the measurement of our policy obligations. For fixed income assets supporting insurance and investment contracts, equities supporting pass-through products and derivatives related to variable annuity hedging programs, the impact of realized/unrealized gains (losses) on the assets is largely offset in the change in insurance and investment contract liabilities. The realized/unrealized gains (losses) on assets supporting insurance and investment contract liabilities related primarily to the impact of interest rate changes on bond and fixed income derivative positions as well as interest rate swaps supporting the dynamic hedge program. See Section B5 above.
November 13, 2014 – Press Release Reporting Third Quarter Results 40
Consolidated Statements of Financial Position As at
(Canadian $ in millions, unaudited) September 30,
2014 December 31,
2013
Assets Cash and short-term securities $ 17,971 $ 13,630
Debt securities 129,586 114,957 Public equities 14,074 13,075 Mortgages 38,638 37,558 Private placements 22,100 21,015 Policy loans 7,720 7,370 Loans to bank clients 1,786 1,901 Real estate 10,204 9,708 Other invested assets 15,763 13,495 Total invested assets $ 257,842 $ 232,709
Other assets Accrued investment income $ 1,901 $ 1,813
Outstanding premiums 749 734 Derivatives 13,385 9,673 Reinsurance assets 18,052 17,443 Deferred tax assets 3,188 2,763 Goodwill and intangible assets 5,393 5,298 Miscellaneous 4,408 3,324 Total other assets $ 47,076 $ 41,048 Segregated funds net assets $ 250,406 $ 239,871 Total assets $ 555,324 $ 513,628
Investment contract liabilities 2,568 2,524 Deposits from bank clients 19,781 19,869 Derivatives 8,367 8,929 Deferred tax liabilities 1,343 617 Other liabilities 12,614 10,383
$ 261,356 $ 235,564
Long-term debt 3,843 4,775 Liabilities for preferred shares and capital instruments 4,909 4,385 Liabilities for subscription receipts 2,214 - Segregated funds net liabilities 250,406 239,871 Total liabilities $ 522,728 $ 484,595
Equity Preferred shares $ 2,447 $ 2,693
Common shares 20,548 20,234 Contributed surplus 266 256 Shareholders' retained earnings 7,301 5,294 Shareholders' accumulated other comprehensive income (loss) on:
Pension and other post-employment plans (462) (452) Available-for-sale securities 619 324 Cash flow hedges (159) (84) Translation of foreign operations 1,481 258
Total shareholders' equity $ 32,041 $ 28,523 Participating policyholders' equity 96 134 Non-controlling interests 459 376 Total equity $ 32,596 $ 29,033 Total liabilities and equity $ 555,324 $ 513,628