Solder/Substrate Interfacial Reactions in Sn-Cu-Ni Interconnection System H. Yu, V. Vuorinen and J. K. Kivilahti Lab. of Electronics Production Technology Helsinki University of Technology P.O.Box 3000, FIN-02015 HUT, Finland Abstract For having better understanding of the effects of interconnection microstructures on the reliability of soldered assemblies, one of the most important ternary systems used in electronics, the Sn-Cu-Ni system, has been assessed thermodynamically. Based on the data obtained, some recent experimental observations related to the formation of interfacial intermetallic compounds in solder interconnections have been studied analytically. Firstly, the effect of Cu-content on the formation of the interfacial intermetallic compounds between SnAgCu solder alloys and Ni-substrate was investigated. The critical Cu-content for (Cu,Ni) 6 Sn 5 formation was evaluated as a function of temperature. Secondly, it was analyzed how the Ni dissolved in Cu 6 Sn 5 compound affects the driving forces for the diffusion of components and hence the growth kinetics of (Cu,Ni) 6 Sn 5 and (Cu,Ni) 3 Sn reaction layers. With the thermodynamic description other experimental observations related to the Sn-Cu-Ni system can be rationalized as well. The system can be utilized also as a subsystem for industrially important higher order solder systems. Introduction Components of novel electronic products of ever higher functionality and performance are experiencing increasingly harsh loadings. These loadings include, for example, higher local heat dissipation fluxes, stronger mechanical or thermomechanical shocks and higher electrical current densities. Therefore, the reliability of solder interconnections is becoming more sensitively dependent on the formation and evolution of their microstructures. Due to the complexities of new solder metallurgies, the fundamental understanding of the microstructural evolutions of solder interconnections cannot be achieved merely by experimental work, at least not as cost-effectively as it is expected today. The chemical modelling methods, which have been proved to be so successful in material science and metallurgy for decades, can be utilized effectively also in studying the reactions between dissimilar materials in electrical interconnections 1 . It is well-known that Ni(P)/Au finishes are often used as printed wiring boards (PWB) coatings or under bump metallizations (UBM) of components. Recently, Ni is also used as an alloying element in solder pastes in order to improve the reliability 2,3 . For these reasons, among other things, Sn-Cu-Ni is probably the most important and widely investigated ternary system involved in soldering metallurgy. Even though numerous experimental observations on this system have been reported in literature, quantitative analyses of the results are not yet available, mainly due to the lack of reliable thermodynamic and diffusion-kinetic descriptions of the system. Thermodynamics provides an effective tool in presenting phase equilibrium information, which is needed, for example, while investigating interfacial reactions between solder alloys and component metallizations. For instance, the interfacial 1 Manuscript to be published in Journal of Electronic Materials, with permission from The Minerals, Metals & Materials Society (TMS)
Transcript
Solder/Substrate Interfacial Reactions in Sn-Cu-Ni Interconnection System
H. Yu, V. Vuorinen and J. K. Kivilahti Lab. of Electronics Production Technology
Helsinki University of Technology P.O.Box 3000, FIN-02015 HUT, Finland
Abstract
For having better understanding of the effects of interconnection
microstructures on the reliability of soldered assemblies, one of the most important ternary systems used in electronics, the Sn-Cu-Ni system, has been assessed thermodynamically. Based on the data obtained, some recent experimental observations related to the formation of interfacial intermetallic compounds in solder interconnections have been studied analytically. Firstly, the effect of Cu-content on the formation of the interfacial intermetallic compounds between SnAgCu solder alloys and Ni-substrate was investigated. The critical Cu-content for (Cu,Ni)6Sn5 formation was evaluated as a function of temperature. Secondly, it was analyzed how the Ni dissolved in Cu6Sn5 compound affects the driving forces for the diffusion of components and hence the growth kinetics of (Cu,Ni)6Sn5 and (Cu,Ni)3Sn reaction layers. With the thermodynamic description other experimental observations related to the Sn-Cu-Ni system can be rationalized as well. The system can be utilized also as a subsystem for industrially important higher order solder systems.
Introduction
Components of novel electronic products of ever higher functionality and performance are experiencing increasingly harsh loadings. These loadings include, for example, higher local heat dissipation fluxes, stronger mechanical or thermomechanical shocks and higher electrical current densities. Therefore, the reliability of solder interconnections is becoming more sensitively dependent on the formation and evolution of their microstructures. Due to the complexities of new solder metallurgies, the fundamental understanding of the microstructural evolutions of solder interconnections cannot be achieved merely by experimental work, at least not as cost-effectively as it is expected today. The chemical modelling methods, which have been proved to be so successful in material science and metallurgy for decades, can be utilized effectively also in studying the reactions between dissimilar materials in electrical interconnections1.
It is well-known that Ni(P)/Au finishes are often used as printed wiring boards (PWB) coatings or under bump metallizations (UBM) of components. Recently, Ni is also used as an alloying element in solder pastes in order to improve the reliability2,3. For these reasons, among other things, Sn-Cu-Ni is probably the most important and widely investigated ternary system involved in soldering metallurgy. Even though numerous experimental observations on this system have been reported in literature, quantitative analyses of the results are not yet available, mainly due to the lack of reliable thermodynamic and diffusion-kinetic descriptions of the system.
Thermodynamics provides an effective tool in presenting phase equilibrium information, which is needed, for example, while investigating interfacial reactions between solder alloys and component metallizations. For instance, the interfacial
1
Manuscript to be published in Journal of Electronic Materials, with permission from The Minerals, Metals & Materials Society (TMS)
intermetallic compound formed between Sn-based solders and Ni substrate could be either (Cu,Ni)6Sn5 or (Ni,Cu)3Sn4 - depending on the Cu-contents of the solders. When the ternary Sn3.5AgCu solders are used, the critical Cu-content needed for (Cu,Ni)6Sn5 formation has been estimated4, but its variations with Ag-content and temperature are still unclear. The temperature dependence of the critical Cu-content is especially important considering the temperature variation in reflow soldering. Once the description of the Sn-Cu-Ni system is well established on the basis of critical assessments, thermodynamic calculations can be utilised for evaluating these effects.
The studies on microstructural evolutions such as the formation and growth of interfacial intermetallic compounds are becoming more and more dependent on kinetic analyses, for which thermodynamics provides fundamental quantitative basis. As an example, when the Ni-content is low (<5 at-%) in the Sn|(Cu,Ni) reaction couples (Cu,Ni)6Sn5 layer grows exceptionally fast and the (Cu,Ni)3Sn beneath is relatively thin and porous. When the Ni-content of the (Cu,Ni) substrate exceeds 10 at-%, (Cu,Ni)3Sn is not any more detectable by means of the scanning electron microscopy5-7.
The present paper attempt to investigate the above-mentioned experimental observations with the help of thermodynamic and diffusion kinetic analyses. Since the description of the whole Sn-Cu-Ni system is not available, thermodynamic assessment will be carried out to extend the previous description in the Cu-Ni side8 to the Sn-rich region.
Thermodynamic Assessment of the Sn-Cu-Ni system
There are only a few thermodynamic analyses of the Sn-Cu-Ni system
reported in literature. It was partly assessed by Miettinen8, but limited only to the Cu-Ni side and to high temperatures, which are not interesting from the electronics manufacturing and reliability point of view. A preliminary calculation on the solubility of Ni in (Cu,Ni)6Sn5 was performed previously9, but more quantitative results are still required and a critical thermodynamic assessment of the Sn-rich region is necessary.
1) Thermodynamic Model When carrying out the thermodynamic assessment of a system, it is important
to select suitable thermodynamic models for all the phases. The most commonly used models are the substitutional solution model and the sublattice models10. The substitutional solution model is relatively simple and appropriate for liquid or other solution phases. It assumes that all the elements are nearly randomly mixed. In the Sn-Cu-Ni system, its expression of Gibbs free energy is:
( )
( ) ( )[ ]( ) ( )[ ]( ) ( )[ ]
[ ]2,,
1,,
0,,
22,
1,
0,
22,
1,
0,
22,
1,
0,
lnlnln
SnNiCuSnSnNiCuNiSnNiCuCuSnNiCu
NiCuNiCuNiCuNiCuNiCuNiCu
SnNiSnNiSnNiSnNiSnNiSnNi
SnCuSnCuSnCuSnCuSnCuSnCu
NiNiCuCuSnSnoNiNi
oCuCu
oSnSn
Solm
IxIxIxxxx
xxIxxIIxx
xxIxxIIxx
xxIxxIIxx
xxxxxxRTGxGxGxG
+++
−+−++
−+−++
−+−++
+++++=
(1)
2
where xCu, xNi, and xSn are the mole fractions of the elements, , , and are the standard Gibbs energies of components from standard SGTE database,
oCuG o
NiG oSnG
I denotes interaction parameters of different orders.
The sublattice model assumes there are several independent sublattices with fixed mole fractions. It is suitable for those phases with superlattical structure like intermetallic compounds. Depending on how elements are located in the sublattices, different types of homogeneity ranges can be produced. In the Sn-Cu-Ni system, the compounds of fixed Sn-content can be regarded as line compounds by using the sublattice model. For example, the model (Cu,Ni)0.75Sn0.25 can be applied to the phases along the line xSn=0.25. It assumes that Sn atoms occupy one sublattice while Cu and Ni mix with each other in the other sublattice. The Gibbs energy is formulated as
( ) [ ]
[ ]1,
0,
,
75.0
lnln75.025.075.025.075.0
25.075.0
NICuNiCuNICuNiCu
NiNiCuCuo
SnNiNio
SnCuCuSnNiCu
m
IyyIyy
yyyyRTGyGyG
++
+++= (2)
where yCu, yNi, are Cu and Ni fractions in their own sublattice and yCu+yNi=1,
and are the Gibbs energies of the compound components
Cu
oSnCuG
25.075.0
oSnNiG
25.075.0
0.75Sn0.25 and Ni0.75Sn0.25, and are the interaction parameters between Cu and Ni.
0,NICuI 1
,NICuI
Because very narrow homogeneity range of Cu6Sn5 has been reported in the binary Sn-Cu system, (Cu,Ni)6Sn5 was treated as line compound previously9. However, recent experimental data revealed that xSn of (Cu,Ni)6Sn5 varies in a slightly wider range than that in the binary system5,11. Since (Cu,Ni)6Sn5 is important in soldering interfacial reactions, more advanced thermodynamic model is preferred.
Cu6Sn5 has the same NiAs-Ni2In (B8) type structure12 as Ni3Sn2, in which Sn atoms form a hexagonal close-packed array. Cu or Ni atoms take up all the octahedral interstices and parts of trigonal bipyramidal interstices formed by Sn atoms. About 20% and 50% of the bipyramidal interstices are occupied in Cu6Sn5 and Ni3Sn2 respectively. Filled and unfilled bipyramidal interstices are distributed randomly at high temperatures and arranged in an ordered manner at low temperatures. Based on such a structure, the thermodynamic model Ni1Sn1(Ni,Va)1 has been proposed for Ni3Sn2 in the previous assessment of Ni-Sn system13. It can be extended to (Cu,Ni)1Sn1(Cu,Ni,Va)1 in order to describe the homogeneity ranges in the ternary system. In the third sublattice of the model, vacancies (Va) simulate the existence of unfilled bipyramidal interstices. The Gibbs free energy function of the model is,
[ ][ ] phaseB
mEIII
VaIIIVa
IIINi
IIINi
IIICu
IIICu
INi
INi
ICu
ICuNiSnVa
IIIVa
INiNiSnNi
IIINi
INi
NiSnCuIIICu
INiCuSnVa
IIIVa
ICuCuSnNi
IIINi
ICuCuSnCu
IIICu
ICu
phaseBm
GyyyyyyRT
yyyyRTGyyGyy
GyyGyyGyyGyyG
_8
_8
lnlnln
lnln
+++
++++
++++=
(3)
Here is the mole fraction of the component X in the n-th sublattice, is an excess Gibbs energy composed of various interaction terms in the sublattices. The formula in denotes one of the hypothetical compounds CuSnCu, CuSnNi,
CuSnVa, NiSnCu, NiSnNi, NiSnVa, and is its Gibbs energy. For each
nXy phaseB
mEG _8
[ formulaG ]
][ formulaG
3
hypothetical compound, the values of for Cu[ formulaG ] 6Sn5 and Ni3Sn2 should not differ from each other significantly because of the structural similarity. Restrictions on the differences between these parameters are applied accordingly to avoid unrealistic results during the optimisation.
Ghosh13 has also introduced a model, Ni1Sn1(Ni,Va)0.5(Ni,Va)0.5, for the ordered (η′) Ni3Sn2 phase. With the help of ordering energy, the parameters of this model are directly related to the model above so that the transition between η-Ni3Sn2 and η′-Ni3Sn2 can be described. Such an approach is found to be inapplicable for the ordering of Cu6Sn5 due to its unequal numbers of filled and unfilled bipyramidal interstices. In fact, a recent study suggested that the transformation between η-Cu6Sn5 and η′-Cu6Sn5 is not of pure order-disorder type14, so it is possible to use a separate model for η′-Cu6Sn5. With the temperature and enthalpy change of the transition available13, this can be easily done in the binary Cu-Sn system. However, due to the lack of experimental information, the simulations of the homogeneity ranges of η′-Cu6Sn5 and η′-Ni3Sn2 in the ternary region are subject to uncertainties and therefore require more experimental work.
On the other hand, because Ni3Sn2 is usually not observed in solder interconnections and because η-η′ transformation of Cu6Sn5 is likely to occur only at relatively high annealing temperatures (>170°C) within reasonable timescale 15, the η-η′ transition of Cu6Sn5 and Ni3Sn2 will be ignored in this work. Such a simplification is supported also by the facts that the Gibbs energies of η and η′ phases have only small difference. As an example, neglecting the ordering of Ni3Sn2 does not cause noticeable change to our calculated homogeneity range of Ni3Sn2 in the binary Ni-Sn system. Nevertheless, if the necessity of investigating such transitions emerges and more experimental data appear in the future, the descriptions of η′ phases can be easily appended later.
As to the other important compound in solder interconnection, Ni3Sn4, the thermodynamic model, (Cu,Ni)1(Cu,Ni,Va)1Sn2, is chosen based on its CoGe-type structure16.
2) The binary systems Sn-Cu and Sn-Ni Because well-defined binary systems are the basis of assessing higher order
systems, their consistency is important. Among the three sub-binary systems of the Sn-Cu-Ni system, Cu-Ni is relatively simple and its description is available in the SGTE standard binary database17. The descriptions of the other two binary systems, Sn-Cu and Sn-Ni, need to be studied in more details.
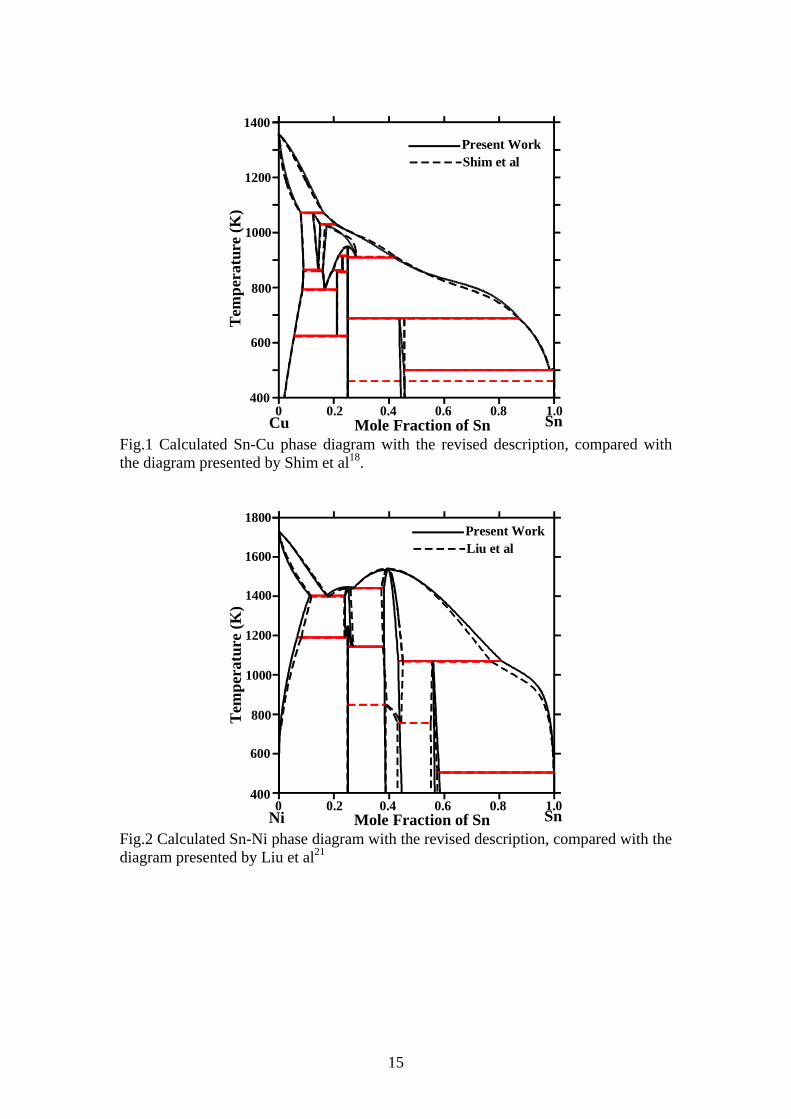
The most commonly used description of the Sn-Cu system was presented by Shim et al18. The system was recently reassessed by Liu et al19 in order to improve the description of the ordering of the BCC phase. Since the ordering of BCC is not relevant to soldering metallurgy, the description of Shim et al is adopted in order to avoid complicate thermodynamic models in the Cu side. However, the stoichiometric model of Cu6Sn5 in this description is not consistent with the model we proposed for (Cu,Ni)6Sn5. It is therefore modified and Fig.1 compares the calculated Sn-Cu phase diagram with Shim et al’s results. The calculated xSn of Cu6Sn5 are 0.437 in the peritectic equilibrium L+Cu3Sn⇒Cu6Sn5 and 0.455 in the eutectic equilibrium L⇒β-Sn+Cu6Sn5. They agree with the reported experimental values of 0.435 and 0.45520, indicating that the homogeneity range of Cu6Sn5 is simulated successfully.
4
The Sn-Ni system was first assessed by Ghosh 13. This description is widely adopted despite the fact that the extrapolated liquid/FCC equilibrium is abnormal. This is not critical for applications related to Ni-rich side but is not optimal when studying soldering metallurgy. Liu et al21 managed to correct this problem and presented a new description of the Sn-Ni system. It is slightly modified in this work for two reasons: 1) The calculated metastable solubility of Ni in liquid is still high considering the generally acknowledged rule that metastable solubility is normally 3-5 times of stable solubility in metallic systems; 2) The models for some phases, especially Ni3Sn2, Ni3Sn4, needed to be changed so that they are consistent with the models in the ternary system. Fig.2 shows the calculated Sn-Ni phase diagram together with Liu’s results. It is to be noticed that the ordering of Ni3Sn2 is ignored in the present work.
3) The ternary system A partial assessment of Sn-Cu-Ni system up to xSn=0.25 has been carried out
by Miettinen8. The experimental data available in the Cu-Ni side22, including the Cu3Sn-Ni3Sn isopleth23,24, were utilized in his assessment. However, the phases commonly found in solder interconnections, Cu6Sn5 and Ni3Sn4, were not included. The extension of the description to the Sn-rich region is necessary and it is enabled by recent experimental investigations. Three isothermal sections at 800°C, 240°C, 235°C were proposed by Wang and Chen25, Lin et al26 and Oberndorff27. Oberndorff reported a ternary phase 45Sn29Cu26Ni and small solubilities of third elements in the binary compounds (Cu6Sn5, Ni3Sn and Ni3Sn2). Considering the long annealing time used, 45Sn29Cu26Ni is likely to be a stable phase but with difficulty in forming as interfacial reaction product. It is therefore out of our interest and the experimental results of the other two studies are used in this work.
Some investigations on interfacial reaction also offered phase equilibrium information in the Sn-Cu-Ni system. Chen et al7 examined the intermetallic compounds formation at the interfaces in a multilayer Sn/Cu/Sn/Ni/Sn/Cu/Sn specimen at 240°C; Ho et al4 investigated the formations of Cu6Sn5 and Ni3Sn4 at liquid SnAgCu solder/Ni substrate interface. The results from these studies are also used in our assessment.
The previous description in the Cu-Ni side8 is adopted as a starting point in assessing the Sn-rich part. However, some modifications are made due to the changes both in some binary parameters and in the models of some phases.
Verification of the Description
With the assessment in Sn-rich side, a complete description of ternary Sn-Cu-
Ni system is established. Table.1 lists the parameters obtained in the present work and the other parameters in the system can be found in literature8,18,21. The new description reproduces most of Miettinen’s results in Cu-Ni side, including the mixing enthalpies of liquid, liquidus surfaces, isothermal sections, and isopleths. Noticeable changes of the results are only in the Cu3Sn-Ni3Sn isopleth.
Lin et al26 suggested that Cu3Sn and Ni3Sn form a continuous solid solution at 240°C, which can not be true because the structures of Cu3Sn (o-64) and Ni3Sn (hP8) are different. However, their observation that there is no three-phase region along the xSn=0.25 line is likely to be true. It indicates that only those phases of xSn=0.25 appear in the soldering temperature range of the Cu3Sn-Ni3Sn isopleth. Besides Cu3Sn and
5
Ni3Sn, two ternary compounds reported24 in literature contain this amount of Sn, orthorhombic Γ1 (oP8) and cubic Γ2 (cF4). The deformed variant of Γ1 was also referred as another phase denoted as Γ3. Additionally, γ′ (cF16) phase forms a continuous solution between Cu4Sn and Ni3Sn at high temperature so that it should also occur in the diagram. Because the experimental information of Γ2 and Γ3 are insufficient, they were not considered in Mittinen’s assessment and are also neglected in this paper. Hence, four solid phases, Cu3Sn (ε), Ni3Sn (γ1), Γ1, and γ′, appears in the calculated Cu3Sn-Ni3Sn isopleth in Fig.3.
Since Lin et al did not observe any two-phase equilibrium along the xSn=0.25 line at 240°C, the phases mentioned above are likely to have wide homogeneity ranges. Actually, the mole fraction of Cu in Γ1 was reported to be between 8-18 at.% and the solubility of Ni in Cu3Sn is at least several percents according to Lin et al. For this reason, their homogeneity ranges are all simulated by applying the model (Cu,Ni)0.75Sn0.25, which is different from Miettinen’s description and results some changes in the calculated Cu3Sn-Ni3Sn isopleth.
It is interesting to note that very complicate phase diagram of the Cu3Sn-Ni3Sn isopleth was proposed in some previous studies22,23. Because all the solid phases in the isopleth have limited range of Sn-content, other phases have to take part into phase equilibria if the isopleth moves slightly away from the xSn=0.25 line. The phases to be occurred depends on whether the molar fraction of Sn is higher or lower than 0.25. Experimental studies are therefore very sensitive to small variations of compositions. This is probably the reason for the complexity of the reported phase diagrams.
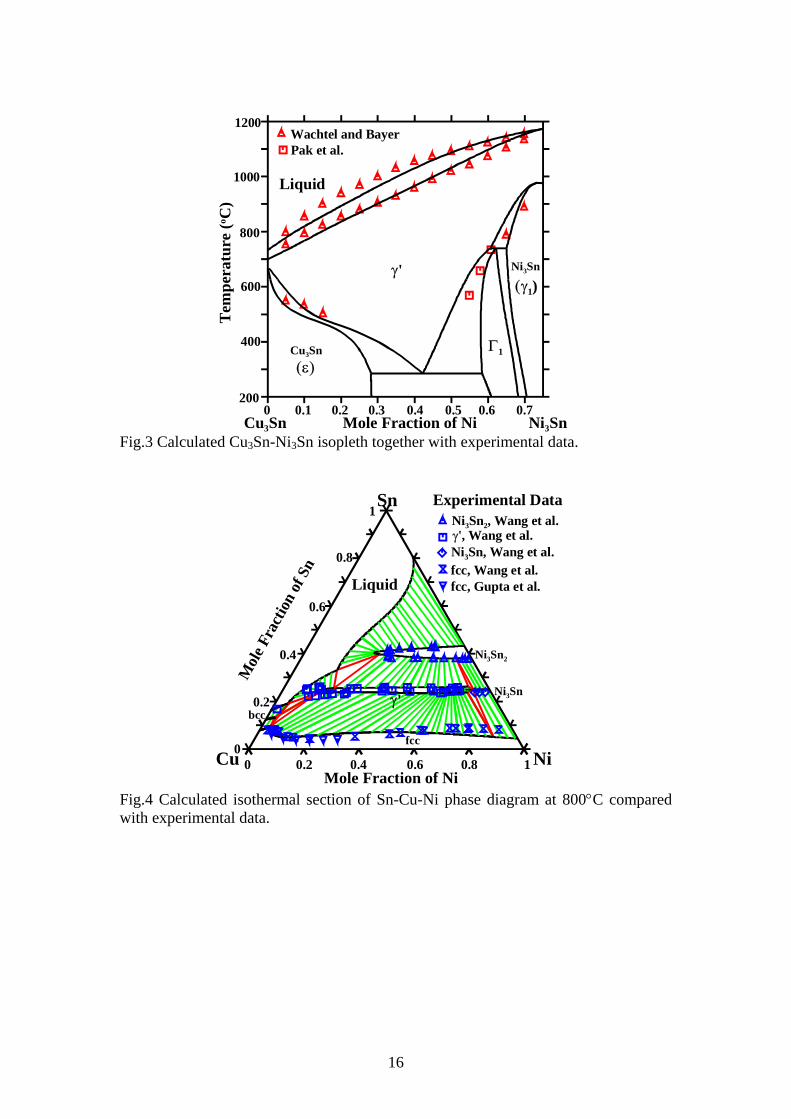
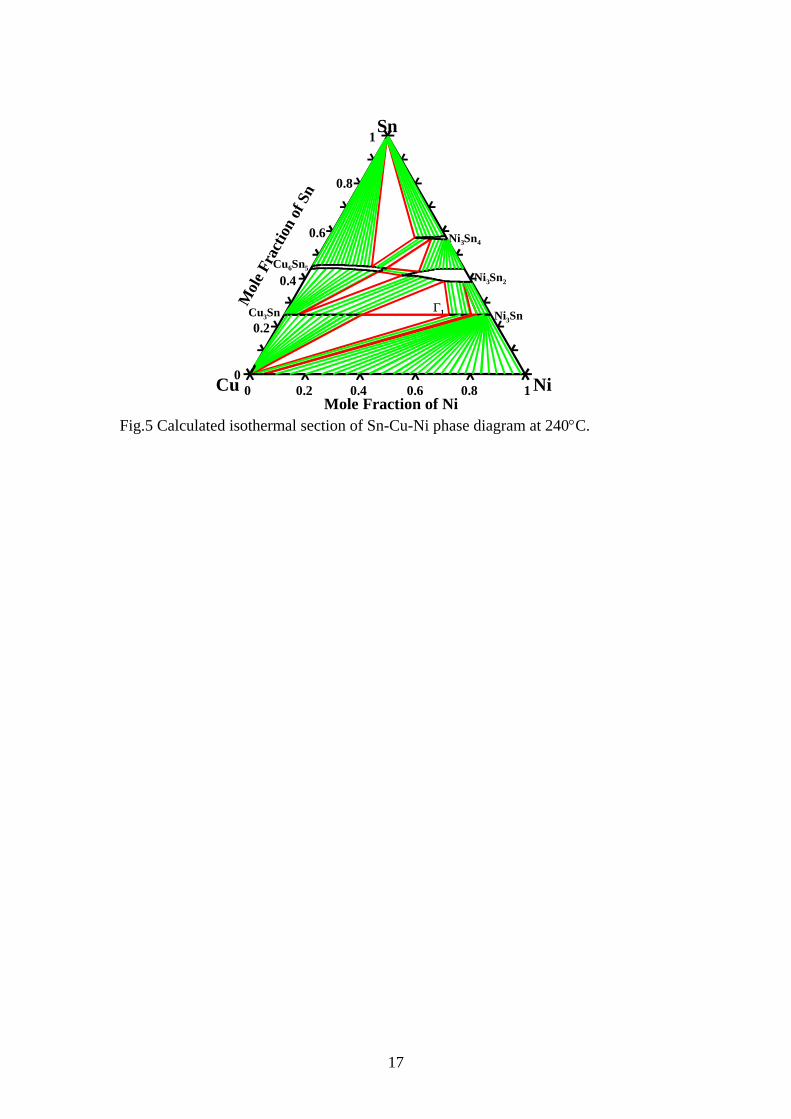
The calculated isothermal sections of Sn-Cu-Ni phase diagram at 800°C and 240°C are shown in Fig.4 and Fig.5. Some results concerning the three-phase equilibriums are listed in Table.2. The agreement between calculated results and experimental information appears to be satisfactory. The calculated homogeneity regions of (Cu,Ni)6Sn5 at different temperatures are presented in Fig.6 together with measured data. In Fig.6 (b), Cu3Sn is suspended so that the calculated metastable homogeneity range is compared with the observed (Cu,Ni)6Sn5 compositions in solid state Sn|(Cu,Ni) reaction couples11, in which Cu3Sn was not observed.
As a summary, the description of the Sn-Cu-Ni system agrees with most of the experimental data available. It enables the thermodynamic calculations required in solder/substrate interfacial reaction studies.
The Formation of (Cu,Ni)6Sn5 and (Ni,Cu)3Sn4
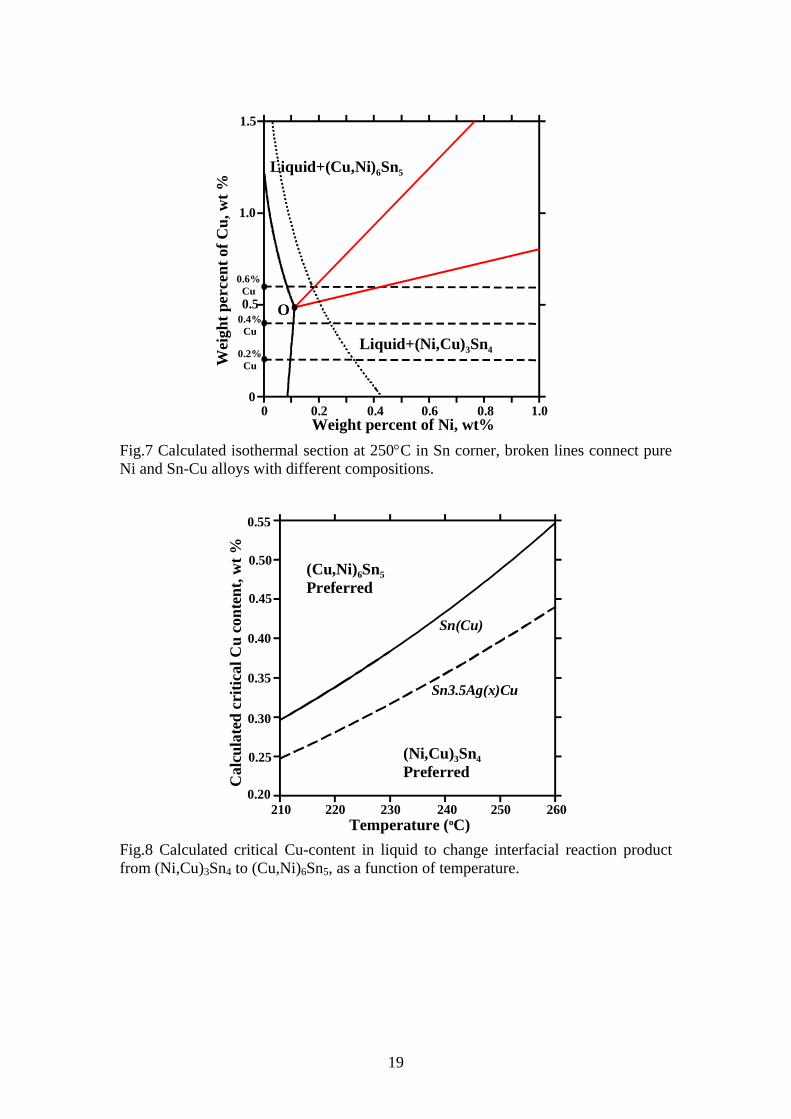
With the description of the Sn-Cu-Ni system, thermodynamic calculation can be directly applied in evaluating some critical phase equilibria data. Normally Ni3Sn4 forms between liquid Sn and solid Ni but the interfacial product changes into (Cu,Ni)6Sn5 by small amounts of Cu in liquid. When the ternary Sn3.5AgCu solders are used, the critical Cu-content needed for (Cu,Ni)6Sn5 formation is between 0.4wt% and 0.5wt% at 250°C according to Ho et al4. Fig.7 shows our calculated isothermal section at 250°C of Sn-Cu-Ni phase diagram near pure Sn. The two-phase regions, L+(Cu,Ni)6Sn5 and L+(Ni,Cu)3Sn4, meet with each other at point O, which is the liquid composition in the three-phase equilibrium L+(Cu,Ni)6Sn5+(Ni,Cu)3Sn4. At the first stage of the interfacial reaction between Sn(Cu) liquid and Ni substrate, Ni dissolves into the liquid and the dotted line is the calculated metastable solubilities of Ni and Cu in liquid Sn. The broken lines connect pure Ni to Sn(Cu) liquid of various
6
Cu-contents. Since the composition of pure Ni is far away from the plotted area, these lines are almost horizontal. For the liquid of any Cu-content, how the connection line passes the two-phase regions decides which compound is preferred to form. If the line passes L+(Cu,Ni)6Sn5 region first, (Cu,Ni)6Sn5 tends to form. If the line passes L+(Ni,Cu)3Sn4 region first, (Ni,Cu)3Sn4 tends to form. In the situation that the line passes closely to the point O, the stabilities of (Cu,Ni)6Sn5 and (Ni,Cu)3Sn4 are comparable and they may coexist at the interface. Hence, the position of point O determines the critical Cu-content required for the formation of (Cu,Ni)6Sn5.
The calculated Cu-content of point O is 0.5 wt% at 250°C in the Sn-Cu-Ni system. However, this value changes if there is any other alloying element, most importantly Ag, in the solder. As the first approximation, the influence of Ag can be evaluated by combining the description of the Sn-Cu-Ni system and some liquid parameters between Ag and other elements (Sn, Cu, and Ni) available in literature. For the ternary SnAgCu solders with 3.5wt% Ag, the calculated critical Cu-content decreases to 0.4 wt%, agreeing well with the experimental observation of Ho et al4
The thermodynamic prediction of critical Cu-content is advantageous because the temperature dependency can be also taken into account, as shown in Fig.8. For the binary SnCu solders, the critical Cu-content increases to 0.6wt% at 260°C, which is supported by our recent experimental investigations. Since reflow soldering is a transient process with both heating and cooling, the change of the critical Cu-content upon temperature may have critical influence on the interfacial structure. These issues are important from the reliability point of view and more detailed analysis will be presented elsewhere5.
When the Ni-content in the substrate is changed or there exist other sources of Ni in interconnection, the situations are different and those connection lines between solder and substrate compositions in Fig.7 are not necessarily near horizontal. Nevertheless, the thermodynamic calculations presented here are helpful and offer fundamental understandings on the (Cu,Ni)6Sn5 and (Ni,Cu)3Sn4 formations at solder/substrate interfaces.
(Cu,Ni)3Sn Shrinkage in Sn|(Cu,Ni) Reaction Couples The formation and growth of interfacial compounds are closely related to the
microstructural evolution of solder interconnections. It is well known that two compounds, Cu3Sn and Cu6Sn5, form between Sn-based solder and Cu substrate. In Sn|(Cu,Ni) reaction couples, Ni tends to dissolve into Cu6Sn5 and the resulted (Cu,Ni)6Sn5 layer grows faster. When the Ni-content in (Cu,Ni) alloy is high enough, Cu3Sn is not observed any more5-7. This phenomenon is of interest because Cu3Sn layer is often abundant with voids.
Growth rates of IMC layers in interfacial reactions are determined by the competition among diffusion fluxes through different reaction layers. The layers with faster diffusions of elements tend to grow quicker and sometimes suppress the growth of the other layers. The diffusion flux of an element i through a thin layer of thickness δ is often presented by its diffusion coefficient Di and concentration gradient ∆Ci/δ according to the Fick’s first law,
δi
iiCDJ ∆
= (4)
7
However, in the case of intermetallic layers of limited homogeneity range, it is more convenient to replace the concentration gradient by chemical potential gradient. Atom mobility should be used instead of diffusion coefficient accordingly. The diffusion flux is then presented as:
VGxMGMCJ iiii
iii δδ∆
=∆
= (5)
Where Ci and xi are the concentration and atomic fraction of element i, Mi is the mobility of i, V is the molar volume of the layer. ∆Gi denotes the chemical potential difference and its gradient, ∆Gi/δ, is the driving force for diffusion.
If we assume the elements’ mobilities and molar volumes are not significantly dependent on Ni-content, when the layer is having a specific thickness, diffusion fluxes are approximately proportional to the product of the mole fraction of diffusing element and its chemical potential difference:
iii GxJ ∆∝ (6)
In the experimental investigation on Kirkendall planes, Paul et al reported that the ratios of intrinsic diffusivities of Cu and Sn in (Cu,Ni)3Sn layer are similar in Sn|Cu and Sn|99Cu1Ni diffusion couples6, which indicates that the mobilities of elements do not vary abruptly with Ni-content. Hence, as a first approximation, the function xi∆Gi can be used as a variable causing the relative change of diffusion flux upon Ni dissolution.
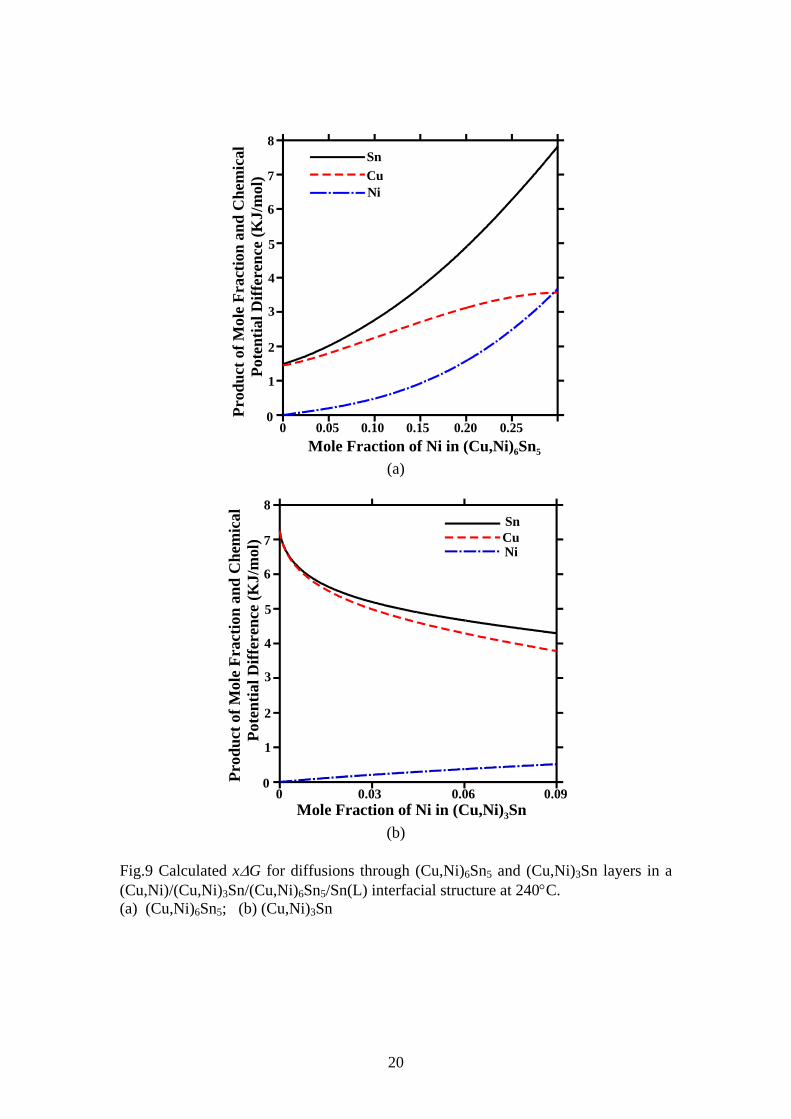
With the thermodynamic description of the Sn-Cu-Ni system, the chemical potential differences can be easily computed so that the function xi∆Gi is obtained. As an example, the calculated xi∆Gi-functions for the diffusion fluxes in liquid-solid Sn|(Cu,Ni) reaction couples at 240°C are shown in Fig.9. The results for the (Cu,Ni)6Sn5 and (Cu,Ni)3Sn layers are presented against their own Ni-contents in Fig.9(a) and Fig.9(b). Assuming local equilibrium at the interface between (Cu,Ni)6Sn5 and (Cu,Ni)3Sn, there is an direct correlation between their Ni-contents, as Fig.10 shows. Once the mole fraction of Ni in (Cu,Ni)3Sn is known, the mole fraction of Ni in (Cu,Ni)6Sn5 is fixed and vice versa. By this means, the impacts of Ni on the diffusion fluxes in both intermetallic layers can be correlated with each other.
Although Fig.9 presents only the results for liquid-solid Sn|(Cu,Ni) reaction couple at 240°C, similar results have been obtained for solid state Sn|(Cu,Ni) diffusion couples at 125°C. They reveal that the xi∆Gi-functions for the diffusion fluxes of all components in (Cu,Ni)6Sn5 significantly increase with the addition of Ni. In the (Cu,Ni)3Sn layer, the xi∆Gi-functions for the Sn and Cu fluxes decrease and that for Ni flux slightly increases with Ni-content.
The changes of the diffusion fluxes as functions of Ni dissolution lead to the domination of (Cu,Ni)6Sn5. In the study on binary Sn|Cu diffusion couples, Paul et al analyzed the growth kinetics of Cu6Sn5 and Cu3Sn layers by measuring the Kirkendall effects with inert markers6,28. Based on this work, the following equation can be derived to evaluate the thickness of Cu3Sn layer:
8
565633
33
65155 98
SnCuSnCuSnCuSnCuSnCuSnCu
SnCuSnCu
JJJJ
tV
−−+=
=
ϕ
ϕδ (7)
where t is time, is the molar volume of CuSnCuV
3 3Sn, is the flux of element i through the IMC layer M. ϕ determines the growth rate of Cu
MiJ
3Sn layer and it is positive in binary Sn|Cu diffusion couple. Since Ni substitute Cu in both (Cu,Ni)6Sn5 and (Cu,Ni)3Sn, for the Sn|(Cu,Ni) diffusion couples the expression of ϕ can be rewritten as:
( ) ( ) 565656333 65155 SnCuSnCuSnCuSnCuSnCuSnCu
SnNiCuSnNiCu JJJJJJ −+−++=ϕ (8)
According to our calculated xi∆Gi-functions, all the diffusion fluxes except
vary in a manner that ϕ value decreases with increasing Ni-content. Because the
Ni-content in (Cu,Ni)
SnCuNiJ 3
3Sn is low, plays a less important role in the equation and thus ϕ value is expected to decrease, which means that the growth of Cu
SnCuNiJ 3
3Sn layer slows down. When Ni-content reaches a critical level, ϕ should become negative and Cu3Sn does not form in the reaction zone. Although the critical level of Ni-content can not be quantitatively determined yet, the above analysis has explained the shrinkage and suppression of (Cu,Ni)3Sn in both liquid-solid and solid-state Sn|(Cu,Ni) reaction couples. More details of the kinetic analysis on the thinning of (Cu,Ni)3Sn and some other corresponding observations are presented in another paper29.
It is to be noticed that the discussion here focuses only on the driving forces of diffusion kinetics. Possible variations of atom mobility have been neglected due to the lack of data. However, such an approach of combined thermodynamic and kinetic analyses still offers a better opportunity of understanding the formation of interfacial structure in solder interconnections.
Summary Based on the critically assessed data, the thermodynamic description of the
Sn-Cu-Ni system has been established in this paper. With the description obtained, the critical Cu-content needed for the formation of either (Cu,Ni)6Sn5 or (Ni,Cu)3Sn4 between Sn-based solders and Ni substrate was calculated. The calculated critical Cu-contents for binary SnCu and ternary Sn3.5AgCu solders at 250°C are 0.5 and 0.4 wt%, respectively. It was interesting to find out that the critical Cu-content and thus the relative stabilities of (Cu,Ni)6Sn5 and (Ni,Cu)3Sn4 will change importantly with temperature.
The description is essential also for the interfacial kinetic analyses related to the formation of intermetallics in solder interconnections. In Sn|(Cu,Ni) reaction couples, the calculated driving forces and xi∆Gi-functions for diffusion indicate that the dissolution of Ni in the intermetallic compounds increases the diffusion fluxes of all the components in (Cu,Ni)6Sn5 layer but decrease the diffusion fluxes of Sn and Cu in (Cu,Ni)3Sn layer. With the help of the description and the growth model
9
proposed by Paul et al, it is possible to explain why (Cu,Ni)6Sn5 becomes dominant phase and why (Cu,Ni)3Sn disappears. In addition, the result will help us to understand better the formation and disappearance of “Kirkendall” voids in solder interconnections.
1383 (2004). 4. C.E.Ho, R.Y.Tsai, Y.L.Lin and C.R.Kao, J. Electron. Mater., 31, 584 (2002). 5. V.Vuorinen, H.Yu, and J.K.Kivilahti, “Formation of the Intermetallic Compounds
between Liquid Sn and Different CuNix Metallizations” (to be published 2006). 6. A.Paul, Doctoral Thesis, Eindhoven University of Technology, The Netherlands
(2004). 7. S.-W.Chen, S.-H.Wu and S.-W.Lee, J. Electron. Mater., 32, 1188 (2003). 8. J.Miettinen, Calphad, 27, 309 (2003). 9. K.Zeng, V.Vuorinen, and J.K.Kivilahti, IEEE T. Compon. Pack. T., 25, 162
(2002). 10. M.Hillert, “Phase Equilibria, Phase Diagrams and Phase Transformations: Their
Thermodynamic Basis”, Cambridge University Press, (1998). 11. J.Hurtig, M.Sc. thesis, Helsinki University of Technology (2006). 12. A.-K.Larsson, L.Stenberg and S.Lidin, Acta. Crystallogr., B50, 636 (1994). 13. G.Ghosh, Metall. Mater. Trans., 30A, 1481 (1999). 14. G.Ghosh, and M.Asta, J.Mater.Res, 20,11,3102,(2005) 15. T.Laurila, V.Vuorinen, and J.K.Kivilahti, Mater. Sci. Eng., R49, 1, (2005). 16. S. Furuseth and H. Fjellvåg, Acta Chem. Scand., A40, 695 (1986). 17. J.-O.Andersson, T. Helander, L.Höglund, P.F.Shi, and B. Sundman, Calphad, 26,
273 (2002). 18. J.-H. Shim, C.-S.Oh, B.-J.Lee and D. N. Lee, Z. Metallkd., 87, 205 (1996). 19. X.J.Liu, C.P.Wang, I.Ohnuma, R.Kainuma, and K.Ishida, Metall. Mater. Trans. A,
35A, 6,1641, (2004). 20. G.V.Raynor, Annotated Equilibrium Diagram Series, No.2, The Institute of
Metals, London (1944). 21. H.S.Liu, J.Wang, and Z.P.Jin, Calphad, 28, 363 (2004). 22. K.P.Gupta, J. Phase Equilib., 21, 479 (2000). 23. E.Wachtel and E.Bayer, Z.Metallkd., 75, 61 (1984). 24. J.S.Lee Pak and K.Mukherjee, Mater. Sci. Eng., A117, 167 (1989). 25. C.-H.Wang and S.-W.Chen, Metall. Mater. Trans., 34A, 2281 (2003). 26. C.-H.Lin, S.-W.Chen, and C.-H.Wang, J. Electron. Mater., 31, 907 (2002). 27. P.Oberndorff, Doctoral Thesis, Eindhoven University of Technology, The
Netherlands 2001. 28. A.Paul, A.Kodentsov, F.J.J van Loo., Z. Metallkd., 95, 913, (2004). 29. H.Yu, V.Vuorinen and J.K.Kivilahti, "Effect of Ni on the formation of Cu6Sn5 and
Cu3Sn intermetallics", IEEE Transactions on Electronics Packaging Manufacturing (in print).
10
List of figures and tables: Figures Fig.1 Calculated Sn-Cu phase diagram with the revised description, compared with the diagram presented by Shim et al18. Fig.2 Calculated Sn-Ni phase diagram with the revised description, compared with the diagram presented by Liu et al21
Fig.3 Calculated Cu3Sn-Ni3Sn isopleth together with experimental data. Fig.4 Calculated isothermal section of Sn-Cu-Ni phase diagram at 800°C compared with experimental data. Fig.5 Calculated isothermal section of Sn-Cu-Ni phase diagram at 240°C. Fig.6 Calculated composition range of (Cu,Ni)6Sn5 in ternary Sn-Cu-Ni system together with experimental data. (a) 240°C; (b) 125°C, with Cu3Sn suspended. Fig.7 Calculated isothermal section at 250°C in Sn corner, broken lines connect pure Ni and Sn-Cu alloys with different compositions. Fig.8 Calculated critical Cu-content in liquid to change interfacial reaction product from (Ni,Cu)3Sn4 to (Cu,Ni)6Sn5, as a function of temperature. Fig.9 Calculated x∆G for diffusions through (Cu,Ni)6Sn5 and (Cu,Ni)3Sn layers in a (Cu,Ni)/(Cu,Ni)3Sn/(Cu,Ni)6Sn5/Sn(L) interfacial structure at 240°C. (a) (Cu,Ni)6Sn5; (b) (Cu,Ni)3Sn Fig.10 Relation between mole fractions of Ni in (Cu,Ni)6Sn5 and (Cu,Ni)3Sn layers at 240°C. Tables Table 1 Thermodynamic data for the Cu-Ni-Sn system modified or obtained in the present work. (Other data of the system were collected from literature8,18,21) Table 2 Comparison between calculated results and experimental data in literature for some three-phase equilibria.
11
Table 1 Thermodynamic data for the Cu-Ni-Sn system modified or obtained in the present work. (Other data of the system were collected from literature8,18,21) Liquid Model: (Cu,Ni,Sn)
Table 2 Comparison between calculated results and experimental data in literature for some three-phase equilibria.
Compositions Temperature Phase XSn XCu XNi
Reference
0.983 0.006 0.011 Lin et al26Liquid 0.990 0.008 0.002 Calculated 0.447 0.304 0.249 Lin et al26
0.455 0.316 0.229 Ho et al4* (Cu,Ni)6Sn5
0.451 0.334 0.215 Calculated 0.567 0.060 0.373 Lin et al26
0.571 0.073 0.356 Ho et al4*
240°C
(Ni,Cu)3Sn4
0.569 0.065 0.366 Calculated 0.443 0.309 0.248 Lin et al26(Cu,Ni)6Sn50.443 0.283 0.273 Calculated 0.563 0.067 0.370 Lin et al26(Ni,Cu)3Sn40.565 0.037 0.398 Calculated 0.410 0.228 0.362 Lin et al26
240°C
(Ni,Cu)3Sn20.429 0.175 0.396 Calculated 0.420 0.298 0.282 Lin et al26(Cu,Ni)6Sn50.431 0.317 0.252 Calculated 0.255 0.704 0.041 Lin et al26(Cu,Ni)3Sn 0.250 0.702 0.048 Calculated 0.406 0.222 0.372 Lin et al26
240°C
(Ni,Cu)3Sn20.414 0.241 0.345 Calculated
Liquid 0.331 0.513 0.156 Calculated 0.385 0.302 0.313 Wang and Chen25(Ni,Cu)3Sn20.397 0.325 0.278 Calculated 0.260 0.613 0.127 Wang and Chen25
800°C
γ 0.256 0.562 0.182 Calculated
* The results of Ho et al were obtained in investigating interfacial reactions between SnAgCu solder and Ni substrate, with errors introduced by the existence of Ag.
14
Mole Fraction of Sn0 0.2 0.4 0.6 0.8 1.0
Cu Sn
Tem
pera
ture
(K)
400
600
800
1000
1200
1400Present WorkShim et al
Fig.1 Calculated Sn-Cu phase diagram with the revised description, compared with the diagram presented by Shim et al18.
Present WorkLiu et al
Mole Fraction of Sn0 0.2 0.4 0.6 0.8 1.0
Ni Sn
Tem
pera
ture
(K)
400
600
800
1000
1200
1400
1600
1800
Fig.2 Calculated Sn-Ni phase diagram with the revised description, compared with the diagram presented by Liu et al21
15
Mole Fraction of Ni0 0.2 0.3 0.4 0.6
Cu3Sn
Tem
pera
ture
(o C)
200
400
800
1000
1200
Ni3Sn0.70.50.1
600
Wachtel and BayerPak et al.
Liquid
γ'
(ε)
(γ1)
Γ1
Ni3Sn
Cu3Sn
Fig.3 Calculated Cu3Sn-Ni3Sn isopleth together with experimental data.
Mole Fraction of Ni0 0.0.60.40.2
Mol
e Fra
ctio
n of
Sn
0
0.2
0.4
0.6
0.8
1
Ni3Sn2
Ni3Sn
NiCu
Sn
Liquid
γ'
fcc
bcc
8 1
Experimental DataNi3Sn2, Wang et al.γ', Wang et al.Ni3Sn, Wang et al.fcc, Wang et al.fcc, Gupta et al.
Fig.4 Calculated isothermal section of Sn-Cu-Ni phase diagram at 800°C compared with experimental data.
16
Mole Fraction of Ni0 0.0.60.40.2
Mol
e Fra
ctio
n of
Sn
0
0.2
0.4
0.6
0.8
1
Cu3Sn
Cu6Sn5
Ni3Sn4
Ni3Sn2
Ni3SnΓ1
NiCu
Sn
8 1
Fig.5 Calculated isothermal section of Sn-Cu-Ni phase diagram at 240°C.
17
Mole Fraction of Ni0 0.200.150.100.05
Mol
e Fr
actio
n of
Sn
0.25 0.300.41
0.43
0.45
0.47
0.49
0.51Chen et al.Lin et al.Vuorinen et al.
(a)
Mole Fraction of Ni0 0.200.150.100.05 0.25 0.30
Mol
e Fr
actio
n of
Sn
0.40
0.42
0.44
0.46
0.48
0.50Hurtig
(b)
Fig.6 Calculated composition range of (Cu,Ni)6Sn5 in ternary Sn-Cu-Ni system together with experimental data. (a) 240°C; (b) 125°C, with Cu3Sn suspended.
18
Weight percent of Ni, wt%
Wei
ght p
erce
nt o
f Cu,
wt %
0.2 0.4 0.6 0.8 1.000
0.5
1.0
1.5
Liquid+(Cu,Ni)6Sn5
Liquid+(Ni,Cu)3Sn4
0.6% Cu
0.4% Cu
0.2% Cu
O
Fig.7 Calculated isothermal section at 250°C in Sn corner, broken lines connect pure Ni and Sn-Cu alloys with different compositions.
Cal
cula
ted
criti
cal C
u co
nten
t, w
t %
0.25
0.30
0.35
0.40
0.45
0.50
0.55
Temperature (oC)210 220 230 240 250 260
(Cu,Ni)6Sn5
Preferred
(Ni,Cu)3Sn4
Preferred0.20
Sn(Cu)
Sn3.5Ag(x)Cu
Fig.8 Calculated critical Cu-content in liquid to change interfacial reaction product from (Ni,Cu)3Sn4 to (Cu,Ni)6Sn5, as a function of temperature.
19
Mole Fraction of Ni in (Cu,Ni)6Sn5
0 0.05 0.10 0.15 0.20 0.25
Ni
SnCu
0
1
2
3
4
5
6
7
8
Prod
uct o
f Mol
e Fr
actio
n an
d C
hem
ical
Pote
ntia
l Diff
eren
ce (K
J/m
ol)
(a)
Mole Fraction of Ni in (Cu,Ni)3Sn0 0.03 0.06 0.09
0
1
2
3
4
5
6
7
8SnCuNi
Prod
uct o
f Mol
e Fr
actio
n an
d C
hem
ical
Pote
ntia
l Diff
eren
ce (K
J/m
ol)
(b)
Fig.9 Calculated x∆G for diffusions through (Cu,Ni)6Sn5 and (Cu,Ni)3Sn layers in a (Cu,Ni)/(Cu,Ni)3Sn/(Cu,Ni)6Sn5/Sn(L) interfacial structure at 240°C. (a) (Cu,Ni)6Sn5; (b) (Cu,Ni)3Sn
20
Mole Fraction of Ni in (Cu,Ni)3Sn0 0.03 0.06 0.09
0
Mol
e Fr
actio
n of
Ni i
n (C
u,N
i) 6Sn
5
0.05
0.10
0.15
0.20
0.25
0.30
Fig.10 Relation between mole fractions of Ni in (Cu,Ni)6Sn5 and (Cu,Ni)3Sn layers at 240°C.


![Pageflex Server [document: D-Aalto-E144C5AE 00001]lib.tkk.fi/Diss/2011/isbn9789526044330/article4.pdf · 2011-12-12 · Thermo-hydrodynamics of boiling in a van der Waals fluid T.](https://static.documents.pub/doc/80x56/5ea483bb56ff086f1a271bb9/pageflex-server-document-d-aalto-e144c5ae-00001libtkkfidiss2011isbn9789526044330.jpg)


![N.€I.€Elkalashy,€M.€Lehtonen,€H.€A.€Darwish,€A.M.€I ...lib.tkk.fi/Diss/2007/isbn9789512290154/article4.pdfdetection and location, etc. [12–15]. In this paper, the](https://static.documents.pub/doc/80x56/5e7ccaebd1fe7c052d7c28c0/naiaelkalashyamalehtonenahaaadarwishaamai-libtkkfidiss2007isbn9789512290154.jpg)