Methods in Functional ProteomicsTwo-Dimensional Polyacrylamide Gel ElectrophoresisWith Immobilized pH Gradients, In-Gel Digestion,and Identification of Proteins by Mass Spectrometry
Karine R. Bernard, Karen R. Jonscher, Katheryn A. Resing,and Natalie G. Ahn
1. IntroductionThe recent combination of several technology platforms has revolutionized
the analysis of expressed cellular proteins (proteomics). Large-scale separa-tion and visualization of proteins is accomplished using two-dimensional gelelectrophoresis (2-DE). Proteins are separated first by isoelectric focusing(IEF) using immobilized pH gradient (IPG) strips. Following charge separa-tion, proteins are further resolved by molecular mass using sodium dodecylsulfate-polyacrylamide gel electrophoresis (SDS-PAGE), as shown in Fig. 1.
Image analysis of stained 2-D gels from cells under various states of stimu-lation or disease can be used to screen proteins that are differentially expressed(functional proteomics). Identifying and characterizing the structure/functionof these proteins may lead to possible drug targets. Large-scale, automatedprotein identification can be accomplished using mass spectrometry (MS) com-bined with powerful database searching algorithms. Since an initial study onthe yeast proteome by Shevchenko et al. (1) in 1996, functional proteomicsutilizing 2-DE separation and MS has been reported in many applications,including identification of proteins involved in signaling pathways (2,3), aswell as in cancer (4–6).
Dried gel strips containing IPG were first described in 1982 (7,8) and com-mercially introduced in 1991. IPG strips are manufactured by copolymerizingacidic and basic acrylamido derivatives of different pKs within a polyacryla-mide matrix. The covalent nature of the chemical bonds formed during the
264 Bernard et al.
polymerization step results in permanent stability of the pH gradient within thematrix with a typical pI resolution of 0.01 pH units. The acrylamide matrix with theacrylamido buffers is cast onto a Gelbond backing sheet, polymerized, washed,and dried. The backing stabilizes the size of the strips and simplifies handling.
Samples are applied to the IPG strips by rehydration. The rehydrated stripsare then placed onto the cooling plate of an electrofocusing chamber for sepa-ration in the first dimension. Prior to the second-dimension run, IPG strips areequilibrated in solutions in order to reduce and alkylate cysteine. Followingseparation by mass in the second dimension, various stains are employed todetect proteins (9). Computerized image analysis software is used to selectspots of interest, which are subsequently digested with proteases to producepeptides that are analyzed using MS. Accurately measured masses of four tosix peptides can be used to unambiguously identify a protein by searching da-tabases such as the nonredundant protein databases housed at NCBI (10). The
Fig. 1. 2-DE gel pattern of WM35 (melanoma) cell line.
Methods in Functional Proteomics 265
“peptide mass mapping” technique is typically performed using a time-of-flight(TOF) mass spectrometer.
In a complementary approach, peptides in digests can be fragmented intosequence-specific product ions using tandem MS. The product ion spectrum iscompared with computer-generated spectra derived from protein sequences indatabases for protein identification. If complete sequence information is notavailable, a partial sequence tag can be deduced and used to search for homolo-gous proteins containing the tag. The combination of a single peptide sequenceand molecular weight may be sufficient to unambiguously identify a protein,provided that the protein of interest is represented in the sequence database.
This review outlines methods for resolving whole-cell mammalian extractsby high-resolution 2-DE and subsequent in-gel protein digestion. Methods foranalyzing digests by MS depend on the instruments used and are not coveredin detail. However, practical concepts important for successful peptide map-ping and sequencing are included.
2. Materials2.1. Sample Preparation
1. Lysis buffer components recommended for mammalian cell extractions are listedin Table 1. CHAPS and thiourea are from Sigma (St. Louis, MO). Dithiothreitol(DTT) and ultrapure electrophoresis-grade urea are from Fisher (Pittsburgh, PA),and IPG buffer (pH 4.0–7.0) is from Amersham Pharmacia Biotech (Uppsala,Sweden). Ideally, fresh lysis buffer should be used to lyse the cells. However, thebuffer can also be stored in aliquots (1 mL) at –80°C, in which case DTT shouldbe added immediately before cell lysis.
2. D-PBS: Dulbecco’s phosphate-buffered saline (containing no calcium or magne-sium). Powder is from Gibco-BRL (Rockville, MD).
3. TLA100 tabletop ultracentrifuge for clarifying lysates. Ultracentifuge, TLA100.2rotor, and polypropylene TLA100.2 centrifuge tubes are from Beckman Instru-ments.
4. Bradford Protein Assay reagent, used to determine protein concentration, is fromBio-Rad (Richmond, CA). Bovine serum albumin standard solution (2 mg/mL)is from Pierce.
2.2. Rehydration of IPG Strips With Sample
1. Lysis buffer and rehydration buffer are described, respectively, in Tables 1 and 2.2. Immobiline DryStrip reswelling tray (Amersham Pharmacia Biotech).3. Immobiline DryStrips (pH 4.0–7.0), 18 cm (Amersham Pharmacia Biotech).4. Light mineral oil (paraffin oil, light) and forceps (fine tipped) (Fisher).5. High-performance blot paper (46 cm × 57 cm × 3 mm) (Life Science, Denver,
CO). This is similar in weight to Whatman 3MM filter paper.
266 Bernard et al.
2.3. First Dimension: IEF
1. Multiphor II flatbed electrophoresis unit, electrode holder, Immobiline stripaligner, cathode electrode, anode electrode, and IEF electrode strips (AmershamPharmacia Biotech).
2. Programmable electrophoresis power supply (EPS 3500 XL) (AmershamPharmacia Biotech).
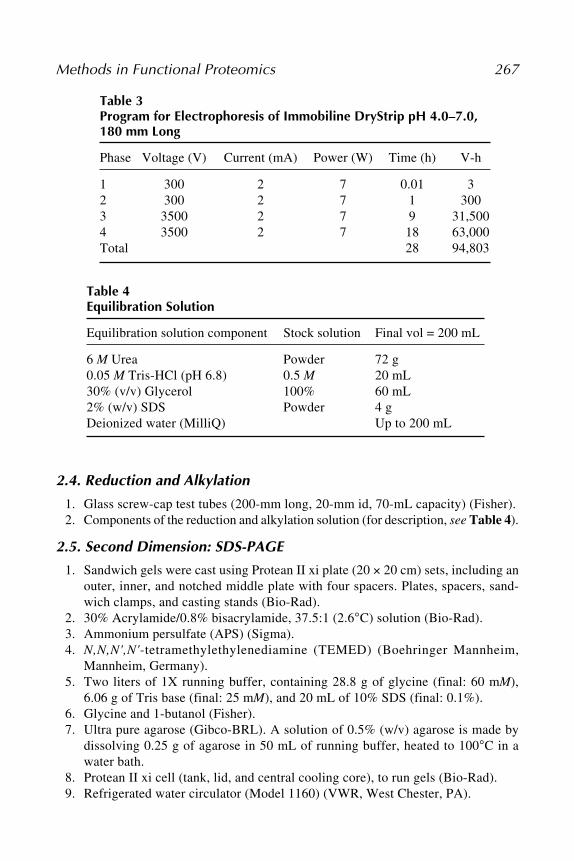
3. The power supply gradient program for electrophoresis of Immobiline DryStrips(pH 4.0–7.0) (for description, see Table 3).
4. Light mineral oil (Fisher).
Table 1Lysis Buffer Components
Buffer component Final vol =(final concentration) Stock solution 10 mL
7 M Urea Powder 4.2 g2 M Thiourea Powder 1.52 g 4% (w/v) CHAPS Powder 0.4 g1 mM Benzamidine 1 M 10 μL25 μg/mL Leupeptin 20 mg/mL in water 12 μL20 μg/mL Pepstatin 10 mg/mL in ethanol 20 μL10 μg/mL Aprotinin 50 mg/mL in 10 mM HEPES, pH 7.4 2 μL1 mM DTT 1 M DTT in water (prepared fresh) 10 μL1 mM Sodium orthovanadate 1 M 10 μL1 mM Microcystin 1 mM in dimethylsulfoxide 10 μL1% (v/v) Ampholines 100% IPG buffer, pI 4–7 100 μLDeionized water (MilliQ) Up to 10 mL
Table 2Rehydration Buffer
Buffer component Stock solution Final vol = 10 mL
7 M Urea Powder 4.2 g2 M Thiourea Powder 1.52 g4% (w/v) CHAPS Powder 0.4 g50 mM DTT 1 M DTT 500 μL3% (v/v) Ampholines 100% IPG buffer 300 μLBromophenol blue 10% (w/v) in water 20 μLDeionized water (Milli Q) Up to 10 mL
Methods in Functional Proteomics 267
2.4. Reduction and Alkylation
1. Glass screw-cap test tubes (200-mm long, 20-mm id, 70-mL capacity) (Fisher).2. Components of the reduction and alkylation solution (for description, see Table 4).
2.5. Second Dimension: SDS-PAGE
1. Sandwich gels were cast using Protean II xi plate (20 × 20 cm) sets, including anouter, inner, and notched middle plate with four spacers. Plates, spacers, sand-wich clamps, and casting stands (Bio-Rad).
Mannheim, Germany).5. Two liters of 1X running buffer, containing 28.8 g of glycine (final: 60 mM),
6.06 g of Tris base (final: 25 mM), and 20 mL of 10% SDS (final: 0.1%).6. Glycine and 1-butanol (Fisher).7. Ultra pure agarose (Gibco-BRL). A solution of 0.5% (w/v) agarose is made by
dissolving 0.25 g of agarose in 50 mL of running buffer, heated to 100°C in awater bath.
8. Protean II xi cell (tank, lid, and central cooling core), to run gels (Bio-Rad).9. Refrigerated water circulator (Model 1160) (VWR, West Chester, PA).
Table 3Program for Electrophoresis of Immobiline DryStrip pH 4.0–7.0,180 mm Long
Phase Voltage (V) Current (mA) Power (W) Time (h) V-h
Equilibration solution component Stock solution Final vol = 200 mL
6 M Urea Powder 72 g0.05 M Tris-HCl (pH 6.8) 0.5 M 20 mL30% (v/v) Glycerol 100% 60 mL2% (w/v) SDS Powder 4 gDeionized water (MilliQ) Up to 200 mL
268 Bernard et al.
10. For nongradient gels: Four gels require 150 mL of a 12% acrylamide/0.32%bisacrylamide solution, containing 60 mL of 30% acrylamide/bisacrylamide(37.5:1) solution, 37.5 mL of 1.5 M Tris-HCl (pH 8.8), 500 μL of 10% APS, 50μL of TEMED, and 52 mL of deionized water.
11. For 8–18% gradient gels:a. Four gels require 80 mL of an 8% acrylamide/0.21% bisacrylamide (low
acrylamide) solution containing 21.3 mL of 30% acrylamide/bisacrylamide(37.5:1) solution, 20 mL of 1.5 M Tris-HCl (pH 8.8), 260 μL of 10% APS, 26μL of TEMED, and 38.5 mL of deionized water.
b. Four gels require 80 mL of an 18% acrylamide/0.48% bisacrylamide (highacrylamide) solution containing 48 mL of 30% acrylamide/bisacrylamide(37.5:1) solution, 20 mL of 1.5 M Tris-HCl (pH 8.8), 260 μL of 10% APS, 26μL of TEMED, and 11.7 mL of deionized water.
12. Gradient maker (Hoefer Model SG30; Amersham Pharmacia Biotech) and peri-staltic pump (Model RP-I; Rainin, Woburn, MA). A standard power supply forelectrophoresis can be used in the second dimension.
1. Matrix, -cyano-4-hydroxy-trans-cinnamic acid (Hewlett Packard, Santa Clara, CA).2. Matrix-assisted laser desorption ionization time-of-flight (MALDI-TOF) mass
spectrometer, Voyager-DE STR, and stainless steel 100-well sample plates (PEApplied Biosystems, Foster City, CA).
3. LCQ Classic ion trap mass spectrometer (ThermoFinnigan, San Jose, CA).4. PicoView nanospray source and PicoFrit columns (New Objective, Woburn, MA).
Methods in Functional Proteomics 269
5. Magic 2002 HPLC pump (Michrom Biosources, Auburn, CA).6. Hamilton Gastight 1700 series syringes (Fisher).7. PEEK tubing (1/16" o.d. and 360 μm o.d.) (Upchurch, Whidbey Island, WA).
3. Methods3.1. Sample Preparation
Sample preparation is the most crucial step for successfully separating pro-teins by 2-DE. Noncovalent interactions, such as ionic bonds, hydrogen bonds,hydrophobic interactions, and disulfide bridges, must be disrupted under con-ditions compatible with IEF. Only very low amounts of salts or other chargedcompounds may be present in the solvent.
Chaotropes dramatically decrease ionic interactions by altering the dielec-tric constant of the solvent and by denaturing proteins. For 2-DE, the chaotropeof choice for whole cell lysates is a mix of urea and thiourea (see Note 1). Adetergent such as CHAPS is included in the lysis buffer mixture to improvesolubility.
The following protocol has been optimized for mammalian cells, growingadherent or in suspension:
1. Wash 5 × 10⁶ cells with 10 mL of D-PBS twice. Drain D-PBS thoroughly byaspiration without letting the cells go dry.
2. Place a minimum amount of lysis buffer onto the cells. For example, add 700 μLof lysis buffer to adherent cells in a 75-cm2 tissue culture flask, or add 0.5 mL oflysis buffer to a 5 × 10⁶ suspension of cells, collected by centrifugation. Let thecells incubate in lysis buffer for 5 min, and then collect by scraping and transferthe lysate to a 1.5-mL microcentrifuge tube.
3. Incubate the lysates for 1 h at room temperature to disrupt the cells and precipi-tate the DNA. Store the lysates at –80°C after this step or after step 4.
4. Clarify the cell lysates by centrifuging at 200,000g (22°C) for 1 h to removeinsoluble material. This can be done in a Beckman TLA 100 ultracentrifuge us-ing a TLA100.2 rotor at 200,000g.
5. Determine the protein concentration of soluble lysate fractions. Various colorimet-ric protein reagents, such as Bradford Coomassie G250, may be used, but proteinstandards should be diluted in lysis buffer to correct for background signal.
3.2. Rehydration of IPG Strip With Sample
1. Using measured protein concentrations, calculate sample volumes containing100–150 mg of total protein. Remove the appropriate volume to a 1.5-mLmicrocentrifuge tube. For 18-cm DryStrips, add additional lysis buffer to thesample to provide a final volume of 175 μL. Mix and then add 175 μL of rehydra-tion buffer (after the addition of 20 mM DTT) to a total volume of 350 μL (whenusing 18-cm IPG DryStrips).
2. Incubate the mixture at room temperature for 20 min.
270 Bernard et al.
3. Level the reswelling tray so that the strips lie horizontally.4. Pipet each sample solution (350 μL) into a slot in the reswelling tray, being care-
ful to minimize bubbles.5. Remove the IPG strips from storage at –20°C. Label the backing strip with an ink pen.6. Remove the protective plastic from the IGP strips and gently place each strip,
with the gel side facing down, on top of the solution in each reswelling slot. Toeliminate bubbles between the sample and strip, repeatedly raise one half of thestrip and reapply it to the solution, and then raise and reapply the other half.
7. Immediately overlay the IPG strip with 2 mL of light mineral oil to prevent evapo-ration and urea crystallization.
8. Repeat steps 4–7 for each sample.9. Slide the lid onto the tray and allow the gel strips to rehydrate with sample over-
night (16 h) at 25°C.
3.3. First Dimension: IEF
It is important to perform steps 4–10 quickly, in order to prevent urea crys-tallization.
1. Connect the Multiphor II flatbed electrophoresis unit to the cooling water circu-lator and set to 20°C. Make sure the unit is level.
2. Spread 10 mL of light mineral oil over the Multiphor cooling plate and place theelectrode holder on the oil. This permits good contact with the cooling plate andenables even cooling.
3. Spread 10 mL of light mineral oil inside the electrode holder and place a flexibleplastic IPG strip aligner (with the 12 grooves concave side up) on the oil. Toavoid uneven cooling, ensure that bubbles are not trapped under the plastic stripaligner.
4. Cut two IEF electrode strips to a length of 11 cm. Place the IEF electrode stripsonto a piece of blot paper and soak each one with 1 mL of distilled water. Removeexcess water by blotting with Kimwipe tissues.
5. Remove the rehydrated IPG strips from the reswelling tray, place them gel sideup onto blot paper (6" × 10"), and briefly lay another piece of dry blot paper ontop of the gel strips to absorb excess solution.
6. Place the IPG strips gel side up between adjacent concave grooves in the plasticstrip aligner. The pointed ends of the strip (low pI end) should face the anode(red). After all IPG strips are in the tray, align the basic/cathode side of the gels.
7. Position the moistened IEF electrode strips orthogonally to the tops of the alignedIPG strips, one at each end. The electrode strips act as wicks for ionic compounds.
8. Position the electrodes onto the IEF electrode strips with the platinum wires cen-tered on each strip. Adjust so that the electrodes are level.
9. Flood the electrophoresis tray with light mineral oil (~100 mL) until the IPGstrips are completely covered.
10. Set the parameters on the power supply as described in Table 3. Running condi-tions depend on the pH gradient and the length of the IPG gel strip used and
Methods in Functional Proteomics 271
typically include low current and limiting voltage. Optimization of time and gra-dient is recommended for different sample types.
11. At the end of the run, disconnect the power supply, remove the IPG strips, andgently blot off the excess oil using blot paper.
12. After the first dimension is completed, the IPG strips may be packaged in plasticwrap and stored at –80°C. If the second dimension gel is to be run immediatelyfollowing IEF, prepare solutions for reduction and alkylation beforehand.
3.4. Reduction and Alkylation
IPG strips are equilibrated in the presence of glycerol, urea, SDS, DTT, andiodoacetamide in order to resolubilize, reduce, and alkylate proteins. The ureaand the SDS in the equilibration solution increase the solubility of the pro-teins and the glycerol minimizes diffusion. DTT is added to reduce disulfidebonds. Iodoacetamide is added to remove excess DTT and alkylate sulfhy-dryl residues.
1. Prepare 200 mL of equilibration solution for four IPG strips (Table 4). Dividethe solution into 2 × 100 mL for the following solutions:a. Reducing solution: Add 1 g of DTT to 100 mL of equilibration solution.b. Alkylating solution: Add 4 g of iodoacetamide and 20 μL of 10% (w/v) bro-
mophenol blue to 100 mL of equilibration solution.2. Remove the IPG strips from storage at –80°C or from the IEF apparatus. Place
each IPG strip individually into a glass screw-cap test tube containing 25 mL ofreducing solution, and rock on an orbital shaker at 100 rpm for 15 min.
3. Transfer the IPG strips directly into glass test tubes containing 25 mL of alkylat-ing solution and rock as in step 2 for 15 min.
4. Following alkylation, place the IPG strips (slightly bent) on one edge of a pieceof blot paper (6" × 10"). Immediately proceed to Subheading 3.5.2., step 1.
3.5. Second Dimension: SDS-PAGE
During separation by SDS-PAGE, negatively charged SDS is used to coatthe protein and modify the intrinsic protein charge. Proteins in a mixture havethe same net charge per unit length; thus, movement through the gel dependsprimarily on the molecular mass of the protein. SDS used in the gel-runningbuffer is sufficient to maintain a net negative charge on proteins and does notneed to be included during polymerization of the vertical SDS gel.
3.5.1. Casting Vertical SDS Gels
1. Assemble sandwich gels carefully to prevent leaking. Each sandwich of two gelsconsists of one outer plate, one notched plate, one inner plate, and four 1.0 mmspacers in between, assembled between two sandwich clamps (see Note 2). Smallsquares of wet filter paper can be used as labels and placed at the bottom cornersbetween the glass plates before casting.
272 Bernard et al.
2. Set the sandwich gel into a casting stand.3. For nongradient gels, pour a 12% acrylamide solution (see Subheading 2.5., item
10) between the glass plates until the liquid level is 0.5 cm from the top of theshortest glass plate. Proceed to step 8.
4. For 8–18% gradient gels, prepare the 8 and 18% acrylamide solutions withoutTEMED and APS. Chill the solutions on ice for 20 min. Then add TEMED toeach solution.
5. Pour the gel acrylamide solutions into the gradient maker attached to a peristalticpump. Place 18 mL of the 8% solution into the reservoir chamber and 18 mL ofthe 18% solution into the mixing chamber with a small stir bar. Add APS to eachsolution, turn on the magnetic stirrer in the mixing chamber, and use a pipet tomix APS in the low-acrylamide solution in the reservoir chamber (see Note 3).
6. Run the peristaltic pump at 48 mL/min. Allow the tubing to fill with the 18%solution and then open the valve between the mixing and reservoir chambers.Stop the pump when the liquid level reaches 0.5 cm from the top of the glassplates. Ideally, this will coincide with the end of the gradient volume.
7. Repeat steps 5 and 6 for each gradient gel.8. Overlay the gels with water-saturated 1-butanol and allow them to polymerize
for 4 h at room temperature. Replace the butanol with 375 mM Tris (pH 8.8) ifthe gels are stored at 4°C. Decant and rinse with deionized water immediatelyprior to running the second-dimension gel.
3.5.2. Running Second-Dimension Gel
1. Lay an IPG strip on top of an SDS-PAGE gel. The direction is not critical, butconsistency is recommended. It might be necessary to cut the plastic edges of theIPG strip at both ends in order for the strip to fit between the spacers.
2. Immediately overlay the IPG strip with 0.5% agarose in 1X running buffer andallow the agarose to solidify. Repeat steps 1 and 2 for each IPG strip (total offour). Mount two sandwich gels onto the central cooling unit and place in theelectrophoresis tank.
3. Fill the electrophoresis tank by adding 1.7 L of 1X running buffer to the bottomof the tank, and 0.3 L of 1X running buffer on top of the gels. Connect the centralunit to the cooling water circulator set to 10°C, and then connect the lid to thepower supply. Start the electrophoresis at 7 mA/gel for 1 h, and then increase thecurrent to 25 mA/gel.
4. Terminate the run when the Bromophenol blue tracking dye reaches the verybottom of the gel (approx 5 h total).
5. When the run is complete, remove the gel sandwiches from the apparatus andcarefully open the glass plates using a plastic spatula.
6. Dispose of the agarose overlay from each polyacrylamide gel, and place each gelinto 250 mL of fixing solution for silver staining (see Tables 5 and 6), or proceedto Coomassie staining. Incubate the gels in fixing solution overnight with gentleshaking. Fixing is required to immobilize the proteins in the gel and to removenonprotein components such as glycine, Tris, SDS, and carrier ampholytespresent at the bottom of the gels, which might interfere with subsequent staining.
Methods in Functional Proteomics 273
7. After staining (see Subheading 3.6.), protein spots can be excised immediatelyor gels can be dried for storage and archiving. Drying gels between cellophanesupports facilitates later protein recovery and is preferred to drying gels ontofilter paper. To dry gels between cellophane, wet two cellophane supports (32 ×32 cm) with deionized water and lay one on top of a square drying frame (25 × 25cm) over a clean, flat surface. Place the gel onto the cellophane and remove anybubbles. Overlay the second cellophane support on top of the gel and removebubbles. Place a second drying frame on top of the second support, and clamptogether with the first drying frame on all four sides. The gel can be dried in anyclean area or inside an air dryer overnight without heat.
0.0185% formaldehydeStop 40% Ethanol/12% acetic acid 5 minWash Deionized water 2 × 10 min
274 Bernard et al.
3.6. Staining 2-DE Gels
Proteins separated by 2-DE can be visualized using Coomassie BrilliantBlue, silver staining, imidazole reverse staining (11), or Sypro Ruby fluores-cence staining (9). Silver staining is one of the most sensitive methods and wasfirst introduced in 1979 by Switzer et al. (12).
Silver staining can be carried out as described by Blum et al. (13), yieldinghigh-sensitivity analytical gels optimal for image analysis (see Table 5). How-ever, recovery by in-gel digestion is poor, possibly owing to formaldehyde inthe fixation solutions. Improved recovery from in-gel digestion for MS hasbeen observed using the low fixation protocol from Shevchenko et al. (14) (seeTable 6), or with some commercial silver staining kits (e.g., SilverQuest,Invitrogen). Both silver stain methods are extremely sensitive and backgroundreduction, with concomitant sensitivity enhancement, is achieved by pretreat-ing the gel with sodium thiosulfate, a reducing agent, prior to impregnatingwith silver. Gels are impregnated in each solution and rotated on an orbitalshaker at 50 rpm for the times indicated in Tables 5 or 6. Then each solution isdecanted and discarded before adding the next one. For best results, alwayswear clean gloves and use a plastic sheet between the gel and gloves to decantsolutions. Use manual shaking during development (see Notes 4 and 5). Afterstaining, gels are washed with MilliQ water and preserved by air-dryingbetween cellophane supports (see Subheading 3.5.2., step 7), or processedimmediately for spot cutting.
Coomassie Brilliant Blue staining is less sensitive than silver staining butallows nearly complete recovery of peptides after in-gel digestion. Gels areincubated in Coomassie stain solution for 1 to 2 h, washed two to three timeswith deionized water, and incubated in destaining solution for 2 to 3 h.Kimwipes can be added to the destaining solution to absorb excess stain.
Sypro Ruby fluorescence stain (Molecular Probes) is about fivefold less sen-sitive than high-fixation silver staining but has the advantages of greater lin-earity in intensity facilitating quantitation, and good recovery for MS.
3.7. Image Analysis
Several computerized programs are currently available for image analysisof 2-D gels, including Melanie 4 from GeneBio (Geneva, Switzerland); PD-QUEST distributed by Bio-Rad; Z3 from Compugen; Progenesis™, a Nonlin-ear Dynamics image analysis software supplied by Amersham PharmaciaBiotech; AlphaMatch™ from Alpha Innotech; and Phoretix 2-D from Nonlin-ear Dynamics (Durham, NC). Accurate, automated image analysis that can beused for high-throughput proteomics applications is still difficult using soft-ware currently available, although the programs are rapidly evolving toward
Methods in Functional Proteomics 275
this goal. Because of the complexity and variability of 2D gels, manual inter-vention is still required for gel image analysis.
Steps in image analysis include the following:
1. Scanning the gel at 300 dpi to acquire a digital TIFF image.2. Detecting and quantifying all protein spots using 2-D analysis software.3. Aligning images of different gels in order to group identical spots.4. Identifying unmatched spots that reflect changes in protein expression or mobil-
ity, using 2-D analysis software.5. Using statistical or clustering analysis to relate changes in protein expression or
mobility to functional differences between samples.
Background corrections should be performed before comparing spot inten-sities. Reliable assignment of a protein spot should require reproducibility inthree or more 2-D gels, representing at least two independent samples of thesame experimental condition.
It is important to manually verify the spot detection and spot-matchingresults from the program. Because of variability in gel resolution, staining, andbackground, automatic image analysis software may not correctly define spotcontours, particularly in dense regions of the gel. This variability, together withthe complexity in 2-D gel patterns, hinders accurate matching of analogousspots in different gels.
3.8. In-Gel Tryptic Digestion of Proteins in 2-DE Gel Slices
To reduce sample loss during transfer, proteins are digested directly in thepolyacrylamide gel matrix (14,15). Trypsin is the enzyme of choice to generatepeptides for subsequent analysis by MS (see Note 6). For best results, wearclean gloves to avoid contamination, use HPLC -grade water and solvents, andcarry out all steps in a clean hood (see Note 7).
1. Using an X-ACTO® knife and blade, excise the protein spot of interest from wetor dry gels and transfer it to a 1.5-mL microcentrifuge tube (nonautoclaved).Alternatively, a pipet tip trimmed at varying lengths from the end with a razorblade can be attached to a P1000 pipettor and used to punch out variable-sizedgel spots from a wet gel. It is important to excise only the stained portion of theprotein spot and minimize excess gel material. In general, protein recoveries fromwet gels are greater than from dried gels.
2. Prepare fresh destaining reagent. Mix equal volumes of 100 mM sodium thiosul-fate and 30 mM potassium ferricyanide, and add 1 mL of the mixture to each gelpiece. Cap and agitate for 5 min or until the stain has disappeared. Aspirate thedestaining solution.
3. Wash the gel pieces by adding 1.5 mL of HPLC-grade water to each tube. Capand agitate the tubes at room temperature for 5 min, and then aspirate.
4. Repeat step 3 two more times.
276 Bernard et al.
5. Wash the gel pieces in 500 μL of 100 mM ammonium bicarbonate (NH4HCO3)for 20 min with agitation, and then aspirate.
6. Wash the gel pieces in 500 μL of 50% acetonitrile/50 mM NH4HCO3 with agita-tion for 20 min, and then aspirate.
7. In a clean hood, add 50 μL of 100% acetonitrile to shrink each gel piece. Transfereach gel piece with acetonitrile to a clean 0.6-mL microcentrifuge tube. After10–15 min, remove excess solvent and dry the gel pieces in a Speedvac centri-fuge until the gel pieces appear completely dry and opaque (5–10 min).
8. Prepare a stock solution (1 mg/mL) of sequencing-grade, modified trypsin in 50 mMacetic acid. Dilute the stock solution 1:50 with 25 mM NH4HCO3 and reswell thegel pieces with 10–20 μL of the trypsin solution (0.02 mg/mL). After 15–30 min,remove excess trypsin solution from the tubes and replace with a sufficient volume of25 mM NH4HCO3 to just cover the gel piece (approximately twice the gel volume).The gel pieces must stay wet during the digestion. Incubate overnight at 37ºC.
9. Quench the reaction by adding 1 μL of 88% formic acid to each tube. Sonicate ina bath sonicator for 30 min and transfer the supernatant to new 0.6-mLmicrocentrifuge tubes. If necessary, speedvac concentrate the supernatant sampleto a final volume of 10–20 μL.
10. Remove 0.5 μL of the sample and analyze by MALDI-TOF, as described in Sub-heading 3.9.1. If the sample will not cocrystallize efficiently with matrix, removeone-half of the remaining sample volume and desalt with a ZipTip-C18 column(Millipore) according to instructions, and then reanalyze by MALDI-TOF. If con-firming structural information is required, analyze the remaining sample volumeby nanoflow ion trap mass spectrometry.
3.9. Peptide Sequencing by MS
MS has become the preferred alternative to Edman degradation and aminoacid analysis for characterizing low levels of protein. Mass spectrometers forproteomics applications are equipped with MALDI or electrospray ionizationsources.
3.9.1 Peptide Mass Mapping Using MALDI-TOF MS
Peptide samples are mixed with an equivalent volume of a small organicmatrix compound ( -cyano-4-hydroxy-trans-cinnamic acid) on a stainless steelsample plate and air-dried (16). The mixture forms crystals that are bombardedwith photons from a nitrogen laser (337 nm). The benzene rings in the matrixmolecules absorb energy from the photons and excite the analyte. Matrix andanalyte molecules are desorbed off of the sample plate, creating a plume ofgas-phase ions and neutral molecules. It is believed that collisions between themolecules in the explosion plume induce peptide ionization by supporting pro-ton transfer from the matrix. MALDI is most commonly combined with TOFmass spectrometers. Mass-to-charge ratios in TOF mass spectrometers aredetermined by measuring the time it takes for ions to move through a field-free
Methods in Functional Proteomics 277
flight tube. Assuming a constant accelerating voltage, the flight time for an ionis related to its m/z ratio. TOF instruments can detect extremely large ions (inexcess of m/z 106). The sensitivity for peptide analysis is typically in the25–100 fmo1 range.
Typical operating conditions for the Voyager DE STR TOF-MS are as fol-lows: 20-kV accelerating voltage; 10-V guide wire voltage; 100-ns delay time;150-scan data averaging; Voyager 5 acquisition software.
When the instrument is calibrated using tryptic peptides resulting fromtrypsin autolysis as internal standards (842.51 and 2211.10 Daltons), massaccuracy of 50 ppm or better can be observed between 800 and 2500 Daltons.Matrix contaminants dominate spectra below 800 Daltons. The most commonnonmatrix contaminants are human keratins from laboratory dust or the inves-tigator. Contaminating peptides from keratins may be observed with singlycharged masses (MH+) of 806.39, 992.49, 1002.54, 1089.52, 1105.51, 1117.50,1164.57, 1200.60, 1233.67, 1356.71, and 1364.63 Daltons. Contaminating pep-tides from porcine trypsin autolysis may be observed with MH+ of 842.51,906.50, 952.39, 1006.48, 1045.56, 1469.73, 1736.84, 1768.79, 2158.03,2211.10, and 2283.18 Daltons.
The monoisotopic peptide masses observed by MALDI-TOF constitute apeptide mass map. Computational tools available on the Internet that use theobserved masses to probe databases and identify proteins include ProFoundfrom Rockefeller University (www.expasy.ch/tools/pi_tool.html); MS-Fit fromUniversity of California, San Francisco (http://prospector.ucsf.edu); andPeptIdent from Swiss Institute of Bioinformatics (www.expasy.ch/tools/peptident.html). A commonly used database for search algorithms is theNCBInr (National Center for Biotechnology Information nonredundant) data-base. Suggested search parameters are as follows: allow one missed cleavagefor trypsin, cysteines are modified by iodoacetamide, methionine is partiallyoxidized (see Note 8), and a minimum of five peptides is required to matchwith a mass tolerance for monoisotopic ions under 50 ppm (see Note 9).
3.9.2. Peptide Sequencing Using Ion Trap MS
Using a syringe, 2–5 μL of the tryptic digest are loaded onto a loop in amicroinjection valve (Upchurch). The total amount of sample loaded typicallyranges from 25 fmol to several picomoles. Solvent flow from an HPLC is splitto provide a final flow rate through the column of 300 nL/min of solvent A (2%acetonitrile in 0.1% aqueous formic acid). The peptides are injected from theloop onto a 10 × 75 μm i.d. fused silica column packed with C18 resin (NewObjective) and eluted with a gradient of increasing organic phase reaching100% solvent B (70/30/0.1 acetonitrile:water:formic acid [v/v/v]) in 15 min.Voltage (1.5–3 kV) is applied to the sample using a microtee at the column
278 Bernard et al.
head, inducing spray at the tip of the integral emitter. Gas-phase ions desorbfrom the sprayed droplets and are directed into the mass spectrometer.
The ion beam passes through two octopoles while a gating lens allows ionsto accumulate in the ion trap, a device consisting of two end-cap electrodes anda ring electrode. Voltage applied to the ring electrode is ramped, sequentiallyejecting ions with m/z values between 300 and 2500 Daltons from the trap in amass-dependent fashion. Ejected ions are focused into a high-energy collisiondynode that emits electrons and secondary particles collected by an electronmultiplier. The signal is amplified and a mass/intensity list is sent to an auxil-iary CPU and displayed as a mass spectrum. Peptide sequence information isobtained by inducing ions to fragment using additional voltages placed on theend-cap electrodes (MS2). Higher voltages cause ions to exit the trap, so an ionof interest can be isolated while expelling all others. Lower voltages cause iontrajectories to increase, leading to fragmentation via collisions with heliumatoms present in the trap at a pressure of ~1 mTorr. These fragmentation prod-uct ions are then ejected by a voltage ramp on the ring electrode. If necessary,a particular fragment ion can be selected for further fragmentation (MS3).
A typical experiment consists of measuring the mass-to-charge ratio (m/z)of ions desorbed from the column eluate (MS), assessing the charge state of themost abundant ions, and then fragmenting them (MS/MS). The instrumentautomatically performs this experiment. After an ion has been measured two tothree times, its m/z is placed on an exclusion list so that less abundant ions canbe examined (dynamic exclusion), and the experiment is repeated.
Data are analyzed using the Sequest algorithm (ThermoFinnigan). The pep-tide molecular mass is computed from the m/z value of the precursor ion deter-mined in the MS analysis. The peptide molecular mass is then used to search aprotein database (Owl, nonredundant, SwissProt, or user determined) parsedinto amino acid sequence strings. Theoretical product ions from candidate se-quences matching the observed molecular weight are compared with observedproduct ions. The candidates and observed sequences are then closely com-pared by cross-correlation. The sequence whose product ion fingerprint mostresembles that of the observed data is selected as the top ranked choice. Gener-ally, the match is considered good when a number of the peptides “hit” thesame protein, or same family of proteins. When only one peptide (or no pep-tide) match is observed, the spectra are investigated manually. A sequence tagis constructed and a search through the NCBI database may reveal proteins inother organisms homologous to the protein under investigation.
4. Notes1. Carbamylation is a common problem associated with the use of urea. Urea in
water exists in equilibrium with ammonium cyanate, reacting with amines such
Methods in Functional Proteomics 279
as the N-terminus and -amino groups of lysines. Carbamylated proteins exhibitaltered pIs during focusing and decreased mobility in the SDS-PAGE gel. Thereaction also causes artifactual charge heterogeneity, N-terminal blocking, andadduct formation detectable in mass spectra. Avoid carbamylation by using pure-grade urea, never heating the solution above 37ºC (since the cyanate levelincreases with temperature and pH), and using a cyanate scavenger (primaryamine) such as carrier ampholytes.
2. To clean glass plates, soak them in hot laboratory detergent for at least 2 h, andthen scrub them with a scouring pad. Rinse off the detergent and store the platesin a dust-free environment until they are used. Before use, wipe each plate with amethanol-soaked tissue.
3. It is very important to prepare 10% APS solution freshly each time gels are poly-merized. Old solutions deteriorate and affect the rate of polymerization; hence, thepore size will be different and 2-DE gels will not be reproducible when APS is old.
4. In a standard analytical 2-DE gel loaded with 100–200 μg of protein, the firsthigh-intensity spots should begin to appear within 1 min. Delayed appearance isgenerally observed when aldehydes are omitted from the fixation step.
5. When the gel is dipped in the developing solution, a brown microprecipitate ofsilver carbonate should form. This precipitate must be redissolved to prevent itfrom depositing on the gel and increasing background. Immediately agitating thedeveloping tray redissolves the precipitate.
6. Trypsin cleaves specifically at the C-terminal ends of Lys and Arg amino acidsand is particularly useful for generating samples for MS. The spacing of theenzymatic cleavage sites in most proteins typically yields peptides ranging inmolecular weight from 500–2500 Daltons, compatible with mass range require-ments for most mass spectrometers. In addition, the basic groups at the N-termi-nal amine and the C-terminal Lys or Arg residue generate doubly charged peptideions in the electrospray process that facilitate fragmentation at amide bonds togenerate singly charged N-terminal (b-type) and C-terminal (y-type) product ions.Tryptic peptides rarely contain internal arginines, minimizing internal fragmen-tations that complicate product ion mass spectra.
7. Keratin contamination is a significant problem when analyzing samples by MS.Rigorous care should be taken to ensure that keratin is not introduced from skin,hair, and dust. Use gloves and keep the work area and instrumentation clean.
8. Electrophoresis can introduce artifactual protein modifications, such as methion-ine oxidation or acrylamide adduction to free cysteine sulfhydryls and N-termi-nal amines. Common artifactual modifications include cysteine-acrylamide (+71Daltons), oxidized acrylamide (+86 Daltons), -mercaptoethanol (+76 Daltons),N-terminal acrylamide (+71 Daltons), methionine oxidation (to sulfoxide) (+16Daltons).
9. Less than 50 ppm mass accuracy is possible to obtain using internal calibrationwith two to three peptide masses resulting from trypsin autolysis. If only onetryptic peptide is present in the spectrum, internal calibration can be performedby mixing samples with a standard peptide mixture containing bradykinin (904.47
280 Bernard et al.
Daltons), angiotensin (1296.69 Daltons), and Glu-fibrinopeptide (1570.68Daltons).
AcknowledgmentsWe are grateful to Jennifer Yeh, Timothy Lewis, John Hunt, Donna Louie,
William Old, Lauren Aveline, David Friedman, Yukihito Kabuyama, KirsiPolvinen, and Alex Mendoza, who worked hard to develop robust protocolsfor these methods and generously taught them to others.
References1. Shevchenko, A., Jensen, O. N., Podtelejnikov, A. V., et al. (1996) Linking genome
and proteome by mass spectrometry: large-scale identification of yeast proteinsfrom two dimensional gels. Proc. Natl. Acad. Sci. USA 93, 14,440–14,445.
2. Soskic, V., Görlach, M., Poznanovic, S., Boehmer, F. D., and Godovac-Zimmerman, J. (1999) Functional proteomics analysis of signal transduction path-ways of the platelet-derived growth factor receptor. Biochemistry 38,1757–1764.
3. Lewis, T. S., Hunt, J. B., Aveline, L. D., et al. (2000) Identification of novel MAPkinase pathway signaling targets by functional proteomics and mass spectrom-etry. Molecular Cell 6, 1343–1354.
4. Yu, L. R., Zeng, R., Shao, X. X., Wang, N., Xu, Y. H., and Xia, Q. C. (2000)Identification of differentially expressed proteins between human hepatoma andnormal liver cell lines by two-dimensional electrophoresis and liquid chromatog-raphy-ion trap mass spectrometry. Electrophoresis 21, 3058–3068.
5. Vercoutter-Edouart, A. S., Lemoine, J., Le Bourhis, X., et al. (2001) Proteomicanalysis reveal that 14-3-3 sigma is down-regulated in human breast cancer cells.Cancer Res. 61, 76–80.
6. Stulík, J., Hernychová, L., Porkertová, S., et al. (2001) Proteome study ofcolorectal carcinogenesis. Electrophoresis 22, 3019–3025.
7. Bjellqvist, B., Ek, K., Righetti, P. G., Gianazza, E., Görg, A., Westermeier, R., andPostel, W. (1982) Isoelectric focusing in immobilized pH gradients: principle, meth-odology and some applications. J. Biochem. Biophys. Methods 6, 317–339.
8. Görg, A., Postel, W., and Gunther, S. (1988) The current state of two-dimensionalelectrophoresis with immobilized pH gradients. Electrophoresis 9, 531–546.
9. Wirth, P. J. and Romano, A. (1995) Staining methods in gel electrophoresis,including the use of multiple detection methods. J. Chromatogr. A 698, 123–143.
10. Mann, M., Hojrup, P., and Roepstorff, P. (1993) Use of mass spectrometric mo-lecular weight information to identify proteins in sequence databases. Biol. MassSpectrom. 22, 338–345.
11. Castellanos-Serra, L., Vallin, A., Proenza, W., Le Caer, J. P., and Rossier, J.(2001) An optimized procedure for detection of proteins on carrier ampholyte iso-electric focusing and immobilized pH gradient gels with imidazole and zinc salts:its application to the identification of isoelectric focusing separated isoforms by in-gel proteolysis and mass spectrometry analysis. Electrophoresis 22, 1677–1685.
Methods in Functional Proteomics 281
12. Switzer, R. C. 3rd, Merril, C. R., and Shifrin, S. (1979) A highly sensitive silverstain for detecting proteins and peptides in polyacrylamide gels. Anal. Biochem.98, 231–237.
13. Blum, H., Beier, H., and Gross, H. J. (1987) Improved silver staining of plantproteins, RNA and DNA in polyacrylamide gels. Electrophoresis 8, 93–99.
14. Shevchenko, A., Wilm, M., Vorm, O. and Mann, M. (1996) Mass SpectrometrySequencing of proteins from silver-stained polyacrylamide gels. Analyt. Chem.68, 850–858.
15. Gharahdaghi, F., Weinberg, C. R., Meagher, D. A., Imai B. S. and Mische, S. M.(1999) Mass spectrometric identification of proteins from silver-stained polyacry-lamide gels: method for the removal of silver ions to enhance sensitivity. Electro-phoresis 20, 601–605.
16. Hillenkamp, F., Karas, M., Beavis, R. C., and Chait, B. T. (1991) Matrix-assistedlaser desorption/ionization of biopolymers. Analyt. Chem. 63, 1193A–1203A.