The Potential Environmental Impacts of Full Development of the Marcellus Shale in Pennsylvania Sep 2016 IRM-2016-U-013695 Map Set 3: Impact on Population This series of maps displays information related to the potential environmental impacts of additional gas development in Pennsylvania if all remaining technically recoverable resources in the Interior Marcellus shale were developed using high volume hydraulic fracturing and horizontal drilling with eight wells per well pad. This map set includes projections of the total land area and population in Pennsylvania projected to be within 0.5 and 1 miles of well pad locations. The population estimates are based on the 2010 population in US Census block data. Population and land area estimates are aggregated by county in the maps. Note: These maps contain projections of natural gas development and associated impacts under a particular set of circumstances and assumptions. Changes to the assumptions could change the results. They are not predictions of development or impacts, and should not be used for commercial purposes, to guide investment decisions, or for short-range planning decisions. Furthermore, the maps should not be used to inform planning or decision making for geographic units smaller than the primary units of analysis (counties or HUC-10 watersheds). Population Impact Maps This map set includes projections of the following land and population impacts: 3.1 Area within 0.5 mile of well pads 3.2 Area within 1 mile of well pads 3.3 Population within 0.5 mile of well pads 3.4 Population within 1 mile of well pads For additional documentation and methodology used to create these maps, please download the research report at: www.cna.org/PA-Marcellus
Transcript
The Potential Environmental Impacts of Full Development of the Marcellus Shale in Pennsylvania Sep 2016
IRM-2016-U-013695
Map Set 3: Impact on Population This series of maps displays information related to the potential environmental impacts of additional gas development in Pennsylvania if all remaining technically
recoverable resources in the Interior Marcellus shale were developed using high volume hydraulic fracturing and horizontal drilling with eight wells per well pad.
This map set includes projections of the total land area and population in Pennsylvania projected to be within 0.5 and 1 miles of well pad locations. The population estimates are based on the 2010 population in US Census block data. Population and land area estimates are aggregated by county in the maps.
Note: These maps contain projections of natural gas development and associated impacts under a particular set of circumstances and assumptions. Changes to the assumptions could change the results. They are not predictions of development or impacts, and should not be used for commercial purposes, to guide investment decisions, or for short-range planning decisions. Furthermore, the maps should not be used to inform planning or decision making for geographic units smaller than the primary units of analysis (counties or HUC-10 watersheds).
Population Impact Maps
This map set includes projections of the following land and population impacts:
3.1 Area within 0.5 mile of well pads
3.2 Area within 1 mile of well pads
3.3 Population within 0.5 mile of well pads
3.4 Population within 1 mile of well pads
For additional documentation and methodology used to create these maps, please download the research report at: www.cna.org/PA-Marcellus
County Area within 0.5 mile of Well Pads% of County Area
CurrentAdditionalOutside
Area w/in 0.5 Mi of Well Pad
CountiesWith Development *No Development
This map shows the portion of county area within 0.5 miles of well pads, both currently, and additional projected. Thismetric forms the basis for assessing population impact,and is one way to assess portion of county area impactedby gas developement.
Map 3.1 - Area within 0.5 miles of Well Pads by County
Statewide Impact - Area <0.5 Miles from Well PadCurrent:Projection:
1,813 sq. mi.6,354 sq. mi.
* Includes current wells in any partof Marcellus formation.
ElkElk
TiogaTiogaPotterPotter
CentreCentre
ButlerButler
BradfordBradford
LycomingLycomingClintonClinton
BedfordBedford
ClearfieldClearfield
LuzerneLuzerne
CrawfordCrawford
SomersetSomerset
IndianaIndiana
CambriaCambria
HuntingdonHuntingdon
JeffersonJefferson
PikePike
WarrenWarren McKeanMcKean
BlairBlair
WayneWayne
FayetteFayette
MercerMercerClarionClarion
VenangoVenangoForestForest
GreeneGreene
WashingtonWashington
AlleghenyAllegheny
WestmorelandWestmoreland
ArmstrongArmstrong
SusquehannaSusquehanna
BeaverBeaver
SullivanSullivanColumbiaColumbia
WyomingWyomingCameronCameron
LawrenceLawrenceLackawannaLackawanna
N e w Y o r kN e w Y o r k
M a r y l a n dM a r y l a n d
Ohio
Ohi o
W e s t V i r g i n i aW e s t V i r g i n i a
New
J er s
e yN e
w J e
r se y
D e l a w a r eD e l a w a r e
V i r g i n i aV i r g i n i a
Erie
York
BerksPerryBucks
FranklinLancaster Chester
Schuylkill
Monroe
Mifflin
AdamsFulton
Dauphin
Union
Lehigh
CarbonSnyder
Cumberland
Lebanon
Juniata
Montgomery
NorthumberlandNorthampton
Delaware
Montour
Philadelphia
County Area within 1 mile of Well Pads% County Area
CurrentAdditionalOutside
Area w/in 1 mi of Well Pad
CountiesWith DevelopmentNo Development
This map shows the portion of county area within 1 mile of well pads, both currently, and additonal projected. Thismetric forms the basis for assessing population impact,and is one way to assess the portion of county area impacted by gas developement.Marcellus Formation Extent Interior Marcellus
Boundary
0 40 8020Miles
Map 3.2 - Area within 1 mile of Well Pads by County
Statewide Impact - Area <1 Mi from Well PadCurrent:Projection:
4,680 sq. mi.14,540 sq. mi.
O hi o
O hi o
N e w Y o r kN e w Y o r k
W e s t V i r g i n i aW e s t V i r g i n i a M a r y l a n dM a r y l a n d
N e w J
e rs e
y
N e w J
e rs e
y
D e l a w a r eD e l a w a r e
Elk
TiogaPotter
CentreButler
Bradford
Blair
Lycoming
Bedford
Clinton
Warren
Clearfield
Somerset
Luzerne
McKeanCrawford
Indiana
Wayne
Mercer
Clarion
Cambria
Huntingdon
Jefferson
Venango Pike
FayetteGreene
Forest
Allegheny
WashingtonWestmoreland
ArmstrongBeaver
Sullivan
Susquehanna
Columbia
WyomingCameron
Lawrence
Lackawanna
Erie
York
BerksPerry Bucks
FranklinLancaster Chester
Schuylkill
Monroe
AdamsFulton
MifflinDauphin
Union
Lehigh
Carbon
Snyder
Cumberland
Lebanon
Juniata
Montgomery
NorthumberlandNorthampton
Delaware
Montour
PhiladelphiaProjected Population within 0.5 miles of Well PadsTotal by County
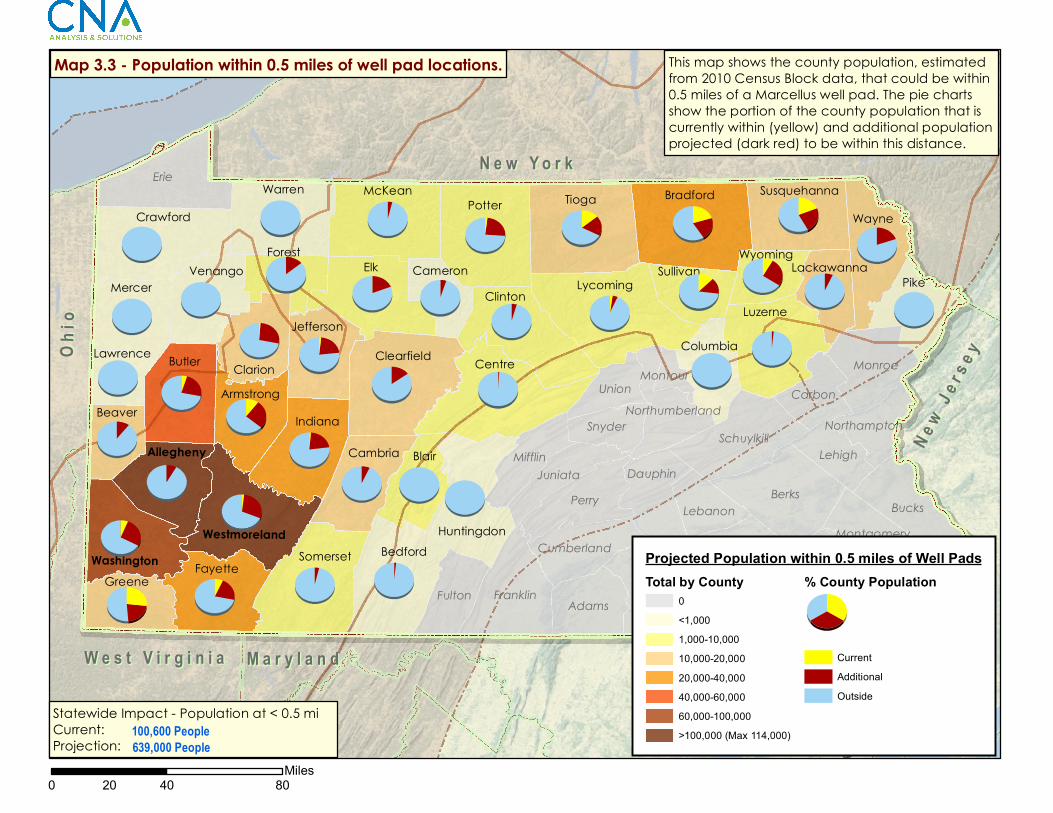
This map shows the county population, estimatedfrom 2010 Census Block data, that could be within 0.5 miles of a Marcellus well pad. The pie chartsshow the portion of the county population that iscurrently within (yellow) and additional populationprojected (dark red) to be within this distance.
0 40 8020Miles
Map 3.3 - Population within 0.5 miles of well pad locations.
Statewide Impact - Population at < 0.5 mi Current: Projection:
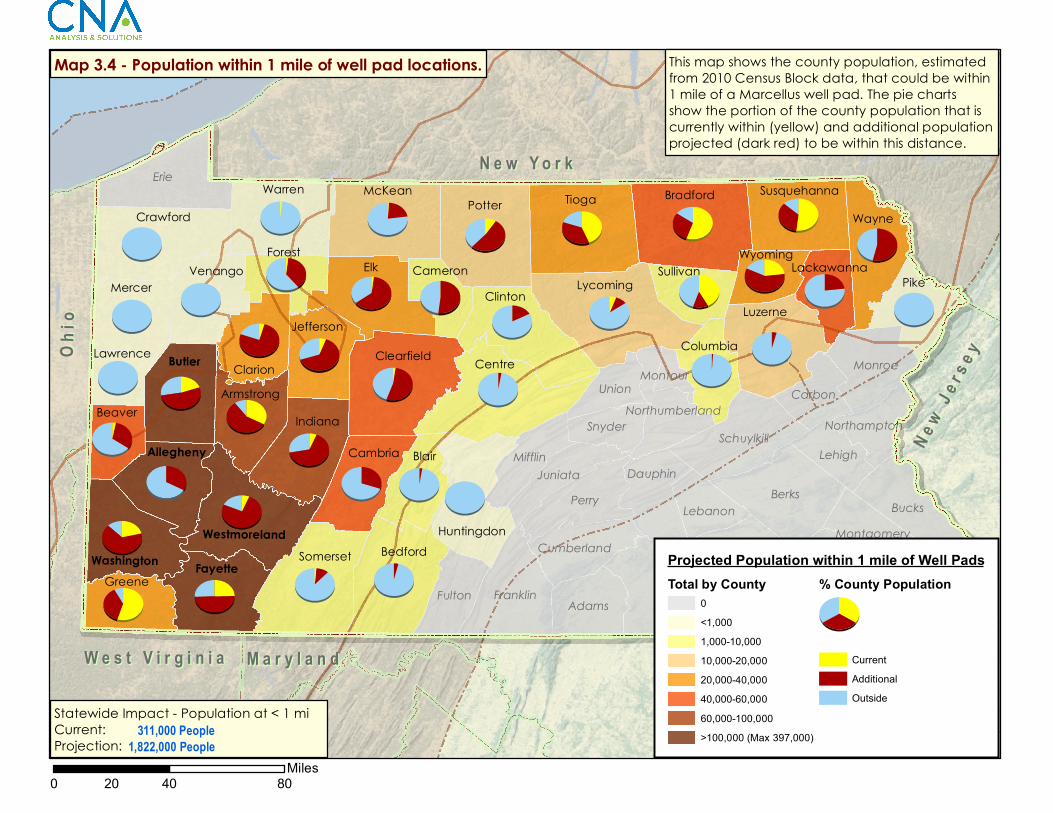
100,600 People639,000 People
O hi o
O hi o
N e w Y o r kN e w Y o r k
W e s t V i r g i n i aW e s t V i r g i n i a M a r y l a n dM a r y l a n d
N e w J
e rs e
y
N e w J
e rs e
y
D e l a w a r eD e l a w a r e
Elk
TiogaPotter
CentreButler
Bradford
Blair
Lycoming
Bedford
Clinton
Warren
Clearfield
Somerset
Luzerne
McKeanCrawford
Indiana
Wayne
Mercer
Clarion
Cambria
Huntingdon
Jefferson
Venango Pike
FayetteGreene
Forest
Allegheny
WashingtonWestmoreland
ArmstrongBeaver
Sullivan
Susquehanna
Columbia
WyomingCameron
Lawrence
Lackawanna
Erie
York
BerksPerry Bucks
FranklinLancaster Chester
Schuylkill
Monroe
AdamsFulton
MifflinDauphin
Union
Lehigh
Carbon
Snyder
Cumberland
Lebanon
Juniata
Montgomery
NorthumberlandNorthampton
Delaware
Montour
PhiladelphiaProjected Population within 1 mile of Well PadsTotal by County
This map shows the county population, estimatedfrom 2010 Census Block data, that could be within 1 mile of a Marcellus well pad. The pie chartsshow the portion of the county population that iscurrently within (yellow) and additional populationprojected (dark red) to be within this distance.
0 40 8020Miles
Map 3.4 - Population within 1 mile of well pad locations.
Statewide Impact - Population at < 1 mi Current: Projection:


![Scale Application Population map used [Reference] - …10.1186/1478-7954-9-4/... · Supporting Information Scale Application Population map used [Reference] Africa PAR Pf‐hookworm](https://static.documents.pub/doc/80x56/5aefe0c97f8b9ac62b8df7e5/scale-application-population-map-used-reference-1011861478-7954-9-4supporting.jpg)


