International Journal of Engineering Science Invention ISSN (Online): 2319 – 6734, ISSN (Print): 2319 – 6726 www.ijesi.org ||Volume 4 Issue 3 || March 2015 || PP.50-55 www.ijesi.org 50 | Page Mapping and Monitoring Spatial-Temporal Cover Change of Prosopis Species Colonization in Baringo Central, Kenya 1, A. A. Amboka, 2, T.G Ngigi 1, 2, Department, Department Of Geomatic Engineering and Geospatial Information System, Jomo Kenyatta University of Agriculture and Technology, P.O. Box 62000-00200, Nairobi, Kenya ABSTRACT: This study integrates Gis and remote sensing to detect, quantify and monitor the rate at which Prosopis species colonization has been taking place since its introduction. Multi-date Landsat 30m resolution imageries covering a period of 25 years were classified into four classes i.e. Prosopis species dominated canopy, mixed woodland, grass land and bush land and finally bare land and agricultural fields. Change detection analysis was performed using 10% threshold to identify and quantify areas where change or No change has occurred. The results indicate that the area under bare land and agricultural fields decreased at a rate of 18.22% per year from 29% in 1985 to 3% in 1990. Between 2005 and 2010 it decreased from 9% in 2005 to 5% in 2010 at a rate of 8.94% per year. Prosopis species colonization has been increasing since 1985 where it was at 0% increasing to 51% in 1990 at a rate of 58.18% per year. Between 2005 and 2010 it decreased from 56% in 2005 to stand at 44% in 2010 at a rate of 4.34% per year. The study found out that there is no threat of desertification in the study area as a result of Prosopis species colonizing the landscape. More studies to be done to identify sustainable method of controlling Prosopis species colonization to avoid more loss of agricultural land and grazing fields. KEY WORDS: Colonization, Prosopis species, Remote Sensing and GIS, spatial-temporal I. INTRODUCTION Environmentalist, resource managers and policy makers, are amongst the individuals who are more concerned about the threat of Prosopis species colonization to biodiversity and human livelihood. Species colonization is brought about by introducing an alien species that can withstand extreme drought conditions and resistant to pests and diseases. The term alien species is best described by (Richardson et al., 2000) as an introduced species, exotics, invaders or immigrants. In Kenya, Prosopis juliflora, Prosopis chillensis, Prosopis velutina, Prosopis glandulosa var. glandulosa and Prosopis glandulosa var. torreyana were introduced in the arid and semi-arid regions by the Kenyan government in collaboration with Food and Agricultural Organization (FAO) under the fuel wood and afforestation program. This was aimed at providing fuel wood to the local communities as well as combatting desertification that was a major concern in mid 1970s and early 1980s. The introduction phase was uncoordinated which resulted into unplanned massive planting of Prosopis species by the local communities in early 1990s. The species later on became invasive colonizing existing indigenous vegetation, agricultural and grazing fields (Mooney & Hobbs, 2000). Prosopis species colonization has an effect of altering the accumulation of nutrients and their cycle and altering the hydrology system and carbon sequestration on bush lands and grasslands (Polley et al., 1997). Alien species colonization also is known to have major impacts on ecosystem services and natural forests and human socio-economic wellbeing. (Mooney & Hobbs, 2000). In Kenya, Prosopis species colonization is well evident in the arid and semi-arid regions where the indigenous woodland species have been replaced by Prosopis species. This changes the habit of birds and other organisms thereby reducing species richness and diversity (Dean et al., 2002). It is documented that bio-invasion is an important component of species extinction as a result of being outdone by the alien species (Drake et al., 1989). Recent studies indicate that Prosopis species colonization drastically reduces food resources in affected areas by occupying cultivatable fields and hindering the growth of grass thereby cutting food supply to livestock (Anderson, 1996). Local communities in arid and semi-arid areas in Kenya are mainly pastoralists who are heavily affected by the rapid decline in grazing fields. Most studies have been done concerning the impact of Prosopis species invasion on livelihood with little or no attempt made to map and quantify its colonization both in space and time.
Transcript
International Journal of Engineering Science Invention
www.ijesi.org ||Volume 4 Issue 3 || March 2015 || PP.50-55
www.ijesi.org 50 | Page
Mapping and Monitoring Spatial-Temporal Cover Change of
Prosopis Species Colonization in Baringo Central, Kenya
1, A. A. Amboka,
2, T.G Ngigi
1, 2, Department, Department Of Geomatic Engineering and Geospatial Information System, Jomo Kenyatta
University of Agriculture and Technology, P.O. Box 62000-00200, Nairobi, Kenya
ABSTRACT: This study integrates Gis and remote sensing to detect, quantify and monitor the rate at which
Prosopis species colonization has been taking place since its introduction. Multi-date Landsat 30m resolution
imageries covering a period of 25 years were classified into four classes i.e. Prosopis species dominated
canopy, mixed woodland, grass land and bush land and finally bare land and agricultural fields. Change
detection analysis was performed using 10% threshold to identify and quantify areas where change or No
change has occurred. The results indicate that the area under bare land and agricultural fields decreased at a
rate of 18.22% per year from 29% in 1985 to 3% in 1990. Between 2005 and 2010 it decreased from 9% in
2005 to 5% in 2010 at a rate of 8.94% per year. Prosopis species colonization has been increasing since 1985
where it was at 0% increasing to 51% in 1990 at a rate of 58.18% per year. Between 2005 and 2010 it
decreased from 56% in 2005 to stand at 44% in 2010 at a rate of 4.34% per year. The study found out that
there is no threat of desertification in the study area as a result of Prosopis species colonizing the landscape.
More studies to be done to identify sustainable method of controlling Prosopis species colonization to avoid
more loss of agricultural land and grazing fields.
KEY WORDS: Colonization, Prosopis species, Remote Sensing and GIS, spatial-temporal
I. INTRODUCTION
Environmentalist, resource managers and policy makers, are amongst the individuals who are more
concerned about the threat of Prosopis species colonization to biodiversity and human livelihood. Species
colonization is brought about by introducing an alien species that can withstand extreme drought conditions and
resistant to pests and diseases. The term alien species is best described by (Richardson et al., 2000) as an
introduced species, exotics, invaders or immigrants. In Kenya, Prosopis juliflora, Prosopis chillensis, Prosopis
velutina, Prosopis glandulosa var. glandulosa and Prosopis glandulosa var. torreyana were introduced in the
arid and semi-arid regions by the Kenyan government in collaboration with Food and Agricultural Organization
(FAO) under the fuel wood and afforestation program. This was aimed at providing fuel wood to the local
communities as well as combatting desertification that was a major concern in mid 1970s and early 1980s. The
introduction phase was uncoordinated which resulted into unplanned massive planting of Prosopis species by
the local communities in early 1990s. The species later on became invasive colonizing existing indigenous
vegetation, agricultural and grazing fields (Mooney & Hobbs, 2000).
Prosopis species colonization has an effect of altering the accumulation of nutrients and their cycle and
altering the hydrology system and carbon sequestration on bush lands and grasslands (Polley et al., 1997). Alien
species colonization also is known to have major impacts on ecosystem services and natural forests and human
socio-economic wellbeing. (Mooney & Hobbs, 2000). In Kenya, Prosopis species colonization is well evident in
the arid and semi-arid regions where the indigenous woodland species have been replaced by Prosopis species.
This changes the habit of birds and other organisms thereby reducing species richness and diversity (Dean et al.,
2002). It is documented that bio-invasion is an important component of species extinction as a result of being
outdone by the alien species (Drake et al., 1989).
Recent studies indicate that Prosopis species colonization drastically reduces food resources in affected
areas by occupying cultivatable fields and hindering the growth of grass thereby cutting food supply to livestock
(Anderson, 1996). Local communities in arid and semi-arid areas in Kenya are mainly pastoralists who are
heavily affected by the rapid decline in grazing fields. Most studies have been done concerning the impact of
Prosopis species invasion on livelihood with little or no attempt made to map and quantify its colonization both
in space and time.
Mapping and Monitoring Spatial-Temporal Cover Change of…
www.ijesi.org 51 | Page
This paper aims to fill this research gap by taking advantage of rich database of remote sensing data
that allows historical phenomena to be mapped and compared with the current situations. The improvement of
GIS and remote sensing software’s over the years has provided a cost effectives and faster means of studying
Prosopis species colonization (Joshi et al., 2003). This is of great importance to the policy makers in the
decision making process, environmental conservation team in environmental management effort and local
communities on how to control the colonization of Prosopis species.
1.1 Remote Sensing and GIS Techniques in Mapping Prosopis Species Colonization
Remote sensing plays a crucial in mapping and monitoring invasive species. Its ability to provide
multispectral and multi-temporal coverage at a very cost effective way has made it the number one choice for
mapping vegetation cover change over a wider geographical area within reasonable timelines (Stoms & Estes,
1993). This technology has enable researchers to conduct studies in inaccessible areas. Remote sensing offers a
wider range of sensor systems such as the aerial photographs, multi-spectral scanners, satellite imagery, low and
high spatial and spectral resolution and ground based spectrometer measurements (joshi., 2003).
The introduction of Landsat system in 1972 provided satellite system that covered most parts of the
world. These systems provided multi-date datasets that permits dynamic landscape features to be monitored
hence making it possible to detect and quantify any significance vegetation cover change both in space and time.
In South Africa, India and Sudan are amongst the countries where remote sensing and GIS technology has been
used to map and monitor Prosopis species colonization. The results have provided the potential of remote
sensing to detect any form of alien invasiveness (Lillesand & Kiefer, 1994).
II. OBJECTIVE
This study aimed at using geographical information system (GIS) and remote sensing (RS) technology to;
• Use remote sensing and GIS technology to map and quantify the actual area under Prosopis species
colonization both in space and time
• Determine the rate at which colonization has been taking place within a period of 25 years
III. STUDY AREA
The study was conducted in Baringo central which is one of the constituencies of Baringo County, Kenya. It has
two major towns, kabarnet and Marigat town. It has an area of approximately 588.52 square kilometer. The
topographical features in the constituency are seasonal river valleys, Kerio valley and hills.
Mapping and Monitoring Spatial-Temporal Cover Change of…
www.ijesi.org 52 | Page
IV. MATERIALS AND METHODS
4.1 Remote sensing data and processing
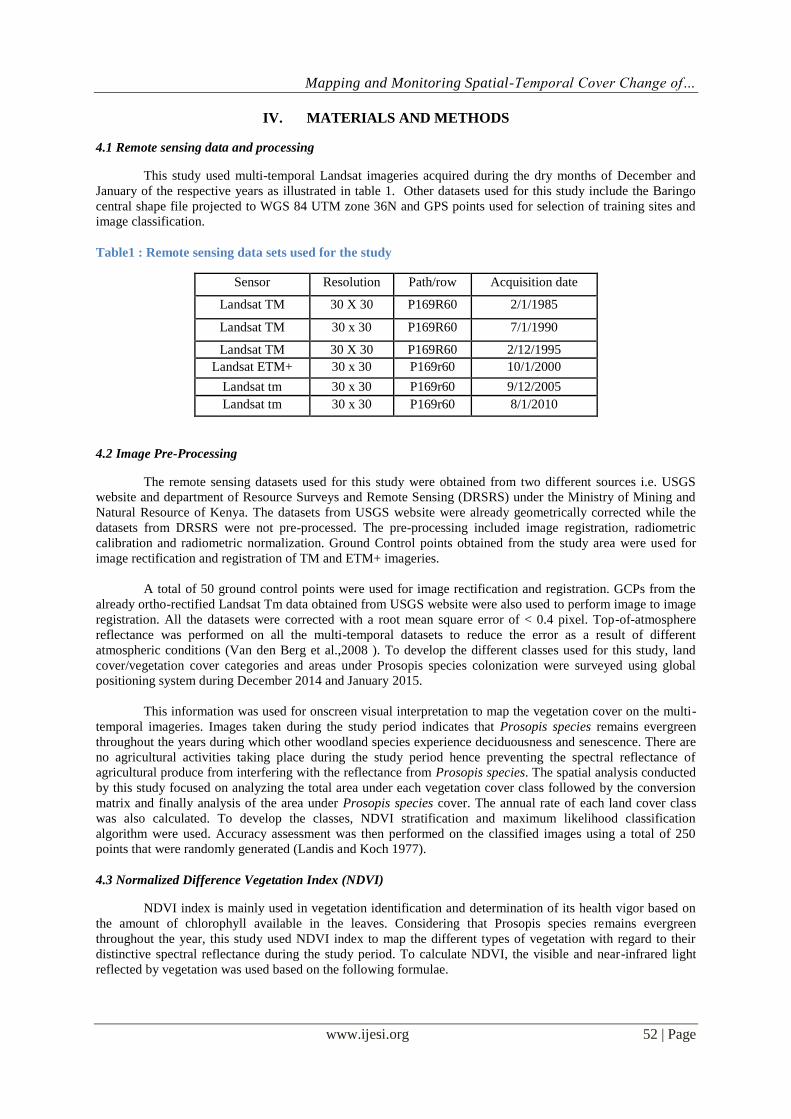
This study used multi-temporal Landsat imageries acquired during the dry months of December and
January of the respective years as illustrated in table 1. Other datasets used for this study include the Baringo
central shape file projected to WGS 84 UTM zone 36N and GPS points used for selection of training sites and
image classification.
Table1 : Remote sensing data sets used for the study
Sensor Resolution Path/row Acquisition date
Landsat TM 30 X 30 P169R60 2/1/1985
Landsat TM 30 x 30 P169R60 7/1/1990
Landsat TM 30 X 30 P169R60 2/12/1995
Landsat ETM+ 30 x 30 P169r60 10/1/2000
Landsat tm 30 x 30 P169r60 9/12/2005
Landsat tm 30 x 30 P169r60 8/1/2010
4.2 Image Pre-Processing
The remote sensing datasets used for this study were obtained from two different sources i.e. USGS
website and department of Resource Surveys and Remote Sensing (DRSRS) under the Ministry of Mining and
Natural Resource of Kenya. The datasets from USGS website were already geometrically corrected while the
datasets from DRSRS were not pre-processed. The pre-processing included image registration, radiometric
calibration and radiometric normalization. Ground Control points obtained from the study area were used for
image rectification and registration of TM and ETM+ imageries.
A total of 50 ground control points were used for image rectification and registration. GCPs from the
already ortho-rectified Landsat Tm data obtained from USGS website were also used to perform image to image
registration. All the datasets were corrected with a root mean square error of < 0.4 pixel. Top-of-atmosphere
reflectance was performed on all the multi-temporal datasets to reduce the error as a result of different
atmospheric conditions (Van den Berg et al.,2008 ). To develop the different classes used for this study, land
cover/vegetation cover categories and areas under Prosopis species colonization were surveyed using global
positioning system during December 2014 and January 2015.
This information was used for onscreen visual interpretation to map the vegetation cover on the multi-
temporal imageries. Images taken during the study period indicates that Prosopis species remains evergreen
throughout the years during which other woodland species experience deciduousness and senescence. There are
no agricultural activities taking place during the study period hence preventing the spectral reflectance of
agricultural produce from interfering with the reflectance from Prosopis species. The spatial analysis conducted
by this study focused on analyzing the total area under each vegetation cover class followed by the conversion
matrix and finally analysis of the area under Prosopis species cover. The annual rate of each land cover class
was also calculated. To develop the classes, NDVI stratification and maximum likelihood classification
algorithm were used. Accuracy assessment was then performed on the classified images using a total of 250
points that were randomly generated (Landis and Koch 1977).
4.3 Normalized Difference Vegetation Index (NDVI)
NDVI index is mainly used in vegetation identification and determination of its health vigor based on
the amount of chlorophyll available in the leaves. Considering that Prosopis species remains evergreen
throughout the year, this study used NDVI index to map the different types of vegetation with regard to their
distinctive spectral reflectance during the study period. To calculate NDVI, the visible and near-infrared light
reflected by vegetation was used based on the following formulae.
Mapping and Monitoring Spatial-Temporal Cover Change of…
www.ijesi.org 53 | Page
Using NDVI stratification, the following classes were developed and used throughout the classification process.
Table 2 : NDVI stratification
class Land use land cover class NDVI STRATIFICATION
1 Bare land and agricultural fields < 0.194
2 Grass land and bush land 0.195-0.344
3 Mixed woodland 0.345-0.644
4 Prosopis dominated canopy 0.644-1
V. RESULTS AND DISCUSSION
5.1 Mapping and Quantifying Area under Prosopis Species Relative to Other Vegetation Class
Table 3 : NDVI Stratification Results
IMAGE YEAR MIN NDVI MAX NDVI MEAN NDVI STDDEV
1985 -0.28 0.70 0.21 0.29
1990 -0.47 0.97 0.25 0.42
1995 -0.85 0.97 0.06 0.53
2000 -0.73 0.97 0.12 0.49
2005 -0.60 0.98 0.19 0.46
2010 -0.60 0.97 0.19 0.46
From Table 3 above, the minimum NDVI for study period was -0.28 while 0.98 was the maximum
NDVI. From table 4: below the area under each land cover in hectare is quantified. Prosopis Dominated
Canopy classes based on NDVI stratification was at 0% in 1985 increasing to 51% in 1990 and then dropping to
47% in the year 1995. It decrease to 29% in 2000 and later on increased to 56% and 44% in 2005 and 2010
respectively. Another area that is of more interest in this study is the area under Bareland and Agricultural fields
that decreased from 29% in 1985 to 5% in 2010. From Table 5: 2029.5 ha of Bare Land and Agricultural field
were lost to Prosopis Dominated Canopy class.
Table 4 : NDVI Results
NDVI RESULTS
1985 1990 1995 2000 2005 2010
Land use
type
Area(ha
)
% Area(ha
)
% Area(ha
)
% Area(ha
)
% Area(ha
)
% Area(ha
)
%
Bareland
and
agricultur
al fields
29849.4 2
9
2661.29 3 4506.86 4 35148.3
4
3
4
9158.31 9 5062.51
2
5
Grass and
bushland
41550.5
6
4
1
11524.7
1
1
1
20155.8 2
0
18119.9
5
1
8
12749.7
2
1
2
21046.3
6
2
0
Mixed
woodland
30788.7
5
3
0
35834.9
4
3
5
29920.9
1
2
9
19275.3
9
1
9
23059.0
8
2
3
31316.8
2
3
1
Prosopis
Dominated
canopy
102.735
6
0 52356.7
6
5
1
47796.8
6
4
7
29829.4
5
2
9
57412.1
5
5
6
44950.8
4
4
4
For visual interpretation NDVI stratification range from table 2: was used to produce the below NDVI classified
images i.e. Fig. 2 and Fig.3
Mapping and Monitoring Spatial-Temporal Cover Change of…
www.ijesi.org 54 | Page
Legend
0 3 6 9 121.5Kilometers
Figure 1: NDVI classified images of the study area
Mapping and Monitoring Spatial-Temporal Cover Change of…
www.ijesi.org 55 | Page
5.2
Vegetation change matrix
Table 5: Vegetation Change Matrix
Class type 1 2 3 4 Total 2010 (ha)
1 19051.56 13430.25 1094.04 2029.5 35605.35
2 10456.38 4474 .35 1273.23 1308.6 17512.56
3 7978.05 14235.57 8688.96 3848.49 34751.07
4 976.95 3308.67 5976.72 4254.03 14516.37
Total 1985 (ha) 38462.94 35448.84 17032.95 11440.62 102385.35
1: Bare Land and Agricultural Fields 2: Grassland and Bush Land
3: Mixed Woodland 4: Prosopis Dominated Canopy
A vegetation change matrix was developed to quantify and determine the direction of change as indicated in
Table 5 above.
Legend 0 3 6 9 121.5Kilometers
Figure 2: NDVI classified images of 2005 and 2010
Mapping and Monitoring Spatial-Temporal Cover Change of…
www.ijesi.org 56 | Page
5.3 Relative Annual rate of vegetation cove change
Figure 4: Relative annual rate of vegetation cover change
From Fig.4: The rate at which each vegetation class has been changing is demonstrated. Between 1985
and 1990 Prosopis Dominated Canopy Increased at a rate of 58.8% per year while Mixed Woodland classes
increased by 3.28% per year. In the same period Bare land and Agricultural field decreased at a rate of 18.22%
and Grass and Bush land decreased at a rate of 14.45%. Between 1990 and 1995 Prosopis dominated canopy
classes decreased at a rate of 1.74% per year and 7.52% per year between 1995 and 2000. In 2000 to 2005 it
increased by 18.49% per year before decreasing by 4.34% from 2005 to 2010.
5.4 Classification Accuracy
Error matrix was used to evaluate the accuracy of the classified images based on the 250 randomly
generated points on the classified reference map. The matrix table compared the classified class values in a class
by class matrix. The classification accuracy results indicated that the overall accuracy in 1985 was at 89.00%
with a kappa statistic of 0.8575. In 1990, overall accuracy was at 90.00% with a kappa statistics of 0.8420. The
classification accuracy reduced to 88.50% and 88.00% in 1995 and 2000 respectively with a corresponding
kappa statistics of 0.8420 and 0.8417. In 2005 the overall accuracy increased to 89.50% and further increased to
90.00% in 2010 with their corresponding kappa statistics being 0.8588 and 0.8665 respectively.
VI. CONCLUSION
From the results of Table 4: it is clear that the area under Prosopis species colonization has rapidly
increased within the 25 year period covered by the study. The Prosopis dominated canopy classes was at 0% in
1985 increasing to 51% in 1990 at a rate 58.18% per year. This rapid increase indicates how invasive this tree
species is and its ability to survive extreme climatic conditions. The highest colonization took place in 2005
where the total land cove under Prosopis species was at 56% and later on reducing to 44% in 2010. This study
will play a crucial role in determining suitable method of detecting invasive species and develop sustainable
means of managing them. Gis and remote sensing technology provided a cheaper and quicker means of
mapping invasive species over wider geographical. However the study was limited by the unavailability of high
resolution imageries that would otherwise provide more accurate and detailed information.
-40
-20
0
20
40
60
80
1985-1990 1990-1995 1995-2000 2000-2005 2005-2010
Re
lati
ve a
nn
ual
rat
e o
f ch
ange
(%)
Relative Annual Rate of Land Cover Change
Bareland and agricultural fields Grass and bushland
Mixed woodland Prosopis Dominated canopy
Mapping and Monitoring Spatial-Temporal Cover Change of…
www.ijesi.org 57 | Page
VII. ACKNOWLEDGEMENT
My deepest gratitude’s are directed to my supervisor Dr. Thomas Ngigi for taking me through this
research, to my dear wife for financial support and to my lecturers for the roles they played throughout the study
period.
REFERENCES
[1]. Richardson, D. M., Pysek, P., Rejmanek, M., Barbour, M. G., Panetta, F. D., & West, C. J., (2000). Naturalization and invasion
of aline plants: concepts and definitions. Diversity and Distributions (6), pp. 93-107.
[2]. Mooney, H. A., & Hobbs, R. J., 2000. Invasive Species in a Changing World. Island Press, Washington, DC. [3]. Polley, H. W., Johnson, H. B., & Mayeux, H. S. (1997). Leaf physiology, production, water use, and nitrogen dynamics of the
grassland invader Acacia smallii at elevated CO concentrations. Tree-Physiology, 17(2), 89-96.
[4]. Dean, WRJ, Anderson, MD, Milton, SJ & Anderson, TA 2002, Avian assemblages in native Acacia and alien Prosopis drainage line woodland in the Kalahari, South Africa, Journal of Arid Environments, vol. 51, 1:19.
[5]. Drake, J. A., Mooney, H. A., Castri, F. d., Groves, R. H.,Kruger, F. J., Aejmamek, M., & Williamson, M., (1989).Biological
Invasions: a global perspective. Chichester: John Wiley & Sons.
[6]. Anderson, G. L., Everitt, J. H., & Escobar, D. E., (1996). Mapping leafy spurge (Euphorbiaesula) infestations using aerial
photography and geographic information systems. Geocarto International, 11(1), pp. 81-89.
[7]. Joshi, C., De Leeuw, J & Van Duren IC (2003). Remote sensing and GIS applications for mapping and spatial modelling of invasive species, Department of Natural Resources, International Institute for Geoinformation Science and Earth Observation.
ITC, viewed 3 July 2008, Heywood, V. H., (1989). Patterns, extents and modes of Invasions by terrestrial plants. Chichester:
John Wiley & Sons. http://plone.itc.nl/agile_old/Conference/estoril/papers/93_Chudamani%20Joshi.pdf. [8]. Stoms, D. M., & Estes, J. E., (1993). A RS research agenda for mapping and monitoring biodiversity. Int. J. of RS (14), pp. 1839-
1860.
[9]. Lillesand, T. M., and Kiefer, R. W., (1994). Remote sensing and image interpretation. 3rd edition. John Wiley & Sons, NewYork. [10]. Van den Berg, EC., Plarre, C., Van den Berg, HM & Thompson, MW 2008, The South African National Land Cover 2000,
Agricultural Research Council - Institute for Soil, Climate and Water, Pretoria, South Africa, Report No.