Dwyer 3 Mapping Impact: An Analysis of the Dudley Street Neighborhood Initiative Land Trust by Lee Allen Dwyer Submitted to the Department of Urban Studies and Planning on May 21, 2015 in Partial Fulfillment of the Requirements for the Degree of Master in City Planning ABSTRACT This thesis examines the Dudley Street Neighborhood Initiative (DSNI) community land trust, which provides longterm affordable housing to lowincome families using a resalerestricted model and promotes community control over development. It seeks to answer the following question: how much and in what ways has DSNI’s land trust stabilized the Dudley neighborhood, specifically with regard to foreclosures, vacant lots, owner occupancy, and housing affordability? It also attempts to measure the land trust’s impact spatially and quantitatively and isolate it from economic and social changes in the surrounding neighborhood and the broader Boston housing market. Interviews with housing researchers and experts on the Dudley area supplements this quantitative analysis (a relatively rare approach to studying community land trusts). Findings largely support the hypothesis that the DSNI land trust has significantly lower building values and vacancy rates than the surrounding neighborhood, as well as significantly fewer foreclosures during the housing crisis and an increasing owner occupancy rate. It is not clear whether there is a spillover effect from the land trust onto neighboring properties within the Dudley Triangle; however, the analysis does largely support the land trust’s claims as a model for housing affordability and development without displacement. The conclusion offers implications for DSNI, the community land trust model, and Boston housing policy. Thesis Supervisor: Phillip L. Clay Title: Professor of Urban Studies and Planning
Transcript
Dwyer 3
Mapping Impact: An Analysis of the Dudley Street Neighborhood Initiative Land Trust
by
Lee Allen Dwyer
Submitted to the Department of Urban Studies and Planning on May 21, 2015 in Partial Fulfillment of the Requirements for the Degree of Master in City Planning
ABSTRACT This thesis examines the Dudley Street Neighborhood Initiative (DSNI) community land trust, which provides long-‐term affordable housing to low-‐income families using a resale-‐restricted model and promotes community control over development. It seeks to answer the following question: how much and in what ways has DSNI’s land trust stabilized the Dudley neighborhood, specifically with regard to foreclosures, vacant lots, owner occupancy, and housing affordability? It also attempts to measure the land trust’s impact spatially and quantitatively and isolate it from economic and social changes in the surrounding neighborhood and the broader Boston housing market. Interviews with housing researchers and experts on the Dudley area supplements this quantitative analysis (a relatively rare approach to studying community land trusts). Findings largely support the hypothesis that the DSNI land trust has significantly lower building values and vacancy rates than the surrounding neighborhood, as well as significantly fewer foreclosures during the housing crisis and an increasing owner-‐occupancy rate. It is not clear whether there is a spillover effect from the land trust onto neighboring properties within the Dudley Triangle; however, the analysis does largely support the land trust’s claims as a model for housing affordability and development without displacement. The conclusion offers implications for DSNI, the community land trust model, and Boston housing policy. Thesis Supervisor: Phillip L. Clay Title: Professor of Urban Studies and Planning
Dwyer 4
Acknowledgments Without my family, this thesis wouldn’t have happened. Krista, my heart, you inspire me every
single day to be more dedicated, honest, thoughtful—and ten times more organized! Thank you
for your patience, support, and encouragement over these past two years, and for not minding
when I nerd out about maps. Mom and Dad, y’all were my first teachers and y’all are still my
strongest supporters. Thank you for teaching me to question, to love learning, and to care
deeply about equity and justice. Erin, you are my hero! You’ve always paved the way for me
and challenged me to think. I’m so lucky to have all of y’all in my life.
Thank you to Phil Clay, for being a wonderfully calm thesis advisor and for providing the perfect
balance between advising and autonomy, critique and encouragement. Tony Hernandez, you’re
the man! I appreciate all the time you’ve dedicated to working with me; you always had
thoughtful and inspiring questions, ideas, and feedback. Harry Smith, Ros Everdell, Travis
Watson, Erica Leon, and everyone else at DSNI, thank y’all for welcoming me, answering my
(many) questions, and giving me the opportunity to work within an amazing, powerful
organization and community. Ceasar McDowell, thanks for introducing me to DSNI through
your practicum (and for being a great mentor).
Thank you to Emily Thaden, Gayle Willett, Greg Rosenberg, Joe Kriesberg, John Emmeus Davis,
May Louie, Penn Loh, and Rachel Bratt for taking the time to speak with me about your work
and research. You all provided such great insights that I couldn’t possibly include them all in one
thesis! Also, thanks to Erin Graves and Chris O’Keefe for their input, to Laura Delgado for helping
me track down elusive data, and to Alison Hynd/PSC for funding my work over the summer.
My fellow MCPs, y’all are an incredibly talented bunch. I’ve learned so much from you— from
Andrew B., Halley, Sofia, Leo, Nene, Jennifer Ly, Callie, Danya, Jason, and plenty of others I’m
forgetting to mention. Thanks for keeping me motivated, inspired, and entertained. Also a
special shout-‐out to the tireless staff of CRON and DUSP!
I’d also like to acknowledge coffee, the Pacific Rim soundtrack, ArcGIS discussion forums, my cat,
the Muddy Charles Pub, Zotero, Terry Pratchett (R.I.P.), and the MIT Libraries for their vital roles
in the process of writing this thesis.
Dwyer 5
Table of Contents
Chapter 1: Introduction...................................................................................................... 7 A DIFFERENT APPROACH................................................................................................ 9
Chapter 2: Literature on Community Land Trusts and Housing in Boston.......................11 Chapter 3: The History and Context of the DSNI Land Trust ............................................21 OTHER ACTORS: COMMUNITY DEVELOPERS IN DUDLEY .............................................27 FORMATION OF THE LAND TRUST ...............................................................................28 COMMUNITY LAND TRUST: AN UNUSUAL APPROACH ................................................31 HOUSING IN BOSTON: FROM COOL TO HOT................................................................34
Chapter 4: Methodology, Definitions, and Hypotheses ...................................................37 EVALUATING THE CLT MODEL......................................................................................37 THE STUDY AREA ..........................................................................................................39 SOURCES OF DATA .......................................................................................................42 DEFINING INDEPENDENT & CONTROL VARIABLES.......................................................43 DEFINING DEPENDENT VARIABLES...............................................................................46 SPATIAL & QUANTITATIVE METHODS USED.................................................................50 QUALITATIVE METHODS USED.....................................................................................51
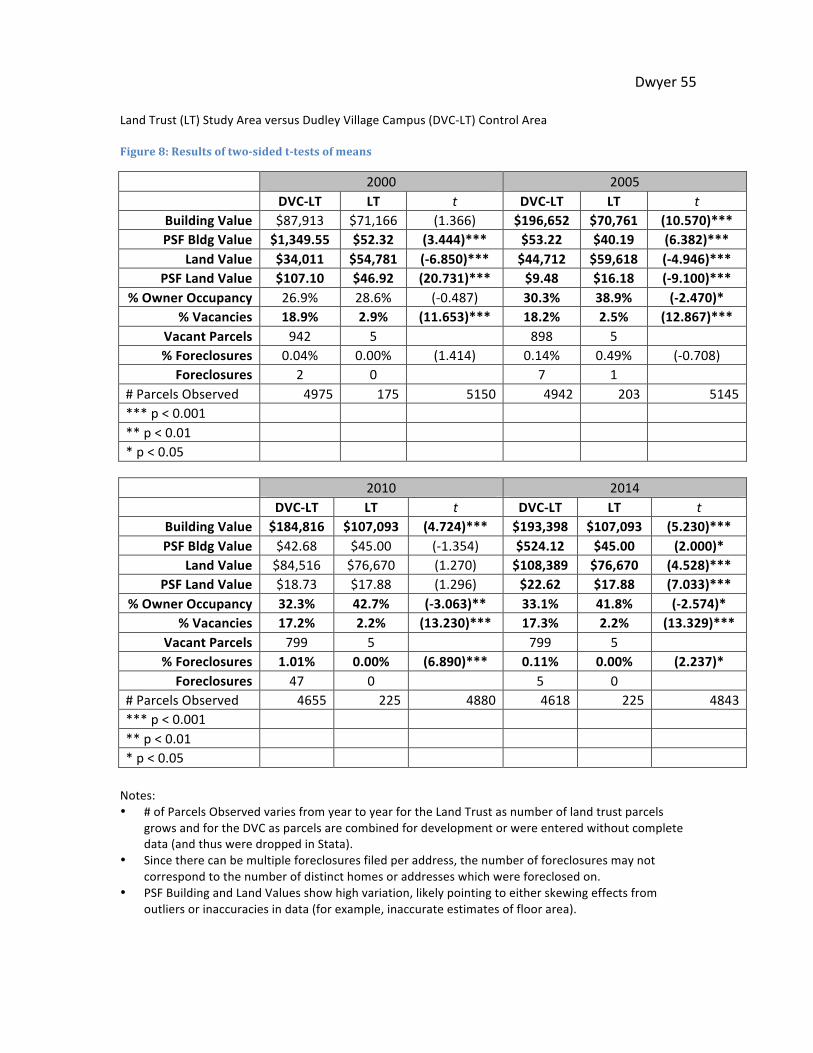
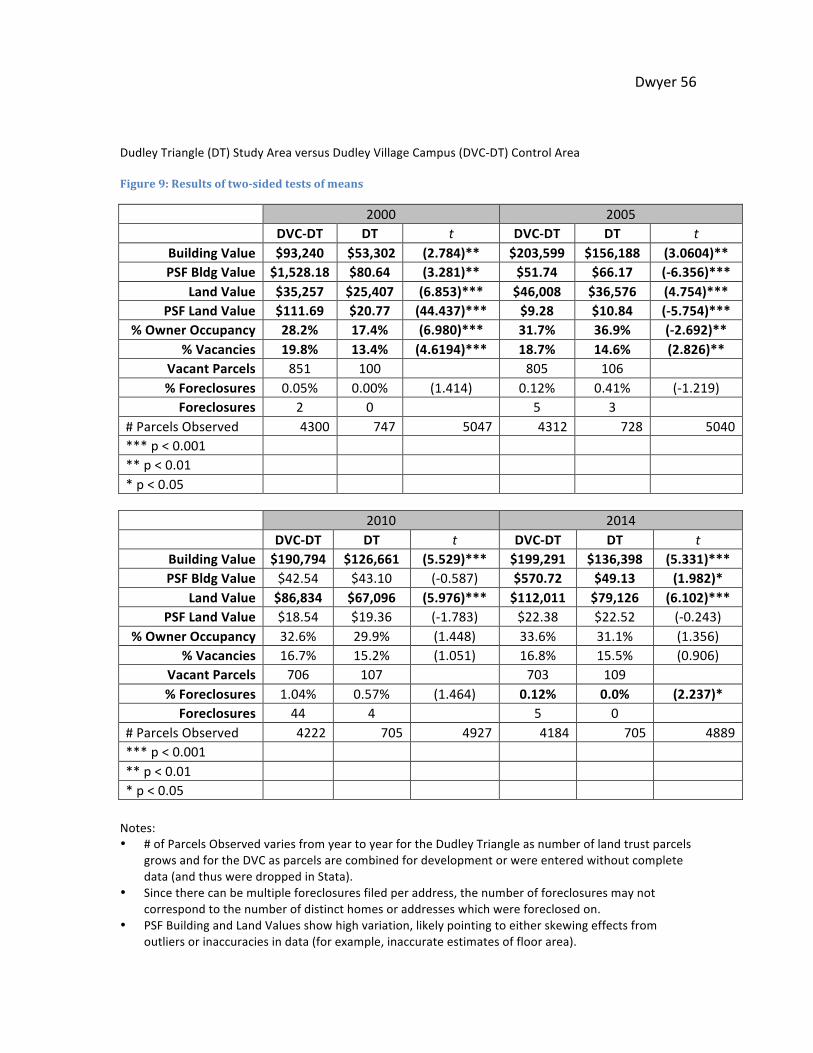
Chapter 5: Analysis & Results...........................................................................................52 SPATIAL & QUANTITATIVE RESULTS.............................................................................52 QUALITATIVE RESULTS .................................................................................................60 LIMITS OF ANALYSIS AND DATA IMPLICATIONS...........................................................62
Chapter 6: Conclusion ......................................................................................................64 IMPLICATIONS FOR DSNI AND THE DUDLEY NEIGHBORHOOD ....................................66 IMPLICATIONS FOR COMMUNITY LAND TRUSTS .........................................................67 IMPLICATIONS FOR BOSTON........................................................................................68 CONCLUSION................................................................................................................69
Appendix ..........................................................................................................................73 SUPPLEMENTAL MAPS, TABLES, AND CHARTS.............................................................73 INTERVIEW INSTRUMENTS...........................................................................................97
Chapter 1: Introduction This winter, heavy snow made the remaining vacant lots in the Dudley
neighborhood even more visible than they usually are. Except where kindhearted
neighbors shoveled the sidewalks along these lots, waist-‐high drifts forced pedestrians
to walk in the narrow streets; the white blankness of the open lots contrasted with
neighboring buildings, many of them built on similar, formerly abandoned parcels.
Thirty years ago, hundreds of such spaces, often turned into dumping grounds by trash
haulers, marred the landscape. Meanwhile residents struggled against the burdens of
poverty, low-‐quality housing, encroaching speculative development, and a political
structure that did not seem designed for their involvement or best interests.
Some of these residents, with crucial support from a few local funders and
community leaders, founded the Dudley Street Neighborhood Initiative (DSNI) in 1984.
Winning early victories against illegal dumping and organizing community events, the
grassroots organization also took two key actions that would shape its future: it led a
participatory, comprehensive planning effort, and it applied for and received eminent
domain over vacant land within a 64-‐acre area called the Dudley Triangle (see Appendix,
Figure 12), a first for community organizations in the US (Sklar and Medoff 1994, Taylor
1995, Sklar 2008). Over the next two and a half decades, DSNI would acquire and
develop more than half of the 30 acres of vacant lots within that triangle (see Figures 4
Dwyer 8
and 5) while engaging community members in ongoing dialogue about their visions and
desires for the neighborhood (Sklar and Medoff 1994).
Today, those newer buildings next to the vacant, snow-‐filled lots make up a
community land trust (CLT), providing affordable rental and owner-‐occupied housing to
low-‐income families, as well as space for community service providers and urban
agriculture. DSNI’s land trust1 has long attracted attention from urban planners and
community organizers from across the country, but it is also drawing increased interest
among local organizations, media sources, and politicians. This, combined with the
organization’s 30th anniversary last year and an ever-‐tightening real estate market
locally, makes now an important time to carefully examine the land trust and its impacts.
It could also provide some valuable lessons for the organization itself, suggesting
opportunities for boosting its future impact or further areas for evaluation.
Boston is one of the most expensive cities in the country, and rising housing
prices show little sign of slowing down (Bluestone et al. 2015). While the city has a
relatively large stock of affordable housing compared to other cities, demand still far
outstrips supply, particularly among low-‐ to moderate-‐income households. Yet at the
same time, federal funding for new affordable housing has fallen in recent years, placing
financial pressure on city and state government and reducing incentives for developers
to build below-‐market rate units.
1 DSNI operates a subsidiary called Dudley Neighbors, Inc., which technically controls the land trust. However, in the neighborhood as well as in the larger city context and in the literature, DSNI is better known and more commonly used as a term. In this thesis, I will refer to “DSNI” exclusively to denote both DSNI and the subsidiary DNI. I will also use “CLTs” or “community land trusts” when discussing the model in general, and “the land trust” when referring to the DSNI community land trust for the sake of both brevity and clarity.
Dwyer 9
In this context, the CLT model2 appears to be an attractive alternative to
traditional forms of affordable homeownership, since its resale restrictions reduce the
amount of subsidy required over time (Davis and Jacobus 2008) (see Figures 1 through
3). However, few have studied the model and its purported correlation with
community-‐level benefits like neighborhood stability and long-‐term housing
affordability using quantitative or spatial methods. Additionally, DSNI itself, while the
subject of many case studies and other qualitative research, has not been analyzed
using more statistically rigorous, data-‐driven methods.
This thesis aims to address that gap and to provide some answers about a tool
and an organization that seem to successfully combat some of the thorniest urban
problems. I will seek to answer the following question: how much and in what ways
has DSNI’s land trust brought stability to the Dudley neighborhood, specifically with
regard to foreclosures, vacant lots, owner occupancy, and housing affordability? Is it
possible to measure the land trust’s impact and isolate it from overall changes in the
surrounding neighborhood and the broader market?
A DIFFERENT APPROACH
In this thesis, I approach the DSNI land trust from a primarily spatial perspective,
attempting to address whether this place-‐based strategy for affordable homeownership
2 CLTs maintain long-‐term housing affordability via a limited-‐equity model, restricting resale prices of homes to a certain percentage over the initial sale price. The land trust keeps ownership of the land upon which homes are built, leasing it to homeowners often for 99-‐year terms, and charging a small ground lease fee (which usually subsidizes CLT operations). These two measures together prevent CLT homeowners from selling these low-‐cost homes and the land on which they are built to speculative developers, keeping them affordable through multiple sale cycles. Finally, CLTs generally have income limits for homeowners, selling only to households with an income below a certain level or percentage of AMI. See Davis 2008, Davis 2010, The Community Land Trust Handbook.
Dwyer 10
and community-‐controlled revitalization has a measurable impact on the neighborhood
in which it is embedded. I also seek to quantify this impact, using data on housing
affordability, vacancy, owner occupancy, and foreclosure, and to compare it to data
from a control area using statistical analyses. This differs from most previous research
on community land trusts, as will be seen in the literature review section, and offers a
new research perspective on DSNI. I also supplement the quantitative analysis with
qualitative research, including interviews with key housing researchers and experts on
the Dudley community. Since documentation, impact analysis, and data visualization
are increasingly important to community organizations seeking funding or other support
from private foundations, government agencies, and policymakers, the analysis and
maps produced in the course of my research will hopefully prove useful to the
organization itself. Influenced by principles of participatory action research, I worked
with Tony Hernandez, Director of Operations and Stewardship for the land trust, as well
as others at DSNI to ensure that this community-‐based thesis would be valuable to the
work of DSNI, its volunteers, and its partners.
This first thesis section is followed by Chapter 2, which reviews the relevant
literature on community land trusts, the housing market in Boston, and the measures
used in my analysis. Chapter 3 explores the history of DSNI and the Dudley
neighborhood and provides additional context on affordability, foreclosures, and other
factors affecting housing in Boston. Chapter 4 discusses methodology, outlining
variables and controls, analytical tools used, data sources, and interviewing methods,
setting up the analysis developed and interpreted in Chapter 5. I conclude in Chapter 6
Dwyer 11
by summarizing findings, discussing implications and limitations of the research,
outlining lessons from DSNI’s land trust and conditions for success, and suggesting areas
for future study. Additional tables and maps, as well as research instruments, will follow
in the appendices.
Chapter 2: Literature on Community Land Trusts and Housing in Boston
Community land trusts received a great deal of attention during their early days
when many of the seminal texts on the movement were first published, such as The
Community Land Trust: A Guide to a New Model for Land Tenure in America (Swann
1972), The Community Land Trust Handbook (ICE 1982), and The Community Land Trust
Legal Manual (Abromowitz 1991), before they faded somewhat into the background of
urban land and housing policy. More recently, interest in them has begun to grow again,
as more organizations—and increasingly, city governments—have turned to them as a
model for ensuring long-‐term housing affordability and “development without
displacement” (Davis 2010, preface).
As Julie Farrell Curtin and Lance Bocarsly point out in “CLTs: A Growing Trend in
Affordable Home Ownership”, CLTs hold appeal for policymakers and communities alike
during both “boom times” and “bad times”, in that they keep housing affordable with a
lower level of subsidy when prices are rising and prevent over-‐leveraging and
foreclosure when housing markets contract (in Davis 2010). Yet despite this renewed
popularity and the pressures of extremely tight housing markets in flourishing cities like
Dwyer 12
Boston, there is insufficient quantitative research on CLTs, particularly at a
neighborhood level. An examination of the literature indicates that a close analysis of
the Dudley neighborhood land trust would provide much insight and new information.
A renewed focus on the DSNI land trust is timely, not least because last year
marked the organization’s 30th anniversary. In addition, Mayor Marty Walsh recently
released a planning report, Housing a Changing City: Boston 2030, which cites land
trusts in the first of its six goals for Boston neighborhood development: “Mitigate
impacts of gentrification through targeted homebuying programs, strategic acquisitions,
community land trusts, tenant assistance, and expanded outreach to seniors” (2014).
The report specifically lauds the DSNI model:
Community land trusts have been used in Boston with proven success. For example,
for the past thirty years, the Dudley Street Neighborhood Initiative (DSNI) land trust
has ensured that new development in the community serves a broad range of
income levels and needs.
Yet why has the city prioritized this model of sustained affordable housing specifically?
And why has it come to the forefront now? A broader examination of housing market
studies, the CLT movement, and the DSNI land trust’s context, can help answer those
questions.
Affordable housing is a serious concern in many American cities, particularly in a
high-‐demand housing market like Boston. While new Boston-‐area housing construction
has begun increasing again during the economic recovery (BRA “2013 Economy Report”
2013), so have home prices (Bluestone et al. 2013, Bluestone et al. 2015). Rebounding
Dwyer 13
home and condo sales demand, the overall economic growth of the metropolitan area,
and population growth have contributed to a sales vacancy rate of about 2% from 2012
through 2014 (Bank 2012, Bluestone et al. 2015). Additionally, the rental vacancy rate
has remained below 4.2% since 2011, due to pressures from growing numbers of
students and young professionals unable to purchase homes, as well as former
homeowners who lost out to foreclosures during the recession (Bluestone et al. 2013).
All this indicates that Boston has an extremely tight housing market, with high rental
and mortgage costs that continue to rise.
At the same time, wages for the lowest-‐income residents have not kept up with
increasing housing costs. According to Dr. Amy Glasmeier’s Living Wage Calculator, the
hourly living wage for a family of two adults and two children in the Boston area would
be $22.40, more than twice the city’s current $9.00 minimum wage (Glasmeier 2014). As
a result, according to the Greater Boston Housing Report Card, just over half of the city’s
renter households were rent-‐burdened from 2011 to 2013, spending more than 30
percent of their gross incomes on housing, while nearly 40% of homeowners were
similarly burdened by mortgages (Bluestone et al. 2013, Bluestone et al. 2015). This has
also put pressure on low-‐ to middle-‐income homeowners, making housing a top priority
of Mayor Walsh and neighborhood advocates alike.
As a result, fears of gentrification and displacement have taken center stage in
popular discussion of housing policy, development, and city planning, particularly in
historically black and Latino neighborhoods like Roxbury and Dorchester (Miller 2014,
“Mapping Neighborhood Transformation” 2014). Those fears may not be unfounded:
Dwyer 14
according to analysis by the Federal Reserve Bank of Cleveland, Boston has one of the
highest rates of gentrifying census tracts (Hartley 2013). Housing researchers at
Northeastern’s Dukakis Center concur that “once-‐affordable neighborhoods are
gentrifying” (Bluestone et al. 2015). Perhaps paradoxically, some of these areas and
their neighbors were also hardest-‐hit by foreclosures during the latest housing crisis
according to the Massachusetts Housing Partnership Foreclosure Monitor and Warren
Group data, and were the sites of widespread abandonment, arson, and neglect from
the late 1960s through the 1980s (Sklar and Medoff 1994).
Vacant lots and boarded-‐up buildings are still all too common along Dudley
Street, Blue Hill Avenue, and to a lesser extent, within the Dudley Triangle containing
the land trust (see Figure 5 and Appendix, Figure 12); left to market forces, these
properties might be sold by the city or their private owners and converted to high-‐price
condo buildings or homes, pushing homeownership beyond the reach of lower-‐income
residents like many in the Dudley neighborhood. The community members who formed
DSNI recognized these risks for both blight and gentrification, and made “development
without displacement” an explicit priority for the organization from its inception (The
Dudley Street Neighborhood Revitalization Plan 1987).
Constructing new affordable housing and distributing additional housing
vouchers for low-‐income families are not necessarily the sole remedies to these
problems, at least in the long run. For one thing, affordable housing doesn’t always stay
affordable. The federal Low-‐Income Housing Tax Credit requires that housing remain
affordable for a minimum of 15 years, and some units are on the brink of expiring
Dwyer 15
(Meléndez et al. 2008). The Boston Redevelopment Authority requires that units
developed under its Inclusionary Development Program remain affordable for at least
30 years (BRA N.d.); however, the BRA measures “affordability” by the HUD-‐defined
Area Median Income, which is considerably higher than the median income of the
Dudley neighborhood (BRA 2015). For instance, the Boston-‐wide AMI for a family of
four in 2015 is $98,500 (BRA 2015), while 80% of families owning homes on the DSNI
land trust earn less than $70,000 per year (“Land Trust 101” 2015). Thus, while Roxbury
may have a high concentration of affordable units, they may not be as “affordable” as
they might seem, or remain that way for as long as they are needed.
Community land trusts present an appealing alternative, since by definition they
limit resale value, incentivize longer-‐term ownership, reduce speculative purchasing of
homes or vacant lots, and strive to promote “development without displacement” and
homeownership among low-‐income residents (Davis 2010, Dwarka 2014, Sungu-‐
Eryilmaz and Greenstein 2007). Additionally as John Emmeus Davis and Rick Jacobus
explain, even truly affordable housing with no resale restrictions require larger and
larger subsidies in markets with rising property values, while a community land trust
model requires less in the way of re-‐subsidization over time (see Figures 1 through 3 on
following page). This makes the model a particularly attractive option to cities with fast-‐
rising housing prices and little federal funding (Mironova 2014). Thus as multiple
references have stated and a 2007 survey of CLTs nationwide found, “[t]he CLT
movement has been witnessing growth in the last decade” (Sungu-‐Eryilmaz and
Greenstein 2007).
Dwyer 16
Figure 1: Typical Housing Subsidy in Hot Market (Davis and Jacobus 2008)
Figure 3: Recapture of Typical Housing Subsidy (Davis and Jacobus 2008)
Figure 2: CLT Retention of Housing Subsidy (Davis and Jacobus 2008)
Dwyer 17
As interest from policymakers and housing advocates in this housing model has
grown, there has been a corresponding increase in recent research on CLTs. The
mechanisms and property tax implications of restricted resale have been explored
(Voith and Wachter 2012, Bagdol 2013), CLTs have been studied in an international
context (Wallace 2012, Davis 2010, Moore and McKee 2012), and case studies have
examined specific CLTs, including DSNI, from a more sociological perspective (Nagel
1990, Gray and Galande 2011, Thaden et al. 2013, Meehan 2014). This research has
contributed to a deeper understanding of CLTs and their effects. For instance, Voith and
Wachter explored the tension between municipalities’ tax-‐maximizing priorities and the
long-‐term affordability goals of CLTs, while noting that the model “may prove to be the
best of the third-‐sector [not public, not private] methods for preserving affordability”.
In order to live up to this potential and overcome any potential resistance from
policymakers or the “growth machine”, CLTs must be able to back up their claims of
affordability protection with hard facts.
However, there has been very little quantitative analysis of CLTs and their
impacts on urban communities, apart from working papers published by the Lincoln
Institute of Land Policy (which I will explore further in a moment). Kevin Dwarka, in his
review of strategies to maintain affordable housing in revitalized areas (in which he
includes CLTs), states that comparative evaluation of such strategies’ effectiveness
“remains underdeveloped in the professional housing literature and is ripe for further
study” (2014). Similar points were made by a number of CLT and housing experts I
consulted in interviews (see Chapter 5, Qualitative Results).
Dwyer 18
The primary quantitative study of community land trusts’ effectiveness is a
Lincoln Institute of Land Policy working paper written by Emily Thaden and Greg
Rosenberg in 2010; it compares delinquency and foreclosure rates of mortgaged
properties on CLTs to those of properties with traditional private mortgages (both prime
and subprime loans). They found that “a prime loan […] was 5.9 times more likely to be
in the process of foreclosure on Dec. 31st, 2009 than a CLT loan”, while subprime loans
were 27.8 times more likely to be in foreclosure than CLT loans (Thaden and Rosenberg
2010). The authors propose that the difference is due not only to the fact that CLTs limit
the housing burden on low-‐income homeowners by selling homes at an affordable price,
but to the “stewardship policies and practices” most CLTs exercise, such as offering pre-‐
purchase education, support to homeowners, and foreclosure intervention. DSNI, for
instance, runs homebuyer classes and events and publishes a “Homeowners Guide”
with resources on home maintenance and repair financing, among other efforts to
support homeowners (Dudley Neighbors Incorporated Land Trust Homeowners Guide
2013).
Additionally, as Greg Rosenberg noted in an interview with me, the relationship
between CLT and homebuyer goes well beyond the initial purchase:
“[W]e have the ground lease fee, [so] if they miss a payment, it’s an early
warning system. [Plus we have a] trusted relationship with the homeowner so
they talk to us. We can work with them either to keep them in the home or have
an orderly sale of the home, so it doesn’t affect their credit or go into
foreclosure.”
Dwyer 19
Reflecting this reality, Thaden and Rosenberg’s findings support the premise that CLTs
promote neighborhood stability as well as the financial wellbeing of families and
individual homeowners who live on land trusts.
However, the working paper also has its limitations: its data came from a survey
administered to nationwide CLT organizations, and may have been skewed by self-‐
reporting or a low response rate. Additionally, the sample includes many smaller and
more recently-‐founded land trusts (the median year for establishment was 1999), which
may have a vastly different scale of influence than a relatively larger, longer-‐running CLT
like the Dudley land trust (Thaden and Rosenberg 2010). The housing market
characteristics, geographic contexts, and demographics of these land trusts may also
vary from those of DSNI. Finally, the paper does not measure the impact of land trusts
at a smaller scale, nor does its analysis compare CLT properties to their neighbors or
utilize any other spatial comparison. Since CLTs are a primarily place-‐based,
community-‐focused model (and since their forms, regulations, and operations vary so
widely from trust to trust), I believe it is crucial to examine their effects at such a level.
Another study of land trusts, also a Lincoln Institute of Land Policy working paper,
relies on similar self-‐reported survey results and compares individual CLTs, rather than
the effects of a particular CLT. Undertaken by Yesim Sungu-‐Eryilmaz and Rosalind
Greenstein in 2007, this study’s main goal “was to obtain baseline information from
organizations using the CLT model”, concerning their structure, operations, and history,
“since there is no pre-‐existing body of systematic empirical information about the work
of CLTs”. It did not examine the effectiveness or impact of the CLTs surveyed; moreover,
Dwyer 20
the data gathered relied on self-‐reporting and may have been skewed due to non-‐
response errors. The authors of this paper recognize the need and opportunity for
“systematically address[ing] evaluative questions about the effectiveness of the CLT
model” and note that particular questions will require different levels of analysis:
“To understand the contribution that the CLT makes in adding to and preserving the
stock of permanently affordable housing, we will need analysis at the level of the
local housing market; to understand the role that the CLT makes towards
community building, we will need analysis at the level of the community.” (Sungu-‐
Eryilmaz and Greenstein 2007).
A similar 2001 survey of eighteen CLTs nationwide, conducted by George
Levinger for the now-‐defunct Institute for Community Economics (ICE), went into more
detail. The survey’s purpose was “to gather information about respondents’ CLT
supported the CLT model; for example, 91% of respondents were satisfied with their
home on a CLT, and 95% agreed that the CLT “enabled them to become homeowners
more quickly than they otherwise would have” (Levinger 2001). Yet Levinger, too, called
for further research at multiple scales and on various topics, particularly given the
diversity of CLT operations and contexts.
The one published study that examined a single land trust (rather than a sample
of CLTs) from a semi-‐quantitative perspective, conducted by John Davis and Amy
Demetrowitz in 2003, provides the closest analogy to the approach taken in this thesis.
The authors examined resales, affordability, foreclosures, and household wealth and
Dwyer 21
mobility on the Burlington Community Land Trust—a similarly large and well-‐established
CLT, though its housing market differs from that of Boston. The study, which combined
portfolio analysis and homeowner surveys found that “the performance of the BCLT’s
portfolio of resale-‐restricted, owner-‐occupied housing provides encouraging evidence of
the model’s effectiveness” (Davis and Demetrowitz 2003). However, one limitation of
this study is that it does not provide a consistent control for its analysis. While Davis
and Demetrowitz compare median prices of BCLT resales, for instance, to county-‐level
median sales prices of market-‐rate homes, they do no establish whether this larger area
is comparable in terms of demographics, land use, or transit access, nor do they
calculate the statistical significance of their findings.
My thesis hopefully helps address part of this research gap and provides a deeper
analysis, taking a closer look at the effects of DSNI’s land trust in particular. It takes the
unusual approach of using GIS mapping to visualize findings and establish control
variables. It also offers a community benefit, in that it will either strengthen the case for
DSNI’s land trust in preserving affordability and stabilizing the neighborhood or help
show where the model’s effects might be insignificant or unclear.
Chapter 3: The History and Context of the DSNI Land Trust
The story of the Dudley neighborhood, leading to the founding of DSNI and the
creation of the community land trust, is an all-‐too-‐familiar one in the history of many
American cities. It began as a white immigrant enclave before blockbusting, white flight,
Dwyer 22
and redlining combined with the Great Migration made it the heart of Boston’s black
community. In the late 1960s and 1970s, disinvestment, municipal neglect, and
economic decline brought trouble to the area, while formerly thriving, predominantly
black-‐owned businesses and middle-‐class families waned. From 1960 to 1970 alone,
Roxbury (which includes much of the Dudley neighborhood) lost an estimated 6,000
housing units largely to arson and ill-‐conceived urban renewal projects (BRA Boston by
the Numbers: Housing 2013). By the early 1980s, the aforementioned book Streets of
Hope and the documentary Holding Ground as well as contemporary newspaper articles
portray a politically powerless and neglected neighborhood blighted by abandoned cars,
dumping, and failed redevelopment efforts.
The earliest maps of the Dudley Triangle still in possession of DSNI staff
underscore how radically the neighborhood’s landscape has changed since then. Whole
swathes of streets were empty of buildings, whereas today the remaining vacant lots
merely pockmark the neighborhood (see following pages, Figures 4 and 5). Census data
bears out this difference: poverty rates were higher in 1980, income levels lower (a
median household income of $11,500 in the triangle, or about $32,800 in today’s terms)
(see Appendix, Figures 20 and 21). Yet the area remains one of the poorest in the city
(median household income in 2000 was $27,000, or around $36,700 today), and still has
many more empty lots than other parts of Boston.
Dwyer 23
Figure 4: Vacant lots in the Dudley Triangle, c. 1987-1988. (DSNI N.d.)
Dwyer 24
Figure 5: Vacant lots in the Dudley Triangle, 2014. Data sources: MIT, City of Boston Assessing Department, DSNI.
Dwyer 25
Apart from maps and Census numbers, plenty of residents and DSNI staff
members (current and former) remember quite well what the area used to be like.
Longtime residents remember that Mary Hannon Park, now bordered by land trust
properties and the venue of DSNI's annual Multicultural Festival, was once an unsafe
place, where drug dealing was rampant and parents did not allow their children to go
play (Everdell 2015, Dwyer 2014)3. As resident Julio Henriquez said, “When we moved
here as a family, the whole community was just really devastated,” with vacant lots full
of litter and dumped cars (Gaining Ground 2014). Yet despite these challenges,
residents had not given up on their community.
As Laura Gail Spark wrote in her 1992 thesis on DSNI’s youth programming,
things began to change in the 1980s, when:
[I]ntense city-‐wide development pressures, coupled with the abundance of
vacant land in the Dudley Triangle, caused a reversal of this official inattention.
As the city began looking to oft-‐bypassed Roxbury plots for potential
development opportunities, Dudley residents became concerned that they
would rapidly lose control over their community-‐-‐either via the hands of outside
speculators or through continued abuse and dumping on abandoned properties.
Many living in Roxbury had previously seen the effects of urban renewal and
development on other parts of the city, particularly the nearby South End and the West
3 This park was reclaimed in the early 90’s through the efforts of DSNI community organizers, who organized the first cultural festival and a summer camp in the space. See Spark; Sklar and Medoff.
Dwyer 26
End, and had witnessed or participated in successful opposition to the proposed
Southwest Expressway through the heart of Boston (Crockett 2012).
Around the same time, a new wave of immigration brought many Latino and
Cape Verdean families to the neighborhood, and they became involved in identity-‐based
organizations like La Alianza Hispana and the Cape Verdean Community House (Sklar
and Medoff 1994). These new arrivals contributed energy and growth to the area (as
well as several restaurants that became neighborhood favorites), but they too were
concerned about blight, displacement, crime, and the lack of quality affordable housing.
As the DSNI website states, the organization “was formed in 1984 when residents of the
Dudley Street area came together out of fear and anger to revive their neighborhood
that was devastated by arson, disinvestment, neglect and redlining practices, and
protect it from outside speculators” (DSNI 2014).
Rooted in these residents’ determined activism and their desire for greater
community voice in redevelopment, the newly-‐formed organization both pushed for
immediate halts to dumping and coordinated a long-‐term, comprehensive planning
effort for the neighborhood. Community members also spurred DSNI to establish a tri-‐
partite board of governance (common among land trusts), with a minimum of sixteen
seats for local residents, twelve of which would represent the major ethnic groups in the
neighborhood (Putnam 2003). Apart from the land trust itself, these three features—
the sustained emphasis on community organizing and empowerment, a long-‐term,
comprehensive view of planning, and active community governance—set DSNI apart
from the main affordable housing developers in the Dudley area.
Dwyer 27
OTHER ACTORS: COMMUNITY DEVELOPERS IN DUDLEY
DSNI is not the only organization in the area concerned with both community-‐
building and affordable housing. According to Joe Kriesberg of MACDC, there are three
main community development corporations (CDCs) operating in the neighborhood:
Nuestra Comunidad Community Development Corporation, Dorchester Bay Economic
Development Corporation, and Madison Park Development Corporation (2015). A
fourth development organization, Quincy Geneva Housing Corporation, has also had
some influence on the Grove Hall area. While not a CDC, the multi-‐service organization
Project Hope has partnered with DSNI over the years, and has contributed to housing
and stability in the area. However, I will focus here on the first three organizations since
it seems they have had a larger direct impact on housing within the study areas.
Nuestra Comunidad was founded in 1981 by community members in conjunction
with La Alianza Hispana, born from the same needs and hopes as DSNI: to deal with
neighborhood issues like crime and vacancy, to empower predominantly immigrant
residents, and to bring new life and new, affordable homes to the community (Nuestra
Comunidad CDC N.d.). In fact, Nuestra Comunidad was a member of the Dudley
Advisory Board funded by the Riley Foundation, which gave rise to DSNI (Sklar and
Medoff 1994). Their current focus area overlaps that of DSNI, and they have partnered
as a land trust developer on the Stafford Heights Co-‐ops, Howard Dacia Townhouses Co-‐
op, and 10 units on Sargent Street (see Appendix, Figure 13).
Founded in 1979, Dorchester Bay EDC has built nearly 1000 units across
Dorchester, about three-‐quarters of which are rental units, and also provides some
Dwyer 28
home improvement and business loans (Dorchester Bay EDC N.d.). Its service area
covers most of the Dudley Village Campus, and they have partnered with DSNI on the
land trust’s Dudley Village Homes, the Alexander/Magnolia Co-‐ops, and most recently
the Bornstein Pearl Food Production Center (see Appendix, Figure 13). Since community
organizations and religious institutions participate in DSNI’s tri-‐partite governance
structure, a representative from Dorchester Bay EDC currently serves on the Board.
The oldest of the three local CDCs, Madison Park Development Corporation
(MPDC) was established in 1966 in opposition to urban renewal projects that had
already razed parts of Roxbury; its original name was the Lower Roxbury Community
Corporation. MPDC is dedicated to “promoting the notion of resident-‐led development”,
and has developed over 500 units of affordable housing, mostly clustered near Dudley
Square (Madison Park Development Corporation N.d.). Over the years, it has shifted
from merely focusing on housing development to offering youth programming and
other services. Along with Dorchester Bay EDC and Project Hope, a representative from
MPDC currently serves on the Board of DSNI.
FORMATION OF THE LAND TRUST
The story of DSNI’s creation is well documented in Streets of Hope, in Holding
Ground and Gaining Ground, and on DSNI’s website. Less clear, however, is where the
idea for a community land trust in Dudley came from. Streets of Hope, otherwise quite
detailed in its coverage of DSNI’s early history, does not describe the precise origins of
the land trust concept. Longtime organizer Ros Everdell said it came from community
members, out of a desire for community ownership (interview). May Louie remembers
Dwyer 29
that the now-‐defunct Institute for Community Economics (ICE) brought the land trust
idea to the Dudley neighborhood around 1987 or 1988 (interview). At any rate, when
the “Dudley Street Neighborhood Initiative Revitalization Plan” was published in
September 1987, this comprehensive plan created by community members and
consultants recommended the land trust model, though it emphasized its use as a
“mechanism that would allow the acquisition of land” rather than as a means of
maintaining affordability. Yet given that development without displacement was a
founding goal of DSNI, and given residents’ active involvement and desire for
community control, it is easy to see why the land trust concept caught on so readily.
The land trust gained even more momentum early on, as DSNI added a unique
tool to its development without displacement arsenal: the power of eminent domain.
Commonly cited as the only community organization in the United States possessing
eminent domain, DSNI perhaps paradoxically utilized a state law intended for urban
renewal projects to gain this unusual power, Chapter 121A (Keating 1994, Meehan 2014,
Putnam 2003, Taylor 1995). Among the statute’s goals were “achieving permanent and
comprehensive elimination of existing slums, and sub-‐standard, decadent and blighted
conditions and in preventing the recurrence or redevelopment of such conditions”
(Massachusetts General Court 1946).
According to Streets of Hope, the idea to employ eminent domain first came
from community developer Peter Munkenbeck, who along with DSNI’s then-‐Executive
Director Peter Medoff realized it would be difficult to assemble and acquire scattered
vacant parcels for development (Sklar and Medoff 1994). DSNI then asked a legal firm
Dwyer 30
working pro bono for them to research the possibility of using eminent domain. The
firm members found that it would indeed be possible, under Chapter 121A’s provisions,
if DSNI managed to “secure the approval of both the BRA board and the mayor” (Sklar
and Medoff 1994). Unaware of this behind-‐the-‐scenes research, the BRA director
independently suggested that DSNI apply for permission to use Chapter 121A, perhaps
(as some have suspected) in order to free BRA and the city from the responsibility for
the vacant lots and blighted properties that pockmarked Dudley (Sklar and Medoff
1994). Mayor Ray Flynn likewise approved giving DSNI eminent domain powers, having
witnessed the strength of DSNI’s community organizing in battling illegal dumping in the
neighborhood; some suspected this also may have had to do with other Roxbury
residents’ threats, at the time, to secede from Boston and form a separate city called
Mandela (Sklar and Medoff 1994, Overbea 1986).
Whatever the motivations of various city actors, DSNI members saw this as a
rare opportunity, yet also a serious responsibility and a potential source of conflict.
Many in the community had witnessed the displacement and neighborhood disruption
wrought by urban renewal in the West End and nearby South End, and they were
understandably wary of a tool primarily used for such mega-‐projects (Sklar and Medoff
1994, Louie 2014). As former DSNI staff member May Louie notes, “Communities of
color were so often targeted that ‘urban renewal’ came to be known as ‘Negro removal’”
(2014). Additionally, the BRA had previously used eminent domain to acquire and clear
huge tracts of land for the Southwest Expressway, spurring community outcry (Crockett
2012, Molina Costa 2011, Louie 2014). DSNI, by contrast, was (and remains) explicitly
Dwyer 31
dedicated to community control and participatory planning; its members, staff, and
volunteers were determined to use the power of eminent domain to achieve careful,
community-‐driven goals, rather than top-‐down technocratic directives or speculative
development.
COMMUNITY LAND TRUST: AN UNUSUAL APPROACH
The fact that, from its inception, one of the land trust’s primary goals was to
promote development without displacement sets it apart from many other community
organizations and approaches to affordable housing. This seems remarkably prescient
on the part of DSNI’s founders, given that the Dudley area has gone from a cold market
to a much warmer one in its history. As longtime staff member Ros Everdell remembers,
when the land trust was first formed, “many people [in Roxbury] had been pushed out
of other places [...] out of the South End, out of the West End, even though we had tons
of vacant land. [...R]esidents wanted to stay, they wanted their children to inherit” (and
afford to keep) their homes (interview). Thus, even though the neighborhood had been
essentially written off by private developers by the mid-‐1980s, the past experiences of
many community members with urban renewal-‐fuelled displacement as well as their
own hopes to build multigenerational financial stability gave the founders of the land
trust a unique forward-‐looking perspective. It gave them a strong interest in
maintaining community control over revitalization efforts, which as previously
mentioned was another core motivation behind the establishment of DSNI.
Research indicates that community land trusts provide a much-‐needed boost for
low-‐ to moderate-‐income minority families towards homeownership and greater
Dwyer 32
financial stability. Homeownership rates in the US vary widely by race and ethnicity,
from “73 percent for whites as compared to 47 percent of Latinos and 45 percent of
Blacks”, which contributes greatly towards the racial wealth gap and reduces financial
stability for minority families (Sullivan et al. 2015). According to 2010 Census data, the
overall homeownership rate in the Boston metropolitan area averaged 66 percent; in
that year, 68 percent of white residents owned homes, compared to 33 percent of black
residents, and 25 percent of Latino residents (US Census Bureau 2015, DiversityData
N.d.). Further research on the full financial impact of CLTs on individual households is
needed; however, work by John Davis and researchers affiliated with the National
Community Land Trust Network supports anecdotal claims that CLTs serve populations
that often struggle to access loans, and reduce the cumulative amount of subsidies
required to make up that credit gap.
Community land trusts are also unique because they can represent an
alternative system to the typical speculative development and equity-‐building model,
which can in turn disrupt the political status quo. As Logan and Molotch state in Urban
Fortunes, the “growth machine” view of the city depends on land and its exchange
value; political regimes and economic elites ultimately derive much of their power from
real estate (1987). This emphasis on growth can lead to development pressures in
neighborhoods like Dudley, whose residents may not benefit from the political power or
from the private financial returns on development. In separating land ownership from
homeownership, the CLT model isolates land’s use value from its exchange value via the
ground lease mechanism. This lease, with a 99-‐year term in the case of DSNI and
Dwyer 33
numerous other CLTs, both establishes a strong relationship between the CLT and the
homeowner and provides the CLT with long-‐term legal power over the disposal and
development of the land. It emphasizes the social benefits (i.e., the use value) of
providing affordable housing, retaining long-‐term affordability, and reducing subsidy
loss by restricting the resale price increase (i.e., the exchange value) (Marcuse 2013).
While many community organizations, as Logan and Molotch put it, “become a counter-‐
response on behalf of use value goals”, CLTs do more than advocate (1987): they put
into practice an alternative vision of what development and land value can look like,
particularly in hot or fast-‐growing markets or when the CLT has a critical mass of land
under its control.
Why does the land matter? While other factors of production and revenue
generation are mobile and therefore difficult to control, land is not. This truism not only
affects firms and city governments, but urban organizations as well. As Paul Peterson
writes in City Limits, “urban politics is above all the politics of land use” (1981). In a
neighborhood with little economic clout and a history of political and social
marginalization, control over land is a significant source of power—and, one could argue,
an empowering experience for community members involved in the land trust. If the
CLT model does indeed address problems like financial instability in an effective way,
while promoting resident participation and control, it could provide a very useful tool
for communities facing uncertain futures or development pressures. Thus, a spatial
analysis of variables like homeownership rates (measured by owner-‐occupancy data),
vacant lots, building values, land values, and foreclosures, could support the premise
Dwyer 34
that CLTs can boost neighborhood stability while keeping housing affordable, and could
help other communities in Boston or nationwide decide whether to establish or grow
their own community land trusts.
HOUSING IN BOSTON: FROM COOL TO HOT
In order to contextualize current and past property values and the other
variables under study in the Dudley area, it is important to look at the larger Boston
housing climate. Over the thirty years of DSNI’s existence, Boston’s housing demand
has risen considerably, going from a lukewarm market with excess supply to one of the
hottest real estate markets in the country (Bluestone et al. 2015). Even the recent
recession had only a limited impact on housing prices and supply in the city as a whole,
though certain parts of the city did face spatially-‐concentrated drops in housing values,
including Roxbury and Dorchester. These areas saw large numbers of foreclosures as
well, according to the city’s Foreclosure Reports of 2010 and 2011, Warren Group data,
and housing experts I interviewed (see Figure 6 on following page); in fact, two of the
three areas targeted by Mayor Menino’s Foreclosure Intervention Team (Dacia-‐Quincy
and Langdon-‐Clarence) overlapped with the Dudley Triangle (“History of Boston’s
Foreclosure Prevention Initiative” N.d., Boston DND 2010, Boston DND 2011). Stemming
largely from predatory loans and recession-‐fuelled unemployment, these foreclosures
caused a ripple effect of evictions and former homeowners being forced to rejoin the
rental market.
Dwyer 35
Figure 6: Neighborhoods hardest hit by foreclosure crisis in Boston (Boston DND 2011)
While Boston has a greater share of affordable units than many other American
cities, a large portion of them within Roxbury, there is still a severe need for affordable
housing in the city (Bluestone et al. 2015, BRA “Boston by the Numbers: Housing” 2013).
As multiple interviewees, the Greater Boston Housing Report cards, and the Mayor’s
recent housing report all describe it, Boston’s market as a whole suffered little during
when the national housing bubble burst, and prices along with rent have only increased
Dwyer 36
since then. Tufts housing researcher Rachel Bratt observed, “certainly the last several
years […] the housing market has gotten unbelievably heated up […] and extremely
unaffordable to people who are lower income” (interview). Factors specific to the city,
such as its large student population boosting demand for centrally-‐located apartments,
as well as transit, geography, and a relatively low-‐height housing typology (the
dominant apartment building being a triple-‐decker), have contributed to this strong
demand. Yet along with other cities, Boston has struggled to fund affordable housing in
the wake of severe federal subsidy cuts since the 1980s. Apart from Hope VI the area
has seen little federal funding, more than one expert reported to me, and even housing
vouchers were cut in recent years (Woolhouse 2013).
Within this larger context of rising housing demand, Roxbury has also seen
pressures related to recent large-‐scale development around Dudley Square, with the
renovation of the Ferdinand Building and the much-‐touted installation of the Roxbury
Innovation Center. In local media, blogs, and reports from area agencies and
universities, Roxbury is cited as one of the neighborhoods at greatest risk of
gentrification. A recent Bay State Banner article asserted that “while the average
African American family with a family income between $60,000 and $90,000 can afford
a home in the $300,000 range, single-‐family homes throughout Roxbury are now selling
for $500,000” (Miller 2014). Local organizations like ACE have held events for
community residents concerned about gentrification, and a few local public meetings
have been fraught with tension. Furthermore, the addition of new stops to the
Fairmount/Indigo commuter rail line on the border with Dorchester (see Appendix,
Dwyer 37
Figures 14 and 15) as well as further plans for revitalization along that corridor have
stoked some fears of displacement as well (“Mapping Neighborhood Transformation”
2014). These pressures demonstrate the value of a thorough analysis of DSNI’s land
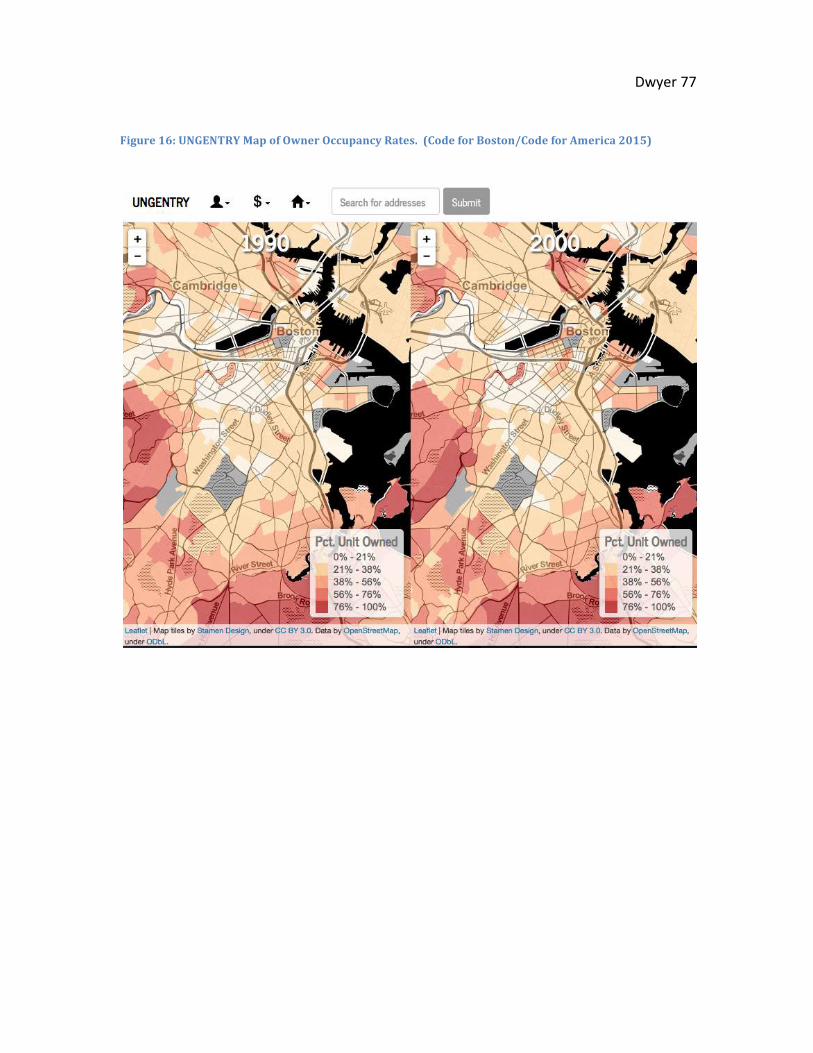
trust and its development without displacement mission. For all the debate over
affordable housing and inequality, there have been few academic attempts to map or
quantify these phenomena in Boston, though a recent effort by Boston University’s
Urban Symposium (in conjunction with the Codman Square Neighborhood Development
Corporation) and the UnGentry map bear attention (Code for Boston/Code for America
2015) (see Appendix, Figure 16).
Chapter 4: Methodology, Definitions, and Hypotheses
EVALUATING THE CLT MODEL
It is hard to find any criticism of DSNI and the DNI land trust, either in the literature
or in local media. It has been cited in hundreds of books and scholarly articles, many
newspaper and magazine articles, and at least two dozen theses from this very
department, primarily as a shining example of community organizing and community-‐
driven neighborhood revitalization. (The one criticism in Robert Putnam’s otherwise
glowing description of DSNI as a community builder in Better Together is that the
organization may need to explicitly address tension between Cape Verdean, Latino, and
black American communities within the neighborhood and within the organization’s
governance, to avoid appearance of favoritism (2003).) Yet in order to maintain its
strong reputation and achieve the important goal of community-‐controlled revitalization,
Dwyer 38
DSNI should seek out thorough evaluations of its work and impacts. Assessments of the
land trust’s successes and weaknesses will also provide benchmarks for the future and
for comparison with other CLTs or housing models.
One limitation to such assessment is that virtually all studies of DSNI have involved
qualitative research with little easily comparable information. None have utilized a
quantitative or spatial approach to measure the impact of DSNI’s land trust on the
neighborhood to which it is dedicated. Streets of Hope contains some raw data from
the late 1980s, such as the acreage of vacant land in the Dudley Triangle, yet it has not
been used in any statistical analysis that I have found. While in-‐depth case studies
certainly have benefits of their own, it is difficult to establish benchmarks or analyze
physical and social changes over time without numerical or spatial data. This analysis
attempts to address this by establishing a control area as a yardstick, against which it is
possible to systematically measure the land trust’s effects.
A recurring theme in the broader literature on CLTs is that land trust restrictions
on resale prices increase or at least sustain the stock of affordable housing. In DSNI’s
case, I wanted to examine whether this holds true and whether land trust property
values remained lower than those of neighboring residential properties. This latter
comparison would help eliminate confounding variables and answer the question: are
land trust properties more affordable because they tend to be located in neighborhoods
with generally lower property values (compared to an entire metro area)? Without this
comparison, it would be difficult to tell whether the affordability of land trust properties
has anything to do with the land trust, or whether it is merely the result of underlying
Dwyer 39
economic forces, buyer preferences (and biases), social factors like crime and
perceptions of crime, access to transit, street-‐level amenities, etc.
As mentioned before, community land trusts represent a place-‐based affordable
housing model, unlike financial supports applied to an entire class of citizens or housing
types. Additionally, many of the claims (supported by anecdotal evidence) about the
benefits of community land trusts are spatial in nature: that they reduce blight in
neighborhoods by usually developing vacant lots or abandoned properties; that they
maintain housing affordability in areas where housing prices may be increasing or
volatile. Finally, most land trusts explicitly focus on a particular neighborhood or area,
and DSNI is no exception; thus, it is important to analyze their impact from a spatial
perspective.
THE STUDY AREA
Currently, the DSNI land trust contains 225 units within the Roxbury
neighborhood of Boston, with another single-‐family home currently under construction,
as well as urban agriculture sites and limited commercial space. Fifty of those units are
rental, while the remaining 175 are single-‐family homes or coops (see Appendix, Figure
13). These parcels, for the most part, cluster closely within the Dudley Triangle, the area
of approximately 0.1 square miles bounded by Blue Hill Avenue, Howard Avenue, and
Dudley Street over which DSNI has eminent domain (see Figure 7 on following page).
The Dudley Triangle, in turn, is encompassed by the Dudley Village Campus, now
used by the organization to delineate a service area for programs such as the Boston
Promise Initiative as well as to designate eligible voters for the DSNI board of
Dwyer 40
governance. The Dudley Village Campus (or DVC) covers about 1.4 square miles within
Roxbury and Dorchester and is bounded by Columbia Road, Warren Street, Melnea Cass
Boulevard, and Massachusetts Avenue (see following page, Figure 7). The land trust,
Dudley Triangle, and the DVC serve as useful reference areas because they are used by
DSNI staff, volunteers, and the Department of Neighborhood Development, and
because they are largely similar in terms of population demographics, transportation
access, building typology, and land use (see “Defining Independent & Control Variables”
and Appendix, Figures 14, 15, and 17 through 25). Another advantage to examining the
Dudley Village Campus is that it is small enough to form a fairly cohesive neighborhood,
spatially speaking, while containing enough parcels to make up a strong statistical
sample; if it were significantly larger, there would likely be a wider range of land uses
and transit options, which could have skewed the data.
Dwyer 41
Figure 7: Dudley Village Campus, Dudley Triangle, and Land Trust
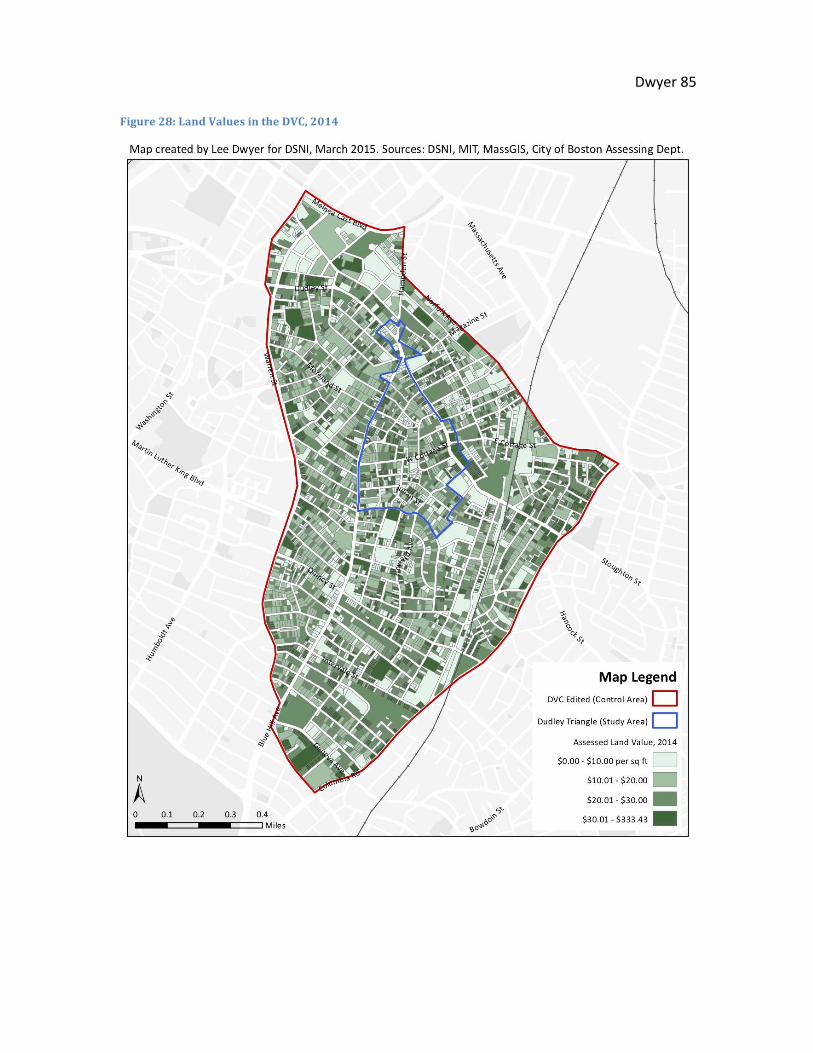
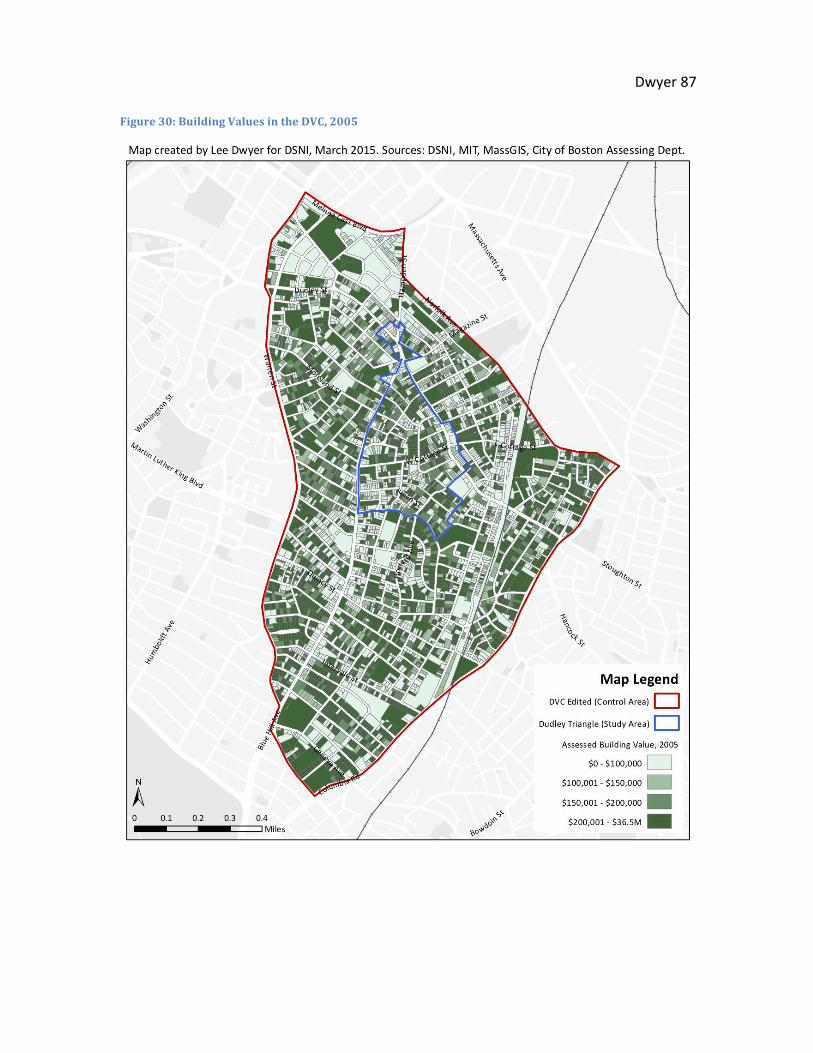
In order to compare these sets of properties, I mapped and analyzed assessed
building values and land values from the city of Boston’s parcel shapefiles, digitally
available with annual updates going back to 2000. These values come from the
Assessing Department’s property assessment surveys. According to the department’s
website, all properties are evaluated yearly and are valued in keeping with state law,
which in principle “requires that all property be assessed at its fair cash value -‐ what a
willing buyer would pay to a willing seller” (City of Boston “Triennial Revaluation”). The
valuation process itself undergoes review and certification every three years, as Gayle
Willett of the Assessing Department explained.
However, in practice assessed values often do not reflect current market sales
prices, particularly when the housing market is volatile. This is largely due to the fact
that there is a lag between assessed prices and market value: as Willett explained, the
data for fiscal year 2015, which sets the value for all properties as of January 1, 2014, is
based on market values and sales leading up to that date, through the year of
2013. Markets with extremely low numbers of sales may also yield less accurate
assessed values because the valuation process relies on comparable sales within that
time period (Willett 2015). If there are too few to compare, the assessor will aggregate
a larger area of properties, which could conceivably skew data for low-‐sales areas with
differences in access to transit, building stock quality and age, etc.
Other sources of spatial data included the Warren Group, a local real estate
tracking firm that gathers and sells data on foreclosures and other property transactions,
Dwyer 43
GIS data available from MassGIS and MIT Libraries, and ten-‐year Census records
accessed through a program called GeoLytics. The Warren Group sources property
transaction information directly from the Suffolk County Registry of Deeds and the
Massachusetts Land Court; however, neither of these two agencies offers public digital
access to multi-‐address datasets. (Instead, members of the public can only download
records for each individual property, which would be unrealistic for this thesis given the
number of properties analyzed.) In purchasing foreclosure data from the Warren Group,
I was able to secure permission to share the data and maps based on it for non-‐
commercial use. Finally, I confirmed the addresses, construction dates, and ownership
of land trust parcels using records shared by Tony Hernandez at DSNI and by a Boston
city official. Based on all this data, I defined dependent and independent variables.
DEFINING INDEPENDENT & CONTROL VARIABLES Since my overall hypothesis is that the land trust has had a positive quantifiable
impact on certain measures of housing affordability and neighborhood stability, the
primary independent variable is defined as whether a given location is part of the land
trust. The null hypothesis, as a result, is that there is no significant difference between
land trust and non-‐land trust parcels in any measures of dependent variables (see
Defining Dependent Variables). However, since there may be other factors affecting
these measures, I introduced a control variable to boost the rigor of the analysis. As
defined previously, the Dudley Village Campus is similar in many respects to the area
encompassed by the land trust and is commonly referenced within the organization.
Dwyer 44
The primary control area, then, is roughly the extent of the DVC not including the land
trust (see Figure 7).
However, a core tenet of DSNI and its members is that their interest in
community control and revitalization extends beyond the land trust itself, to the entire
neighborhood. Most of their initiatives go beyond the boundaries of the land trust, and
non-‐land trust residents of the community serve on the organization’s board each year.
I thus wanted to examine whether the data indicated any corresponding trends in the
dependent variables for the parcels surrounding the land trust.
A secondary hypothesis, then, is that one might see a spillover effect within the
Dudley Triangle. For example, if building values are indeed slightly lower on the land
trust, perhaps they help keep values of immediate neighbors lower and therefore
promote long-‐term affordability, since valuation is generally based on comparable sales
of nearby properties. To test this hypothesis, I used the Dudley Triangle as a secondary
study area, comparing it to both the land trust and the larger DVC control area (see
Figure 7) and assessing the existence of a spillover effect.
I also sought to ensure that there were no significant differences in demographic
characteristics or transportation access between the study area and control area that
might confound or skew the results. To do so, I compared ten-‐year Census data on
poverty rates, annual median household income, and racial and ethnic makeup of the
overall population at the block-‐group level, going back to 1980. Using a t-‐test of means,
assuming unequal variance, I found no significant difference in poverty rates or median
household income between the study area and control area in 1980, 1990, or 2000 (see
Dwyer 45
Appendix, Figures 20 and 21). The decennial Census offered this data at the block-‐group
level via the long-‐form survey only through 2000, so 2010 is not included4.
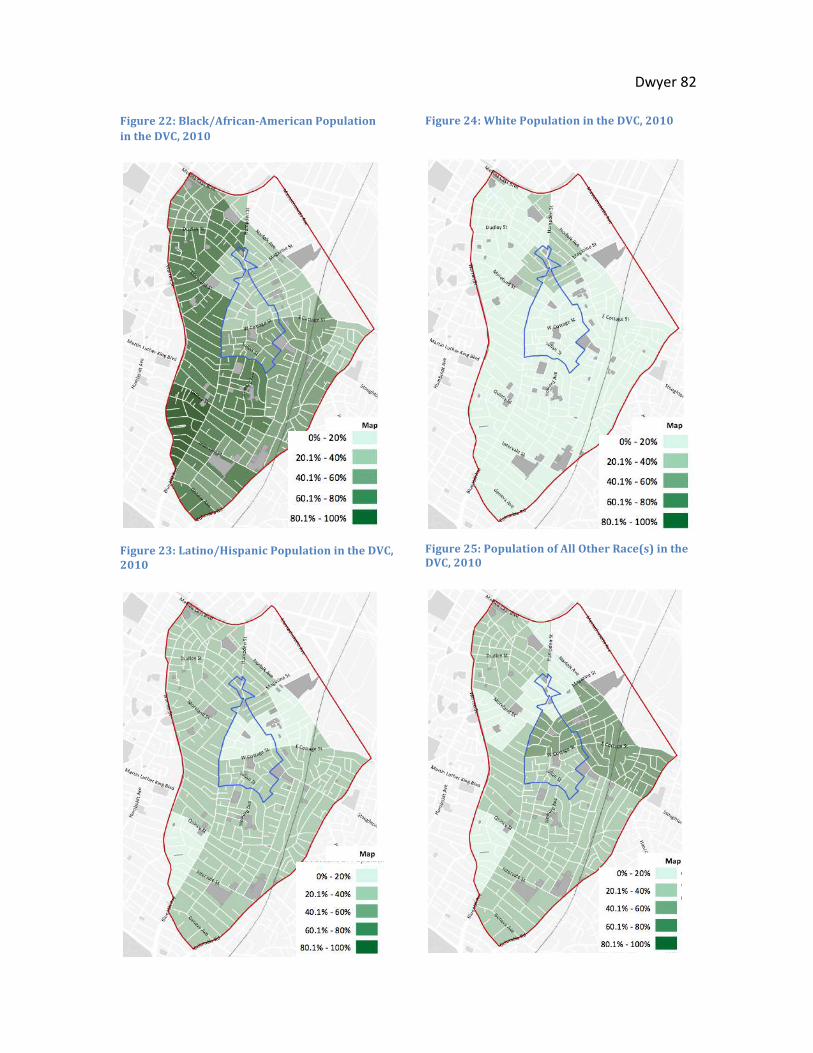
Racial and ethnic demographics similarly showed no significant difference,
except in the percentage of Hispanic/Latino residents and residents who marked “other
race” in 1980 and 1990, which were higher in the Dudley Triangle than in the study area.
However, these differences faded to statistical insignificance by 2000, when my parcel-‐
level analysis began, so it is unlikely they would confound those results (see Appendix,
Figures 20 through 25).
I also explored differences in transit access between the primary and secondary
study areas and the control areas. Multiple bus routes and major roads crisscross the
entire Dudley Village Campus, but it is poorly served by the subway since the Orange
Line moved from Washington Street and Dudley Square (see Appendix, Figures 14 and
15). The nearest T stations, on the Orange Line, are around half a mile away as the crow
flies; though the Silver Line supposedly offers a form of rapid transit to downtown, in
practice it is just another slow bus route. The Fairmount/Indigo commuter rail line does
run through the Dudley Village Campus, with a stop in Upham’s Corner and two more at
Newmarket and Four Corners/Geneva (see Appendix, Figure 14). The latter two stops
were added in 2013 after local advocates fought for transit access (Irons 2013); however,
ridership has been low, primarily due to infrequent service (Handy 2013). Ultimately, I
ascertained that the DVC and the Dudley Triangle have roughly similar transit access due
4 Beginning in 2010, the Census replaced the long-‐form survey with the ACS 5-‐year survey, which means comparing poverty and income measures between ten-‐year estimates and five-‐year estimates may yield inaccurate results. See www.census.gov/hhes/www/poverty/about/datasources/description.html
Dwyer 46
to distance from T stations, the similar levels of bus access and major thoroughfares,
and the low ridership along the Fairmount corridor. However, this last factor may
change in future years if service frequency increases, and moving forward transit access
may have a more pronounced effect on parts of the Dudley neighborhood.
DEFINING DEPENDENT VARIABLES Owner Occupancy
Owner occupancy rates can serve as an indicator of neighborhood stability.
Higher rates of homeownership among neighborhood residents are associated with
“improved property maintenance and longer lengths of tenure” (Rohe and Stewart
1996); however, they also tend to correlate with higher property values and sale
prices. Roxbury’s homeownership rate, around 23%, remains well below Boston’s
overall average of 34% (BRA Boston by the Numbers: Housing 2013). If DSNI’s land trust
is truly living up to its goal of keeping housing at affordable prices while increasing
opportunities for low-‐income residents to become homeowners, then there should be a
higher level of owner occupancy on the land trust and, if a spillover effect exists, within
the Dudley Triangle. It is possible that owner occupancy data may be slightly
inaccurate—subletting part or all of a home is common in Boston, and may not be
captured by the Assessing Department—but again, one may assume that this would
affect all areas equally, and would thus be unlikely to affect the magnitude of the
difference between areas.
Dwyer 47
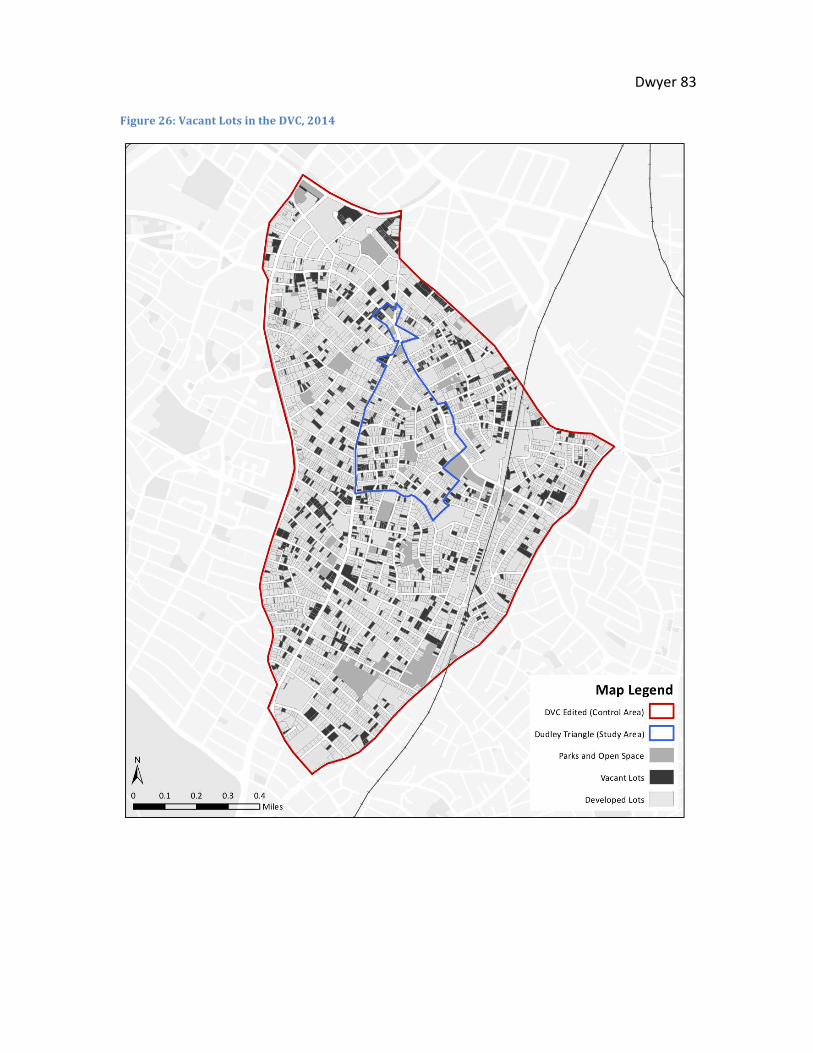
Vacant Lots and Foreclosures
Vacant buildings and lots are seen as a hallmark of neighborhood disorder and
disinvestment (Graves and Shuey 2013, Graves 2012). It is true that the condition and
location of a particular vacant parcel, such as whether it is neatly maintained or a trash-‐
strewn, overgrown lot, may affect its particular impact on surrounding property values,
residents’ perceptions, or crime incidences, it is clear that overall, a high percentage of
visibly vacant properties within a neighborhood is a sign of trouble, as the founders of
DSNI contended in the 1980s. Even today, many neighborhood residents continue to
voice concern about crime, littering, and development of vacant parcels throughout the
Dudley neighborhood, and many community organizing efforts and public meetings still
focus on the issue. Given DSNI’s longtime focus on vacant lots and its power of eminent
domain, one might expect a steadily lower percentage of vacant lots on and near the
land trust over time than in the larger neighborhood.
As for foreclosures, according to a recent survey of Roxbury and Dorchester by
Boston Federal Reserve researcher Erin Graves, “vacant lots appear to increase Boston
residents' sense of unease more than vacant homes do” (2012). While the research is
more ambiguous on the neighborhood-‐level or parcel-‐level impact of foreclosures, high
rates of foreclosures are generally seen as a sign of instability, similar to high vacancy
rates. According to multiple housing experts that were interviewed as well as the city’s
Foreclosure Reports, while the crisis did not substantially affect some parts of Boston,
Roxbury and Dorchester—including the Dudley area—suffered from many foreclosures
on sub-‐prime mortgaged homes. Additionally, as Joe Kriesberg from the Massachusetts
Dwyer 48
Association of CDCs told me, “the vast majority of homes in foreclosure were sold to
investors […] many people became tenants, driving up rent, increasing homelessness
and displacement” (Kriesberg 2015). On a large enough scale, this could reduce
homeownership and social stability in a neighborhood.
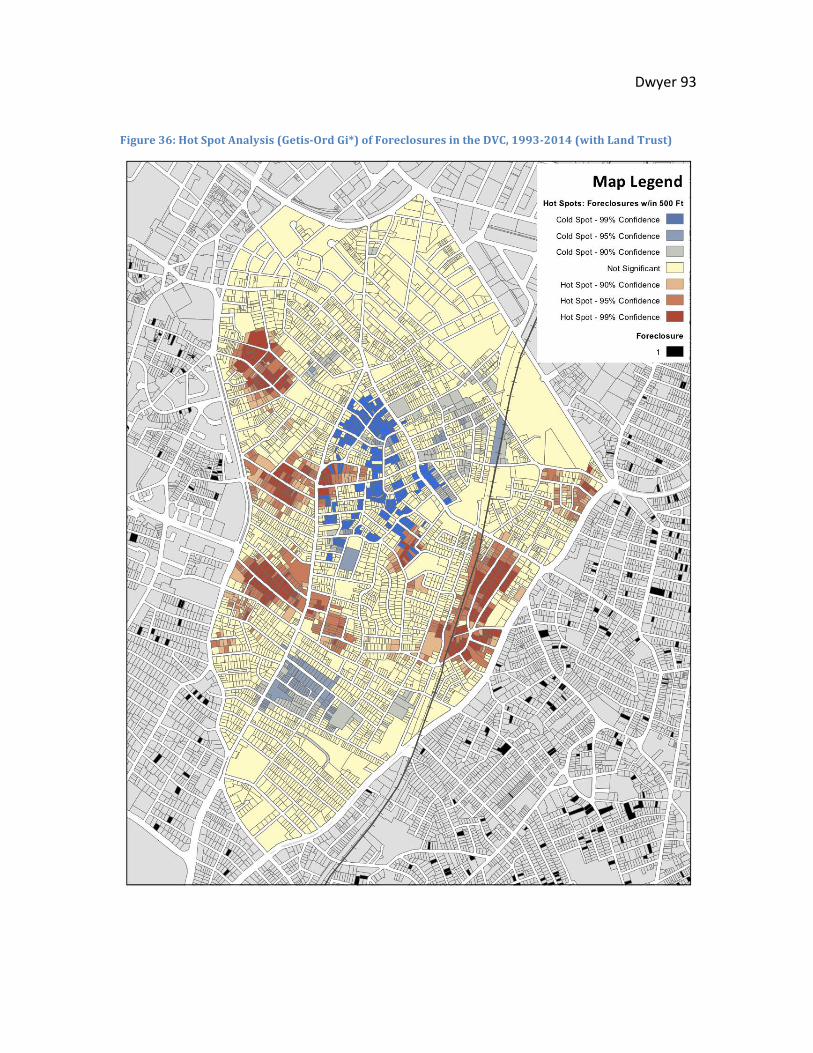
CLTs, including DSNI’s land trust, may prevent foreclosures from being initiated
and reduce the number of completed foreclosures within their boundaries. As the
aforementioned working paper by Emily Thaden and Greg Rosenberg shows, community
land trusts on the whole appear to have far fewer foreclosures than would be expected
for the generally low-‐income populations and areas they serve. May Louie noted that
DSNI worked with the city and “tried to negotiate with lenders” to prevent foreclosures
not just on the land trust, but in the larger neighborhood (Louie 2015). I believe this
should be reflected in the data for DSNI’s land trust in comparison with the control area,
particularly during the worst of the recession.
Building Value & Land Value
Given that data for real sales prices and actual rents is incomplete and difficult to
find, assessed building values must serve to capture housing prices. As previously
mentioned, the assessed values lag behind actual values, and there may be some
inaccuracies by virtue of the estimation and modeling involved. However, one can
assume these inaccuracies affect all properties equally, both those on the land trust and
outside it, so any error introduced should not affect the difference between these
groups.
Dwyer 49
My analysis is generally concerned with the land trust’s impact on affordability—
i.e., on keeping building values lower—primarily because this has been central to the
land trust’s purpose from its inception. As the Dudley Street Neighborhood Initiative
Revitalization Plan states, “any new development should […] strive to be affordable to
the range of current residents in the community” (1987). From the 1960s through the
1980s, the same redlining, “white flight”-‐fuelled blight, urban renewal clearing,
disinvestment, and arson that spurred residents and activists to form DSNI left the
Dudley area virtually abandoned by the market. According to 1980 Census data, the
average home value of the block groups encompassing the Dudley Village Campus was
around $18,650 (about $53,150 in 2015 dollars)5.
However, according to the 1987 comprehensive neighborhood plan, by the time
DSNI was considering a land trust, the average sales price for a single-‐family home had
risen to $106,250 (about $219,500 in 2015), while a triple-‐decker cost around $150,000
(around $308,000 today) (Dudley Street Neighborhood Initiative Revitalization Plan
1987). By 1990, Census records show an average home value of nearly $117,450 (about
$211,000 in 2015) in the Dudley Village Campus block groups. This means that by the
time the first housing was being built on the land trust, the neighborhood was already
witnessing the effects of Boston’s housing market “warming up”, and residents were
justified in their concerns about speculation and pricing out. Moreover, many were
wary of the neighborhood becoming a victim of its own success, experiencing
development with displacement as many had witnessed in the South End (Everdell
5 To adjust for inflation, I used the CPI Inflation Calculator produced by the US Bureau of Labor Statistics. See http://www.bls.gov/data/inflation_calculator.htm.
Dwyer 50
2015). Thus, for the sake of this analysis, I will focus on the impact of the land trust in
restraining building values over time, rather than increasing them.
Land values per square foot are also analyzed in an attempt to capture
development pressures and neighborhood stability. If the value of lots in a
neighborhood is rising dramatically, it could signal strong interest by developers and
thus a potential displacement threat, which could lead to neighborhood instability as
long-‐time residents sell or newcomers move in. Higher land values (along with building
values) also lead to higher tax bills, which can put a financial strain on low-‐income
homeowners, reducing overall housing affordability. Given how the land trust operates
and the restrictions on resale, one would anticipate lower building and land values
compared to those of the study area.
SPATIAL & QUANTITATIVE METHODS USED
Spatial analysis of community land trusts is rare, but offers new insights into
their impact and context. Datasets were produced using ArcGIS, by spatially clipping
parcels using the boundary of the Dudley Village Campus and then removing parcels in
the land trust and the Dudley Triangle. I found it necessary to limit the area of analysis
in order to account for skewing values. Namely, I slightly altered the boundary of the
Dudley Village Campus to remove a largely industrial section in the northeastern corner,
whose building values, land values, parcel sizes, and owner-‐occupancy rates were very
different from those of the Dudley Triangle and surrounding areas, and would have
highly skewed the analysis (see Appendix, Figures 17 through 19). This was done in an
Dwyer 51
effort to reduce confounding variables and ensure the control area and study area
would be similar enough to allow for accurate comparison.
After verifying the overall consistency of the resulting data and creating binary
dummies for categorical variables like vacancy status and owner occupancy, I then
compared and analyzed datasets by year using Stata statistical software. To learn
whether the dependent variables significantly differed between the study area and
control area, I first utilized a two-‐tailed t-‐test (assuming unequal variance). Next, I used
summary statistics and regression to build up a quantitative picture of the land trust’s
impact. In the case of foreclosures, I also used Getis-‐Ord Gi* spatial analysis tool to
identify statistically significant “hot spots” and “cool spots” for foreclosed homes
(Center for Regionalism and Analytical Planning 2015).
QUALITATIVE METHODS USED
In order to contextualize and interpret the findings of this analysis, I also
conducted interviews with key informants and experts. For each interview subject I
employed one of three standardized questionnaires based on the area of their expertise,
reordering or dropping questions as necessary to best reflect their knowledge. If given
permission, I recorded interviews (which took place either over the phone or in person)
for later transcription and took notes to assist my own understanding. To create an
initial list of interview subjects, I drew upon the advice of my thesis reader and upon the
main sources I used in my literature review, such as John Davis and Emily Thaden. I then
used a snowballing method, asking each interviewee to identify a few other people
whom I should contact, and contacted those whose names came up repeatedly.
Dwyer 52
The interview subjects fell into three main categories: experts on the Boston
housing market, particularly affordable housing; those with knowledge of a particular
area relevant to my analysis, such as community land trusts or foreclosures; and those
with specific knowledge of the DSNI land trust. I conducted twelve interviews total, in
person and over the phone, using the standardized questionnaires mentioned before
with some adaptations for each source, reflecting their particular expertise (see
Appendix for research instruments). In a couple of instances, slightly less formal
interviews that did not follow the standardized questionnaires allowed me to better
understand processes affecting my spatial analysis and quantitative data. The final
stages of reviewing and organizing notes, doing partial transcriptions, coding, and
analyzing responses yielded additional insights, cautions, and support for the spatial
analysis. I also cross-‐compared answers to recurring questions, to triangulate points of
agreement among sources and identify unusual or unique responses that might reveal
new perspectives. All in all, these interviews deepened my understanding of the CLT
model and of the history and inner workings of DSNI’s land trust, while confirming a
general narrative of the Boston housing market underpinning many of my hypotheses.
Chapter 5: Analysis & Results
SPATIAL & QUANTITATIVE RESULTS
The results of the quantitative analysis proved quite interesting and a little
surprising (see Figures 8 and 9 on following pages and Appendix, Figures 26 through 40).
Dwyer 53
The differences between the land trust (study area) and the rest of the Dudley Village
Campus (control area) were sharp and for the most part supported my hypotheses:
• building values on the land trust (LT) were indeed significantly lower than those
outside the LT over all years except 2000, confirming my hypothesis
• land values, by contrast, were more mixed: significantly higher on the LT in 2000
and 2005, no different from the study area in 2010, and lower in 2014
• vacant lots are quite significantly less
prevalent on the land trust than in the
surrounding neighborhood in all years,
and are generally being developed
faster than vacant lots outside of the
land trust (see chart at left)
• owner-‐occupancy rates are slightly mixed: not significantly different in 2000,
they later grew to be higher on the land trust at a significance level of p < 0.05
• foreclosures were indeed lower on the land trust than in the control area;
however, the difference was statistically significant only in 2010 and 2014
(largely due to the small number of observations in 2000 and 2005)
Beyond the land trust, I also compared the larger Dudley Triangle over which
DSNI has eminent domain, to see if there are any spillover effects from the land trust.
• assessed building values are significantly lower within the Dudley Triangle than
in the control area. In fact, on average, they were lower than the average land
trust property, however further analysis revealed this was skewed by a higher
% Change in Proportion of Vacant Lots
Years DVC-LT LT
2000-2005 -4.0% -13.8%
2005-2010 -5.5% -9.8%
2010-2014 0.8% 0.0%
Dwyer 54
percentage of vacant lots in the Dudley Triangle than on the land trust, since
vacant parcels’ building values are listed as zero. Therefore there may or may
not be a spillover effect from the land trust.
• average total land values are significantly lower than in the control area;
however, per square foot land values vary considerably
• vacancy rates are more mixed: significantly lower than the control area in 2000
and 2005, they increased to no significant difference in 2010 and 2014—possibly
as an effect of the economic crisis or due to inaccurate data entry
• the differences in owner-‐occupancy rates and foreclosures are likewise mixed
and vary by year; foreclosures were slightly lower within the Dudley Triangle
than in the study area except in 2005, but not to a level of strong statistical
significance
Dwyer 55
Land Trust (LT) Study Area versus Dudley Village Campus (DVC-‐LT) Control Area Figure 8: Results of two-sided t-tests of means
2000 2005 DVC-‐LT LT t DVC-‐LT LT t
Building Value $87,913 $71,166 (1.366) $196,652 $70,761 (10.570)*** PSF Bldg Value $1,349.55 $52.32 (3.444)*** $53.22 $40.19 (6.382)***
Land Value $34,011 $54,781 (-‐6.850)*** $44,712 $59,618 (-‐4.946)*** PSF Land Value $107.10 $46.92 (20.731)*** $9.48 $16.18 (-‐9.100)***
# Parcels Observed 4975 175 5150 4942 203 5145 *** p < 0.001 ** p < 0.01 * p < 0.05 2010 2014
DVC-‐LT LT t DVC-‐LT LT t Building Value $184,816 $107,093 (4.724)*** $193,398 $107,093 (5.230)*** PSF Bldg Value $42.68 $45.00 (-‐1.354) $524.12 $45.00 (2.000)*
Land Value $84,516 $76,670 (1.270) $108,389 $76,670 (4.528)*** PSF Land Value $18.73 $17.88 (1.296) $22.62 $17.88 (7.033)***
# Parcels Observed 4655 225 4880 4618 225 4843 *** p < 0.001 ** p < 0.01 * p < 0.05 Notes: • # of Parcels Observed varies from year to year for the Land Trust as number of land trust parcels
grows and for the DVC as parcels are combined for development or were entered without complete data (and thus were dropped in Stata).
• Since there can be multiple foreclosures filed per address, the number of foreclosures may not correspond to the number of distinct homes or addresses which were foreclosed on.
• PSF Building and Land Values show high variation, likely pointing to either skewing effects from outliers or inaccuracies in data (for example, inaccurate estimates of floor area).
Dwyer 56
Dudley Triangle (DT) Study Area versus Dudley Village Campus (DVC-‐DT) Control Area Figure 9: Results of two-sided tests of means
2000 2005 DVC-‐DT DT t DVC-‐DT DT t
Building Value $93,240 $53,302 (2.784)** $203,599 $156,188 (3.0604)** PSF Bldg Value $1,528.18 $80.64 (3.281)** $51.74 $66.17 (-‐6.356)***
Land Value $35,257 $25,407 (6.853)*** $46,008 $36,576 (4.754)*** PSF Land Value $111.69 $20.77 (44.437)*** $9.28 $10.84 (-‐5.754)***
# Parcels Observed 4222 705 4927 4184 705 4889 *** p < 0.001 ** p < 0.01 * p < 0.05 Notes: • # of Parcels Observed varies from year to year for the Dudley Triangle as number of land trust parcels
grows and for the DVC as parcels are combined for development or were entered without complete data (and thus were dropped in Stata).
• Since there can be multiple foreclosures filed per address, the number of foreclosures may not correspond to the number of distinct homes or addresses which were foreclosed on.
• PSF Building and Land Values show high variation, likely pointing to either skewing effects from outliers or inaccuracies in data (for example, inaccurate estimates of floor area).
Dwyer 57
These results offer some support to my hypotheses, based on common arguments
about the benefits of community land trusts. First, the lower building values on the land
trust bolster the primary claim that this model maintains affordability (see Figure 11 on
following page and Appendix, Figures 29 through 32); these average values are much
closer to the affordable range for the typical Dudley household. This, along with
considerably lower frequencies of vacant lots than one would expect to see (see
Appendix, Figure 26), also seems to reflect the stated DSNI goal of development without
displacement. While DSNI is clearly building homes and other structures on the land
trust, it is distinct from speculative or investor development. In fact, the higher
assessed land values on the land trust in 2000 and 2005 might indicate that the option
value or exchange value of this land remain high in times of overall real estate
appreciation. In other words, if not for the land trust, those same parcels might
otherwise sell at a premium to for-‐profit developers, who would be less likely to build
low-‐income housing on it.
The results also indicate some support for my hypothesis that the land trust
model promotes neighborhood stability in the form of lower vacancy and foreclosure
rates and higher owner-‐occupancy rates. Vacant lots accounted for between 17 and
19% of parcels in the control area between 2000 and 2014, and between 13 and 16% of
the Dudley Triangle. Only 2 to 3% of the land trust remained vacant, and that
percentage fell over time at a generally faster rate than in the control area (see chart on
page 47). While foreclosures were not significantly different in 2000 and 2005 (due to
very low numbers overall), during the height of the economic crisis the land trust
Dwyer 58
showed a markedly lower rate. Further analysis shows that in 2008 and 2009, the worst
years for foreclosure in Boston, the control area had 44 and 41 foreclosures respectively,
compared to zero and one on the land trust (see below, Figure 10).
I also conducted a hot-‐spot analysis of the foreclosures within the Dudley Village
Campus, which indicates that spots of significantly higher foreclosure frequency
surrounded the land trust (see Appendix, Figures 35 and 36). There was a slight cool
spot within the land trust itself and another adjacent to a block of its properties,
indicating that the land trust may have had a slight positive spillover effect. However,
further analysis would be necessary to evaluate the strength of this effect.
Figure 10: Homes foreclosed by year, 1994-‐2014. Data source: The Warren Group
0
5
10
15
20
25
30
35
40
45
50
55
1994
1995
1996
1997
1998
1999
2000
2001
2002
2003
2004
2005
2006
2007
2008
2009
2010
2011
2012
2013
2014
DVC
DT
LT
Dwyer 59
Another interesting result is that while building values in the surrounding
neighborhood apparently spiked during the housing boom and dropped drastically as
the recession hit, building values on the land trust show a steady, if smaller, growth
trend (see Figure 11 below and Appendix, Figures 29 through 32). Owner occupancy
rates were higher on the land trust as well, and grew at a generally faster rate than in
the study area (see Appendix, Figures 39 and 40). These indications seem to paint a
picture of a more stable and affordable community, and they largely correspond with
assessments by housing experts and those familiar with DSNI.
Figure 11: Building Values in the Dudley Village Campus and the Land Trust, 2000-2014
$0
$25,000
$50,000
$75,000
$100,000
$125,000
$150,000
$175,000
$200,000
$225,000
2000 2005 2010 2014
DVC-‐LT
LT
Dwyer 60
QUALITATIVE RESULTS
While the responses from most of these interviews provided specific details
contextualizing one or more aspects of the DSNI land trust, there were a few overall
trends:
• most identified the community-‐controlled structure of the land trust, communal
land ownership and control, and permanent affordability as the critical features of
community land trusts, distinguishing them from other affordable housing models
• they generally concurred that while Boston housing prices fluctuated in the 80s
and 90s, they have risen sharply over recent years, particularly after the recession;
gentrification is a widespread concern, and there is much less federal funding
available for affordable housing nowadays
• respondents who know DSNI cited its successes at successfully revitalizing the
community, bringing new affordable housing for those who would have otherwise
lacked the opportunity, and maintaining a thoughtful, community-‐driven, long-‐
term approach to redevelopment
• what sets DSNI apart, respondents said, is its focus on community building
organizing, its role in shaping development, and the sense of land stewardship
Additionally, two more questions attempted to gauge interest in the community
land trust model and to determine whether spatial and/or quantitative analysis was a
research gap in this area (though it could be argued that answers to these questions
Dwyer 61
may have been slightly skewed by the act of interviewing itself). Responses about the
change in interest level in CLTs were more mixed: some perceived much greater interest
in CLTs in recent years, while others had more qualified responses. For instance Emily
Thaden, who currently works for the National Community Land Trust Network,
said,“[interest in the model has] taken off in past couple of years. It’s an easier sell in
hot market conditions because it’s clear it can combat gentrification […] we’re getting a
lot more calls, doing more federal advocacy and education”(2015).
Responses about the research gap were much more uniform: by and large, those
who answered this question agreed that there have been few efforts to systematically
map or quantitatively analyze the impacts of community land trusts, particularly at a
neighborhood-‐ or parcel-‐level scale. John Davis, well-‐known for his work with the
Burlington Community Land Trust (now Champlain Housing Trust) and his research on
land trusts, supported the work within this thesis:
“This is very valuable research. What you're trying to do does fill a gap in the
literature, and I think you would both help DSNI but you would also help the CLT
movement to be doing this kind of quantitative, data-‐based, map-‐based
research.” (2015)
Interviews also drew out a few critiques that offer a useful counterpoint to the
generally rosy portrayals of the area’s revitalization. For example, Joe Kriesberg of
MACDC observed that “crime rates are certainly lower [than before] but still certainly
higher” than in other parts of the city (interview), and longtime DSNI staff member Ros
Dwyer 62
Everdell agreed that crime was still an issue within the Dudley neighborhood, along with
low-‐performing schools (2015).
Another housing expert also critiqued the restricted resale model because it
limits equity and therefore household financial success, yet other interview subjects
countered that claim. Emily Thaden pointed to research on low-‐income homeowners
and wealth accumulation, pointing out that “they have to own a home for at least seven
to twelve years” to accumulate equity, yet only 50% of low-‐income non-‐CLT
homeowners manage to keep their homes for more than five years, compared to 90% of
CLT homeowners (2015). Penn Loh argued that “it creates financial security; you get
insulated from the downs, [and] you're not subject to the bubble in the first place”
(2015). My findings on building values support this, showing a smoother slope for land
trust properties while neighborhood-‐wide building values increased more steeply (see
Figure 11, page #). Generally, interviews confirmed the quantitative analysis, and
highlighted broad support for DSNI from many involved in housing research and policy
in Boston and beyond.
LIMITS OF ANALYSIS AND DATA IMPLICATIONS
The primary limit to this analysis is that it does not fully capture the true impact
of the DSNI land trust. In virtually all of the interviews conducted with those familiar
with the land trust, including subjects with no affiliation to DSNI, as well as in the
existing literature, the emphasis on community organizing, strong neighborhood
networks, and resident participation was seen as one of the land trust’s greatest
strengths. Since DSNI and the land trust have been inextricably linked almost since their
Dwyer 63
inception, this focus on community control and involvement is a critical feature of the
land trust’s success, not a side benefit. Yet this same feature is difficult to capture
spatially or quantitatively. As Joe Kriesberg noted about community-‐based
organizations more broadly, “[T]he ways in which CDCs often help low-‐income people
live a better quality of life [generally] don’t show up in poverty rates given how those
rates are calculated” (2015). It would require perhaps a longitudinal study of land trust
residents or an in-‐depth qualitative analysis using ethnographic observation and
interviews with residents, neighbors, and service providers to fully document the land
trust’s impact on the lives of those whom it has touched.
A second limit is the availability of the data upon which this analysis relies.
Parcel-‐level digital data was only available dating back to 2000, and demographic
characteristics could only be compared using block group-‐level data up to 2000. More
detailed information might become available if archived city records are digitized and
shared publicly, if those records have survived. Foreclosure records at the scale
required had to be purchased from the Warren Group, which places strict licensing
restrictions on the use and sharing of the data. The difficulty experienced of accessing
foreclosure data, as well as the potential for other community organizations to benefit
from increased spatial data availability and mapping capacity, lend support to local
networks of data sharing and calls for increased ease of public access to city records.
Perhaps a consortium of CDCs and other housing-‐focused organizations (see Other
Actors: Community Developers in Dudley, page #) could negotiate a shared group
license to housing data with the Warren Group, or the Department of Neighborhood
Dwyer 64
Development could share the data it purchases from the Warren Group with such
organizations for non-‐commercial use only.
In recent years, Boston has taken positive strides towards greater data access
and innovation via its “Open Government” portal and the Office of New Urban
Mechanics. Additionally, private citizens involved in projects like UnGentry and Github
have promoted open-‐source mapping of various topics in the city (Code for
Boston/Code for America 2015). Yet data on many topics relies on governmental
agencies for updating, and until now such agencies had little reason to make records
digitally accessible via multiple systems and users, or to update them more frequently
than was required for their work. Some of the municipal parcel data used in this thesis,
for instance, was incomplete, inaccurate, or out of date. If “Big Data” is to be used for
civic good, local governmental entities will need to establish sound policies and
structures for data management and sharing.
Chapter 6: Conclusion
The results of spatial and quantitative analysis support certain hypotheses about
the DSNI community land trust, while leaving others open to debate. They show a
marked pattern of lower building values on the land trust even during a time of rising
home prices, reflecting a key goal of DSNI: to maintain housing affordability. Lower
rates of foreclosures during the recession also indicate that the land trust is promoting
neighborhood stability and financial security for individual homeowners. The ongoing
reduction in vacant lots on the land trust, while owner occupancy rates have risen, both
Dwyer 65
at a generally faster rate than in the surrounding neighborhood, lend support to another
crucial DSNI goal of “development without displacement”.
Yet the numbers are not always conclusive—land value in particular tells a more
mixed story—and it is still not fully clear whether these variables demonstrate a
significant spillover effect from the land trust onto its neighbors. Assessed building
values are indeed lower in the Dudley Triangle, but vacant lot rates, owner-‐occupancy
rates, and foreclosures vary, sometimes lower or higher within that area. Some of the
benefits of the land trust seem to stay within its confines, according to this data.
Interviews generally supported the perception that DSNI’s land trust does indeed
maintain affordability and that it has contributed to significant positive change in the
neighborhood over the past twenty to thirty years. Housing experts were almost
unanimous in their assessment of Boston’s housing market as very expensive and
volatile, subject to ongoing investment and speculation—and equally unanimous in
observing that while foreclosures had little impact on this hot market as a whole, it
negatively affected particular neighborhoods like Roxbury and Dorchester.
Finally these interviews revealed a possible limitation for future study: some of
the things DSNI is best known for, such as empowering local residents to participate
more in community planning and political processes, may require more data collection
and might be more difficult to quantify. Another area for further study, based on these
interviews, would be additional criteria for evaluating the success of a community land
trust, such as whether the model promotes maintenance by homeowners who are part
of the land trust.
Dwyer 66
IMPLICATIONS FOR DSNI AND THE DUDLEY NEIGHBORHOOD
Those involved with DSNI, whether as volunteers, staff, board members,
partners, or residents, deserve to be proud of the neighborhood: by any measure, it has
come a long way from the forlorn dumping grounds of the 1980s, and DSNI has played a
vital role in that transformation. The documentaries Gaining Ground and Holding
Ground show, in living color, just how dramatically that change has affected the people
and the politics of the neighborhood. In terms of land, one of the key visuals shows the
number of housing units built on the land trust as it gradually expands (see appendix);
combined with maps of the vacant lots in the neighborhood, it paints a clear picture
using data of the real changes wrought by DSNI. Documentation of this change, through
visual media, personal stories, maps, and statistics, is crucial to the continued success of
DSNI and of the neighborhood in general. It serves as both a celebration of past work
and a call to further action.
At the same time, inspiration is not enough to produce change on its own. Even
with eminent domain and support from city government, purchasing vacant lots from
private owners, engaging community members in collective planning processes, and
maintaining the land trust requires funding, and funders increasingly want to see data
supporting organizations’ claims and quantitative assessments of their programs.
Furthermore, in a climate of reduced federal support for affordable housing,
tight credit in financial markets, and rising local real estate prices, DSNI will have to
make smart decisions about new projects. The analysis of foreclosures and the impact
Dwyer 67
of the land trust on building values (particularly during the housing boom and bust) will
hopefully lend support to their efforts. Having more information about the land trust
and its impact will surely help board members, community residents, and staff plan for
the neighborhood’s future.
IMPLICATIONS FOR COMMUNITY LAND TRUSTS
Other community land trusts can hopefully learn from this research as well, both
from its results and from the structure of the analysis. If the results are indeed
generalizeable, they can provide several clues about community land trusts: first, they
do seem to protect against foreclosures, vacancies, and the volatility of housing prices in
a rapidly changing market; second, land trusts may correlate with slightly higher
homeownership rates in areas where that is rare, creating stability at both the
neighborhood level and family level. Yet CLTs differ widely in their size, age, geography,
and real estate market; this case may not generalize well to cold-‐market cities like
Detroit. Hopefully, though, the structure of the analysis itself might serve as a template
for other CLTs to evaluate their own success from a quantitative and/or spatial
perspective. If CLTs in other cities have mapping capacity and access to similar parcel-‐
level data on land use and assessed values, they could replicate the analysis for their
own land trusts. Alternatively, a research institution or organization such as the
National Community Land Trust Network could conduct further research along the same
lines on individual land trusts or a collection of cases.
Dwyer 68
IMPLICATIONS FOR BOSTON
Closer to home, this research has implications for local housing policy as well as
property assessment and revenue. It suggests that Mayor Walsh and his advisory team
were right to include CLTs as a key strategy in their housing plan (Housing a Changing
City 2014). Walsh and the Department of Neighborhood Development (DND) would be
wise to continue past administrations’ support for DSNI, both politically and in the
donation of city-‐owned vacant parcels. While about 17% of parcels in the Dudley Village
Campus are vacant, that drops to only two percent within the land trust, and most of
those parcels are too small, too steeply-‐sloped, or too irregularly-‐shaped to build on or
use as green space (Hernandez 2015). If nothing else, turning remaining buildable
parcels over to DSNI seems like a good deal for City Hall. (On the other hand, DSNI
would likely find itself with more snow-‐shoveling responsibilities until it developed
those lots.) Beyond that, however, the fact that land trust properties remain
significantly lower in assessed value and seem relatively safe from the vicissitudes of the
housing market should draw the attention of local affordable housing advocates and
housing policymakers. This should bolster the argument of other organizations and
neighborhoods in the Boston area that are already interested in the community land
trust model, such as Chinatown, that it could aid those struggling with rising housing
prices.
Finally, for those who might argue that lower assessed values (due to the
restrictions on equity increases) lead to lower revenues for the city, the statistics on
vacant lots tell a different story: the savings from DSNI adding vacant lots to the land
Dwyer 69
trust and then partnering with developers to build housing or commercial structures
more than makes up for the difference between land trust buildings’ assessed values
and what they would likely be without those restrictions. As suggested in Mayor
Walsh’s recent housing plan, policymakers would be smart to explore whether other
neighborhoods would benefit from a community land trust—though given the clearly
severe need for affordable housing, they should try several approaches simultaneously,
perhaps targeted towards different income levels. As Dr. Bratt stated, “I’m kind of in
the ballpark of saying it’s all good, because we just need a lot more of it [affordable
housing] […] the land trust is a great idea, is an innovative idea, I think sometimes
though it’s a harder concept for people to really understand and get a hold of” (2015).
Other interviewees indicated that DSNI has been doing a good job recently of reaching
out to other communities, building partnerships with other organizations and activists,
and explaining their model, but even more education and outreach would likely prove
useful. Finally, better documentation, data sharing, and evaluation could allow future
researchers to compare multiple housing approaches and learn what best promotes
long-‐term housing affordability and neighborhood stability.
CONCLUSION Some of the vacant lots that lay fallow under the snow around Dudley this winter
will likely see change by next winter. As the weather heats back up, so does
development pressure in a city with a critical housing shortage and a burgeoning
economy. In another thirty years, the neighborhood may look as different as it does
today in comparison to the 1980s. Based on my research, I believe could change in
Dwyer 70
essentially one of two ways: towards displacement, or towards stabilized improvement.
If the trend of increasing building values continues (see Appendix, Figures 37, 38, and 29
through 32), the Dudley area could become dominated by mostly white, middle-‐class
young adults as gentrification spills over from the South End and North Dorchester. This
might be hastened by condo conversion or transit-‐oriented development along the
Fairmount line, if it is primarily luxury condos or so-‐called affordable units above the
neighborhood median income, or by the Roxbury Innovation Center in Dudley Square, if
it brings in outside start-‐ups seeking lower rent at the expense of neighborhood
businesses, entrepreneurs, and residents. Additionally, some of the currently affordable
housing (from Orchard Gardens to homes built by Madison Park Development
Corporation, Dorchester Bay EDC, and other CDCs) may expire and be converted to
market-‐rate units, unless local, state, or federal government implement new policies to
prevent conversion. Apart from this housing, much of it built in the last thirty years, the
private housing stock in the area is fairly old and sometimes poorly maintained,
lowering its value. However, the case of similarly old neighborhoods like Beacon Hill,
Mission Hill, and Jamaica Plain shows that if the housing demand is high enough,
renovation is well worth the cost, and can yield high returns on resale. These pressures
could displace current residents—particularly renters—to less expensive parts of the
city or outside of the city entirely.
On the other hand, the neighborhood could experience a less conventional shift:
it could remain a bastion of affordability for working families of color within city limits,
growing younger but better educated. As The State of Black Boston describes it, “Black
Dwyer 71
and Latino children are spearheading a quiet demographic revolution in this city with
many kinds of social and economic implications”, and these children today will be
tomorrow’s homebuyers, renters, and workers (2011). The BRA’s “Characteristics of
Boston and Its Neighborhoods” report shows that over 42% Roxbury’s population was
under age 24 in 2010, compared to around 36% citywide (Lima 2014). Finally, the
Boston Promise Initiative (established by DSNI and community partners) might boost
preK-‐12 education locally, fostering further achievement and wellbeing among the
community’s children and youth. If home prices remain low—supported by a bulwark of
existing affordable housing in the neighborhood, including that of the land trust or
depressed due to persisting issues with crime—those young people might find it easier
to stay in the neighborhood, some supporting parents as they age in place. They could,
with the right affordability protections (and new affordable homes) and more local jobs,
solidify the area’s revitalization and help achieve DSNI’s decades-‐long dream of
development without displacement. In order to make this future a reality, however,
neighborhood CDCs and organizations like DSNI will need to continue developing
innovative funding mechanisms, holding local government accountable to community
visions and needs, and forging collaboration.
One such collaborative project is underway even at the time of this writing: on
North Avenue students from nearby Madison Park High School, as part of YouthBuild,
have been building a single-‐family home on the DSNI land trust (Hernandez 2015). To
make it happen, DSNI drew upon its good relationship with the Department of
Neighborhood Development, as well as partnerships with local CDCs and banks. It
Dwyer 72
would be interesting to follow the story of that home and the land beneath it: how did it
become vacant? Once a family moves in, how might homeownership (with a ground
lease) affect their lives? What about the neighboring homes—will their property values
rise as an owner-‐occupied home replaces a vacant lot next to them? Or will the land
trust’s restrictions cause those properties to be valued at a lower level, keeping it more
affordable as well? Which is better for the community overall, restricted housing prices
along with limited equity or rapidly increasing home values but also an increasing risk of
displacement? It would take much more time, data, interviews and analysis to answer
these questions. However, by taking a new approach to studying DSNI’s land trust,
hopefully this thesis has at least opened the door to thorough, critical analyses of their
% Pop. Other Race 27.6% 35.5% (-‐1.327) 27.7% 32.3% (-‐1.098) # of Observations 40 12 40 12 ** p < 0.01 * p < 0.05 *Note: the long-‐form decennial Census survey was eliminated, replaced by the ACS, beginning with the 2010 survey. This means block-‐level data on economic characteristics cannot be compared between 2010 and previous ten-‐year Census records.
Dwyer 82
Figure 22: Black/African-American Population in the DVC, 2010
Figure 23: Latino/Hispanic Population in the DVC, 2010
Figure 24: White Population in the DVC, 2010
Figure 25: Population of All Other Race(s) in the DVC, 2010
Dwyer 83
Figure 26: Vacant Lots in the DVC, 2014
Dwyer 84
Figure 27: Owner Occupancy in the DVC, 2014
Dwyer 85
Figure 28: Land Values in the DVC, 2014
Dwyer 86
Figure 29: Building Values in the DVC, 2000
Dwyer 87
Figure 30: Building Values in the DVC, 2005
Dwyer 88
Figure 31: Building Values in the DVC, 2010
Dwyer 89
Figure 32: Building Values in the DVC, 2014
Dwyer 90
Figure 33: Foreclosures in the DVC, 1993-2014
Dwyer 91
Figure 34: Foreclosures in the Dudley Triangle, 1993-2014
Dwyer 92
Figure 35: Hot Spot Analysis (Getis-Ord Gi*) of Foreclosures in the DVC, 1993-2014
Dwyer 93
Figure 36: Hot Spot Analysis (Getis-Ord Gi*) of Foreclosures in the DVC, 1993-2014 (with Land Trust)
Dwyer 94
Figure 37: Building Values over Time in the Dudley Village Campus versus the Dudley Triangle
Figure 38: Building Values over Time in the Dudley Village Campus versus the Land Trust
$0
$25,000
$50,000
$75,000
$100,000
$125,000
$150,000
$175,000
$200,000
$225,000
2000 2005 2010 2014
DVC-‐DT
DT
$0
$25,000
$50,000
$75,000
$100,000
$125,000
$150,000
$175,000
$200,000
$225,000
2000 2005 2010 2014
DVC-‐LT
LT
Dwyer 95
Figure 39: Owner Occupancy Rates over Time in the Dudley Village Campus versus the Dudley Triangle
Figure 40: Owner Occupancy Rates over Time in the Dudley Village Campus versus in the Land Trust
0.0%
5.0%
10.0%
15.0%
20.0%
25.0%
30.0%
35.0%
40.0%
45.0%
2000 2005 2010 2014
DVC-‐DT
DT
0.0%
5.0%
10.0%
15.0%
20.0%
25.0%
30.0%
35.0%
40.0%
45.0%
2000 2005 2010 2014
DVC-‐LT
LT
Dwyer 96
Figure 41: Total Number of Units Built on DSNI Land Trust over Time
225
0
50
100
150
200
250 1994
1995
1996
1997
1998
1999
2000
2001
2002
2003
2004
2005
2006
2007
2008
2009
2010
2011
2012
2013
2014
Total LT Units
Dwyer 97
INTERVIEW INSTRUMENTS
Questionnaire 1 (for subjects with general knowledge of housing market & history of housing development in Boston)
General Context
1. How, if at all, do you think the overall housing market has changed in Boston over the past 30 years? [Follow-‐up: The affordable housing market? (define affordable as 50-‐80% AMI as prompted or relevant)]
2. How, if at all, do you think the demographics of the city have changed over the past 30 years? In other words, do you think the same kinds of people live in Boston now as 30 years ago?
3. What factors have affected the development of affordable housing in Boston over the past 30 years?
4. How did the foreclosure crisis affect Boston as a whole? The Dudley area?
Neighborhood (for those with specific knowledge of Dudley area)
5. What do you think are the greatest current strengths of the Dudley area?
6. What are the greatest current challenges or threats to the neighborhood?
7. Over the past 30 years, what do you think has contributed most to the neighborhood’s stability or revitalization?
8. Over the past 30 years, what do you think has most threatened the neighborhood’s stability or revitalization?
9. Tell me about the impact of vacant lots on the neighborhood.
Wrap-‐Up
10. What else do you think I should know about the housing market in Boston? In the Dudley area?
11. Who else should I talk to about the overall Boston housing market? The housing market & history of development in the Dudley area?
Dwyer 98
Questionnaire 2 (for subjects with general knowledge of community land trusts, their impact, and their operation)
Context
1. How would you define a community land trust?
2. What do you think sets the community land trust apart from other affordable housing models or strategies?
3. [If they know of DSNI]: What do you think sets DSNI’s land trust apart from other community land trusts?
History & Effectiveness of CLT model
4. By what criteria would you measure the effectiveness of a community land trust?
5. By what criteria do you think others (government officials, community residents, other organizations, etc) would measure the effectiveness of a community land trust?
6. What do you see as community land trusts’ original goal(s) when they were first established? How, if at all, has this changed?
7. How well do you think most community land trusts have achieved their original goal(s)?
8. What were the original “best practices” for community land trusts? How, if at all, have they changed?
Affordability & Displacement
9. How, if at all, do you think community land trusts affect housing affordability in the neighborhoods surrounding them?
10. How, if at all, do you think community land trusts affect the population makeup/demographics of the neighborhoods surrounding them?
11. How, if at all, do you think community land trusts affect foreclosure and vacancy rates in the neighborhoods surrounding them?
12. How, if at all, do you think community land trusts affect the level of stability and revitalization in the neighborhoods surrounding them?
General/Wrap-‐Up
13. Have you seen any other impacts of the community land trust model?
14. Do you think more, fewer, or the same amount of people are interested in the land trust model? Why do you think so?
15. Who else should I talk to about the impact of the community land trust model in general, or DSNI’s in particular?
Dwyer 99
Questionnaire 3 (for subjects with specific knowledge of DSNI’s land trusts, their impact, and their operation)
Context
1. How would you define a community land trust?
2. What do you think sets the community land trust apart from other affordable housing models or strategies?
3. What do you think sets DSNI’s land trust apart from other community land trusts?
4. Where did the idea for a land trust in the Dudley neighborhood come from?
History & Effectiveness of CLT model
5. By what criteria would you measure the effectiveness of a community land trust?
6. By what criteria do you think others (government officials, community residents, other organizations, etc) would measure the effectiveness of a community land trust?
7. What do you see as the DSNI land trust’s original goal(s) (when it was first established)? How, if at all, has this changed?
8. How well do you think DSNI’s land trust has achieved its original goal(s)?
9. What were the original “best practices” for the land trust? How, if at all, have they changed?
Neighborhood (for those with specific knowledge of Dudley area)
10. What do you think are the greatest current strengths of the Dudley neighborhood?
11. What are the greatest current challenges or threats to the neighborhood?
12. Over the past 30 years, what do you think has contributed most to the neighborhood’s stability or revitalization?
13. Over the past 30 years, what do you think has most threatened the neighborhood’s stability or revitalization?
14. Tell me about the impact of vacant lots on the neighborhood.
Affordability & Displacement (for those with specific knowledge of Dudley area)
15. How, if at all, do you think DSNI’s land trust has affected affordable housing in the neighborhood over the past 30 years?
16. How, if at all, do you think the land trust has affected the population makeup of the neighborhood? Do you think the same kinds of people live there now as 30 years ago?
General/Wrap-‐Up
17. Have you seen any other impacts of the DSNI land trust?
Dwyer 100
18. Do you think more, fewer, or the same amount of people are interested in the land trust model? Why do you think so?
19. Who else should I talk to about the impact of the community land trust model in general, or DSNI’s in particular?
COUHES Approval
Dwyer 101
Bibliography
Abromowitz, David. The Community Land Trust Legal Manual: A Handbook for Community Land Trusts and Their Attorneys. Springfield, MA: Institute for Community Economics (ICE), 1991.
Alicea, José Antonio. “Dancing with the City--the Dudley Street Neighborhood Initiative and
Land Control in Roxbury.” Thesis, Massachusetts Institute of Technology, 1991. Bagdol, Alese. “Property Taxes and Community Land Trusts: A Middle Ground.” Texas Law
Review 91, no. 4 (March 2013): 939–59. Bank, David A. Comprehensive Market Analysis: Boston, Massachusetts. U.S. Department of
Housing and Urban Development Office of Policy Development and Research, June 1, 2012. http://www.huduser.org/publications/pdf/BostonMA_comp_12.pdf.
Bluestone, Barry, et al. The Greater Boston Housing Report Card 2014-2015. Dukakis
Center for Urban and Regional Policy Northeastern University, 2015. Accessed April 26, 2015. http://www.northeastern.edu/dukakiscenter/wp-content/uploads/2015/03/Housing_Report_2014-15.pdf.
———. The Greater Boston Housing Report Card 2013: What Follows the Housing
Recovery?. Dukakis Center for Urban and Regional Policy Northeastern University, 2013. http://www.tbf.org/~/media/TBFOrg/Files/Reports/2013%20GBHRC.pdf.
Boston Assessing Department. “Triennial Revaluation,” n.d.
http://www.cityofboston.gov/assessing/reval.asp Boston DND. Foreclosure Trends 2010. 2010.
———. Boston by the Numbers: Housing. Boston Redevelopment Authority, 2013. http://www.bostonredevelopmentauthority.org/getattachment/76bd9781-55ee-4545-928c-706d571523a3/.
———. Boston Redevelopment Authority Library, 1970.
http://archive.org/details/bostonredevelopm00bost. ———. “Inclusionary Development Program Guidance for Developers,” n.d.
Bratt, Rachel. Professor, Department of Urban and Environmental Policy and Planning, Tufts
University. Personal interview, January 7, 2015.
Center for Regionalism and Analytical Planning (CrAP), “Beyond Tactical Urbanism: Spatial Strategies in Innovative Praxis.” Lecture held at MIT, April 1, 2015.
Code for Boston/Code for America. “UNGENTRY,” 2015.
http://codeforboston.github.io/ungentry/#.
Crockett, Karilyn. “Street Smart.” Architecture Boston 15, no. 4 (Winter 2012). Cutrufo, Joseph. “Boston, We Hardly Knew You.” Planning, n.d.
https://www.planning.org/planning/2011/jan/boston.htm. Davis, John Emmeus. Partner, Burlington Associates. Personal interview, January 8, 2015. ———. The Community Land Trust Reader. Cambridge: Lincoln Institute of Land Policy,
2010. ———. “More Than Money: What Is Shared in Shared Equity Homeownership?” Journal of
Affordable Housing & Community Development Law 19, no. 3/4 (Spring 2010): 259–77. Davis, John Emmeus, and Amy Demetrowitz. Permanently Affordable Homeownership: Does
the CLT Deliver on Its Promises? A Performance Evaluation of the CLT Model Using Resale Data from the Burlington CLT. Burlington Community Land Trust, 2003. http://cltnetwork.org/wp-content/uploads/2014/01/2003-Permanent-Affordability-Homeownership.pdf.
Davis, John Emmeus, and Rick Jacobus. The City-CLT Partnership: Municipal Support for
Community Land Trusts. Cambridge, MA: Lincoln Institute of Land Policy, 2008.
Dwyer 103
Davis, Tim H. “Distress down Considerably from Last Year, but Concerns Linger.”
Foreclosure Monitor, May 16, 2014. http://www.mhp.net/vision/resources.php?page_function=detail&resource_id=659.
Desmarais, Martin. “Dudley Neighbors Inc. Celebrates 25 Years Building Community through
Land Trust.” Bay State Banner, June 5, 2014. http://baystatebanner.com/news/2014/jun/05/dudley-neighbors-inc-celebrates-25-years-building-/.
http://diversitydata.org/Data/Maps/Show.aspx?ind=260&sortby=Name. Dorchester Bay EDC. “About Us.” N.d. http://www.dbedc.org/about.html Dormann, Carsten F, Jana M. McPherson, Miguel B. Araújo, Roger Bivand, Janine Bolliger,
Gudrun Carl, Richard G. Davies, et al. “Methods to Account for Spatial Autocorrelation in the Analysis of Species Distributional Data: A Review.” Ecography 30, no. 5 (October 2007): 609–28. doi:10.1111/j.2007.0906-7590.05171.x.
The Dudley Street Neighborhood Initiative Revitalization Plan : A Comprehensive Community Controlled Strategy. DAC International and Dudley Street Neighborhood Initiative, 1987.
Environmental Law 66, no. 4 (March 13, 2014): 4–9. doi:10.1080/15480755.2014.904610.
Dwyer, Lee. “Blog Post #3: Mapping as a Creative Means of Community Engagement.” MIT
Public Service Center Blog, August 5, 2014. http://mitpsc.mit.edu/blog/current-summer-2014-lee-dwyer-g/.
Everdell, Ros. Deputy Director, DSNI. Personal interview, January 23, 2015. Galster et al. “Measuring the Impacts of Community Development Initiatives: A New
Application of the Adjusted Interrupted Time Series Method,” n.d. http://www.clas.wayne.edu/Multimedia/DUSP/files/land_use_db/GalsterCDC_Impact_Paper_3_04_ERev_revised.pdf.
Dwyer 104
Geisler, Charles C, and Frank Popper. Land Reform, American Style. Totowa, N.J.: Rowman
& Allanheld, 1984. Glasmeier, Amy. Living Wage Calculator, n.d. http://livingwage.mit.edu/. Graves, Erin. “What Do the Neighbors Think?” New England Community Developments, Fed
Reserve of Boston, 2012. http://www.bostonfed.org/commdev/necd/2012/issue1/what-do-the-neighbors-think.htm.
Graves, Erin and Elizabeth Shuey. The Social Impact of Home Rehabilitation in Low-Income
Neighborhoods, 2013. http://www.bostonfed.org/commdev/pcadp/2013/cddp1301.pdf. Gray, Karen A., and Mugdha Galande. “Keeping ‘Community’ in a Community Land Trust.”
Social Work Research 35, no. 4 (December 2011): 241–48. Gura, Jeanne Goldie. “Preserving Affordable Homeownership Opportunities in Rapidly
Escalating Real Estate Markets.” Journal of Affordable Housing and Community Development Law 11 (2002 2001): 78.
Handy, Delores. “MBTA to Open 2 New Stations, Lower Fares on Fairmount Line.” WBUR,
June 23, 2013. Hartley, Daniel. “Gentrification and Financial Health,” Federal Reserve Bank of Cleveland,
2013. http://www.clevelandfed.org/research/trends/2013/1113/01regeco.cfm. Hernandez, Tony. Director of Operations and Stewardship, Dudley Neighbors Inc. Personal
interview, March 10, 2015. “History of Boston’s Foreclosure Prevention Inititative,” City of Boston, Department of
Horlitz, Sabine. “Housing Beyond Profit: A Comparison of US and German Alternative
Ownership Models.” American Institute for Contemporary German Studies (http://www. Aicgs. Org/publication/housing-beyond-Profit-a-Comparison-of-Us-Andgerman-Alternative-Ownership-Models, Zuletzt Aufgerufen Am 03.09. 2012), 2012. http://syndikat.blogsport.eu/files/2012/10/Horlitz_Housing-Beyond-Profit.pdf.
Housing a Changing City: Boston 2030. City of Boston, October 2014.
Institute for Community Economics (ICE). The Community Land Trust Handbook. Emmaus,
Pa.: Rodale Press, 1982.
Dwyer 105
Irons, Meghan. “MBTA Pilot Program to Boost New Commuter Line.” Boston Globe, July 8, 2013.
Jacobus, Rick, and David M. Abromowitz. “A Path to Homeownership: Building a More Sustainable Strategy for Expanding Homeownership.” Journal of Affordable Housing & Community Development Law 19, no. 3/4 (Spring 2010): 313–28,330–44.
Johnson, Michael, David Turcotte, and Felicia Sullivan. “What Foreclosed Homes Should a
Municipality Purchase to Stabilize Vulnerable Neighborhoods?” Networks & Spatial Economics 10, no. 3 (September 2010): 363–88. doi:10.1007/s11067-010-9138-3.
Johnston, Katie. “Boston Has Third Highest Rate of Income Inequality - The Boston Globe.”
The Boston Globe, March 17, 2015. https://www.bostonglobe.com/business/2015/03/17/boston-has-third-highest-rate-income-inequality/lWgWJZ7vHZROi4xkcXKEXJ/story.html.
———. “Demand for Affordable Housing Soars.” The Boston Globe, November 17, 2014.
Keating,W. Dennis. “Citizen Participation, Neighborhood Planning And Empowerment Of The Poor.” Shelterforce, 1994. http://www.nhi.org/online/issues/76/books.html.
Kelly, Jr., James J. “Maryland’s Affordable Housing Land Trust Act.” Journal of Affordable
Housing & Community Development Law 19, no. 3/4 (Spring/Summer ///Spring/Summer2010 2010): 345–65.
Kriesberg, Joe. President, Massachusetts Association of Community Development
Corporations. Personal interview, February 9, 2015. “Land Trust 101.” Dudley Neighbors, Inc., 2015. http://www.dudleyneighbors.org/land-trust-
101.html.
Layzer, Judith A. The Environmental Case : Translating Values into Policy. Washington, D.C. : CQ Press, 2012.
Lehavi, Amnon. The Construction of Property: Norms, Institutions, Challenges. Cambridge
University Press, 2013. Levinger, George. Owning a CLT Home: A Survey Report on Homeowner Satisfaction.
Institute for Community Economics (ICE), 2001. Accessed April 26, 2015. http://cltnetwork.org/wp-content/uploads/2014/01/2001-Owning-a-CLT-Home.pdf.
Lima, Alvaro. “Characteristics of Boston and Its Neighborhoods.” Boston Redevelopment
Lipman, Mark, and Mahan, Leah. Gaining Ground. New Day Films, 2013. http://www.holdinggroundproductions.com/#gaining-ground.
———. Holding Ground. New Day Films, 1986.
http://www.holdinggroundproductions.com/#holding-ground. Logan, John R., and Harvey Luskin Molotch. Urban Fortunes: The Political Economy of
Place. University of California Press, 1987. Loh, Penn. Lecturer and Director of the Master in Public Policy Program and Community
Practice, Tufts University, and Former Executive Director of ACE. Personal interview, February 27, 2015.
Loh, Penn. “How One Boston Neighborhood Stopped Gentrification in Its Tracks.” Article.
YES! Magazine. Accessed March 28, 2015. http://www.yesmagazine.org/issues/cities-are-now/how-one-boston-neighborhood-stopped-gentrification-in-its-tracks.
Louie, May. Former Director of Leadership and Capacity Building, DSNI. Personal
interview, February 11, 2015. Louie, May. “Communities as a Force in Community Revitalization.” CoLab Radio,
September 9, 2014. http://colabradio.mit.edu/communities-as-a-force-in-community-revitalization/.
Madison Park Development Corporation. “Our History.” N.d. http://www.madison-
park.org/about-us/history “Mapping Neighborhood Transformation,” Boston University Urban Symposium, Codman
Square Neighborhood Development Corporation, 2014. http://www.dotnews.com/BU%20CSNDC%20Mapping%20Neighborhood%20Transformation.pdf.
Marcuse, Peter. “Blog #38 - Community Land Trusts: Empty, Moderate, and Full-Bodied.” Peter Marcuse’s Blog, 2013. https://pmarcuse.wordpress.com/2013/10/16/blog-38-community-lnd-trusts-empty-moderate-and-full-bodied/.
Massachusetts General Court. Chapter 121A: Urban Redevelopment Corporations, 1946.
https://malegislature.gov/Laws/GeneralLaws/PartI/TitleXVII/Chapter121A. Mast, Brent. “Measuring Neighborhood Quality With Survey Data: A Bayesian Approach,”
Meehan, James. “Reinventing Real Estate The Community Land Trust As a Social Invention in Affordable Housing.” Journal of Applied Social Science 8, no. 2 (September 1, 2014): 113–33. doi:10.1177/1936724413497480.
Meléndez, Edwin, Alex F. Schwartz, and Alexandra de Montrichard. “Year 15 and
Preservation of Tax-Credit Housing for Low-Income Households: An Assessment of Risk.” Housing Studies 23, no. 1 (January 1, 2008): 67–87. doi:10.1080/02673030701730714.
Miller, Yawu. “Gentrification Seen Gaining a Foothold in Roxbury.” Accessed October 18,
Mironova, Oksana. “The Value of Land: How Community Land Trusts Maintain Housing
Affordability.” Urban Omnibus, April 29, 2014. http://urbanomnibus.net/2014/04/the-value-of-land-how-community-land-trusts-maintain-housing-affordability/.
Molina Costa, Patricia. “Whose City? : Redevelopment and Governance in Boston.” Thesis,
Massachusetts Institute of Technology, 2011. http://dspace.mit.edu/handle/1721.1/69464. Moore, Tom, and Kim McKee. “Empowering Local Communities? An International Review
of Community Land Trusts.” Housing Studies 27, no. 2 (March 2012): 280–90. doi:10.1080/02673037.2012.647306.
Mori, Alison E. “Vacant and Underutilized Land in Boston.” Thesis, Massachusetts Institute
of Technology, 2004. http://dspace.mit.edu/handle/1721.1/26726. Murphy, Sean P. “Boston Redevelopment Authority Cuts Secret Deals with Developers — at
the Expense of Affordable Housing.” The Boston Globe, December 22, 2013. https://www.bostonglobe.com/metro/2013/12/22/boston-redevelopment-authority-cuts-secret-deals-with-developers-expense-affordable-housing/TSnyPNiFatxlgN6MaQFmrL/story.html.
Nagel, Andrea Isabel. “The Dudley Street Neighborhood Initiative : A Case Study in
Community-Controlled Planning.” Thesis, Massachusetts Institute of Technology, 1990. http://dspace.mit.edu/handle/1721.1/69266.
Nuestra Comunidad CDC. “Our History.” N.d. http://nuestracdc.org/about-us/our-history Newsham, Jack. “Boston Seeks to Build 250 Homes on City-Owned Vacant Lots.”
BostonGlobe, March 5, 2015. https://www.bostonglobe.com/business/2015/03/05/boston-seeks-build-homes-city-owned-vacant-lots/nV0QrA43KjWxQz6YuJq9NM/story.html.
Ord, J. K., and Arthur Getis. “Local Spatial Autocorrelation Statistics: Distributional Issues
and an Application.” Geographical Analysis 27, no. 4 (September 3, 2010): 286–306. doi:10.1111/j.1538-4632.1995.tb00912.x.
Dwyer 108
Overbea, Luix. “Secession Scare Has Boston Mayor Mending Fences with Blacks. `Mandela’
Referendum Failed at Polls but Stirs City Hall Action.” Christian Science Monitor, November 20, 1986. http://www.csmonitor.com/1986/1120/aman.html.
Peterson, Paul E. City Limits. Chicago : University of Chicago Press, 1981.
Putnam, Robert D., Lewis M. Feldstein, and Don Cohen. Better Together : Restoring the
American Community. New York : Simon & Schuster, 2003. Rohe, William M., and Leslie S. Stewart. “Homeownership and Neighborhood Stability.”
Sandra Larson. “Walsh Administration Calls for 50,000 New Units of Housing in Boston.”
Bay State Banner, October 15, 2014. http://baystatebanner.com/news/2014/oct/15/walsh-administration-calls-50000-new-units-housing/.
Serna, Rhea. “Tenants Plus Land Trust Beat Gentrification.” Race, Poverty & the Environment
15, no. 1 (2008): 36. Sherriff, Ryan. “Shared Equity Homeownership State Policy Review.” Journal of Affordable
Housing & Community Development Law 19, no. 3/4 (Spring 2010): 279–311. Sklar, Holly. “No Foreclosures Here.” Article. YES! Magazine. Accessed April 12, 2015.
http://www.yesmagazine.org/issues/sustainable-happiness/no-foreclosures-here. Sklar, Holly, and Peter Medoff. Streets of Hope. South End Press, 1994.
Spark, Laura Gail. “Youth Issues, Youth Programming and the Dudley Street Neighborhood
Initiative’s Role in the Dudley Triangle.” Thesis, Massachusetts Institute of Technology, 1992. http://dspace.mit.edu/handle/1721.1/70222.
The State of Black Boston. Urban League of Eastern Massachusetts, NAACP Boston,
University of Massachusetts Boston, 2011. http://www.umb.edu/editor_uploads/images/trotter/SOBBExecutiveSummary2011.pdf
Dwyer 109
Sullivan, Laura et al. The Racial Wealth Gap: Why Policy Matters. Brandeis University, Institute for Assets & Social Policy; Demos, 2015. http://www.demos.org/sites/default/files/publications/RacialWealthGap_1.pdf.
Sungu-Eryilmaz, Yesim, and Greenstein, Rosalind. A National Study of Community Land
Trusts (Working Paper). Lincoln Institute for Land Policy, 2007. http://cltnetwork.org/wp-content/uploads/2014/01/2007-A-National-Study-of-CLTs.pdf.
Swann, Robert S, and Center for Community Economic Development. The Community Land
Trust; a Guide to a New Model for Land Tenure in America. Cambridge, Mass.: Center for Community Economic Development, 1972.
Taylor, Elizabeth. “The Dudley Street Neighborhood Inititative and the Power of Eminent
Domain,” 1995. http://lawdigitalcommons.bc.edu/bclr/vol36/iss5/8. Temkin, Kenneth Mark, Brett Theodos, and David Price. “Sharing Equity with Future
Generations: An Evaluation of Long-Term Affordable Homeownership Programs in the USA.” Housing Studies 28, no. 4 (2013): 553–78.
Thaden, Emily. Research and Policy Development Manager, National CLT Network.
Personal interview, January 16, 2015. Thaden, Emily and Greg Rosenberg. Outperforming the Market: Making Sense of the Low
Rates of Delinquencies and Foreclosures in Community Land Trusts. Lincoln Institute for Land Policy, 2010. https://www.lincolninst.edu/pubs/dl/1857_1164_Thaden%20Final.pdf.
Thaden, Emily, Andrew Greer, and Susan Saegert. “Shared Equity Homeownership: A
Welcomed Tenure Alternative Among Lower Income Households.” Housing Studies 28, no. 8 (August 8, 2013): 1175–96.
Thompson, Michelle et al. Building Bridges Between Community Based Organisations and Technology: Exploring Tools for Community Participation and Economic Development for the Dudley Street Neighborhood Initiative, 2004. https://www.academia.edu/839307/Building_Bridges_Between_Community_Based_Organisations_and_Technology_Exploring_Tools_for_Community_Participation_and_Economic_Development_for_the_Dudley_Street_Neighborhood_Initiative.
Tumber, Catherine. “In-Demand Cities: Boston.” Architectural Record, October 2014.
http://archrecord.construction.com/features/2014/1410-In-Demand-Cities-Boston.asp. U. S. Census Bureau. “Quarterly Vacancy and Homeownership Rates by State and MSA.”
N.d. http://www.census.gov/housing/hvs/data/rates.html. Voith, Richard P., and Susan M. Wachter. “The Affordability Challenge: Inclusionary
Housing and Community Land Trusts in a Federal System.” Value Capture and Land
Dwyer 110
Policies, Gregory K. Ingram and Yu-Hung Hong, Eds., Lincoln Institute of Land Policy, 2012. http://realestate.wharton.upenn.edu/research/papers/full/722.pdf.
Von Hoffman, Alexander. House by House, Block by Block : The Rebirth of America’s Urban
Neighborhoods. New York : Oxford University Press, c2003., 2003. Wallace, Alison. “Shared Ownership: Satisfying Ambitions for Homeownership?”
International Journal of Housing Policy 12, no. 2 (May 28, 2012): 205–26. doi:10.1080/14616718.2012.681580.
Willett, Gayle. Director of Valuation Division, Boston Assessing Department. Personal
interview, February 18, 2015. Woolhouse, Megan. “Federal cuts hitting housing subsidy program.” Boston Globe, May 26,