Mapping isotope variability in water resources research Recent activities of the International Atomic Energy Agency Isoscapes, 2008 Santa Barbara, CA, 8-10 April 2008 P. Aggarwal , L Araguás et al. IAEA - Isotope Hydrology Section, Vienna
Transcript
Mapping isotope variability in water
resources research
Recent activities of the International Atomic
Energy Agency
Isoscapes, 2008
Santa Barbara, CA, 8-10 April 2008
P. Aggarwal , L Araguás et al.
IAEA - Isotope Hydrology Section, Vienna
OUTLINE
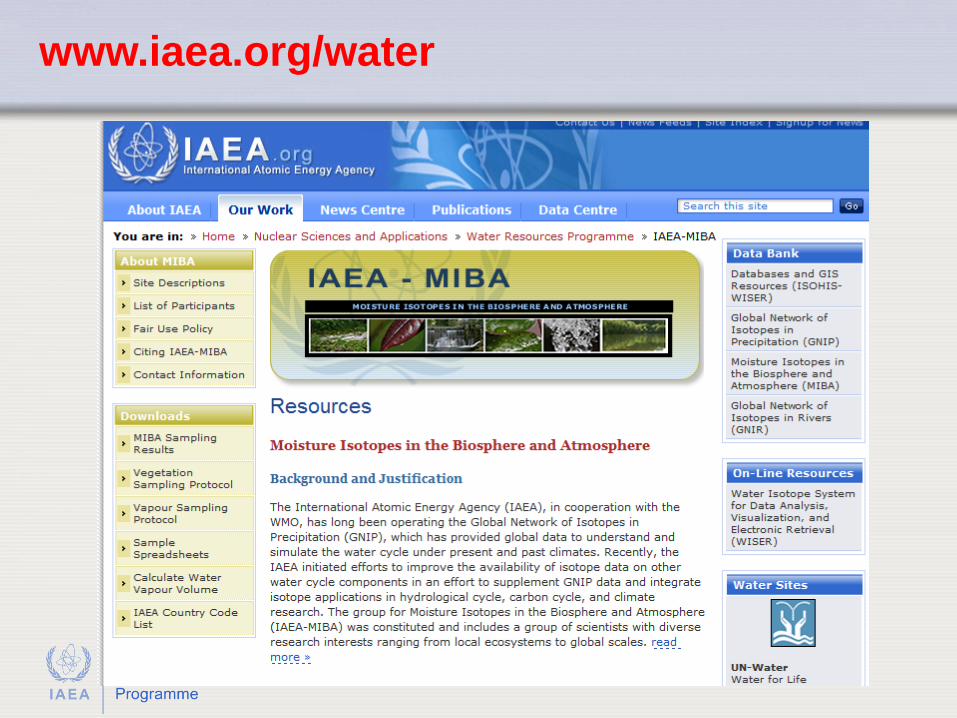
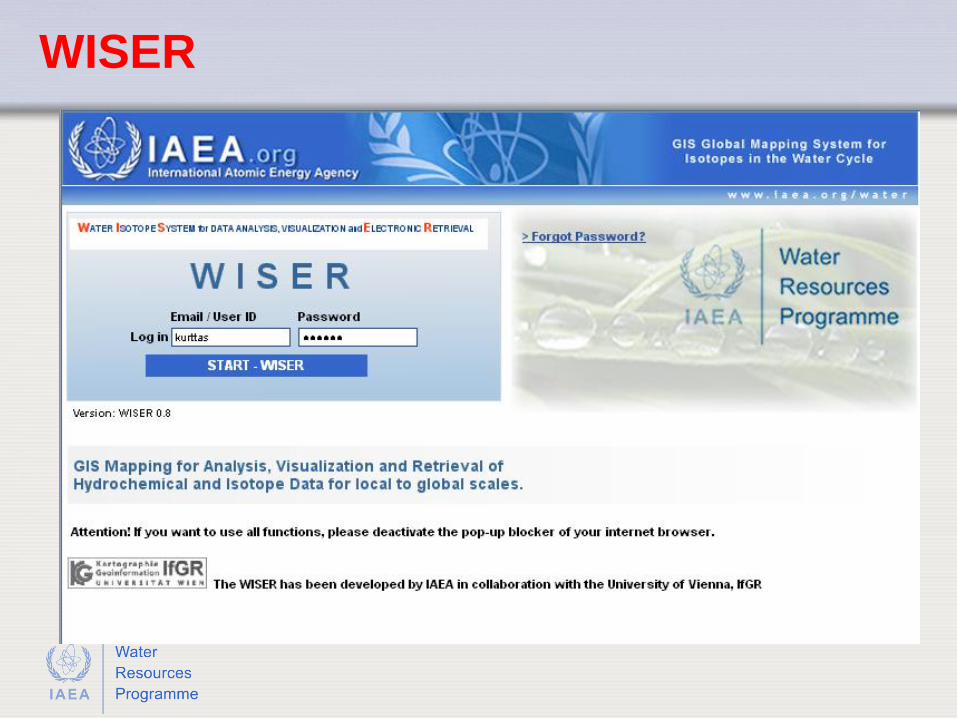
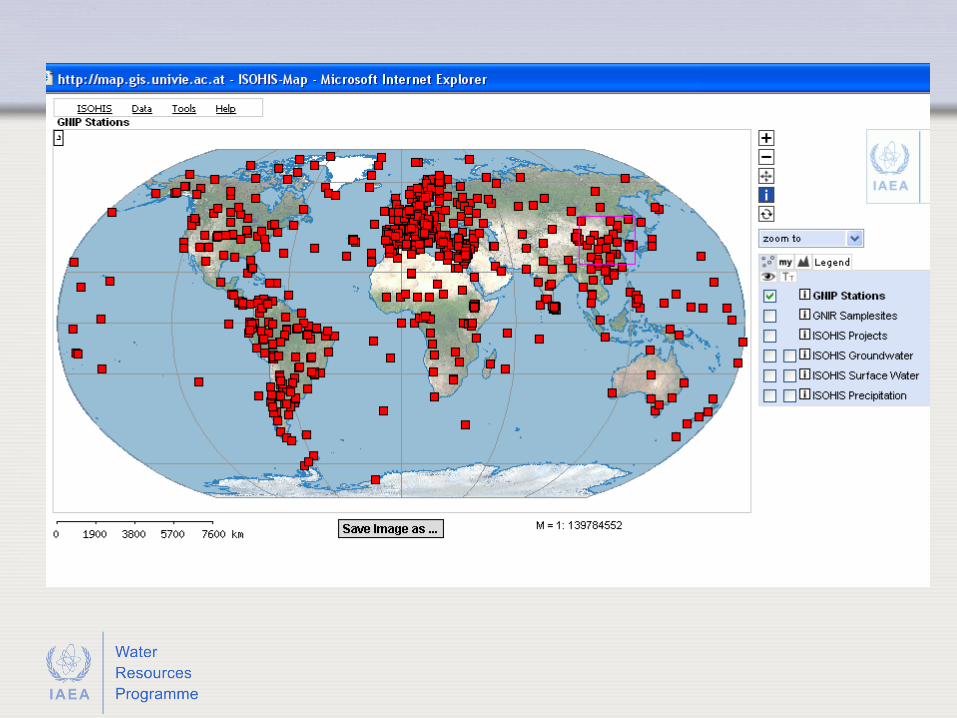
• Current work on water isotope data compilation at the IAEA
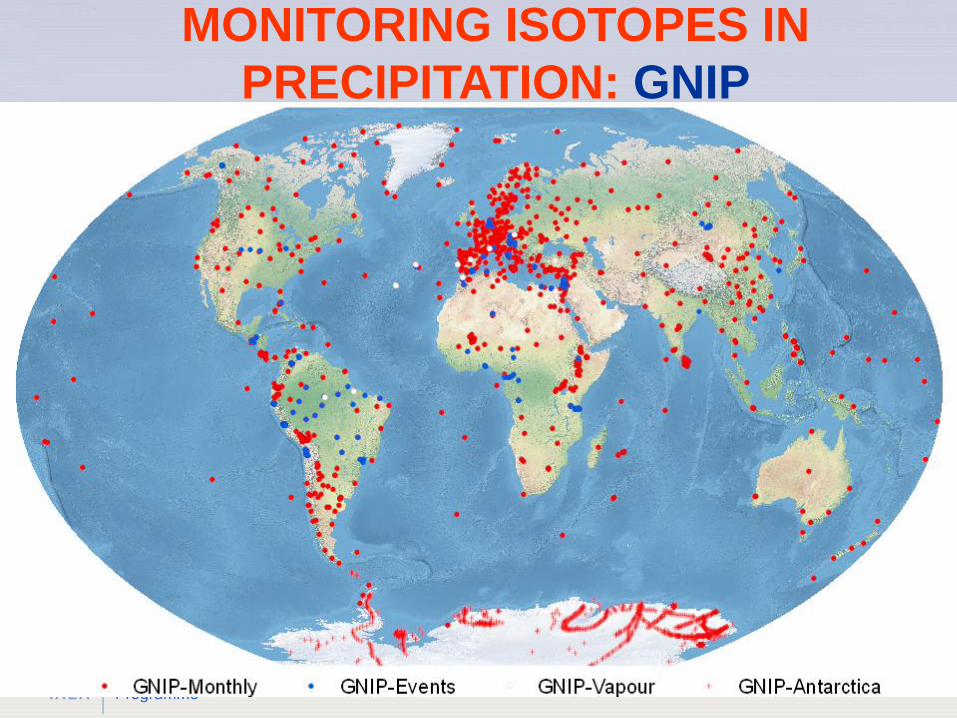
• Current status of GNIP and other isotope networks and databases.
• Isotope mapping in connection with the understanding of the water cycle and water resources management
Rationale for IAEA’s Work in Water
• United Nations Agency
• Mandate has 3 areas of work
• 1- Non-proliferation
• 2- Nuclear safety
• 3- Peaceful uses of nuclear/isotope
technology• Agriculture, Human Health, Industrial Applications
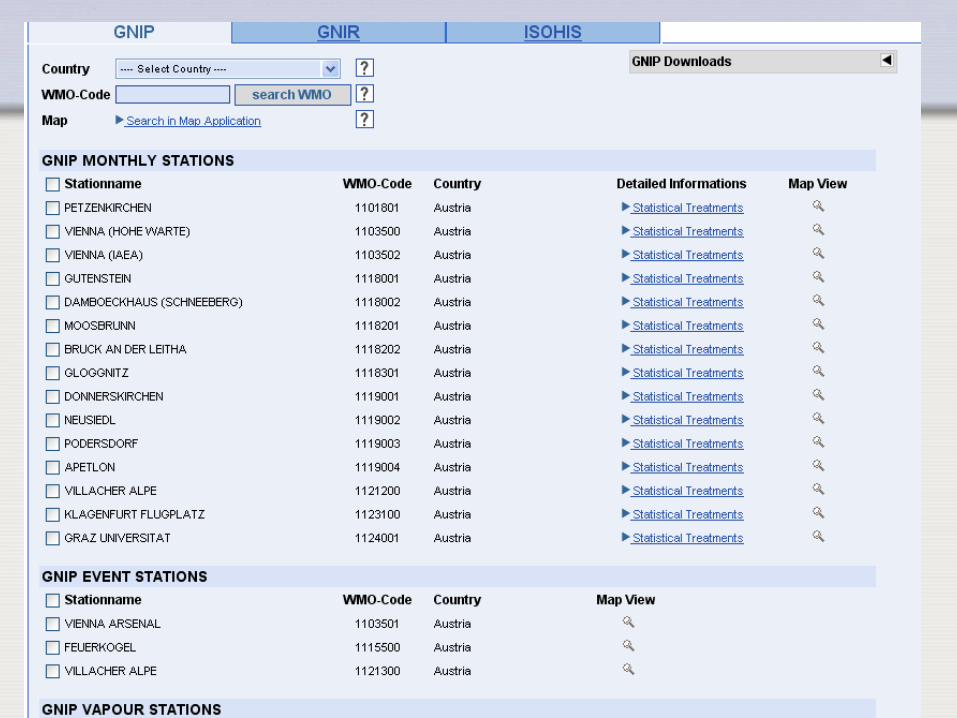
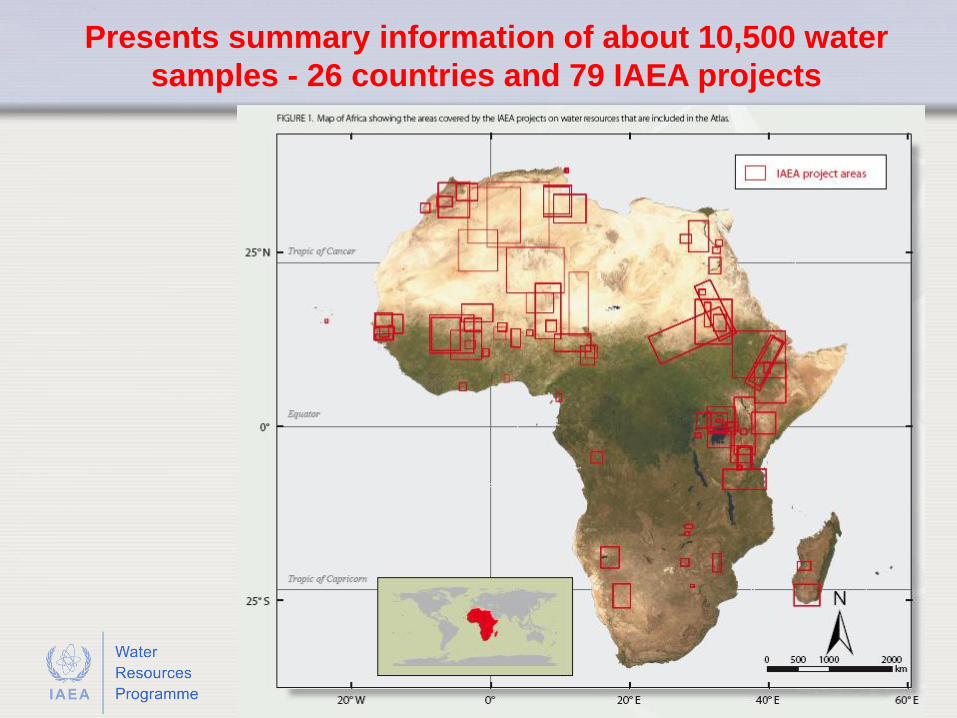
Presents summary information of about 10,500 water
samples - 26 countries and 79 IAEA projects
GIS products
• Global and regional isotope maps showing
aereal distribution – input function to water
systems and sources of water
• Isotope cross-sections and 3D-blocks. Depth
oriented sampling, allows visualizing vertical
structure of water bodies: age and/or water
quality distribution.
Isotope maps/visualization tools
• 18O in prec. distribution maps and animations
(Birks et al.)
• Gridded global/regional isotope maps 1º x 1º
• Regional maps isotopes in precipitation
(arithmetic/weighted means)
• Isotope cross-sections and 3D blocks in aquifers
• Combined isotope maps (18O - 14C in
groundwaters, 18O in present-day prec. and in gw,
etc.)
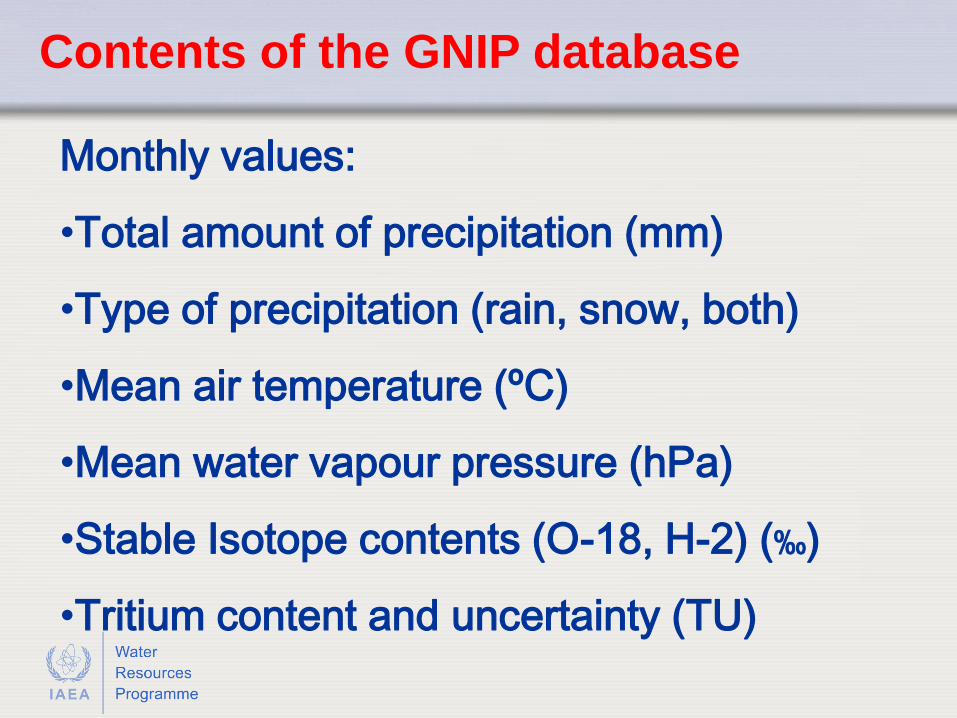
isotope data, basic meteorological variables as recorded by the stations such, as type and amount of precipitation, surface air temperature and
vapour pressure
World maps showing
spatial distribution
of δ18O/trit in prec.
O-18 July
Animations: seasonal variation of
isotope concentrations in precipitation
Regional isotope maps
Gridded isotope maps
3D-diagrams to visualize groundwater
origin, dynamics and flow patterns
Santiago de Chile: Isotopes as a tool to define sources of
recharge, groundwater origin, flow patterns and pollutant
transport
Credit: Iriarte, S. (2003)
Interpolation methods (under testing)
• Multivariate interpolation
• Inverse distance weighting
• Kriging
• Optimal interpolation (Ganding’s approach)
• Weighted anisotropic interpolation
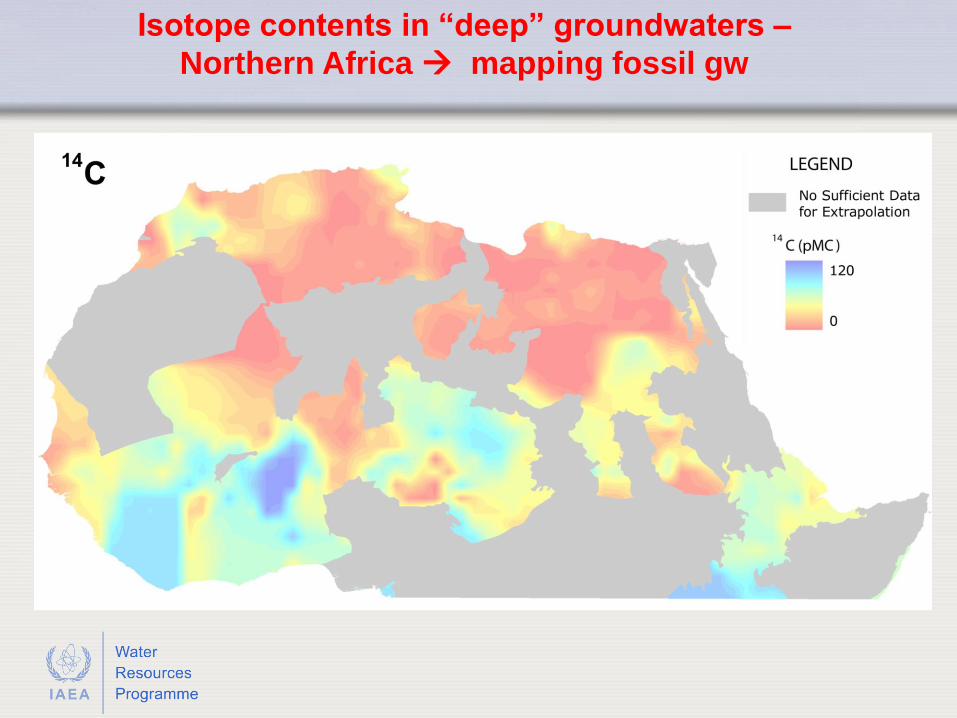
Isotope contents in “deep” groundwaters –
Northern Africa mapping fossil gw
Isotope contents in “deep” groundwaters –
Northern Africa
Present-day
precipitation
Deep
groundwater
d18O (‰)
Recent recharge to deep aquifers (1968-1978)
Concluding remarks
• The IAEA has extended isotope monitoring beyond GNIP and provides access to other global isotope databases
• Current efforts focus now on the compilation of historical isotope data (mainly ground- and surface waters) and the development of geostatistical methods and GIS tools.
• Contributions of data/samples/analysis to GNIP (after publication) and to the other isotope databases are welcome (such as Antarctica), at [email protected].