Mapping mean annual groundwater recharge in the Nebraska Sand Hills, USA Jozsef Szilagyi & Vitaly A. Zlotnik & John B. Gates & Janos Jozsa Abstract Mean annual recharge in the Sand Hills of Nebraska (USA) over the 2000–2009 period was esti- mated at a 1-km spatial resolution as the difference of mean annual precipitation (P) and evapotranspiration (ET). Monthly P values came from the PRISM dataset, while monthly ET values were derived from linear transformations of the MODIS daytime land-surface temperature values into pixel ET rates with the help of ancillary atmospheric data (air temperature, humidity, and global radiation). The study area receives about 73mm of recharge (with an error bound of ±73mm) annually, which is about 14±14% of the regional mean annual P value of 533mm. The largest recharge rates (about 200±85mm or 30±12% of P) occur in the south-eastern part of the Sand Hills due to smoother terrain and more abundant precip- itation (around 700mm), while recharge is the smallest (about 40±59mm or 10±14% of P) in the western part, where annual precipitation is only about 420mm. Typi- cally, lakes, wetlands, wet inter-dunal valleys, rivers, irrigated crops (except in the south-eastern region) and certain parts of afforested areas in the south-central portion of the study area act as discharge areas for groundwater. Keywords Groundwater recharge/water budget . MODIS data . USA . Remote sensing Introduction With increasing emphasis on integrated management of groundwater and surface-water resources, there is high demand for improvements to regional hydrologic models covering areas on the order of 10 4 km 2 or greater. Among various water cycle characteristics, groundwater recharge is the leading hydrologic parameter determining ground- water resources availability and sustainability. Ground- water recharge is generally not directly measured, but rather inferred from more easily measurable physical and chemical parameters, often with the help of models with varying complexity (Crosbie et al. 2010a, b). Methods of estimating groundwater recharge are broadly categorized as water-budget methods, modeling methods, physical methods involving saturated and unsaturated zones, and tracer techniques involving chemical, isotopic, and heat tracers (Healy 2010). In spite of the variety of the available techniques, precise recharge estimation is diffi- cult because of high levels of uncertainty associated with most estimation methods (Scanlon et al. 2002). Determining spatially explicit recharge rates for model cells on the scale of ∼1 km 2 is a current challenge for improving regional hydrologic models. In most cases, obtaining field-based estimates for each model cell would be prohibitively expensive. As a result, methods which integrate remote sensing for recharge estimation at these scales have generated recent interest (Brunner et al. 2004, 2007). The water-balance approach which formulates recharge as the difference in precipitation (P) as well as the sum of surface/subsurface runoff and evapotranspira- tion (ET)—averaged over a suitably long period to make changes in storage negligible—is amenable for such applications. ET can typically be inferred from remote sensing while precipitation data are available from Received: 9 February 2011 /Accepted: 11 July 2011 * Springer-Verlag 2011 Electronic supplementary material The online version of this article (doi:10.1007/s10040-011-0769-3) contains supplementary material, which is available to authorized users. J. Szilagyi : J. Jozsa Department of Hydraulic and Water Resources Engineering, Budapest University of Technology and Economics, Muegyetem Rakpart. 3–9, 1111 Budapest, Hungary J. Szilagyi ()) School of Natural Resources, University of Nebraska-Lincoln, 3310 Holdrege Street HH625, Lincoln, NE 68583( USA e-mail: [email protected]V . A. Zlotnik : J. B. Gates Department of Earth and Atmospheric Sciences, University of Nebraska-Lincoln, 214 Bessey Hall, Lincoln, NE 68588-0340( USA Hydrogeology Journal DOI 10.1007/s10040-011-0769-3
Transcript
Mapping mean annual groundwater recharge in the Nebraska SandHills, USA
Jozsef Szilagyi & Vitaly A. Zlotnik & John B. Gates &
Janos Jozsa
Abstract Mean annual recharge in the Sand Hills ofNebraska (USA) over the 2000–2009 period was esti-mated at a 1-km spatial resolution as the difference ofmean annual precipitation (P) and evapotranspiration(ET). Monthly P values came from the PRISM dataset,while monthly ET values were derived from lineartransformations of the MODIS daytime land-surfacetemperature values into pixel ET rates with the help ofancillary atmospheric data (air temperature, humidity, andglobal radiation). The study area receives about 73mm ofrecharge (with an error bound of ±73mm) annually, whichis about 14±14% of the regional mean annual P value of533mm. The largest recharge rates (about 200±85mm or30±12% of P) occur in the south-eastern part of the SandHills due to smoother terrain and more abundant precip-itation (around 700mm), while recharge is the smallest(about 40±59mm or 10±14% of P) in the western part,where annual precipitation is only about 420mm. Typi-cally, lakes, wetlands, wet inter-dunal valleys, rivers,irrigated crops (except in the south-eastern region) andcertain parts of afforested areas in the south-central
portion of the study area act as discharge areas forgroundwater.
With increasing emphasis on integrated management ofgroundwater and surface-water resources, there is highdemand for improvements to regional hydrologic modelscovering areas on the order of 104 km2 or greater. Amongvarious water cycle characteristics, groundwater rechargeis the leading hydrologic parameter determining ground-water resources availability and sustainability. Ground-water recharge is generally not directly measured, butrather inferred from more easily measurable physical andchemical parameters, often with the help of models withvarying complexity (Crosbie et al. 2010a, b). Methods ofestimating groundwater recharge are broadly categorizedas water-budget methods, modeling methods, physicalmethods involving saturated and unsaturated zones, andtracer techniques involving chemical, isotopic, and heattracers (Healy 2010). In spite of the variety of theavailable techniques, precise recharge estimation is diffi-cult because of high levels of uncertainty associated withmost estimation methods (Scanlon et al. 2002).
Determining spatially explicit recharge rates for modelcells on the scale of ∼1 km2 is a current challenge forimproving regional hydrologic models. In most cases,obtaining field-based estimates for each model cell wouldbe prohibitively expensive. As a result, methods whichintegrate remote sensing for recharge estimation at thesescales have generated recent interest (Brunner et al. 2004,2007). The water-balance approach which formulatesrecharge as the difference in precipitation (P) as well asthe sum of surface/subsurface runoff and evapotranspira-tion (ET)—averaged over a suitably long period to makechanges in storage negligible—is amenable for suchapplications. ET can typically be inferred from remotesensing while precipitation data are available from
Received: 9 February 2011 /Accepted: 11 July 2011
* Springer-Verlag 2011
Electronic supplementary material The online version of thisarticle (doi:10.1007/s10040-011-0769-3) contains supplementarymaterial, which is available to authorized users.
J. Szilagyi : J. JozsaDepartment of Hydraulic and Water Resources Engineering,Budapest University of Technology and Economics,Muegyetem Rakpart. 3–9, 1111 Budapest, Hungary
J. Szilagyi ())School of Natural Resources,University of Nebraska-Lincoln,3310 Holdrege Street HH625, Lincoln, NE 68583( USAe-mail: [email protected]
V. A. Zlotnik : J. B. GatesDepartment of Earth and Atmospheric Sciences,University of Nebraska-Lincoln,214 Bessey Hall, Lincoln, NE 68588-0340( USA
Hydrogeology Journal DOI 10.1007/s10040-011-0769-3
numerous weather stations. However, limitations on theaccuracy of P and ET may lead to significant errors thatpropagate to recharge rates when the latter is estimated asthe difference between P and ET. This is an inherentproblem in semi-arid or arid climates when P and ET areof similar magnitude. For example, in the Badain JaranDesert in China, the difference between P and ET is on theorder of 1% of P (Yang et al. 2010).
Any spatial field of recharge-rate values derived fromremote-sensing data is generally considered to beunreliable unless it is compared with field-basedestimates that can provide “ground truth” (Brunner etal. 2007). Without field-based verifications, remote-sensing estimates may yield erroneous flux rates evenwhen they contain valid information on spatial patternsand relative spatial distributions. However, the field-work required for verification is the most resource-intensive component of the analysis and often unfea-sible over large areas (Brunner et al. 2004, 2007).Furthermore, different methods integrate differing arealscales, making direct comparisons between field-basedand remote-sensing-based estimates a challenge. Never-theless, it is advantageous to apply multiple methods forestimating recharge where possible because of the largeuncertainties associated with current recharge estimationmethodologies. Although estimates from multiple meth-ods may not quantitatively reduce uncertainty (Healy2010), their application may provide insight into hydro-logical and morphological recharge patterns, measure-ment errors, and validity of assumptions.
The objectives of this study are to (1) assess the spatialdistribution of recharge in the Nebraska Sand Hills (NSH)within the High Plains, USA, at ∼1 km2 spatial resolutionwith the help of a novel ET estimation approach, and; (2)compare the results with alternative techniques availableat different spatial scales. The comparison of results withmultiple techniques of varying spatial scales is not yetcommon practice in groundwater recharge studies, and iscertainly the first such investigation in the NSH. Thecomparison of remote-sensing-derived ET rates include(1) baseflow/streamflow analysis, utilizing observedstreamflow data at the catchment scale (i.e., at the NorthLoup, Middle Loup and Dismal River watersheds; 5,823,4,694, and 5,331 km2, respectively); (2) a groundwaterchloride mass-balance approach applied at the subcatch-ment (plot) scale (∼100 m2), and; (3) calibration of aregional groundwater model (Middle Loup and DismalRiver watersheds) using observed water-table elevationsand streamflow.
Study area
The Sand Hills region of Nebraska (Fig. 1) is the largestgrass-covered sand dune area in the western hemisphere.Due to its permeable soil and considerable saturatedthickness—150–250 m (Bleed and Flowerday 1989)—ithas long been regarded as one of the most importantgroundwater-recharge areas for the Ogallala aquifer, a vital
source of water for irrigated agriculture in the central USmaking Nebraska the leading state in irrigated area (8.5million ha) and irrigation-water consumption. The climatein the NSH is continental, with a mean annual temperatureof about 10°C, and annual precipitation of 533 mm. Thereis a significant precipitation gradient from east to westacross the Sand Hills, the eastern-most part receiving morethan 700 mm, while the western-most only about 400 mm,annually (Fig. 2). Due to high hydraulic conductivity ofthe sandy soils (Wang et al. 2009), surface runoff isminimal; therefore, the streams in the NSH are predom-inantly fed by groundwater baseflow and, thus, maintain afairly steady flow system throughout the year (Bleed andFlowerday 1989). Szilagyi et al. (2003) estimated thatbaseflow may exceed 95% of the total annual flow incertain streams of the NSH, and stays above 90% overallfor the streams of the region.
The Sand Hills, due to its negligible surface runoff,and rolling topography is ideally suited to utilize thevadose-zone water-balance approach for estimatingmean annual recharge rates as the difference in P andET over a suitably chosen spatial resolution andsufficiently long period so that the change in soilmoisture becomes negligible in comparison with thecumulative fluxes across the surface. The spatialresolution must be larger than the characteristichorizontal dimension of the sand dunes in order toallow the infiltrated water to reach the saturated zonein the same cell after escaping the root zone of thevegetation.
Methods
Remote sensing for estimation of ETand groundwater rechargeMean annual recharge is estimated as the difference in Pand ET rates of individual moderate resolution imagingspectroradiometer (MODIS) cells. MODIS data have beencollected for over a decade at a nominal spatial resolutionof about 1 km2. Using MODIS daytime surface temper-ature (Ts) and ancillary climate data, ET at ∼1-km2
resolution was mapped for Nebraska by Szilagyi et al.(2011). For the mapping the 8-day composite MODISdaytime surface temperature data for 2000–2009 wereaveraged for each month to obtain one surface temperatureper pixel per month. Mean annual precipitation (notrequired for the ET mapping), mean monthly maximum/minimum air and dew-point temperature values weredownloaded from the PRISM database (Prism ClimateGroup 2004) at 2.5-min spatial resolution. Mean monthlyincident global radiation data at half-degree resolutionwere obtained from the GCIP/SRB site (NOAA 2009).The ETestimate results from a linear transformation of themonthly mean Ts value of each MODIS cell with the helpof the ancillary climate data (for a detailed description ofthe ET estimation method see Szilagyi et al. 2011).
Because accuracy of the ET values is so critical in theestimation of recharge rates, the original mean annual ET
Hydrogeology Journal DOI 10.1007/s10040-011-0769-3
values for the Sand Hills were corrected by multi-yearenergy balance Bowen ratio (EBBR) data measured nearthe center of the Sand Hills, over three differing hydro-logic settings: wet meadow, dry meadow, and dune top atthe Gudmundsen Research Facility (see Fig. 1). Based oncomparisons of the corresponding pixel ET rates, Szilagyiet al. (2011) reported a 7.6% overestimation (by the
MODIS-based method) of the site-averaged mean annualEBBR values. Figure 3 displays the corrected (the originalpixel values multiplied by 0.93) map ET values, whichwere used subsequently for the estimation of the spatiallydistributed mean annual recharge rates. The precipitationfield values of PRISM were accepted as best availableestimates.
Fig. 1 Location of the Sand Hills of Nebraska and the site (G Gudmundsen Ranch) where multiyear field measurements (Energy BalanceBowen-Ratio, EBBR) of evapotranspiration (ET) are available. The thin lines are county boundaries
Fig. 2 Period averaged (2000–2009) mean annual precipitation (P) rates (mm) in the Sand Hills
Hydrogeology Journal DOI 10.1007/s10040-011-0769-3
The present estimation of the mean annual rechargerates necessarily assumes no significant long-term trendsin soil moisture. The water-table elevations have notchanged significantly at the NSH over the study period(Korus and Burbach 2009) which indirectly supports thisassumption.
Chloride mass balanceA steady-state chloride (Cl) mass-balance recharge estima-tion was performed for the NSH based on publicallyavailable data on groundwater ion concentrations from theNational Water Quality Assessment (NAQWA) Program(USGS 2009) and on atmospheric wet deposition from theNational Atmospheric Deposition Program (State Agricul-tural Experimental Stations (2010). Recharge (R) is esti-mated as R=P · CP/CR where CP is dry deposition-adjustedCl concentration in precipitation, and CR is Cl concentrationin the groundwater. The method assumes that Cl concen-trations in groundwater are dominantly affected by atmos-pheric sources (Gates et al. 2008), which appears to be areasonable assumption for the NSH because there are noknown subsurface sources of chloride to shallow ground-water and there are minimal anthropogenic impacts ongroundwater chemistry. Cattle feedlot operations and refluxof saline lake water to shallow groundwater may occur insome areas but related impacts on groundwater Cl are likelyto be limited to the local scale.
By extracting all NAQWA entries for groundwaterbetween 2002 and 2004, a total of 32 different sites withinthe NSH was obtained. One outlier was discarded fromthis data set because of abnormally high Cl concentration(33 mg/L) in a shallow well sample (30 m). Wetdeposition was estimated using monitoring data from the
nearest NADP station (North Platte Agricultural Experi-ment Station: N 41.0592; W –100.7464; elevation 919 mabove sea level (asl); data period of 1985–2009; mean=0.35±0.11 kg/ha). Dry deposition data for the NSH are notcurrently available. The common assumption that the drydeposition rate for Cl is approximately equal to the wetdeposition rate, based on 36Cl/Cl studies from the southernHigh Plains (Scanlon and Goldsmith 1997), was applied.
Baseflow/streamflow-based recharge estimationBecause streamflow in the NSH is predominantly baseflow(therefore the NSH rivers practically never flood), a catch-ment-representative bulk recharge value can, in theory, beestimated as the ratio of observed mean annual streamdischarge and the corresponding groundwater drainage area.The resulting estimates, however, may be laden withrelatively large errors (the extent of which is unknown inthe NSH) due to uncertainties in the contributing ground-water drainage area value, as discussed in the following.
Results
Error range of recharge estimatesThe semi-arid climate of a large portion (the western side) ofthe study area necessarily increases the error range for water-balance recharge estimation. The error range can be obtainedby elementary quantitative uncertainty analysis. Annualaverage precipitation is obtained with 5% accuracy at best(Groisman and Legates 1994). Szilagyi et al. (2011),applying the present ET-mapping technique in Hungary,which has similar climatic conditions as the NSH, obtaineda ∼5% accuracy for the mean annual ET estimates over a
Fig. 3 Period averaged (2000–2009) and EBBR-corrected mean annual ET rates (mm) in the Sand Hills
Hydrogeology Journal DOI 10.1007/s10040-011-0769-3
very wide range of spatial scales (plot scale to the size of thecountry: 93,000 km2). The accuracy was shown to beabout 5–10% in Nebraska (Szilagyi et al. 2011), basedon comparison with multi-year eddy-covariance andenergy-balance Bowen-ratio measurements. In the cur-rent analysis, a 5% error in the precipitation (due to therelatively flat topography of the NSH and low contri-bution of snow toward the annual water balance),together with a 10% error in the ET variables isassumed, which, when occurring independently, maylead to a 15% error in the P minus ET value.Considering that ET in the Sand Hills is between 85–90% of precipitation at most locations (see the follow-ing), the water-balance method leads to a ±90–135%error in the resulting recharge estimate. (The plus/minusvalues in the following sections always denote the errorbounds of the specified variable rather than the standarddeviation of its spatially distributed values). It isimportant to note that this range of uncertainty is notunusual for recharge estimations including field-basedestimates. Considering the cost-effectiveness and largespatial scale of the MODIS-based method, this level ofuncertainty should be acceptable for many applicationsincluding regional hydrologic modeling.
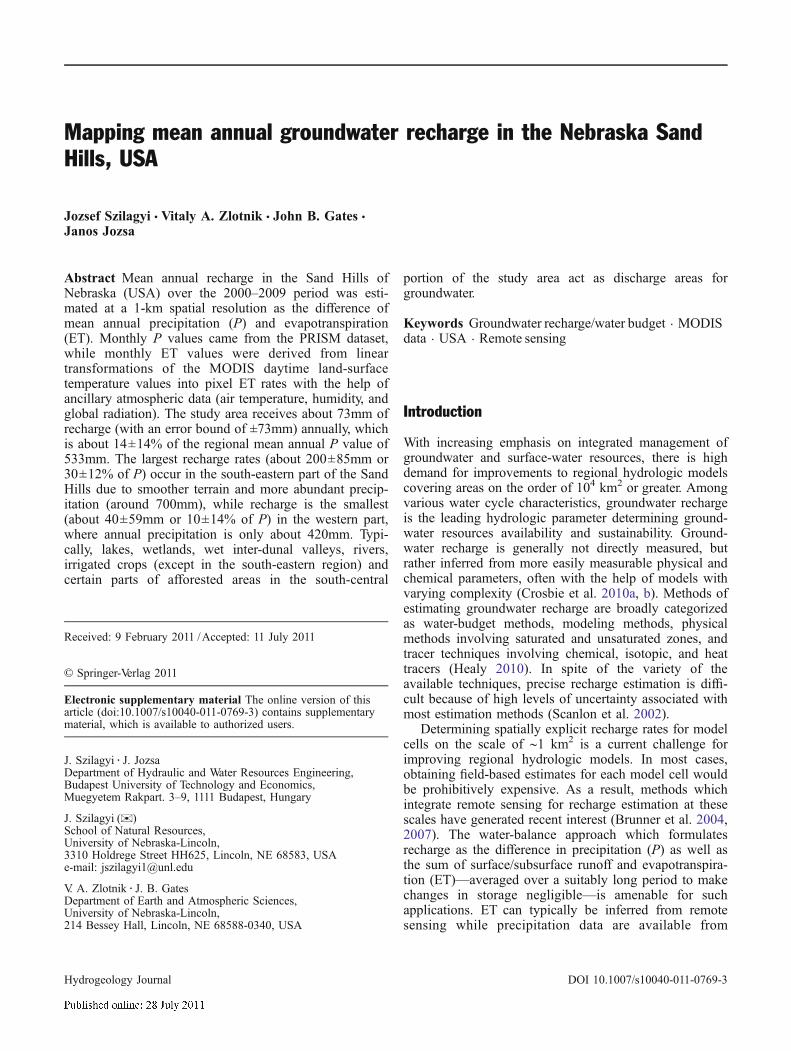
Spatial distribution of recharge ratesSpatially distributed recharge rates are displayed in Fig. 4.The high ET areas in the western and north-central part ofthe study area (Fig. 3) and the accompanying largegroundwater-discharge rates (negative recharge values)mostly correspond to shallow inter-dunal lakes, wetlands
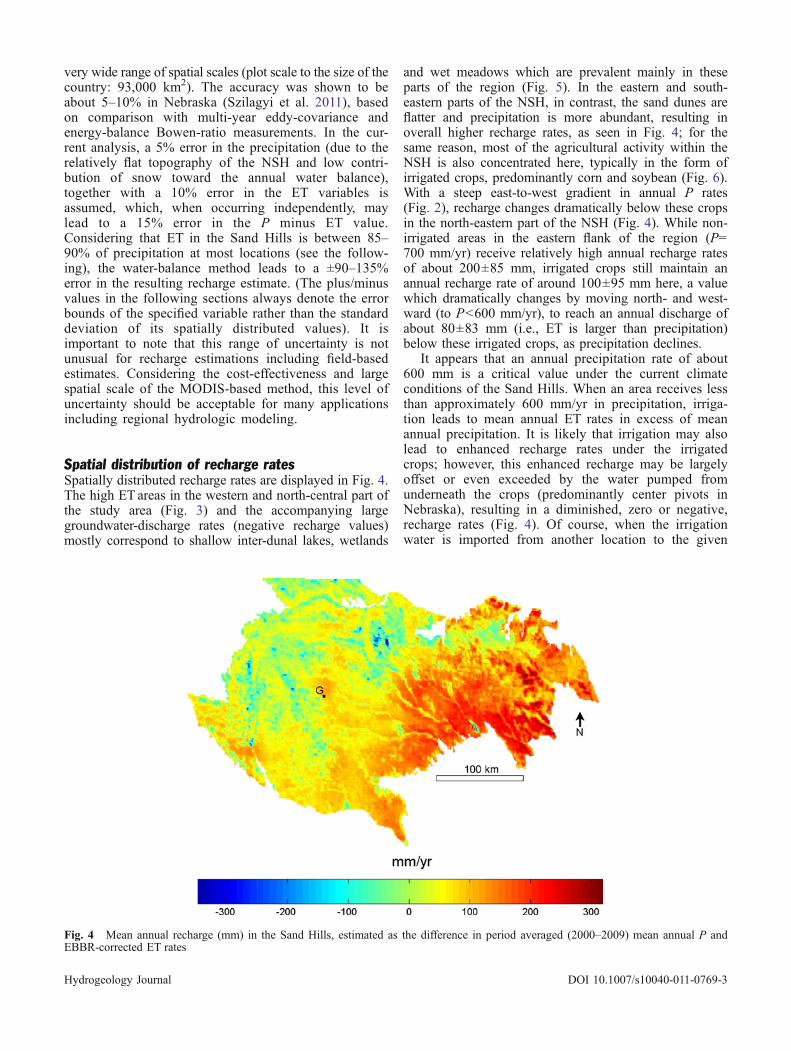
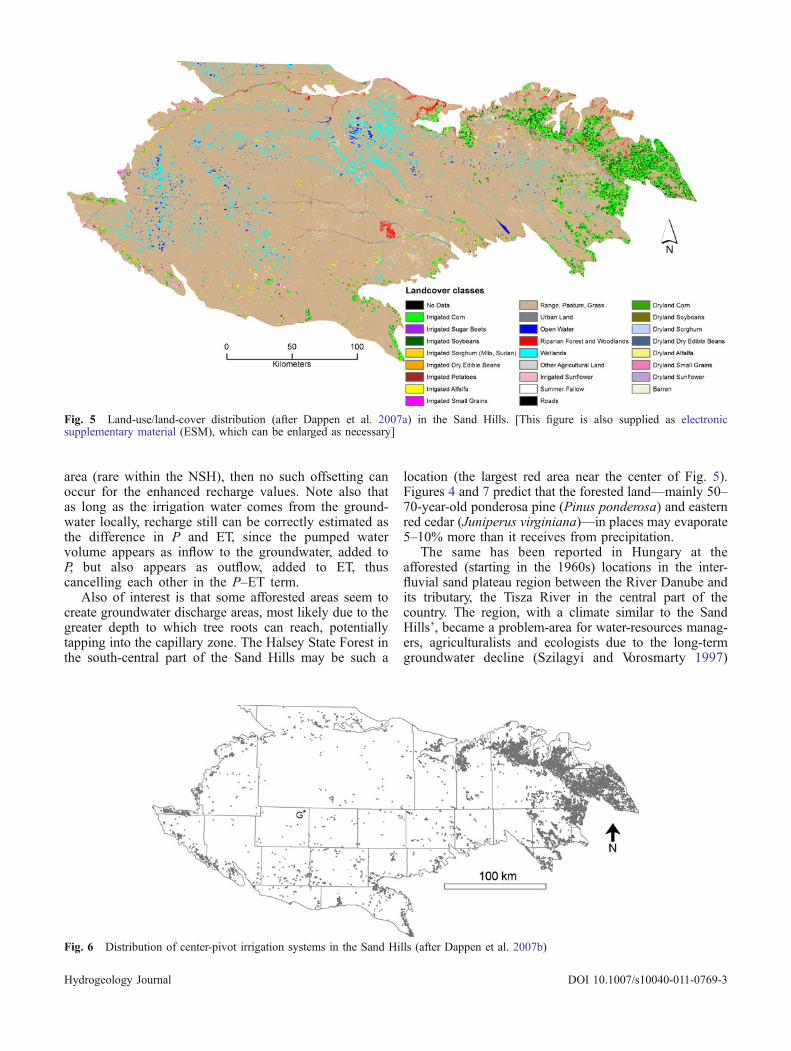
and wet meadows which are prevalent mainly in theseparts of the region (Fig. 5). In the eastern and south-eastern parts of the NSH, in contrast, the sand dunes areflatter and precipitation is more abundant, resulting inoverall higher recharge rates, as seen in Fig. 4; for thesame reason, most of the agricultural activity within theNSH is also concentrated here, typically in the form ofirrigated crops, predominantly corn and soybean (Fig. 6).With a steep east-to-west gradient in annual P rates(Fig. 2), recharge changes dramatically below these cropsin the north-eastern part of the NSH (Fig. 4). While non-irrigated areas in the eastern flank of the region (P=700 mm/yr) receive relatively high annual recharge ratesof about 200±85 mm, irrigated crops still maintain anannual recharge rate of around 100±95 mm here, a valuewhich dramatically changes by moving north- and west-ward (to P<600 mm/yr), to reach an annual discharge ofabout 80±83 mm (i.e., ET is larger than precipitation)below these irrigated crops, as precipitation declines.
It appears that an annual precipitation rate of about600 mm is a critical value under the current climateconditions of the Sand Hills. When an area receives lessthan approximately 600 mm/yr in precipitation, irriga-tion leads to mean annual ET rates in excess of meanannual precipitation. It is likely that irrigation may alsolead to enhanced recharge rates under the irrigatedcrops; however, this enhanced recharge may be largelyoffset or even exceeded by the water pumped fromunderneath the crops (predominantly center pivots inNebraska), resulting in a diminished, zero or negative,recharge rates (Fig. 4). Of course, when the irrigationwater is imported from another location to the given
Fig. 4 Mean annual recharge (mm) in the Sand Hills, estimated as the difference in period averaged (2000–2009) mean annual P andEBBR-corrected ET rates
Hydrogeology Journal DOI 10.1007/s10040-011-0769-3
area (rare within the NSH), then no such offsetting canoccur for the enhanced recharge values. Note also thatas long as the irrigation water comes from the ground-water locally, recharge still can be correctly estimated asthe difference in P and ET, since the pumped watervolume appears as inflow to the groundwater, added toP, but also appears as outflow, added to ET, thuscancelling each other in the P–ET term.
Also of interest is that some afforested areas seem tocreate groundwater discharge areas, most likely due to thegreater depth to which tree roots can reach, potentiallytapping into the capillary zone. The Halsey State Forest inthe south-central part of the Sand Hills may be such a
location (the largest red area near the center of Fig. 5).Figures 4 and 7 predict that the forested land—mainly 50–70-year-old ponderosa pine (Pinus ponderosa) and easternred cedar (Juniperus virginiana)—in places may evaporate5–10% more than it receives from precipitation.
The same has been reported in Hungary at theafforested (starting in the 1960s) locations in the inter-fluvial sand plateau region between the River Danube andits tributary, the Tisza River in the central part of thecountry. The region, with a climate similar to the SandHills’, became a problem-area for water-resources manag-ers, agriculturalists and ecologists due to the long-termgroundwater decline (Szilagyi and Vorosmarty 1997)
Fig. 5 Land-use/land-cover distribution (after Dappen et al. 2007a) in the Sand Hills. [This figure is also supplied as electronicsupplementary material (ESM), which can be enlarged as necessary]
Fig. 6 Distribution of center-pivot irrigation systems in the Sand Hills (after Dappen et al. 2007b)
Hydrogeology Journal DOI 10.1007/s10040-011-0769-3
identified between 1970 and 1995. The MODIS-derivedET map there also predicts that some afforested areasevaporate more than the precipitation rate they receive(Szilagyi et al. 2011). Having a groundwater ridge underthe sand plateau, this is only possible if the forests create adepression in the water table, thus inducing local ground-water flow directed toward them which then supplies thedifference in ET and precipitation. In fact, this has beenreported by Major (1976, in Stelczer 2000) in Hungarywho found that under a young forest in the region thewater table was on average 1 m deeper than in thesurrounding non-forested areas. He calculated a meanannual ET rate of 712 mm for an actively growing blackspruce community covering an area of 500×500 m. Onaverage, the forest consumed 130 mm more water annuallythan it received from precipitation. Mapped ET rates(Szilagyi et al. 2011) match these findings, yielding620 mm annual ET for several forested locations in the area(this value may go up to 650 mm in certain pixels), which isabout 80 mm more than the mean annual precipitation rate(540 mm) of the region. The elevated ET rates of theseforests had earlier been pointed out by Szilagyi andVorosmarty (1997) employing a complex regional, coupledsurface-water/groundwater balance model. It is for futureresearch (under planning) to verify whether the same indeedhappens in the Sand Hills, as Figs. 4 and 7 predict, sincegeneralized regional groundwater maps give a considerablylarger depth to water (> 15 m) in the NSH than the observed2–10 m in Hungary (Szilagyi and Vorosmarty 1997). Also,an Australian-wide study found negligible groundwater useby vegetation when depth to groundwater exceeded 6 m(O’Grady et al. 2010).
Recharge is typically the smallest (about 40±59 mm or10±14% of P) in the western part of the NSH, whereannual precipitation is only about 420 mm. The river
valleys in general show up as low net recharge areas (thelinear features in Figs. 4 and 7), because the water table istypically closer to the surface here than elsewhere, awayfrom the valleys, enabling the vegetation to use additionalwater (Wang et al. 2007; Maxwell and Kollet 2008).
Intercomparison of recharge estimates
Baseflow/streamflow analysis and groundwater flowmodelingEmploying streamflow measurements for baseflow sepa-ration with additional regional ET estimates plus ETestimates for small lakes and phreatophyte-vegetatedareas, Szilagyi et al. (2003, 2005) derived a mean annualrecharge rate of 48 mm (or about 9% of P for 1961–1990)for the NSH. This estimate is 34% lower than the currentMODIS-based recharge rate of 73±73 mm (or about 14±14% of P, see Fig. 7) obtained by spatial averaging of thepixel values over the study area. The main reason for thepresent estimate being higher (disregarding the differencein study periods) than the baseflow-based estimate is thatSzilagyi et al. (2003, 2005) employed an uncorrectedregional ET value—resulting from the same method thatprovides the basis for the present spatially distributed ETrates—because field measurements of ET within the SandHills were not yet available. The uncorrected regional ETvalue relied on a scattered climate-station grid for therequired atmospheric variables where none of the climatestations fell within the NSH, except for precipitationgauges. Rather than employing only streamflow measure-ments with the corresponding drainage areas, Szilagyi etal. (2003, 2005) derived recharge as the differencebetween P and ET for the following reasons: (1) published
Fig. 7 Mean annual recharge to precipitation ratio (−) in the Sand Hills
Hydrogeology Journal DOI 10.1007/s10040-011-0769-3
drainage area values were found to vary by source; (2) ingroundwater-dominated watersheds of a relatively flatterrain, the drainage area obtainable by a digital elevationmodel is of little relevance and may differ significantlyfrom the drainage area derived from a groundwaterelevation map; (3) groundwater elevation maps forextended areas are often generalized and thus not the bestsuited for drainage area delineations; (4) not all of therecharged water that escapes groundwater ET in the NSHwill necessarily show up as streamflow within the region
because some groundwater will leave the region via theregional groundwater flow system (mainly from west toeast; Bleed and Flowerday 1989).
The present MODIS-based recharge rates, nonethe-less, agree well (except for the Middle Loup River)with findings by Clover (1972) who used stream flow-rate and drainage area values and by Chen and Chen(2004) who calibrated the recharge rates of theirregional groundwater model to match observed ground-water elevations and stream flow-rates for watersheds
Table 1 Mean annual recharge rates, R (mm/yr), in the NSH by chloride mass balance
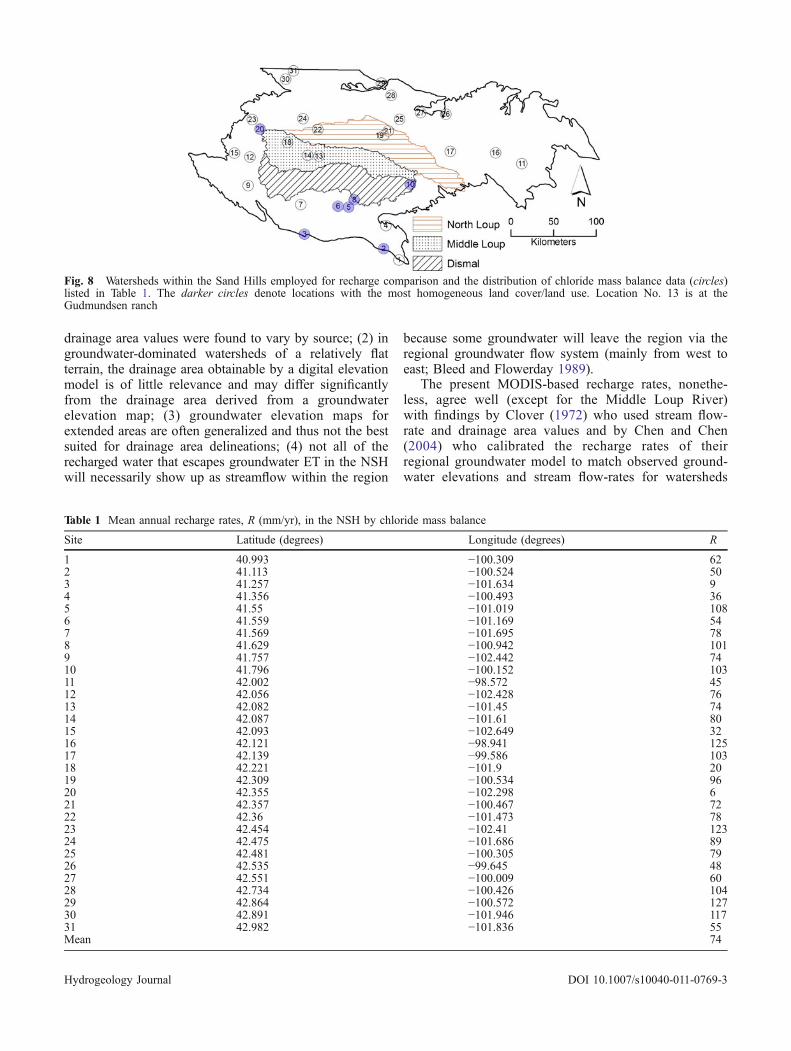
Fig. 8 Watersheds within the Sand Hills employed for recharge comparison and the distribution of chloride mass balance data (circles)listed in Table 1. The darker circles denote locations with the most homogeneous land cover/land use. Location No. 13 is at theGudmundsen ranch
Hydrogeology Journal DOI 10.1007/s10040-011-0769-3
completely within the Sand Hills. Both Clover (1972) andChen and Chen (2004) reported an estimated overall meanannual recharge rate of 13% of P for the Middle Loup (P=486 mm/yr) and Dismal Rivers (P=506 mm/yr, Fig. 8).Employing US Geological Survey published (water.usgs.gov) drainage areas and long-term stream discharge rates,and assuming that measured streamflow is predominantlybaseflow, the corresponding recharge rates (79 and 56 mm)become 16 and 11% of P, while the present estimates (43±69and 61±70 mm) are 9±14% and 12±14% of P, respectively.For the North Loup River (P=535 mm/yr), streamflow datayield a mean annual recharge rate of 71 mm, or 13% of P,compared with a 75±73 mm value, or 14±14% of P by thecurrent method. The average mean annual recharge rate forthe three adjacent watersheds (Fig. 8) becomes 69 mm, or13% of P (= 506 mm/yr) from streamflow data versus the65±69 mm value, or 13±14% of P from the ET map.
Cl-based estimationChloride-based groundwater recharge estimates were per-formed at locations shown in Fig. 8 (listed in Table 1). Thearithmetic mean (equaling the spatially weighted meanemploying an inverse distance method and rounded to thenearest integer) of these recharge estimates is 74 mm/yr(almost identical to the MODIS-derived spatial average of73 mm/yr) with a standard deviation of 33 mm/yr.
The assessment of spatial relationships betweenMODIS and chloride-based recharge estimates is hindered
by differences in model assumption and area representa-tions. In contrast to the MODIS recharge location (whichis always the entire MODIS cell) the chloride massbalance location information (Table 1) represents thedischarge location (e.g. well location) rather than theactual recharge location. In the absence of detailedinformation on groundwater flow paths, it is not possibleto attribute a given recharge rate estimate based on
Fig. 9 Regression plot of chloride mass balance and remotelysensed mean annual recharge rates for the seven most homogeneouslocations. Rxy is the cross-correlation coefficient Fig. 11 GoogleEarth image of the surroundings of well No. 2
where the largest difference in estimated recharge rates among themost homogeneous sites is found
Fig. 10 Land-cover distribution (after Dappen et al. 2007a) in a 1-km radius around site No. 2 in Table 1. The partial square denotesthe MODIS cell that contains well No. 2
Fig. 12 Land surface and vegetation around well No. 2. Lookingat the (1) land within the MODIS cell in Fig. 10, and; (2) immediatevicinity of the well
Hydrogeology Journal DOI 10.1007/s10040-011-0769-3
groundwater tracers to a particular recharge area. This is acommon problem in tracer research requiring furthergroundwater flow modeling to address. Unsaturated zonechloride mass balance circumvents this complicationbecause flow is often effectively one-dimensional, butsufficient unsaturated-zone chloride data is unavailable inthis case. Also, in contrast to the MODIS-based rechargeestimate, the chloride mass-balance method does notaccount for groundwater discharge. Therefore in ground-water discharge areas it is possible to have a positiverecharge rate estimate from chloride mass balance and anegative recharge rate estimate from the MODIS-basedmethod. Another source for recharge-rate differences maycome from inhomogeneity within the MODIS cell. If, forexample, the well is located near a lake or an irrigatedcrop and the corresponding MODIS cell contains the lake/irrigated crop, the resulting MODIS-derived recharge ratemay be depressed due to the high ET rates of the lake/irrigated crop, while the Cl-based estimate remainsunaffected.
For these reasons, it is not surprising that the Cl-based recharge estimates from the locations in Table 1do not correlate with the corresponding MODIS-cell ETrates. However, a further, more direct comparisonbetween the two methods is attempted by utilizingland-use/land-cover data (Dappen et al. 2007a) to selectwell locations with relatively homogeneous land cover/land use (indicated in darker circles in Fig. 8). Theselection was performed by defining a 1-km radiusbuffer zone around the well locations as the area withinwhich a MODIS cell may still contain the well and theactual recharge zone of the well may most likely befound. Overlaying the land-use/land-cover data with thebuffer zones, the locations with the most homogeneousland cover/land use were selected by visual inspectionof each well buffer zone.
Aweak positive correlation between MODIS-based andchloride-based recharge estimates is found (Rxy=0.57) inthis more homogeneous subset of the landscape (Fig. 9).Across these sites, Cl-data yields a mean recharge rate of62 mm/yr with a standard deviation (σ) of 44 mm/yr,while the MODIS-based method gives 79 (σ=37) mm/yr.
From Fig. 9 it is obvious that there are still largedifferences in the two types of estimated recharge rates.Figure 10 displays the land-use/land-cover distribution(Dappen et al. 2007a) of the site (well No. 2 in Table 1 andthe southern-most dark circle in Fig. 8) with the largestdifference in recharge rates (126 vs. 50 mm/yr). As seen,the dominant land-cover type is grass with smallerpercentages of forests and wetlands. The distribution ofland-cover types is similar inside the correspondingMODIS cell (the box in Fig. 10), but without thepresence of wetlands. More detailed imagery (fromGoogleEarth in Fig. 11, and field photographs inFig. 12a and b) indicates even stronger heterogeneityincluding buildings, large number of trees and cropfields. The larger-than-mean value of the MODIS-derived recharge estimate is most likely to be explainedby (1) the above average precipitation rate of the site
(20 mm/yr over the NSH mean), and; (2) flatter thanaverage topography leading to the absence of inter-dunal lakes (Fig. 5), which, due to their enhancedevaporations, depress the regional recharge rate. On theother hand, the lower-than-mean value of the Cl-basedestimate can be explained if the actual recharge area isclose to the well location (the well is in a localdepression of the land) where the tree and cropvegetation may result in locally low recharge rates.Alternatively, an anthropogenic Cl source (road salting inwinter) in the vicinity (the well is close to an asphalt road, seeFig. 11) would negatively bias—i.e., depress—the Cl-basedrecharge estimate.
Conclusions
This study demonstrates the application of a water-balancerecharge estimation technique based on MODIS andancillary climate data in the Nebraska Sand Hills region.Mean annual recharge rate estimates based on this methodare consistent with independent estimates based on base-flow/streamflow, groundwater modeling and chloride massbalance (the latter over the most homogeneous welllocations, with one exception; well No. 2 in Table 1)given their uncertainty ranges. The MODIS-based methodmay be applicable for estimating spatially distributedmean annual recharge rates in sandy areas of the worldwhere basic climate data (precipitation, air temperatureand humidity, global radiation or sunshine duration) fromthe year 2000 and on (the temporal coverage of theMODIS data) are available. The advantages of the methodis that it (1) provides spatially varying values without anykind of interpolation, thus the effect of land-use and/orvegetation-cover distribution to recharge rates becomesidentifiable; (2) requires only typically easily accessibleremotely sensed and standard climate data (without theneed of any land-use or vegetation-related information),and; (3) is self-calibrating, thus eliminating the need forany (often cumbersome and site specific) parameteroptimization. The uncertainty level of the resultingrecharge-rate estimates can be easily defined from knownor estimated levels of inaccuracy in the P and ETvariables. The associated error bounds in the rechargeestimates may be significant in arid and semi-arid regionswhere a large portion of the precipitation is evaporated/transpirated. Such uncertainty is considered acceptable formany problems in view of the current state of uncertaintyassociated with other recharge estimation techniques.
Future efforts should be directed towards augmentingthe currently available recharge estimates with multi-method point measurements (e.g., vadose-zone chloridemass balance) in this agriculturally important area of theHigh Plains, USA. Towards this goal, quantity and densityof measurement points should be defined with consider-ation of environmental factors likely to affect rechargerates including topography, sediment structure, vegetationcover and climate. The spatial variability found in the
Hydrogeology Journal DOI 10.1007/s10040-011-0769-3
recharge maps of the current study will allow for a betterprioritization of the point-based measurement locations.
Acknowledgements This work has been supported by the Hungar-ian Scientific Research Fund (OTKA, No. 77364), the AgriculturalResearch Division of the University of Nebraska, and the NationalScience Foundation (ER-0609982SF). This work is connected to thescientific program of the “Development of quality-oriented andharmonized R+D+I strategy and functional model at BME” project.This project is supported by the New Szechenyi Plan (Project ID:TAMOP-4.2.1/B-09/1/KMR-2010-0002). The authors would like tothank Dave Billesbach from UNL for the EBBR data in the SandHills. We also thank the Associate Editor and the three anonymousreviewers whose suggestions led to significant improvements of theoriginal manuscript. The WREVAP FORTRAN code, with thecorresponding documentation, can be downloaded from the per-sonal website of JS (snr.unl.edu/szilagyi/szilagyi.htm).
Disclaimer. The views, conclusions, and opinions expressed inthis study are solely those of the writers and not the University ofNebraska, state of Nebraska, or any political subdivision thereof.
References
Bleed A, Flowerday C (eds) (1989) An atlas of the Sand Hills.Conservation and Survey Division, University of Nebraska,Lincoln, NB
Brunner P, Bauer P, Eugster M, Kinzelbach W (2004) Using remotesensing to regionalize local precipitation recharge rates obtainedfrom the chloride method. J Hydrol 294(4):241–250
Brunner P, Hendricks-Franssen HJ, Kgotlhang L, Bauer-Gottwein P,Kinzelbach W (2007) How can remote sensing contribute ingroundwater modeling? Hydrogeol J 15(1):5–18
Chen X, Chen X (2004) Simulating the effects of reducedprecipitation on groundwater and streamflow in the NebraskaSand Hills. J Water Resour Assoc 40(2):419–430
Clover RE (1972) Deep percolation in a Sand Hills area. J WaterResour Assoc 8(2):399–400
Crosbie RS, Jolly ID, Leaney FW, Petheram C (2010a) Can thedataset of field based recharge estimates in Australia be used topredict recharge in data-poor areas? Hydrol Earth System Sci14:2023–2038. doi:10.5194/hess-14-2023-2010
Crosbie RS, McCallum JL, Walker GR, Chiew FHS (2010b) Modellingclimate-change impacts on groundwater recharge in the Murray-Darling Basin, Australia. Hydrogeol J 18(7):1639–1656
Dappen P, Ratcliffe I, Robbins C, Merchant J (2007a) Map of 2005land use of Nebraska. Center for Advanced Land ManagementInformation Technologies, University of Nebraska, Lincoln,NB. http://www.calmit.unl.edu/2005landuse/statewide.shtml.Cited 12 October 2010
Dappen P, Ratcliffe I, Robbins C, Merchant J (2007b) Map of 2005center pivots of Nebraska. Center for Advanced LandManagementInformation Technologies, University of Nebraska, Lincoln, NB.http://www.calmit.unl.edu/2005landuse/statewide.shtml. Cited 12October 2010
Gates JB, Edmunds WM, Ma J, Scanlon BR (2008) Estimatinggroundwater recharge in a cold desert environment in northernChina using chloride. Hydrogeol J 16:893–910
Groisman PY, Legates DR (1994) The accuracy of United Statesprecipitation data. Bull Am Meteorol Soc 75:215–227
Korus J, Burbach M (2009) Groundwater-level changes inNebraska, predevelopment to spring 2009. Conservation andSurvey Division, Institute of Agricultural and NaturalResources, University of Nebraska, Lincoln, NB. http://snr.unl.edu/data/water/groundwatermaps.asp. Cited 12 October2010
Major P (1976) Groundwater balance investigations in flat lands (inHungarian). In: Piezometer readings, vol 2. VITUKI report,VITUKI, Budapest
Maxwell RM, Kollet SJ (2008) Interdependence of groundwaterdynamics and land-energy feedbacks under climate change.Nature Geosci 1(10):665–669. doi:10.1038/ngeo315
National Oceanographic and Atmospheric Administration (NOAA)(2009) Surface radiation budget data. http://www.atmos.umd.edu/∼srb/gcip/cgi-bin/historic.cgi. Cited 25 June 2011
O’Grady A, Carter J, Holland K (2010) Review of Australiangroundwater discharge studies of terrestrial systems. CSIRO:Water for a Healthy Country National Research Flagship,Adelaide, Australia, 60 pp
State Agricultural Experimental Stations (SAES) (2010) NationalAtmospheric Deposition Program. http://nadp.sws.uiuc.edu.Cited 25 June 2011
Stelczer K (2000) Hydrological bases of water resources management(in Hungarian). ELTE Eotvos Kiado, Budapest, Hungary
Szilagyi J, Vorosmarty C (1997) Water-balance modeling in achanging environment: reductions in unconfined aquifer levelsin the area between the Danube and Tisza rivers in Hungary. JHydrol Hydromech 45:348–364
Szilagyi J, Harvey EF, Ayers J (2003) Regional estimation of baserecharge to ground water using water balance and a base-flowindex. Ground Water 41(4):504–513
Szilagyi J, Harvey FE, Ayers J (2005) Regional estimation of totalrecharge to ground water in Nebraska. Ground Water 43(1):63–69
Szilagyi J, Kovacs A, Jozsa J (2011) A calibration-free evapotrans-piration mapping (CREMAP) technique. In Labedzki L (ed)Evapotranspiration. InTech, Rijeka, Croatia,. Open access atwww.intechopen.com. Cited 25 June 2011
United States Geological Survey (USGS) (2009) National Water-Quality Assessment (NAWQA) Program. US Geological Survey,Reston, VA. http://water.usgs.gov/nawqa. Cited 25 June 2011
Wang T, Zlotnik VA, Wedin D, Wally KD (2007) Spatial trends insaturated hydraulic conductivity of vegetated dunes in theNebraska Sand Hills: effects of depth and topography. J Hydrol349:88–97. doi:10.1016/j.jhydrol.2007.10.027
Wang T, Zlotnik VA, Simunek J, Schaap M (2009) Using process-based models and pedotransfer functions for soil hydrauliccharacteristics to estimate groundwater recharge in semi-aridregions. Water Resour Res 45:W04412. doi:10.1029/2008WR006903
Yang X, Ma N, Dong J, Zhu B, Xu B, Ma Z, Liu J (2010) Rechargeto the inter-dune lakes and Holocene climatic changes in theBadain Jaran Desert, western China. Quat Res 73:10–19
Hydrogeology Journal DOI 10.1007/s10040-011-0769-3