MAPPING MUSIC IN THE PALM OF YOUR HAND, EXPLORE AND DISCOVER YOUR COLLECTION Rob van Gulik Fabio Vignoli Huub van de Wetering Technische Universiteit Eindhoven Den Dolech 2, 5600 MB, Eindhoven [email protected]Philips Research Laboratories, Prof. Holstlaan 4, 5656 AA, Eindhoven (NL) [email protected](corresponding author) Technische Universiteit Eindhoven Den Dolech 2, 5600 MB, Eindhoven [email protected]ABSTRACT The trends of miniaturization and increasing storage capabilities for portable music players made it possible to carry increasingly more music on small portable devices, but it also introduced negative consequences for the user interface and navigation. Finding music in large collections can be hard if one does not know exactly what to look for. In this paper a novel user interface to browse and navigate through music on small devices is proposed, together with the enabling algorithms. The goal of this interface is to enable the users to explore and discover their entire collection and to support non- specific searches. To this end, a new way to visualize and navigate through music is introduced: the artist map. The artist map is designed to provide an overview of an entire music collection, or a subset thereof, by clearly visualizing the similarity between artists, computed from the music itself. Contextual information (e.g. mood, genre) is added by coloring and by attribute magnets. The artist map is implemented by a graph-drawing algorithm, which uses an improved energy model. The proposed algorithm and interface have been implemented in a prototype and will be tested with real users. Keywords: Music, graphical user interface, similarity, navigation, non-specific search, music metadata 1. INTRODUCTION Advances in digital media and consumer electronics have made it possible to carry more and more music on small portable devices. From the introduction of the Walkman twenty-five years ago to the current portable hard disk players such as the Philips HDD100 or the Apple iPod, much progress has been made in the areas of sound quality, device functionality and the amount of storage available for your music. Although some of the first hard disk players were too large to fit in your pocket, the current generation of music players with a hard disk is even smaller than a Walkman. The trends of miniaturization and increasing storage capacity have, however, also negative consequences in particular for user interfaces (UI). Current user interfaces often have folder-based or hierarchical structures. Such structures limit the user to find specific items: an album, song or artist for example, provided that the hierarchy is known. When the user is confronted with a huge amount of digital music, finding the right music for e.g. an occasion or mood can be hard. Product innovations such as the iPod touch-wheel, or the super-scroll on the Philips HDD100 are focused on improving the access speed for list-based interfaces. Without doubt these solutions improve the ease of use, but unfortunately do not offer an overview of the music currently loaded on the device. When the users do not know, recall or recognize the name of a specific artist or song, it is difficult to find or to decide whether or not to play the unknown item. And as collections grow, the amount of unknown or forgotten music increases. As of consequence the users end up enjoying only a fraction of the music in their collection. In this paper a novel user interface to browse and navigate through music on small displays (about 10 cm diagonally) is proposed. The proposed solution attempts to tackle the issues raised above by going beyond the traditional directory structure. Our goal is to enable the users to explore and discover their entire music collection by providing an interactive map of the music to be used for browsing and navigation purposes. The paper is organized as follows: Section 2 gives a short overview of the related work in this field: we discuss how people organize their music and how they describe what they want to listen to, and we detail the requirements for our solution. In section 3, we describe the interface concept and in Section 4 our implementation. In Section 5, the proposed user interface is described in more detail. Section 6 contains the conclusions as well as some directions for future research. 2. RELATED WORK The way people organize their digital music collection is often influenced by the way they organize their CD collection. In general people use catalogue metadata: artist-name, song-name and album-name, when available. Although these metadata are often the only ones used in music players such as Windows MediaPlayer [1] or MusicMatch [2], people tend to use entirely different terms and expressions to describe the music they want to hear [3]. These descriptions are Permission to make digital or hard copies of all or part of this work for personal or classroom use is granted without fee provided that copies are not made or distributed for profit or commercial advantage and that copies bear this notice and the full citation on the first page. ' 2004 Universitat Pompeu Fabra.
Transcript
MAPPING MUSIC IN THE PALM OF YOUR HAND, EXPLORE AND DISCOVER YOUR COLLECTION
Rob van Gulik Fabio Vignoli Huub van de Wetering Technische Universiteit Eindhoven
The trends of miniaturization and increasing storage capabilities for portable music players made it possible to carry increasingly more music on small portable devices, but it also introduced negative consequences for the user interface and navigation. Finding music in large collections can be hard if one does not know exactly what to look for. In this paper a novel user interface to browse and navigate through music on small devices is proposed, together with the enabling algorithms. The goal of this interface is to enable the users to explore and discover their entire collection and to support non-specific searches. To this end, a new way to visualize and navigate through music is introduced: the artist map. The artist map is designed to provide an overview of an entire music collection, or a subset thereof, by clearly visualizing the similarity between artists, computed from the music itself. Contextual information (e.g. mood,genre) is added by coloring and by attribute magnets. The artist map is implemented by a graph-drawing algorithm, which uses an improved energy model. The proposed algorithm and interface have been implemented in a prototype and will be tested with ‘real’ users.
Keywords: Music, graphical user interface, similarity, navigation, non-specific search, music metadata
1. INTRODUCTION
Advances in digital media and consumer electronics have made it possible to carry more and more music on small portable devices. From the introduction of the Walkman twenty-five years ago to the current portable hard disk players such as the Philips HDD100 or the Apple iPod, much progress has been made in the areas of sound quality, device functionality and the amount of storage available for your music. Although some of the first hard disk players were too large to fit in your pocket, the current generation of music players with a hard disk is even smaller than a Walkman. The trends of miniaturization and increasing storage capacity have, however, also negative consequences in particular for user interfaces (UI).
Current user interfaces often have folder-based or hierarchical structures. Such structures limit the user to find specific items: an album, song or artist for example, provided that the hierarchy is known. When the user is confronted with a huge amount of digital music, finding the ‘right’ music for e.g. an occasion or mood can be hard. Product innovations such as the iPod touch-wheel, or the super-scroll on the Philips HDD100 are focused on improving the access speed for list-based interfaces. Without doubt these solutions improve the ease of use, but unfortunately do not offer an overview of the music currently loaded on the device. When the users do not know, recall or recognize the name of a specific artist or song, it is difficult to find – or to decide whether or not to play the unknown item. And as collections grow, the amount of unknown or forgotten music increases. As of consequence the users end up enjoying only a fraction of the music in their collection.
In this paper a novel user interface to browse and navigate through music on small displays (about 10 cm diagonally) is proposed. The proposed solution attempts to tackle the issues raised above by going beyond the traditional directory structure. Our goal is to enable the users to explore and discover their entire music collection by providing an interactive map of the music to be used for browsing and navigation purposes. The paper is organized as follows: Section 2 gives a short overview of the related work in this field: we discuss how people organize their music and how they describe what they want to listen to, and we detail the requirements for our solution. In section 3, we describe the interface concept and in Section 4 our implementation. In Section 5, the proposed user interface is described in more detail. Section 6 contains the conclusions as well as some directions for future research.
2. RELATED WORK
The way people organize their digital music collection is often influenced by the way they organize their CD collection. In general people use catalogue metadata: artist-name, song-name and album-name, when available. Although these metadata are often the only ones used in music players such as Windows MediaPlayer [1] or MusicMatch [2], people tend to use entirely different terms and expressions to describe the music they want to hear [3]. These descriptions are
Permission to make digital or hard copies of all or part of this work for personal or classroom use is granted without fee provided that copies are not made or distributed for profit or commercial advantage and that copies bear this notice and the full citation on the first page.
mostly related to the style, the mood and the genre of the music, or the situation at hand. Some examples of such music descriptions are “Calm music”, “Happy music”, “Music for a romantic evening”. Other user studies [4] show that people need and like the possibility of using other ways of organizing and browsing their music collections. When confronted with a whole range of features and concepts for music organization and browsing, the participants expressed their interest about the concepts of similarity between songs and between artists.
Navigation through music collections is traditionally accomplished by using folder-based hierarchical structures based on genre/artist/album. Maintaining such a structure is difficult, because for every item that is added to the device, either the user has to specify where to place it, or catalogue metadata is required (tagged to the music file for example) to determine the position automatically. Also, a folder-based structure is only efficient when users want to search for specific artists or songs but does not support them very well when the desires are not specific. The concept of music similarity as well as the personal and vague descriptions about the style, mood and tempo are thus not well suited to use in a list-based user interface. As the size of the average music collection increases, new ways to find desired music in a less specific way are needed.
Few attempts to provide visual landscape of music collection are known in literature. Pampalk and others [5] describe an approach to explore music collections based on a modified self-organizing map trained to cluster similar music, Tzanetakis and Cook [6] propose an audio browser-editor for large wall displays, Brazil and Fernström describe the Sonic Browser [7] which uses sonic spatialization to navigate music collections, and finally Cano and others [8] describe a multidimensional scaling algorithm to visualize songs on the basis of their similarity. While many of these systems make use of large screens, the literature is mostly concerned with text and images for small displays and not much has been published on music navigation and browsing. In this paper we propose an interface tailored to small displays that supports non-specific searches, or browsing.
3. THE ARTIST MAP
To be able to use similarity and music attributes as an integral part of a graphical user interface, we introduce the artist map. The artist map is a visualization of a music collection to be used on a small screen, and is designed to allow and support non-specific music searches. The artist map makes use of both metadata and
Attributes Values moods Upbeat, Happy, Romantic,
Mellow, Sentimental, Sad, Brooding, aggressive
genres Popular, Rock, Americana, Alternative, Soul/r+b/rap,
Dance/lounge, Dutch Music
Table 1: moods and genres used for the experiments (moods are manually labeled using information obtained from MoodLogic, genres are manually labeled)
features. The metadata such as artist, album and song names and publication year can be obtained from web-services and features, such as tempo and texture (spectral information) of songs can be computed directly from the music itself. In our experiments we used also attributes such as mood and genre that can be obtained from music classification as described in [9] and [10;11] or from services such as MoodLogic [12]. The specific moods and genres used for the experiments are reported in Table 1. The choice of these moods and genres is arbitrary but does not influence the conclusions, any other choice is equally right or wrong.
The artist map aims at visualizing a music collection in such a way that:
• A clear overview of an entire music collection or a subset thereof can be given;
• Similarity between artists is used and clearly depicted;
• The attributes mood, genre, year and tempo label important positions on the map in order to provide context;
• Navigation of a, possibly unknown, music collection is supported by non-specific or fuzzy criteria
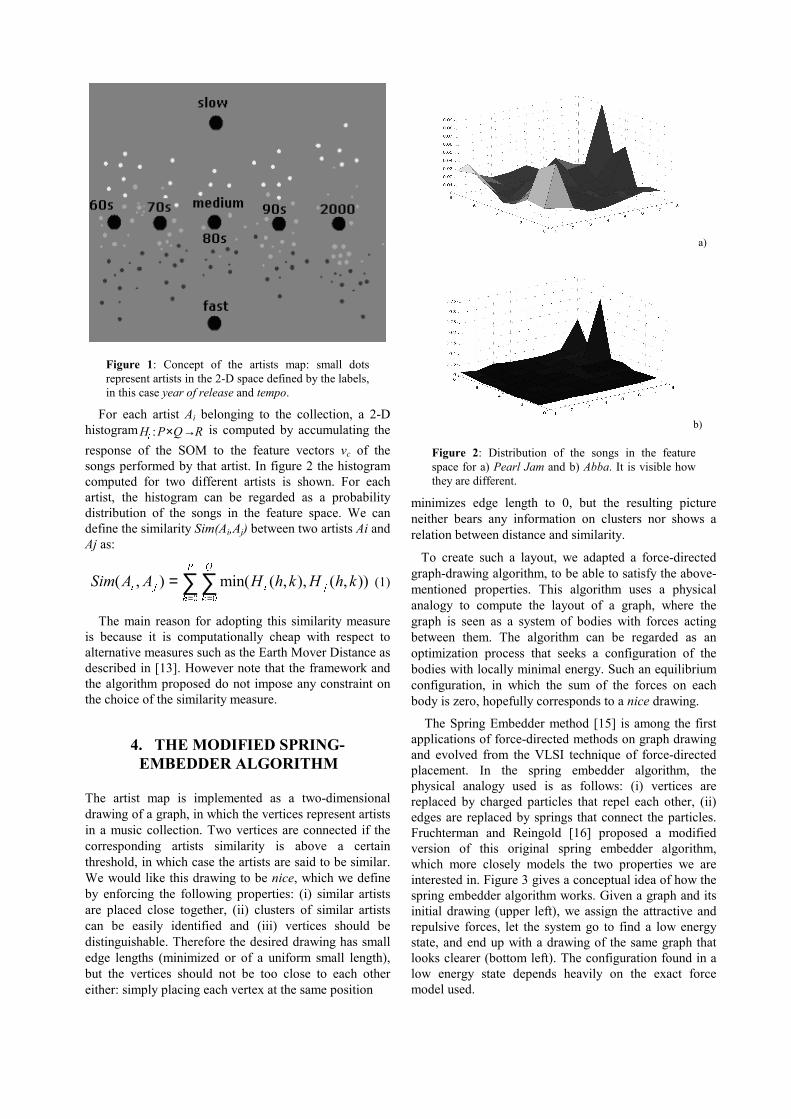
Figure 1 shows a sketch of the interface concept. In the map, artists are clustered together if they are similar, while colors and higher level positioning (which is labeled) show attribute information for the type of music they make. In this case, year and tempo are chosen to be the relevant attributes, and labels are used to show five different year ranges and three different tempi.
The artist map is defined on top of the artist similarity. We define the similarity of two artists based on the features extracted from their songs. We used the following method, analogous to that described in [13]. The similarity is defined for each couple of artists. Each song in the collection is processed to obtain feature vectors vc. In our experiments we used features computed as described in [11] which show good discrimination properties, although “standard” Mel-Frequency Cepstrum Coefficients (MFCCs) could also have been employed. The vc are “whitened” and used to train a P×QSelf-Organizing map (SOM) [14].
Figure 1: Concept of the artists map: small dots represent artists in the 2-D space defined by the labels, in this case year of release and tempo.
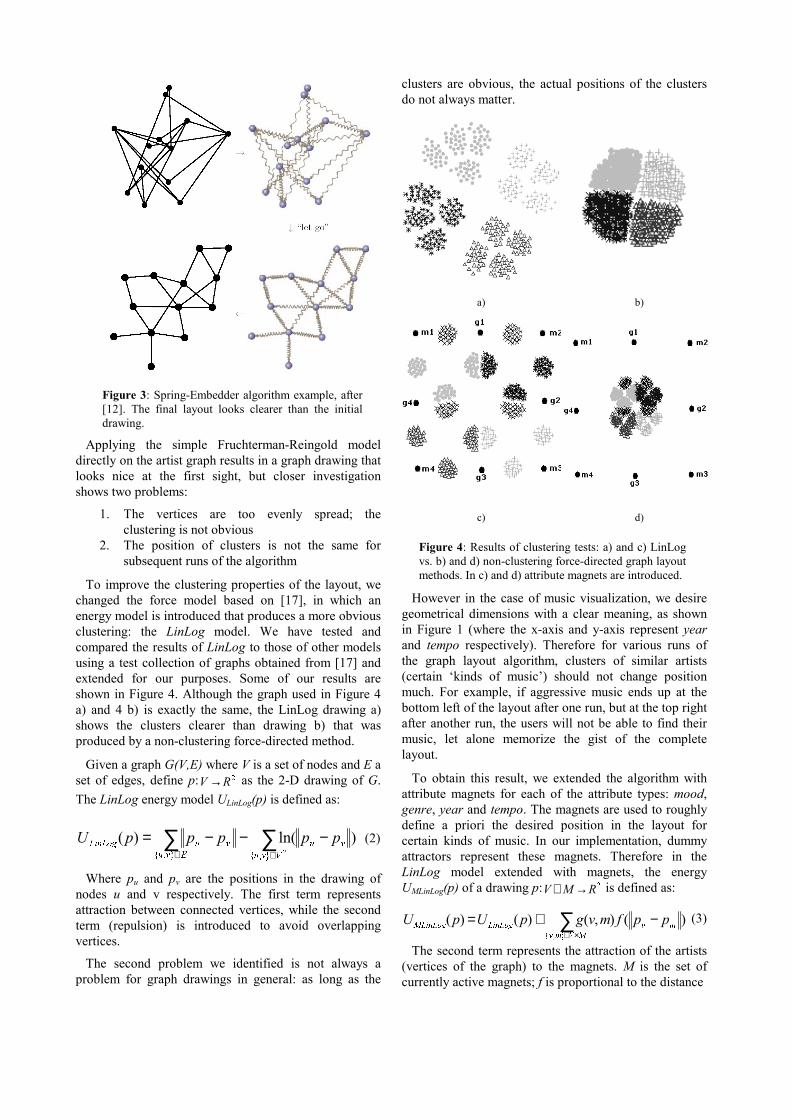
For each artist Ai belonging to the collection, a 2-D histogram RQPHL →×: is computed by accumulating the response of the SOM to the feature vectors vc of the songs performed by that artist. In figure 2 the histogram computed for two different artists is shown. For each artist, the histogram can be regarded as a probability distribution of the songs in the feature space. We can define the similarity Sim(Ai,Aj) between two artists Ai and Aj as:
)),(),,(min(),(� �
∑∑= =
=3
K
4
NMLML khHkhHAASim (1)
The main reason for adopting this similarity measure is because it is computationally cheap with respect to alternative measures such as the Earth Mover Distance as described in [13]. However note that the framework and the algorithm proposed do not impose any constraint on the choice of the similarity measure.
4. THE MODIFIED SPRING-EMBEDDER ALGORITHM
The artist map is implemented as a two-dimensional drawing of a graph, in which the vertices represent artists in a music collection. Two vertices are connected if the corresponding artists similarity is above a certain threshold, in which case the artists are said to be similar. We would like this drawing to be nice, which we define by enforcing the following properties: (i) similar artists are placed close together, (ii) clusters of similar artists can be easily identified and (iii) vertices should be distinguishable. Therefore the desired drawing has small edge lengths (minimized or of a uniform small length), but the vertices should not be too close to each other either: simply placing each vertex at the same position
a)
b)
Figure 2: Distribution of the songs in the feature space for a) Pearl Jam and b) Abba. It is visible how they are different.
minimizes edge length to 0, but the resulting picture neither bears any information on clusters nor shows a relation between distance and similarity.
To create such a layout, we adapted a force-directed graph-drawing algorithm, to be able to satisfy the above-mentioned properties. This algorithm uses a physical analogy to compute the layout of a graph, where the graph is seen as a system of bodies with forces acting between them. The algorithm can be regarded as an optimization process that seeks a configuration of the bodies with locally minimal energy. Such an equilibrium configuration, in which the sum of the forces on each body is zero, hopefully corresponds to a nice drawing.
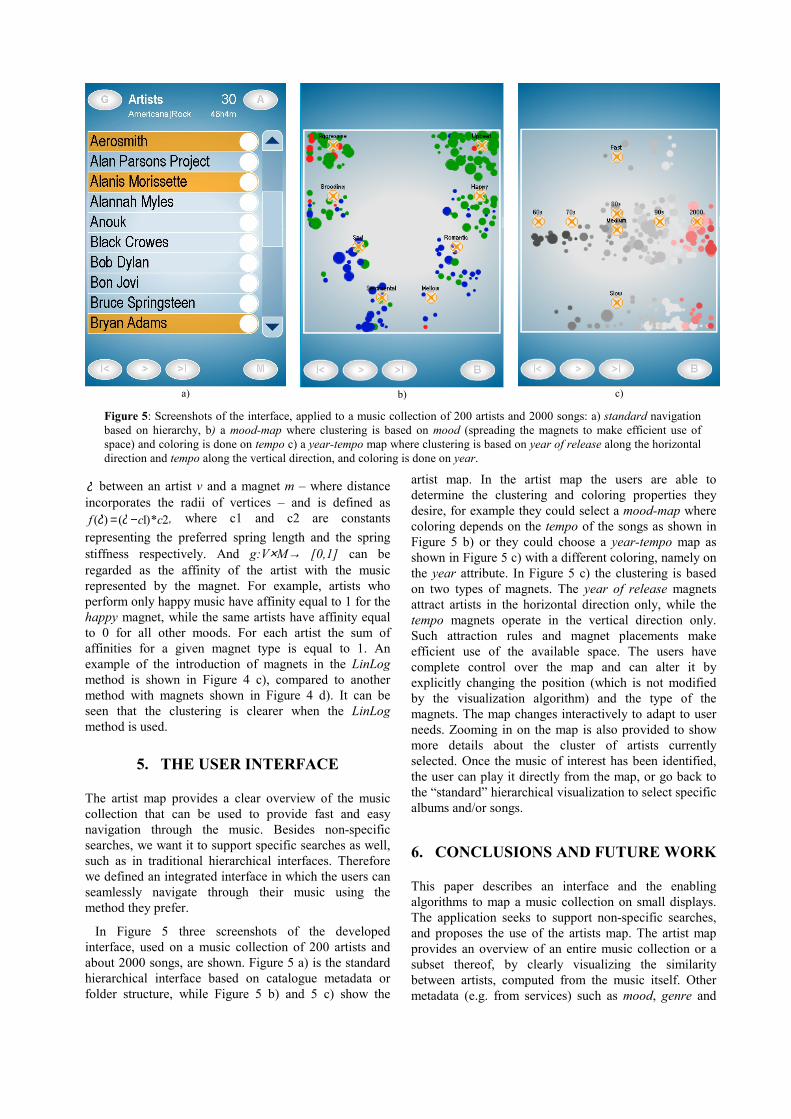
The Spring Embedder method [15] is among the first applications of force-directed methods on graph drawing and evolved from the VLSI technique of force-directed placement. In the spring embedder algorithm, the physical analogy used is as follows: (i) vertices are replaced by charged particles that repel each other, (ii) edges are replaced by springs that connect the particles. Fruchterman and Reingold [16] proposed a modified version of this original spring embedder algorithm, which more closely models the two properties we are interested in. Figure 3 gives a conceptual idea of how the spring embedder algorithm works. Given a graph and its initial drawing (upper left), we assign the attractive and repulsive forces, let the system go to find a low energy state, and end up with a drawing of the same graph that looks clearer (bottom left). The configuration found in a low energy state depends heavily on the exact force model used.
Figure 3: Spring-Embedder algorithm example, after [12]. The final layout looks clearer than the initial drawing.
Applying the simple Fruchterman-Reingold model directly on the artist graph results in a graph drawing that looks nice at the first sight, but closer investigation shows two problems:
1. The vertices are too evenly spread; the clustering is not obvious
2. The position of clusters is not the same for subsequent runs of the algorithm
To improve the clustering properties of the layout, we changed the force model based on [17], in which an energy model is introduced that produces a more obvious clustering: the LinLog model. We have tested and compared the results of LinLog to those of other models using a test collection of graphs obtained from [17] and extended for our purposes. Some of our results are shown in Figure 4. Although the graph used in Figure 4 a) and 4 b) is exactly the same, the LinLog drawing a) shows the clusters clearer than drawing b) that was produced by a non-clustering force-directed method.
Given a graph G(V,E) where V is a set of nodes and E aset of edges, define p: �RV → as the 2-D drawing of G.The LinLog energy model ULinLog(p) is defined as:
)ln()(�`�^`�^
YX9YX(YX
YX/LQ/RJ pppppU −−−= ∑∑∈∈
(2)
Where pu and pv are the positions in the drawing of nodes u and v respectively. The first term represents attraction between connected vertices, while the second term (repulsion) is introduced to avoid overlapping vertices.
The second problem we identified is not always a problem for graph drawings in general: as long as the
clusters are obvious, the actual positions of the clusters do not always matter.
a) b)
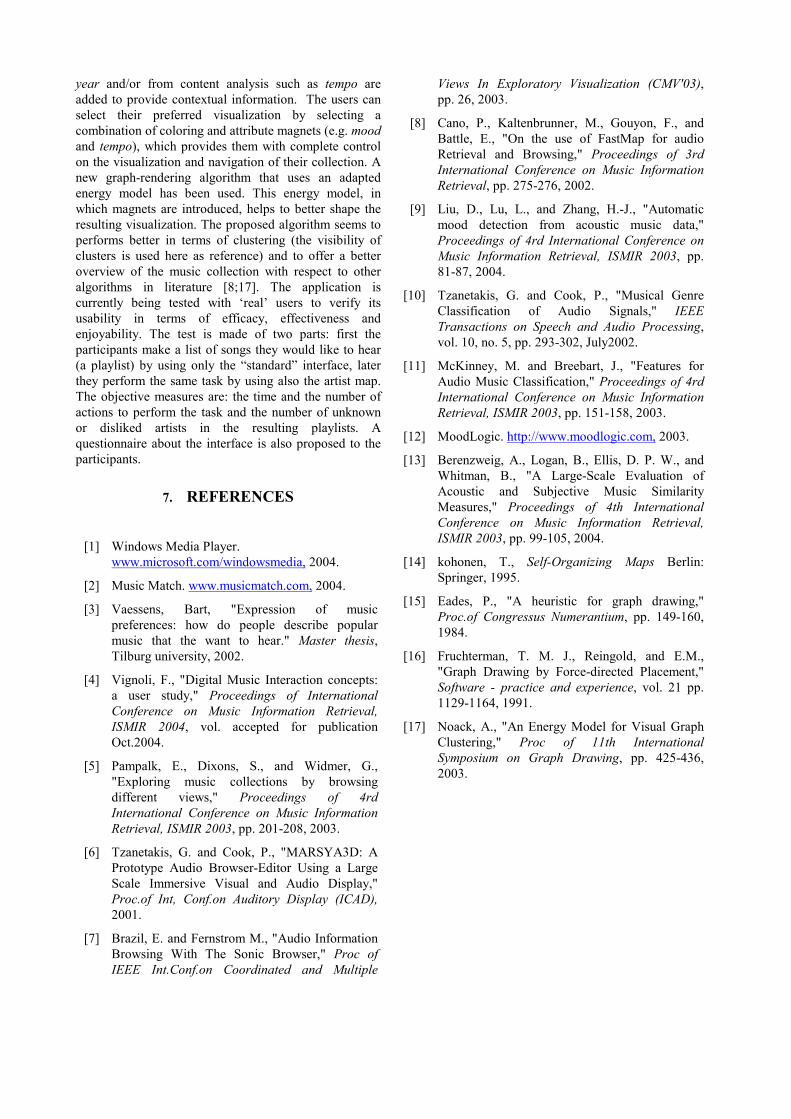
c) d)
Figure 4: Results of clustering tests: a) and c) LinLog vs. b) and d) non-clustering force-directed graph layout methods. In c) and d) attribute magnets are introduced.
However in the case of music visualization, we desire geometrical dimensions with a clear meaning, as shown in Figure 1 (where the x-axis and y-axis represent year and tempo respectively). Therefore for various runs of the graph layout algorithm, clusters of similar artists (certain ‘kinds of music’) should not change position much. For example, if aggressive music ends up at the bottom left of the layout after one run, but at the top right after another run, the users will not be able to find their music, let alone memorize the gist of the complete layout.
To obtain this result, we extended the algorithm with attribute magnets for each of the attribute types: mood,genre, year and tempo. The magnets are used to roughly define a priori the desired position in the layout for certain kinds of music. In our implementation, dummy attractors represent these magnets. Therefore in the LinLog model extended with magnets, the energy UMLinLog(p) of a drawing p: �RMV →∪ is defined as:
∑×∈
−+=09PY
PY/LQ/RJ0/LQ/RJ ppfmvgpUpU`�^
)(),()()( (3)
The second term represents the attraction of the artists (vertices of the graph) to the magnets. M is the set of currently active magnets; f is proportional to the distance
δ between an artist v and a magnet m – where distance incorporates the radii of vertices – and is defined as
2*)1()( ccf −= δδ , where c1 and c2 are constants representing the preferred spring length and the spring stiffness respectively. And g:V×M→ [0,1] can be regarded as the affinity of the artist with the music represented by the magnet. For example, artists who perform only happy music have affinity equal to 1 for the happy magnet, while the same artists have affinity equal to 0 for all other moods. For each artist the sum of affinities for a given magnet type is equal to 1. An example of the introduction of magnets in the LinLog method is shown in Figure 4 c), compared to another method with magnets shown in Figure 4 d). It can be seen that the clustering is clearer when the LinLog method is used.
5. THE USER INTERFACE
The artist map provides a clear overview of the music collection that can be used to provide fast and easy navigation through the music. Besides non-specific searches, we want it to support specific searches as well, such as in traditional hierarchical interfaces. Therefore we defined an integrated interface in which the users can seamlessly navigate through their music using the method they prefer.
In Figure 5 three screenshots of the developed interface, used on a music collection of 200 artists and about 2000 songs, are shown. Figure 5 a) is the standard hierarchical interface based on catalogue metadata or folder structure, while Figure 5 b) and 5 c) show the
artist map. In the artist map the users are able to determine the clustering and coloring properties they desire, for example they could select a mood-map where coloring depends on the tempo of the songs as shown in Figure 5 b) or they could choose a year-tempo map as shown in Figure 5 c) with a different coloring, namely on the year attribute. In Figure 5 c) the clustering is based on two types of magnets. The year of release magnets attract artists in the horizontal direction only, while the tempo magnets operate in the vertical direction only. Such attraction rules and magnet placements make efficient use of the available space. The users have complete control over the map and can alter it by explicitly changing the position (which is not modified by the visualization algorithm) and the type of the magnets. The map changes interactively to adapt to user needs. Zooming in on the map is also provided to show more details about the cluster of artists currently selected. Once the music of interest has been identified, the user can play it directly from the map, or go back to the “standard” hierarchical visualization to select specific albums and/or songs.
6. CONCLUSIONS AND FUTURE WORK
This paper describes an interface and the enabling algorithms to map a music collection on small displays. The application seeks to support non-specific searches, and proposes the use of the artists map. The artist map provides an overview of an entire music collection or a subset thereof, by clearly visualizing the similarity between artists, computed from the music itself. Other metadata (e.g. from services) such as mood, genre and
a)
b)
c)
Figure 5: Screenshots of the interface, applied to a music collection of 200 artists and 2000 songs: a) standard navigation based on hierarchy, b) a mood-map where clustering is based on mood (spreading the magnets to make efficient use of space) and coloring is done on tempo c) a year-tempo map where clustering is based on year of release along the horizontal direction and tempo along the vertical direction, and coloring is done on year.
year and/or from content analysis such as tempo are added to provide contextual information. The users can select their preferred visualization by selecting a combination of coloring and attribute magnets (e.g. mood and tempo), which provides them with complete control on the visualization and navigation of their collection. A new graph-rendering algorithm that uses an adapted energy model has been used. This energy model, in which magnets are introduced, helps to better shape the resulting visualization. The proposed algorithm seems to performs better in terms of clustering (the visibility of clusters is used here as reference) and to offer a better overview of the music collection with respect to other algorithms in literature [8;17]. The application is currently being tested with ‘real’ users to verify its usability in terms of efficacy, effectiveness and enjoyability. The test is made of two parts: first the participants make a list of songs they would like to hear (a playlist) by using only the “standard” interface, later they perform the same task by using also the artist map. The objective measures are: the time and the number of actions to perform the task and the number of unknown or disliked artists in the resulting playlists. A questionnaire about the interface is also proposed to the participants.
7. REFERENCES
[1] Windows Media Player. www.microsoft.com/windowsmedia, 2004.
[2] Music Match. www.musicmatch.com, 2004.
[3] Vaessens, Bart, "Expression of music preferences: how do people describe popular music that the want to hear." Master thesis,Tilburg university, 2002.
[4] Vignoli, F., "Digital Music Interaction concepts: a user study," Proceedings of International Conference on Music Information Retrieval, ISMIR 2004, vol. accepted for publication Oct.2004.
[5] Pampalk, E., Dixons, S., and Widmer, G., "Exploring music collections by browsing different views," Proceedings of 4rd International Conference on Music Information Retrieval, ISMIR 2003, pp. 201-208, 2003.
[6] Tzanetakis, G. and Cook, P., "MARSYA3D: A Prototype Audio Browser-Editor Using a Large Scale Immersive Visual and Audio Display," Proc.of Int, Conf.on Auditory Display (ICAD), 2001.
[7] Brazil, E. and Fernstrom M., "Audio Information Browsing With The Sonic Browser," Proc of IEEE Int.Conf.on Coordinated and Multiple
Views In Exploratory Visualization (CMV'03),pp. 26, 2003.
[8] Cano, P., Kaltenbrunner, M., Gouyon, F., and Battle, E., "On the use of FastMap for audio Retrieval and Browsing," Proceedings of 3rd International Conference on Music Information Retrieval, pp. 275-276, 2002.
[9] Liu, D., Lu, L., and Zhang, H.-J., "Automatic mood detection from acoustic music data," Proceedings of 4rd International Conference on Music Information Retrieval, ISMIR 2003, pp. 81-87, 2004.
[10] Tzanetakis, G. and Cook, P., "Musical Genre Classification of Audio Signals," IEEE Transactions on Speech and Audio Processing,vol. 10, no. 5, pp. 293-302, July2002.
[11] McKinney, M. and Breebart, J., "Features for Audio Music Classification," Proceedings of 4rd International Conference on Music Information Retrieval, ISMIR 2003, pp. 151-158, 2003.
[12] MoodLogic. http://www.moodlogic.com, 2003.
[13] Berenzweig, A., Logan, B., Ellis, D. P. W., and Whitman, B., "A Large-Scale Evaluation of Acoustic and Subjective Music Similarity Measures," Proceedings of 4th International Conference on Music Information Retrieval, ISMIR 2003, pp. 99-105, 2004.
[15] Eades, P., "A heuristic for graph drawing," Proc.of Congressus Numerantium, pp. 149-160, 1984.
[16] Fruchterman, T. M. J., Reingold, and E.M., "Graph Drawing by Force-directed Placement," Software - practice and experience, vol. 21 pp. 1129-1164, 1991.
[17] Noack, A., "An Energy Model for Visual Graph Clustering," Proc of 11th International Symposium on Graph Drawing, pp. 425-436, 2003.