+ All Categories
Home > Documents > Mapping of Traffic Flows on Delhi Road Network using Trans CAD Presentation by Dr. K. Ravinder...

Mapping of Traffic Flows on Delhi Road Network using Trans CAD Presentation by Dr. K. Ravinder...

Date post: 18-Dec-2015
Category:
Upload: stephanie-lee
View: 215 times
Download: 0 times
Share this document with a friend
Popular Tags:
14
Mapping of Traffic Flows on Delhi Road Network using Trans CAD Presentation by Dr. K. Ravinder Scientist Transport Planning and Environment Central Road Research Institute (CRRI), New Delhi (CSIR, India) 21 st January, 2011
Transcript

Mapping of Traffic Flows on Delhi Road Network using Trans CAD

Mapping of Traffic Flows on Delhi Road Network using Trans CAD

Presentation by

Dr. K. RavinderScientist

Transport Planning and Environment Central Road Research Institute (CRRI), New Delhi

(CSIR, India)21st January, 2011

Presentation outlinePresentation outline

Background

Mapping of Traffic flows,

Methodology

Data Collection (Traffic Surveys /

Studies) Traffic Volume Counts

Mid-blocks, Intersections

Outer Cordon ( mid block surveys)

Traffic flows on various links
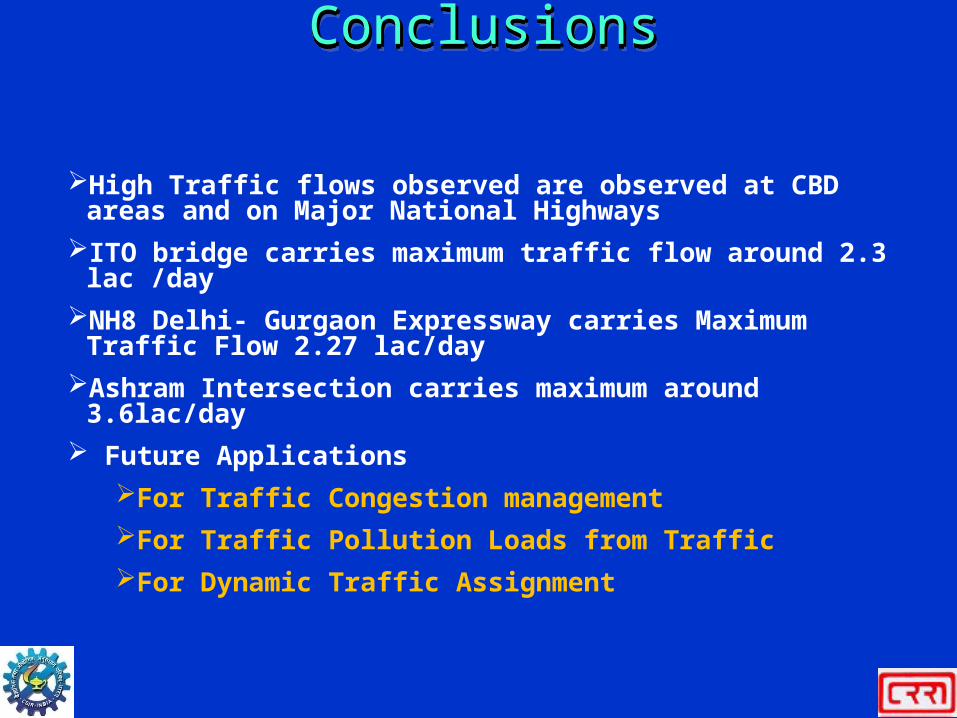
Conclusions

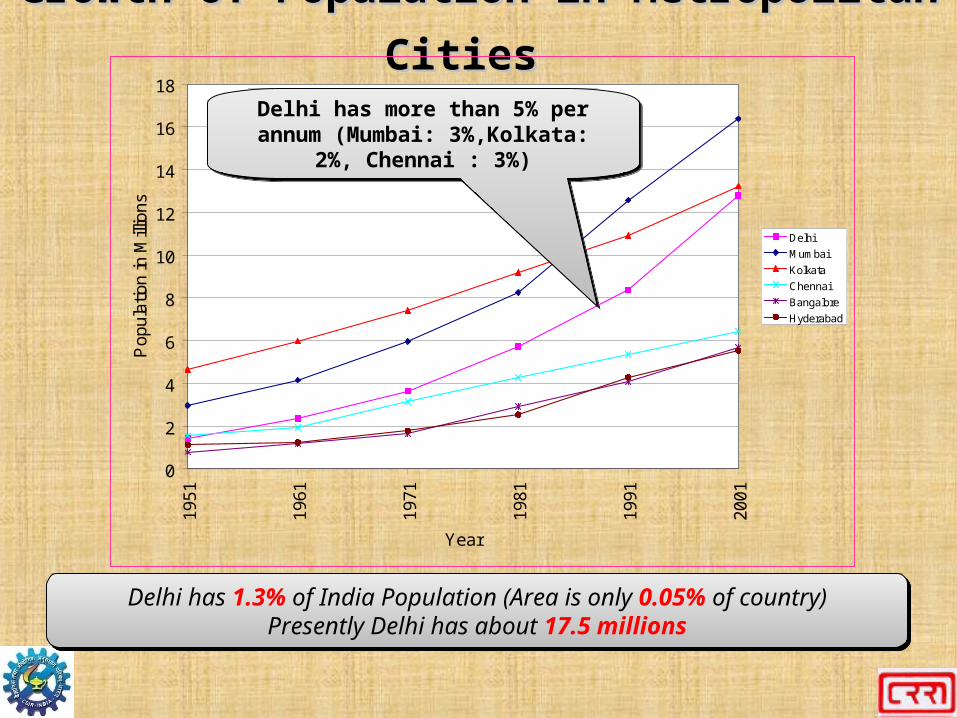
Growth of Population in Metropolitan Growth of Population in Metropolitan

CitiesCities

0

2

4

6

8

10

12

14

16

18

1951

1961

1971

1981

1991

2001

Year

Pop

ulat

ion

in M

illio

ns

Delhi

Mumbai

Kolkata

Chennai

Bangalore

Hyderabad

Delhi has 1.3% of India Population (Area is only 0.05% of country)Presently Delhi has about 17.5 millions

Delhi has 1.3% of India Population (Area is only 0.05% of country)Presently Delhi has about 17.5 millions

Delhi has more than 5% per annum (Mumbai: 3%,Kolkata: 2%, Chennai :

3%)

Delhi has more than 5% per annum (Mumbai: 3%,Kolkata: 2%, Chennai :

3%)

Growth Trend of Motor Vehicles in Four Mega CitiesGrowth Trend of Motor Vehicles in Four Mega Cities

0

500

1000

1500

2000

2500

3000

3500

4000

1985

1987

1989

1991

1993

1995

1997

1999

2001

YEAR

No.

of R

egis

tere

d V

ehic

les

(Tho

usan

ds)

IPTCarsTwo WheelersTotal

0

200

400

600

800

1000

1200

1985

1987

1989

1991

1993

1995

1997

1999

2001

YEAR

No.

of R

egis

tere

d V

ehic

les

(Tho

usan

ds)

IPTCarsTwo WheelersTotal

0

100

200

300

400

500

600

700

800

900

198

5

198

7

198

9

199

1

199

3

199

5

199

7

199

9

200

1

YEAR

No.

of R

egis

tere

d V

ehi

cles

(T

hou

sand

s)

IPTCarsTwo WheelersTotal

0

200

400

600

800

1000

1200

1400

1985

1987

1989

1991

1993

1995

1997

1999

2001

YEAR

No.

of R

egis

tere

d V

ehic

les

(Tho

usan

ds)

IPTCarsTwo WheelersTotal

KolkataKolkata ChennaiChennai

DelhiDelhi MumbaiMumbai

Vehicle Pop in Delhi > Veh Pop (Mumbai + Kolkata+ Chennai)In 2008, Delhi has about 5.63 millions (more than 12% of India)Vehicle Pop in Delhi > Veh Pop (Mumbai + Kolkata+ Chennai)In 2008, Delhi has about 5.63 millions (more than 12% of India)

Growth Trend of Motor Vehicles in Growth Trend of Motor Vehicles in DelhiDelhi

Delhi has growth about 10% per annumTwo wheeler growth is slightly more than Cars

Delhi has growth about 10% per annumTwo wheeler growth is slightly more than Cars

Two Wheelers more than 60%Two Wheelers

more than 60%

Cars about 30%Cars about 30%

MethodologyMethodologyMethodologyMethodology

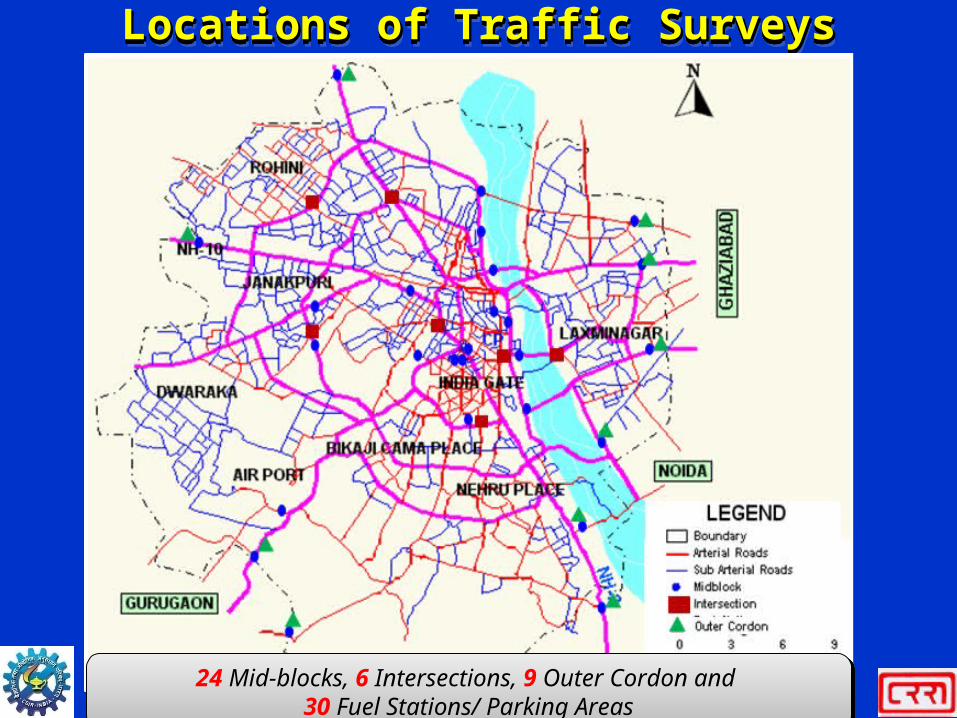
Locations of Traffic SurveysLocations of Traffic SurveysLocations of Traffic SurveysLocations of Traffic Surveys

24 Mid-blocks, 6 Intersections, 9 Outer Cordon and 30 Fuel Stations/ Parking Areas

24 Mid-blocks, 6 Intersections, 9 Outer Cordon and 30 Fuel Stations/ Parking Areas

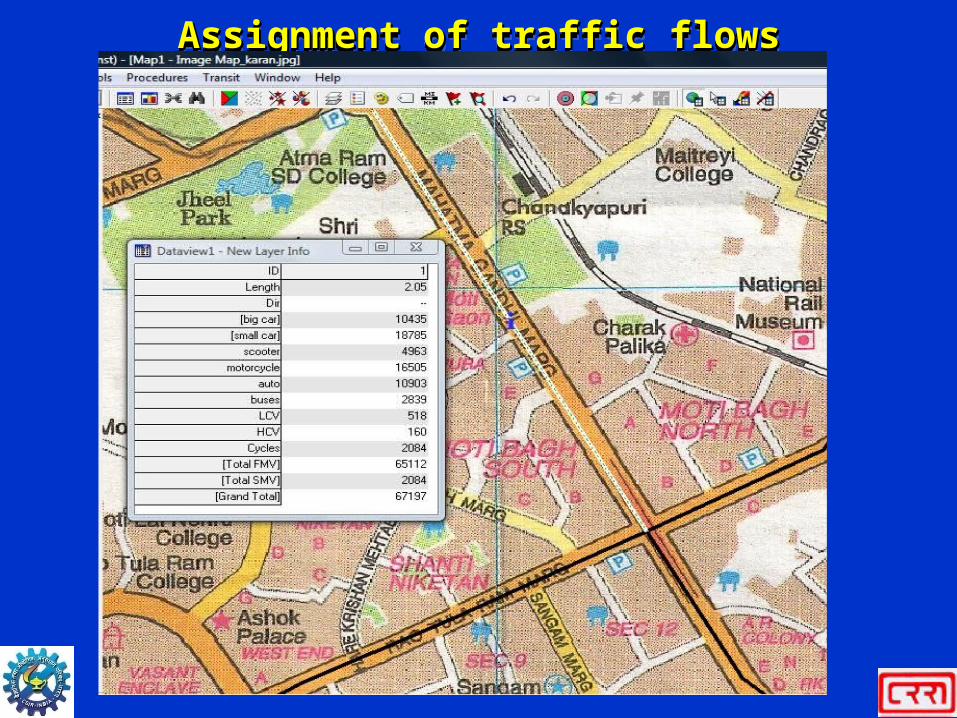
S. No. Code Road Name Big Car Small Car Scooter M Cycle Auto Buses LCV HCV Cycles Total FMV Total SMV Grand Total

1 MB-01 Barakhamba Road 9172 25642 2996 18110 6153 2919 206 98 1719 65296 1719 670152 MB-02 Ring Road (Rajghat) 14960 23451 9626 36116 11691 2460 5616 684 1263 104604 1263 1058673 MB-03 Mehrauli - Badarpur Road 9905 11574 3065 19265 4330 3201 2265 554 2148 54159 2148 563074 MB-04 Connaught Place Outer Circle 6386 17639 6664 16391 13410 4531 338 677 1153 66036 1153 671895 MB-05 Janpath 13958 17432 3704 7424 10188 974 105 24 650 53809 650 544596 MB-06 Lala Lajpath Rai Marg 41235 68220 14541 39392 21530 2555 1104 714 3104 189291 3104 1923957 MB-07 Ring Road (Naraina) 21941 25007 9165 34300 5736 2032 2062 1740 491 101983 491 1024748 MB-08 New Roatak Road 19900 27172 13582 35003 14375 3479 6190 504 3209 120205 3209 1234149 MB-09 Sham Nath Marg 8978 13779 8642 11845 6457 2901 660 154 1975 53416 1975 55391

10 MB-10 Ring Road (Hanuman Setu) 12824 45460 11099 38736 11614 3115 4372 778 6524 127998 6524 13452211 MB-11 G. T. Shahadara Road 7460 10440 8725 14809 5686 2659 2382 1139 1782 53300 1782 5508212 MB-12 I.T.O. Barrage Bridge 26180 36804 19924 50206 32249 3183 2113 423 12744 171082 12744 18382613 MB-13 Nizamuddin Bridge 22349 33935 12074 36350 15137 3298 4642 1130 2002 128915 2002 13091714 MB-14 Janakpuri District Centre 8894 10651 9987 20719 3235 2387 2012 245 8189 58130 8189 6631915 MB-15 Janak Setu 12107 29087 13673 28882 5170 1858 1551 320 1092 92648 1092 9374016 OC-01 Mathura Road - Badarpur Border 13542 31290 7029 33314 5089 2743 4564 8434 5320 106005 5320 11132517 OC-02 Sarita Vihar - Noida Road - Kalindi Kunj Border 15465 28114 6193 27369 6943 2699 3907 10792 1289 101482 1289 10277118 OC-03 Mayur Vihar- Noida Link Road - Chilla Border 6202 23940 19470 33102 6303 1474 2345 2573 1337 95409 1337 9674619 OC-04 NH-24 Bypass - Gazipur Border 29230 46829 8953 37396 11523 1085 8309 8148 4766 151473 4766 15623920 OC-05 Old NH-1 Road 3840 7377 7609 11925 4429 2043 5118 7340 991 49681 991 5067221 OC-06 Wazirabad Road - Bhopura Border 5417 13181 4003 19424 8079 2033 2226 3951 13267 58314 13267 7158122 OC-07 G. T. Karnal Road - Singhu Border 11610 15018 2858 6792 239 4459 9785 10605 755 61366 755 6212123 OC-08 Rohtak Road - Tikri Border 9517 13532 4181 9028 162 2616 4714 5058 3180 48808 3180 5198824 OC-09 NH-8 Gurgoan Road - Toll Plaza 78316 88413 4714 37437 0 3627 5868 9598 0 227973 0 227973

Summary of Traffic Volume Counts at Selected Mid-block Locations

Summary of Traffic Volume Counts at Selected Mid-block Locations

Summary of Traffic Volume Counts at Selected Summary of Traffic Volume Counts at Selected IntersectionsIntersections

Summary of Traffic Volume Counts at Selected Summary of Traffic Volume Counts at Selected IntersectionsIntersectionsCode Intersection Name Big Car Small Car Scooter M Cycle Auto Buses LCV HCV Cycles Total FMV Total SMV Grand Total

I-01 Moti Nagar Intersection 40806 55967 35970 56537 24757 6301 10681 3701 10431 234719 10431 245149I-02 I.I.T. Intersection 42709 52587 15301 48073 25221 4248 5403 5920 7010 199462 7010 206472I-03 Ashram Intersection 70785 114446 20433 84049 36586 9359 10498 14078 4637 360234 4637 364871I-04 Madhuban Chowk 32549 45050 23072 44483 13868 5849 6842 3839 7438 175552 7438 182990I-05 Preet Vihar Intersection 36340 62643 34379 72452 28533 6169 4730 2567 11781 247811 11781 259592I-06 I.T.O. Intersection 28292 50316 19849 54012 36360 4162 3063 1885 5218 197939 5218 203157

Maximum Traffic Flow at ITO Bridge (Mid-block) 2.3 Lakh veh/day and NH-8 Toll Plaza (Outer Cordon) with 2.27 Lakh veh/day

Maximum Traffic Flow at ITO Bridge (Mid-block) 2.3 Lakh veh/day and NH-8 Toll Plaza (Outer Cordon) with 2.27 Lakh veh/day

Maximum Traffic Flow at Ashram Chowk (Mid-block) with 3.65 Lakh veh/day (Flyover Traffic with 1.35 Lakh veh/day)

Maximum Traffic Flow at Ashram Chowk (Mid-block) with 3.65 Lakh veh/day (Flyover Traffic with 1.35 Lakh veh/day)

Typical Hourly Variation and Traffic CompositionTypical Hourly Variation and Traffic Composition

0

2000

4000

6000

8000

10000

12000

14000

16000

18000

20000

08:0

0-0

9:00

09:0

0-1

0:00

10:0

0-1

1:00

11:0

0-1

2:00

12:0

0-1

3:00

13:0

0-1

4:00

14:0

0-1

5:00

15:0

0-1

6:00

16:0

0-1

7:00

17:0

0-1

8:00

18:0

0-1

9:00

19:0

0-2

0:00

20:0

0-2

1:00

21:0

0-2

2:00

22:0

0-2

3:00

23:0

0-2

4:00

00:0

0-0

1:00

01:0

0-0

2:00

02:0

0-0

3:00

03:0

0-0

4:00

04:0

0-0

5:00

05:0

0-0

6:00

06:0

0-0

7:00

07:0

0-0

8:00

Tota

l Tra

ffic

Volu

me

(Veh

icle

s)

Time

Others

Cars

Two Wheelers

Autos

0

2000

4000

6000

8000

10000

12000

14000

16000

18000

20000

08:0

0-0

9:00

09:0

0-1

0:00

10:0

0-1

1:00

11:0

0-1

2:00

12:0

0-1

3:00

13:0

0-1

4:00

14:0

0-1

5:00

15:0

0-1

6:00

16:0

0-1

7:00

17:0

0-1

8:00

18:0

0-1

9:00

19:0

0-2

0:00

20:0

0-2

1:00

21:0

0-2

2:00

22:0

0-2

3:00

23:0

0-2

4:00

00:0

0-0

1:00

01:0

0-0

2:00

02:0

0-0

3:00

03:0

0-0

4:00

04:0

0-0

5:00

05:0

0-0

6:00

06:0

0-0

7:00

07:0

0-0

8:00

Tota

l Tra

ffic

Volu

me

(Veh

icle

s)

Time

Petreol

Diesel

CNG

Car57%

Two Wheeler28%

Auto11%

Buses1%

LCV1%

Trucks0%SMV2%

Lala Lajpath Rai MargLala Lajpath Rai Marg

Total Vehicles : 1,92,395/day

0

5000

10000

15000

20000

25000

30000

08:0

0-0

9:00

09:0

0-1

0:00

10:0

0-1

1:00

11:0

0-1

2:00

12:0

0-1

3:00

13:0

0-1

4:00

14:0

0-1

5:00

15:0

0-1

6:00

16:0

0-1

7:00

17:0

0-1

8:00

18:0

0-1

9:00

19:0

0-2

0:00

20:0

0-2

1:00

21:0

0-2

2:00

22:0

0-2

3:00

23:0

0-2

4:00

00:0

0-0

1:00

01:0

0-0

2:00

02:0

0-0

3:00

03:0

0-0

4:00

04:0

0-0

5:00

05:0

0-0

6:00

06:0

0-0

7:00

07:0

0-0

8:00

Tota

l Tra

ffic

Volu

me

(Veh

icle

s)

Time

Others

Cars

Two Wheelers

Autos

0

5000

10000

15000

20000

25000

30000

08:0

0-0

9:00

09:0

0-1

0:00

10:0

0-1

1:00

11:0

0-1

2:00

12:0

0-1

3:00

13:0

0-1

4:00

14:0

0-1

5:00

15:0

0-1

6:00

16:0

0-1

7:00

17:0

0-1

8:00

18:0

0-1

9:00

19:0

0-2

0:00

20:0

0-2

1:00

21:0

0-2

2:00

22:0

0-2

3:00

23:0

0-2

4:00

00:0

0-0

1:00

01:0

0-0

2:00

02:0

0-0

3:00

03:0

0-0

4:00

04:0

0-0

5:00

05:0

0-0

6:00

06:0

0-0

7:00

07:0

0-0

8:00

Tota

l Tra

ffic

Volu

me

(Veh

icle

s)

Time

Petreol

Diesel

CNG

Car51%

Two Wheeler29%

Auto10%

Buses2%

LCV3%

Trucks4%

SMV1%

At Ashram IntersectionAt Ashram Intersection

Total Vehicles : 3,64,871 vehicles/day (1,35,173 v/d flyover traffic)

Pattern of External TrafficPattern of External TrafficPattern of External TrafficPattern of External Traffic

4,64,1834,31,246

Assignment of traffic flowsAssignment of traffic flowsAssignment of traffic flowsAssignment of traffic flows

Traffic Flow Pattern in DelhiTraffic Flow Pattern in Delhi Traffic Flow Pattern in DelhiTraffic Flow Pattern in Delhi

High Traffic flows observed are observed at CBD areas and on Major National Highways

ITO bridge carries maximum traffic flow around 2.3 lac /day

NH8 Delhi- Gurgaon Expressway carries Maximum Traffic Flow 2.27 lac/day

Ashram Intersection carries maximum around 3.6lac/day

Future Applications For Traffic Congestion managementFor Traffic Pollution Loads from TrafficFor Dynamic Traffic Assignment

ConclusionsConclusionsConclusionsConclusions


Recommended