152

Mapping of Wildlife Sanctuaries and National Parks of India
A Pilot Project: Indira Gandhi Wildlife Sanctuary
NRSC
Dr. C. Sudhakar Reddy Dr. V.K. Srivastava
Dr. S. Sudhakar Dr. M.S.R. Murthy
Mr. Shijo Joseph, JRF Mr. Ved Prakash Ola, Project Personnel
WII
Dr. V.B. Mathur
TNFD
Sri K. Sridharan Dr. S.K. Srivastava
SURVEY OF INDIA
December, 2008


Contents
Page no. Chapter I – Introduction 1-20
1.1 Indira Gandhi Wildlife Sanctuary 3-9
1.2 Topography 10-20
Chapter II -Vegetation type mapping 21-39 2.1 Methodology 21-26
2.2 Results and Discussion 27-39
Chapter III –Forest Crown Density Mapping 40-53 3.1 Methodology 40-41
3.2 Results and Discussion 41-53
Chapter IV –Phytosociological study 54-72 4.1 Methodology 54-57
4.2 Results and Discussion 58-66
4.3 Gradients of Diversity 67-72
CHAPTER V-LAND COVER CHANGE ASSESSMENT 73-82
5.1 Methodology 74-76
5.2 Results and Discussions 77-82
Chapter VI - Conclusions and Recommendations 83-84
References 85-93

List of Figures Figure1.1 Location Map of Indira Gandhi Wildlife Sanctuary.
Figure1.2 Infrastructure Map of Indira Gandhi Wildlife Sanctuary
Figure1.3 Administrative Map of Indira Gandhi Wildlife Sanctuary
Showing Reserve Forest & Section
Figure1.4 Administrative Map of Indira Gandhi Wildlife Sanctuary
showing Range Boundary and Beat Boundary
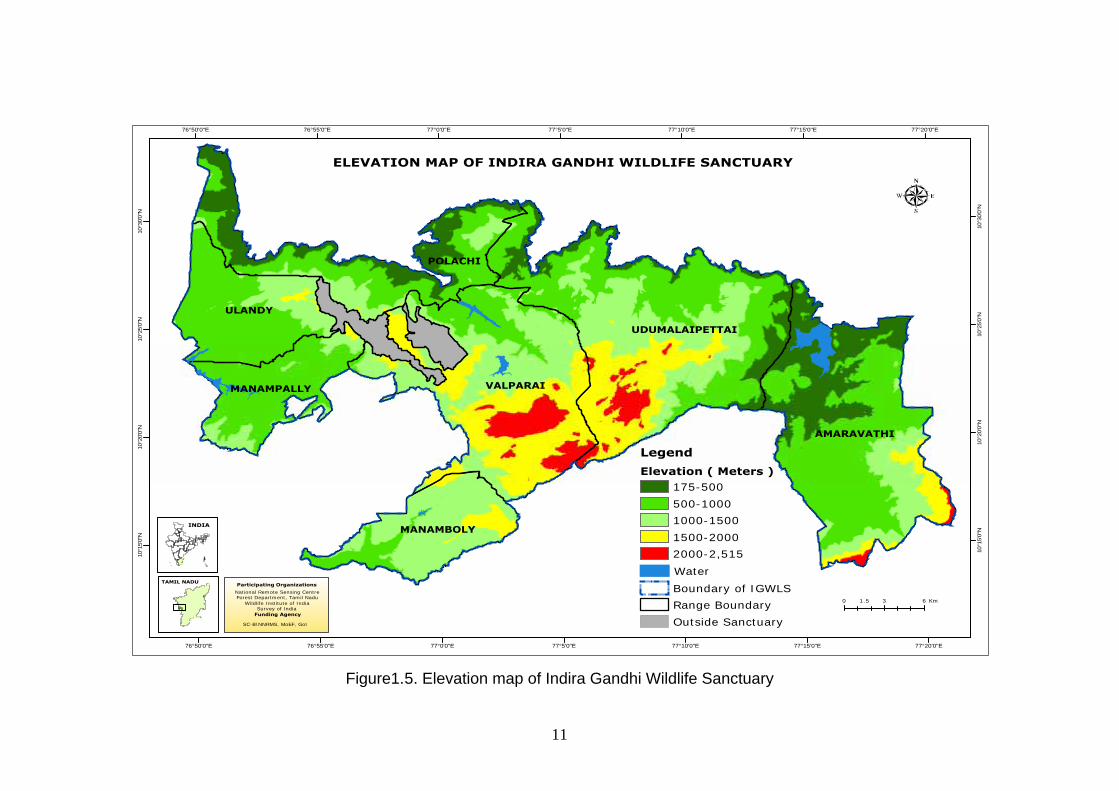
Figure1.5 Elevation map of Indira Gandhi Wildlife Sanctuary
Figure1.6 Percent Area Distribution of Elevation in Indira Gandhi
Wildlife Sanctuary.
Figure1.7 Slope Map of Indira Gandhi Wildlife Sanctuary
Figure1.8 Percent Area Distribution of Slope in Indira Gandhi Wildlife
Sanctuary
Figure 1.9 Aspect Map of Indira Gandhi Wildlife Sanctuary
Figure1.10 Percent Area Distribution of Aspect in Indira Gandhi Wildlife
Sanctuary
Figure1.11 Drainage Map of Indira Gandhi Wildlife Sanctuary
Figure2.1 False Colour Composite Image of Indira Gandhi Wildlife
Sanctuary
Figure2.2 Vegetation types in Indira Gandhi Wildlife Sanctuary
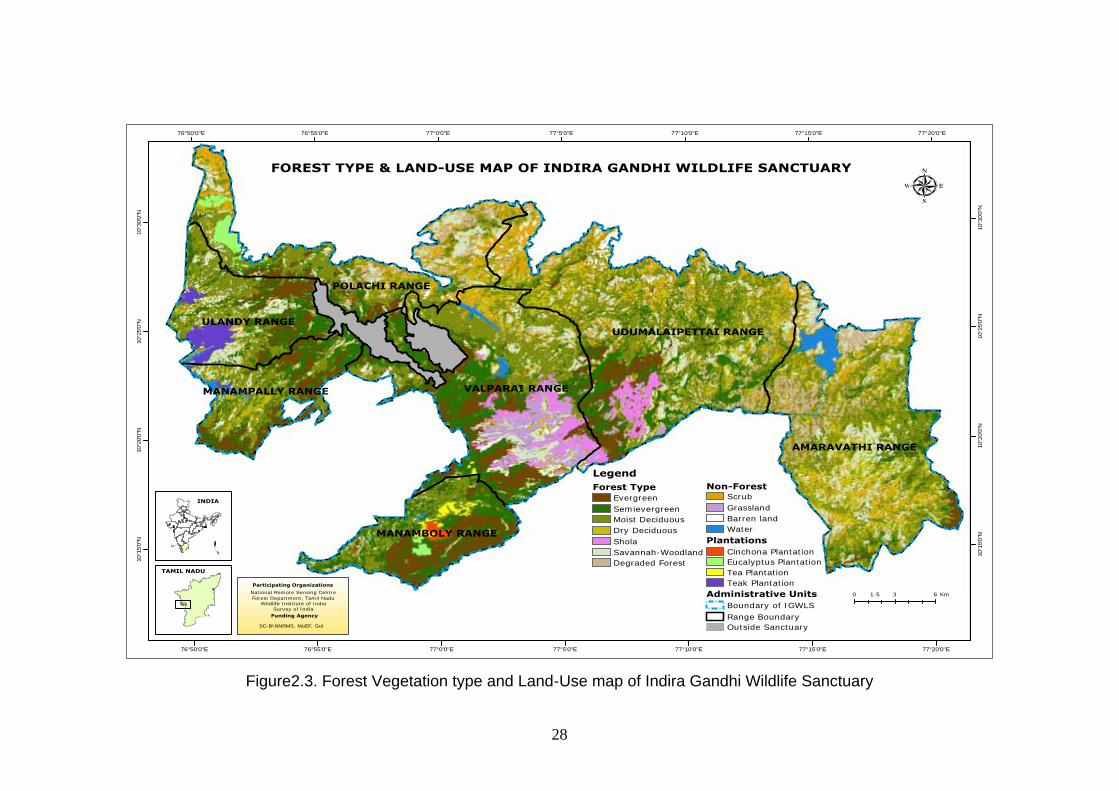
Figure2.3 Forest Vegetation type and Land-Use map of Indira Gandhi
Wildlife Sanctuary
Figure2.4 Percent Area Distribution of Vegetation type and Land-Use in
Indira Gandhi Wildlife Sanctuary
Figure2.5 Percent area Distribution of Different forest types in different
ranges.
Figure 2.6 Forest Type and Land-Use Map of Manampally Range
Figure 2.7 Forest Type and Land-Use Map of Manamboly Range
Figure 2.8 Forest Type and Land-Use Map of Polachi Range
Figure 2.9 Forest Type and Land-Use Map of Udumalaipettai Range
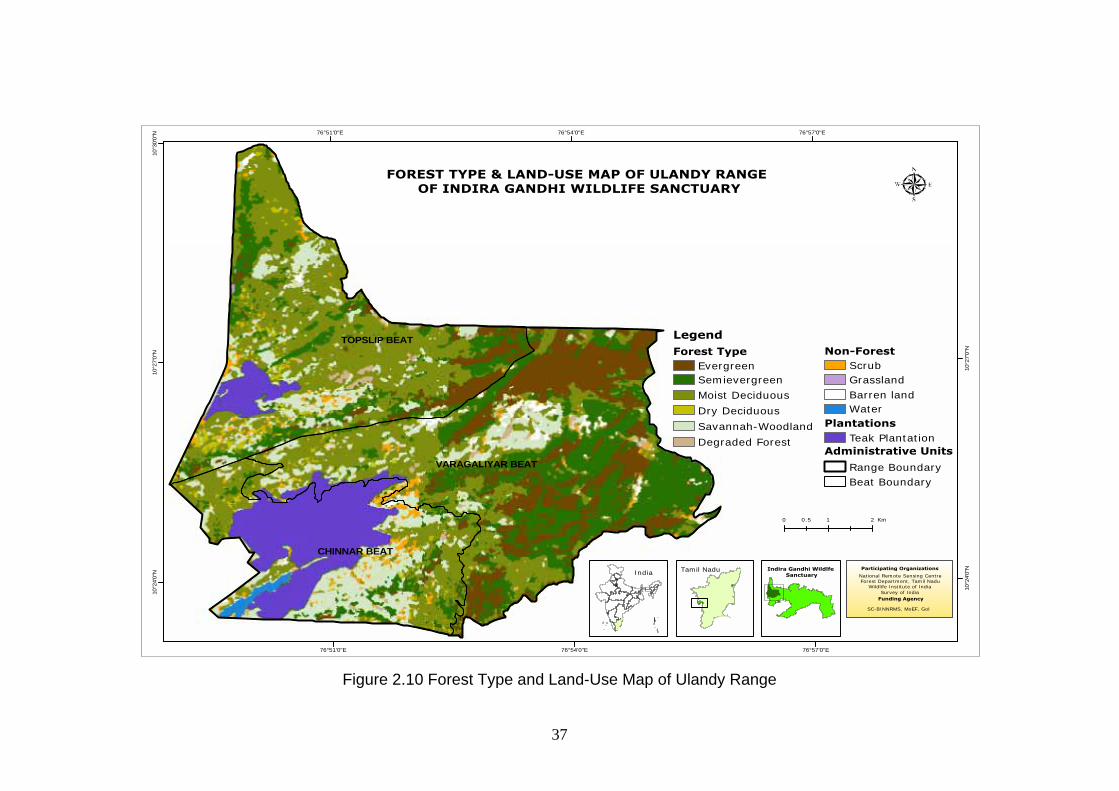
Figure 2.10 Forest Type and Land-Use Map of Ulandy Range
Figure 2.11 Forest Type and Land-Use Map of Valparai Range
Figure 2.12 Forest Type and Land-Use Map of Amaravathi Range
Figure3.1 Methodology Flow chart for Forest Type, Density & Bio-
Richness Maps
Figure3.2. Forest Canopy Density Map of Indira Gandhi Wildlife
Sanctuary
Figure3.3. Area Distribution of Forest Canopy Density of Indira Gandhi
Wildlife Sanctuary
Figure 3.4 Area Distribution of Canopy Density in different Ranges
under <40% canopy Density and >40 % canopy Density
Figure3.5 Area Distribution of different Forest Canopy Density
Categories in Different Ranges
Figure3.6 Forest Canopy Density and Land-Use Map of Amaravathi
Range Figure3.7 Forest Canopy Density and Land-Use Map of Amaravathi
Range
Figure3.8 Forest Canopy Density and Land-Use Map of Manamboly
Range
Figure3.9 Forest Canopy Density and Land-Use Map of Polachi Range Figure3.10 Forest Canopy Density and Land-Use Map of Udumalaipettai
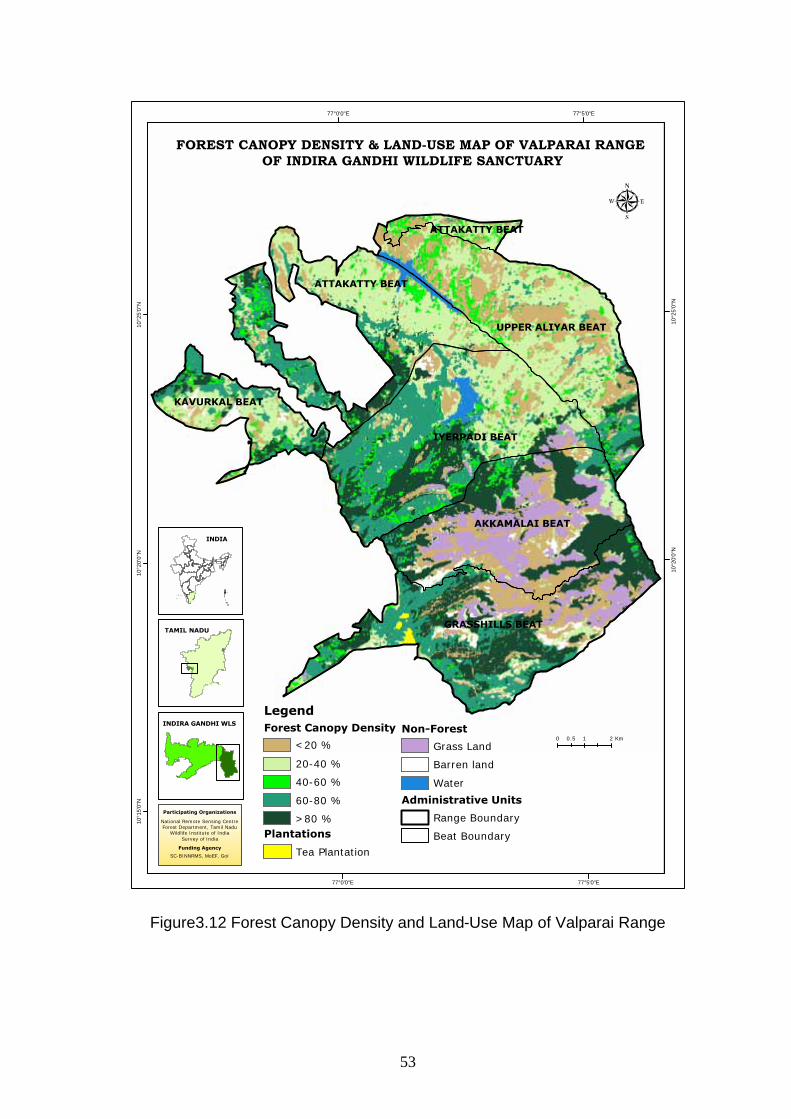
Range Figure3.11 Forest Canopy Density and Land-Use Map of Ulandy Range Figure3.12 Forest Canopy Density and Land-Use Map of Valparai
Range Figure4.1. Phytosociological sampling method
Figure4.2.1 Sample Points location in Indira Gandhi Wildlife Sanctuary
Figure4.2.2 Sample Points location in Indira Gandhi Wildlife Sanctuary
Figure4.3. CCA ordination diagram (Axis 1 by Axis 2) with plots
(scattered points) and environmental variables (lines) in
Anamalai wildlife sanctuary. Each circle represents
partitioning of vegetation communities along environmental
gradients.
Figure5.1. Flow diagram depicting the details of change detection
technique followed in the study
Figure5.2. Map showing change areas from 1973 to 2006 in Indira
Gandhi Wildlife Sanctuary, India.

List of Tables Table1.1 Range and Beat wise Geographical area of Indira Gandhi
Wildlife Sanctuary. Table1.2 Distribution of Area under different Elevation categories in
Indira Gandhi Wildlife Sanctuary Table1.3 Distribution of Area under different Elevation categories in
different range of Indira Gandhi Wildlife Sanctuary Table1.4 Elevation Description of different Range of Indira Gandhi
Wildlife Sanctuary Table1.5. Area Distribution Slope Categories in Indira Gandhi Wildlife
Sanctuary Table1.6. Area Distribution of Slope Categories in different Range of
Indira Gandhi Wildlife Sanctuary Table1.7. Slope Description of different Range of Indira Gandhi Wildlife
Sanctuary Table1.8. Area Distribution Aspect Categories in Indira Gandhi Wildlife
Sanctuary Table1.9. Area Distribution of Aspect Categories in different Range of
Indira Gandhi Wildlife Sanctuary Table2.1 Forest types of Indira Gandhi Wildlife sanctuary (Champion
and Seth, 1968) Table2.2 Area Statistics of Vegetation cover types in Indira Gandhi
Wildlife Sanctuary (Area in sq.km) Table2.3.1 Range wise area distribution of Vegetation & Land-Use type
of Indira Gandhi Wildlife Sanctuary (Area in sq km) Table2.3.2 Range wise area distribution of Vegetation & Land-Use type
of Indira Gandhi Wildlife Sanctuary (Area in sq km) Table3.1 Area Statistics of Forest Crown density in Indira Gandhi
Wildlife Sanctuary Table3.2. Area Distribution of Canopy Density in different Ranges
under <40% canopy Density and >40 % canopy Density Table3.3.1 Range wise Forest Crown density distribution Table3.3.2 Range wise Forest Crown density distribution Table4.1 Ecological dominance of top ten species (based on IVI
values) in Sanctuary Table4.2 Top 10 dominant species in Dry deciduous forest of Indira
Gandhi WLS (Based on IVI values)

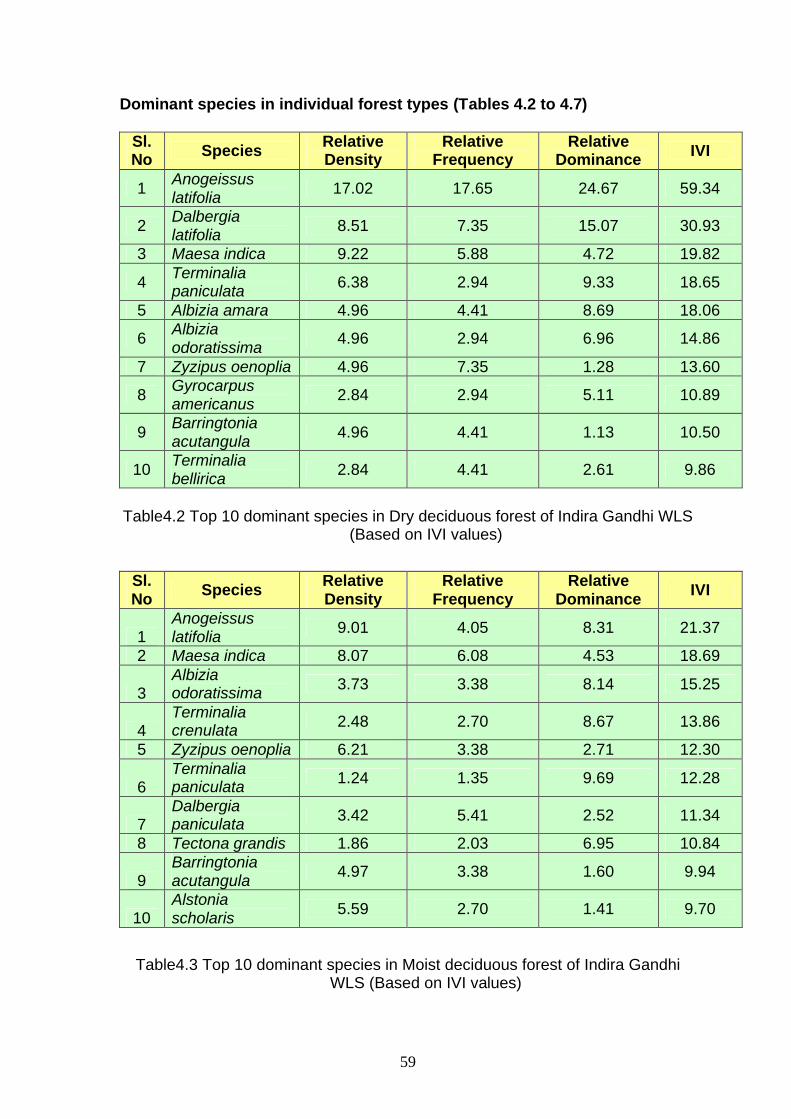
Table4.3 Top 10 dominant species in Moist deciduous forest of Indira Gandhi WLS (Based on IVI values)
Table4.4 Top 10 dominant species in Evergreen forest of Indira Gandhi WLS (Based on IVI values)
Table4.5 Top 10 dominant species in Semi-Evergreen forest of Indira Gandhi WLS (Based on IVI values)
Table4.6 Top 10 dominant species in Shola forest of Indira Gandhi WLS (Based on IVI values)
Table4.7 Top 10 dominant species in Scrub forest of Indira Gandhi WLS (Based on IVI values)
Table4.8. Five Dominant Species in different Forest Type of Amaravathi Range
Table4.9. Five Dominant Species in different Forest Type of Manampally Range
Table4.10. Five Dominant Species in different Forest Type of Polachi Range
Table4.11 Five Dominant Species in different Forest Type of Udumalaipettai Range
Table4.12. Five Dominant Species in different Forest Type of Ulandy Range
Table4.13. Five Dominant Species in different Forest Type of Valaprai Range
Table4.14 Population structure of tree species along girth class frequencies
Table4.15 Population structure of tree species across Height class intervals
Table4.16 Endemic species of Study area Table4.17 Canonical correspondence analysis of 169 species in 206
plots in Anamalai wildlife sanctuary. Matrix presents intraset correlation between environmental variables and first three axes and weighted correlations between environmental variables.
Table4.18 Overall regression model of species richness from
environmental variables in Anamalai wildlife sanctuary (R2 – 0.50, F – 39.82, df1 – 5, df2 – 199 and p - 2.98E-28).
Table5.1 Land use/Land cover changes (area in hectare) in Indira Gandhi Wildlife Sanctuary from 1973 to 2006
List of Annexure: Annexure1 Area Distribution of Forest Canopy Density in all Range of
Indira Gandhi Wildlife Sanctuary.
Annexure2 Area Distribution of Forest Vegetation type & Land-Use in all
Range of Indira Gandhi Wildlife Sanctuary.
Annexure3 Area Distribution of Aspect in all Range of Indira Gandhi
Wildlife Sanctuary.
Annexure4 Area Distribution of Elevation in all Range of Indira Gandhi
Wildlife Sanctuary.
Annexure5 Area Distribution of Slope in all Range of Indira Gandhi
Wildlife Sanctuary.
Annexure6 Beat and Section wise area distribution of vegetation type
and landuse & land cover in all Range of Indira Gandhi
Wildlife Sanctuary.
Annexure7 Beat and Section Wise Area Distribution of Forest Canopy
Density in all Range of Indira Gandhi Wildlife Sanctuary
Annexure8 Maps of Status of main Faunal Species of Indira Gandhi
Wildlife Sanctuary.
Annexure9 Phytosociological Sample Point Location in Indira Gandhi
Wildlife Sanctuary
Acknowledgement The project team is grateful to Dr. V. Jayaraman, Director, NRSC, Dr. P.S. Roy,
Deputy Director (RS & GIS Application Area) and Dr. R.S. Dwivedi, Group
Director (LRG), NRSC for all the guidance and encouragement. We thank
Director, WII for encouragement and Tamil Nadu Forest Department for
cooperation in field studies. Thanks due to Ministry of Environment and Forests,
New Delhi for financial assistance. We are grateful to Mr. G. Rajasekhar and Mr.
Girish S. Pujar, Scientists, NRSC for their technical cooperation and continual
support.

1
Chapter - I
INTRODUCTION
India is endowed with a great variety of biological communities and is ranked
among twelve mega diversity countries in the world. But India’s green mantle
along with its heritage of biodiversity is in grave trouble today due to population
explosion, encroachment to forest land, shifting cultivation practices and
degradation caused by overgrazing, illicit felling, lopping, for fuel and folder,
forest fire, etc. The formulation of Protected Area is a regular practice for the
conservation of biodiversity from these threats. But many times Protected Area
has not been fulfil its objectives as there is no base line data about major habitats
and its species composition, ecological significance and threatening factors in the
area. Wherever little data exits, it is not in a standardized form to address the
management issues. The lack of baseline data is hampering the conservation
and management of the protected area significantly. In this context, Ministry of
Environment and Forest, Govt. of India has planned to develop a spatial
database for all Protected Areas in the country. As an initial step, Ministry has
taken up five Protected Areas for the pilot study in which Indira Gandhi Wildlife
Sanctuary and National Park is one among them. National Remote Sensing
Centre has been identified as the nodal Centre for the implementation of the
project in Indira Gandhi WLS & NP in collaboration with Wildlife Institute of India
and Tamil Nadu Forest Department.
2
Objectives:
It is now realized that all the concerned departments are keenly interested to
work towards achieving sustainability through proper scientific and thereby to
reduce the adverse impacts of social changes to the environment. The main
objectives of the present study are:
1. Forest type map at 1: 25,000 scale
2. Forest Crown density map in five class as <20%, 20-40 %, 40-60 %,
60-80 % and >80 % at 1: 25,000 scale
3. Plant species richness, density and diversity map
4. Mammals richness, density and diversity map
5. Avian richness, density and diversity map
In addition to the above main objectives, spatial data was generated for
infrastructure and topography (aspect, slope, elevation).
3
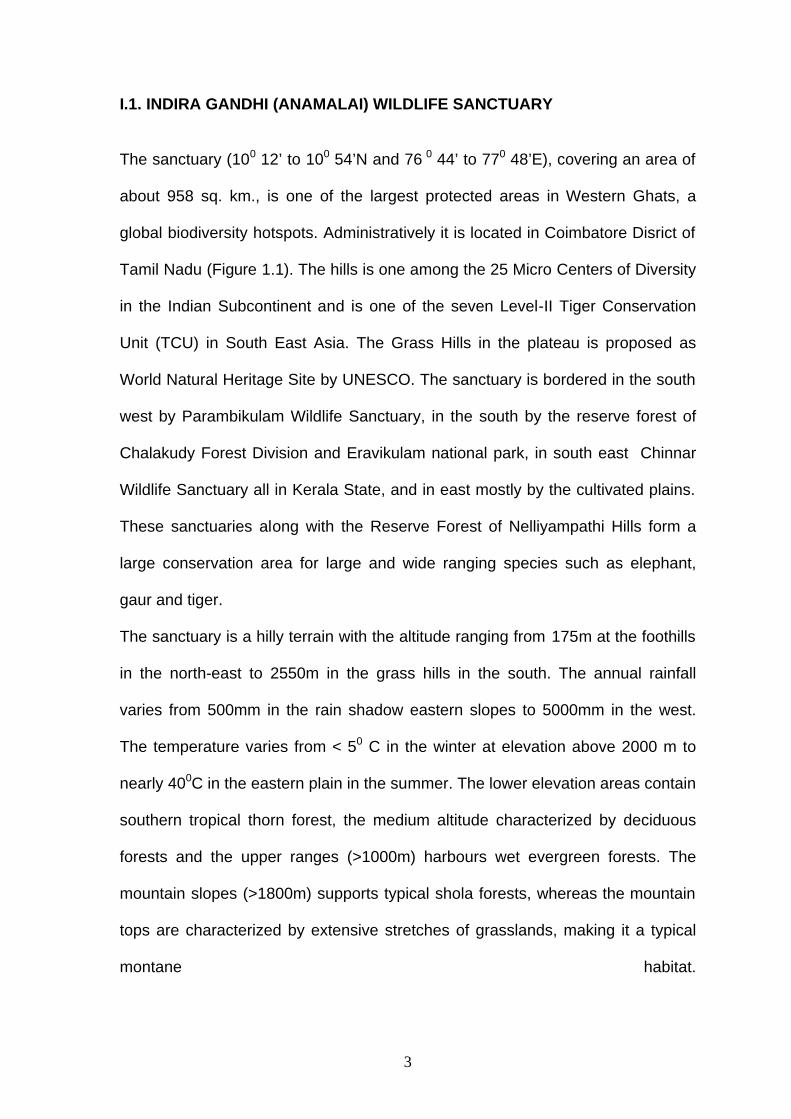
I.1. INDIRA GANDHI (ANAMALAI) WILDLIFE SANCTUARY
The sanctuary (100 12’ to 100 54’N and 76 0 44’ to 770 48’E), covering an area of
about 958 sq. km., is one of the largest protected areas in Western Ghats, a
global biodiversity hotspots. Administratively it is located in Coimbatore Disrict of
Tamil Nadu (Figure 1.1). The hills is one among the 25 Micro Centers of Diversity
in the Indian Subcontinent and is one of the seven Level-II Tiger Conservation
Unit (TCU) in South East Asia. The Grass Hills in the plateau is proposed as
World Natural Heritage Site by UNESCO. The sanctuary is bordered in the south
west by Parambikulam Wildlife Sanctuary, in the south by the reserve forest of
Chalakudy Forest Division and Eravikulam national park, in south east Chinnar
Wildlife Sanctuary all in Kerala State, and in east mostly by the cultivated plains.
These sanctuaries along with the Reserve Forest of Nelliyampathi Hills form a
large conservation area for large and wide ranging species such as elephant,
gaur and tiger.
The sanctuary is a hilly terrain with the altitude ranging from 175m at the foothills
in the north-east to 2550m in the grass hills in the south. The annual rainfall
varies from 500mm in the rain shadow eastern slopes to 5000mm in the west.
The temperature varies from < 50 C in the winter at elevation above 2000 m to
nearly 400C in the eastern plain in the summer. The lower elevation areas contain
southern tropical thorn forest, the medium altitude characterized by deciduous
forests and the upper ranges (>1000m) harbours wet evergreen forests. The
mountain slopes (>1800m) supports typical shola forests, whereas the mountain
tops are characterized by extensive stretches of grasslands, making it a typical
montane habitat.

4
77°20'0"E
77°20'0"E
77°15'0"E
77°15'0"E
77°10'0"E
77°10'0"E
77°5'0"E
77°5'0"E
77°0'0"E
77°0'0"E
76°55'0"E
76°55'0"E
76°50'0"E
76°50'0"E
10°3
0'0"
N
10°3
0'0"
N
10°2
5'0"
N
10°2
5'0"
N
10°2
0'0"
N
10°2
0'0"
N
10°1
5'0"
N
10°1
5'0"
N
INDIRA GANDHI WILDLIFE SANCTUARY, TAMIL NADU, INDIA
0 3 61.5 Km
Legend
Boundary of IGWLS
INDIA
Participating Organizations
National Remote Sensing CentreForest Department, Tamil Nadu
Wildlife Institute of IndiaSurvey of India
Funding Agency
SC-B\NNRMS, MoEF, GoI
TAMIL NADU
Figure1.1 Location Map of Indira Gandhi Wildlife Sanctuary

5
Administrative and Infrastructure Information:
Survey of India provided digital layers on administrative boundaries and
infrastructure details of the sanctuary on 1:25,000 scale. As per the details given
by SOI the sanctuary has total geographical area (TGA) of 960.21 sq km. The
sanctuary has 7 no. of ranges 15 no. of Sections and 37 Beats. The TGA of
different ranges and corresponding beats of the ranges is given table 1.1.
S. No. RANGE S.No. BEAT Total Area of
Beat (Sq.km) 1 KALLAPURAM 44.27 2 KOMBU EAST 33.86 3 KILANAVAYAL 32.87 4 MANJANPATTI 34.12
AMARAVATHI
5 TALINGI 56.22 1
Total Geographic Area of Amaravathi Range (sq km) 201.34
1 CHINNAKALLAR 24.86 MANAMBOLY 2 PERIYA KALLAR 47.72 2 Total Geographic Area of Manamboly Range (sq km) 72.58
1 ANALI 13.37 2 MANAMPALLI 20.32 3 SHEIKALMUDI 19.05
MANAMPALLY
4 URULIKAL 13.65 3
Total Geographic Area of Manampally Range (sq km) 66.38
1 ALIYAR 19.21 2 ARTHANRIPALAYAM 16.63 3 VILLONNIE 23.34 4 MANGARAI 15.03 5 PACHATHANNIR 11.07 6 AYIRAMKAL 10.68
POLACHI
7 POTHAMADA 11.94
4
Total Geographic Area of Polachi Range (sq km) 107.91 1 EASAL THITTU EAST 40.11 2 EASAL THITTU WEST 29.38 3 KOMBU WEST 47.85 4 KARATTUR 15.61 5 KARATTUR 18.02 6 PARUTHIYUR 17.46 7 KURUMALAI 20.03 8 THIRUMURTHI MALAI 31.55
UDUMALAIPETTAI
9 VALLAKONDAPURAM 28.27
5
Total Geographic Area of Udumalaipettai Range (sq km) 248.29

6
1 TOPSLIP 27.24 2 CHINNAR 18.91 ULANDY 3 VARAGALIYAR 34.96 6
Total Geographic Area of Ulandy Range (sq km) 81.11 1 AKKAMALAI 31.87 2 GRASSHILLS 36.17 3 ATTAKATTY 3.29 4 ATTAKATTY 27.09 5 UPPER ALIYAR 33.26 6 IYERPADI 39.10
VALPARAI
7 KAVURKAL 11.82
7
Total Geographic Area of Valparai Range (sq km) 182.60 Total Geographic Area of Sanctuary (sq km) 960.21
Table1.1. Range and Beat wise Geographical area of Indira Gandhi Wildlife
Sanctuary.
The infrastructure details consists of locations of forest administrative offices,
Forest Rest-House, watch towers, Check-Post, Anti-Poaching Shed, elephant
camps, Rain Gauge Locations fire lines, roads, settlements etc.
The infrastructure layers, sanctuary boundary, and administrative are
given in figure-1.2, 1.3 & 1.4.

7
VALPARAI
AMARAVATHI
UDUMALAIPETTAI
POLACHI
ULANDY
MANAMBOLY
MANAMPALLY
77°20'0"E
77°20'0"E
77°15'0"E
77°15'0"E
77°10'0"E
77°10'0"E
77°5'0"E
77°5'0"E
77°0'0"E
77°0'0"E
76°55'0"E
76°55'0"E
76°50'0"E
76°50'0"E
10°3
0'0"
N
10°3
0'0"
N
10°2
5'0"
N
10°2
5'0"
N
10°2
0'0"
N
10°2
0'0"
N
10°1
5'0"
N
10°1
5'0"
N
INFRASTRUCTURE MAP OF INDIRA GANDHI WILDLIFE SANCTUARY
0 3 61.5 Km
INDIA
Participating Organizations
National Remote Sensing CentreForest Department, Tamil Nadu
Wildlife Institute of IndiaSurvey of India
Funding Agency
SC-B\NNRMS, MoEF, GoI
TAMIL NADU
LegendForest Rest-House & Office
Forest Genetic Research Centre
Watch Tower
Elephant Camp
Anti Poaching Shed
Check Post
Rain Guage
Settlements
Roads
Fire Lines
Boundary of IGWLS
Range Boundary
Outside Sanctuary
Figure1.2. Infrastructure Map of Indira Gandhi Wildlife Sanctuary
8
ANAIMALAI RESERVED FORESTTUNAKADAVU RF
AMARAVATHI RESERVED FOREST
MANUPATTI SECTION
MANJANPATTI SECTION
DHALI SECTION
KALLAR SECTION
ALIYAR SECTION
KALLAPURAM SECTION
AKKAMALAI SECTION
ATTAKATTY SECTION
MANAMPALLY SECTION
IYERPADI SECTION
VARAGALIYAR SECTION
TOPSLIP SECTIONSETHULMADI EAST SECTION
KARATTUR SECTION
Unsurveyed
Unsurveyed
KARATTUR SECTION
SETHULMADI WEST SECTION
77°20'0"E
77°20'0"E
77°15'0"E
77°15'0"E
77°10'0"E
77°10'0"E
77°5'0"E
77°5'0"E
77°0'0"E
77°0'0"E
76°55'0"E
76°55'0"E
76°50'0"E
76°50'0"E
10°3
0'0"
N
10°3
0'0"
N
10°2
5'0"
N
10°2
5'0"
N
10°2
0'0"
N
10°2
0'0"
N
10°1
5'0"
N
10°1
5'0"
N
ADMINISTRATIVE MAP OF INDIRA GANDHI WILDLIFE SANCTUARY
0 3 61.5 Km
INDIA
Participating Organizations
National Remote Sensing CentreForest Department, Tamil Nadu
Wildlife Institute of IndiaSurvey of India
Funding Agency
SC-B\NNRMS, MoEF, GoI
TAMIL NADU
Legend
Reserve Forest Boundary
Boundary of IGWLS
Amaravathi Reserve Forest
Anaimalai Reserve Forest
Tunakadavu Reserve Forest
Section Boundary
Outside Sanctuary
Figure1.3. Administrative Map of Indira Gandhi Wildlife Sanctuary Showing Reserve Forest & Section

9
VALPARAI
AMARAVATHI
UDUMALAIPETTAI
POLACHI
ULANDY
MANAMBOLY
MANAMPALLY
TALINGI BEAT
IYERPADI BEAT
KOMBU WEST BEAT
KALLAPURAM BEAT
PERIYA KALLAR BEAT
GRASSHILLS BEAT
TOPSLIP BEAT
AKKAMALAI BEAT
VARAGALIYAR BEAT
ALIYAR BEAT
VILLONNIE BEAT
CHINNAR BEAT
ANALI BEAT
MANAMPALLI BEAT
KOMBU EAST BEAT
MANJANPATTI BEATKILANAVAYAL BEAT
UPPER ALIYAR BEAT
ATTAKATTY BEAT
EASAL THITTU EAST BEATUnsurveyedTHIRUMURTHI MALAI BEAT
CHINNAKALLAR BEAT
KURUMALAI BEAT
KARATTUR BEAT
EASAL THITTU WEST BEATVALLAKONDAPURAM BEAT
Unsurveyed
KARATTUR BEAT
SHEIKALMUDI BEAT
PARUTHIYUR BEAT
MANGARAI BEAT
URULIKAL BEAT
KAVURKAL BEAT
ARTHANRIPALAYAM BEAT
POTHAMADA BEAT
AYIRAMKAL BEAT
PACHATHANNIR BEAT
ATTAKATTY BEAT
77°20'0"E
77°20'0"E
77°15'0"E
77°15'0"E
77°10'0"E
77°10'0"E
77°5'0"E
77°5'0"E
77°0'0"E
77°0'0"E
76°55'0"E
76°55'0"E
76°50'0"E
76°50'0"E
10°3
0'0"
N
10°3
0'0"
N
10°2
5'0"
N
10°2
5'0"
N
10°2
0'0"
N
10°2
0'0"
N
10°1
5'0"
N
10°1
5'0"
N
ADMINISTRATIVE MAP OF INDIRA GANDHI WILDLIFE SANCTUARY
0 3 61.5 Km
INDIA
Participating Organizations
National Remote Sensing CentreForest Department, Tamil Nadu
Wildlife Institute of IndiaSurvey of India
Funding Agency
SC-B\NNRMS, MoEF, GoI
TAMIL NADU
Legend
Range
Boundary of IGWLS
Amaravathi
Manamboly
Manampally
Polachi
Udumalaipettai
Ulandy
Valparai
Beat Boundary
Outside Sanctuary
Figure1.4. Administrative Map of Indira Gandhi Wildlife Sanctuary showing Range Boundary and Beat Boundary

10
1.2 Topography:
Elevation:
Survey of India provided base layers in digital format on 1:25000 scale. A DEM
was prepared using line contours of 10 meter interval. While creating DEM, point
height, Drainage Map for lower and higher control, and boundary of Indira Gandhi
Sanctuary for extent, are also used.
Elevation information was derived from high resolution Digital Elevation Model
with 10 meter resolution. The whole sanctuary was classified into 5 categories
(Figure1.5 & 1.6, Table1.2, 1.3 & 1.4). Below 500 meter elevation, occurs along
with Northern boundary and North-West part of Sanctuary, and contributing 13.04
%. Area between500-1000 meter elevation occurs mostly in all direction except
Southern part of sanctuary and contributing 41.57 %. Area Between 1000-1500
meter elevation occurs mostly in central and South-East part of sanctuary and
contributing 28.01 %. Area between 1500 to 2000 meter elevations occurs mostly
in Southern and some in Eastern part and contributing 13.91 %. Area between
2000-2515 meter elevation occurring only in Southern part of sanctuary and
contributes 3.47 %
The sanctuary has 175.86 meter minimum elevation and 2514.51 meter
maximum elevation and 1120.77 meter mean elevation.
11
VALPARAI
AMARAVATHI
UDUMALAIPETTAI
POLACHI
ULANDY
MANAMBOLY
MANAMPALLY
77°20'0"E
77°20'0"E
77°15'0"E
77°15'0"E
77°10'0"E
77°10'0"E
77°5'0"E
77°5'0"E
77°0'0"E
77°0'0"E
76°55'0"E
76°55'0"E
76°50'0"E
76°50'0"E
10°3
0'0"
N
10°3
0'0"
N
10°2
5'0"
N
10°2
5'0"
N
10°2
0'0"
N
10°2
0'0"
N
10°1
5'0"
N
10°1
5'0"
N
ELEVATION MAP OF INDIRA GANDHI WILDLIFE SANCTUARY
0 3 61.5 Km
Legend
Elevation ( Meters )175-500
500-1000
1000-1500
1500-2000
2000-2,515
Boundary of IGWLS
Range Boundary
Outside Sanctuary
Water
INDIA
Participating Organizations
National Remote Sensing CentreForest Department, Tamil Nadu
Wildlife Institute of IndiaSurvey of India
Funding Agency
SC-B\NNRMS, MoEF, GoI
TAMIL NADU
Figure1.5. Elevation map of Indira Gandhi Wildlife Sanctuary

12
AREA DISTRIBUTION OF ELEVATION IN INDIRA GANDHI WILDLIFE SANCTUARY
13.0441.57
28.01
13.91
3.47
175-500 Meter
500-1000 Meter
1000-1500 Meter
1500-2000 Meter
2000-2515 Meter
Figure1.6. Percent Area Distribution of Elevation in Indira Gandhi Wildlife
Sanctuary.
ELEVATION (Meters) AREA In sq km % AREA
175-500 Meter 125.21 13.04 500-1000 Meter 399.20 41.57 1000-1500 Meter 268.92 28.01 1500-2000 Meter 133.58 13.91 2000-2515 Meter 33.31 3.47 Total Geographic
Area 960.21 100.00
Table1.2. Distribution of Area under different Elevation categories in Indira
Gandhi Wildlife Sanctuary
Area Distribution of Elevation Categories (Meters)
RANGE 175-500 500-
1000 1000-1500 1500-2000
2000-2515
TOTAL AREA (sq km
) AMARAVATHI 56.16 100.20 28.82 13.49 2.67 201.34 MANAMBOLY 11.56 53.70 7.32 72.58 MANAMPALLY 53.82 11.90 0.66 66.38 POLACHI 41.82 49.36 16.46 0.26 107.90 UDUMALAIPETTAI 27.22 95.93 69.37 44.86 10.92 248.29 ULANDY 0.01 62.11 17.67 1.32 81.11 VALPARAI 0.02 150.44 106.34 68.31 19.73 344.83
Table1.3 Distribution of Area under different Elevation categories in different
range of Indira Gandhi Wildlife Sanctuary

13
RANGE Min Elevation
Max Elevation
Mean Elevation
AMARAVATHI 321.00 2351.00 1336.00 MANAMBOLY 526.00 1936.00 1231.00 MANAMPALLY 538.00 1643.00 1090.50 POLACHI 175.00 1632.00 948.93 UDUMALAIPETTAI 320.00 2261.00 1290.50 ULANDY 446.00 1737.00 1091.50 VALPARAI 560.00 2514.00 1537.00 AT SANCTUARY
LEVEL 175.86 2514.00 1120.77
Table 1.4 Elevation Description of different Range of Indira Gandhi Wildlife
Sanctuary
Slope:
Slope information was derived from high resolution Digital Elevation Model with
10 meter resolution. The whole sanctuary was classified in 5 slope categories on
the basis of Natural Breaks (Jenks) like 0-10 degree, 10-20 degree, 20-30
degree, 30-45 degree and 45-87.14 degree (Figure 1.7 & 1.8, Table 1.5, 1.6 &
1.7). Most of the sanctuary, 76.92 % area, is lies below 45 Degree slope. Slope
>47degree is in only in 4.56 % area of whole sanctuary and covering 43.77 sq
km. In Indira Gandhi Wildlife Sanctuary, 18 Degree slope having highest area
that is 32.28 sq km and 87.14 degree slope having lowest area that is 0.001.
Mean Slope of the sanctuary is 43.5 Degree.

14
VALPARAI
AMARAVATHI
UDUMALAIPETTAI
POLACHI
ULANDY
MANAMBOLY
MANAMPALLY
77°20'0"E
77°20'0"E
77°15'0"E
77°15'0"E
77°10'0"E
77°10'0"E
77°5'0"E
77°5'0"E
77°0'0"E
77°0'0"E
76°55'0"E
76°55'0"E
76°50'0"E
76°50'0"E
10°3
0'0"
N
10°3
0'0"
N
10°2
5'0"
N
10°2
5'0"
N
10°2
0'0"
N
10°2
0'0"
N
10°1
5'0"
N
10°1
5'0"
N
SLOPE MAP OF INDIRA GANDHI WILDLIFE SANCTUARY
0 3 61.5 Km
LegendSlope (Degree)
0-10
10-20
20-30
30-45
45-87
Water
Boundary of IGWLS
Range Boundary
Outside Sanctuary
INDIA
Participating Organizations
National Remote Sensing CentreForest Department, Tamil Nadu
Wildlife Institute of IndiaSurvey of India
Funding Agency
SC-B\NNRMS, MoEF, GoI
TAMIL NADU
Figure1.7. Slope Map of Indira Gandhi Wildlife Sanctuary

15
AREA DISTRIBUTION OF SLOPE IN INDIRA GANDHI WILDLIFE SANCTUARY
21.33
29.27
26.32
18.52
4.56
0-10 Degree
10-20 Degree
20-30 Degree
30-45 Degree
45-87 Degree
Figure1.8 Percent Area Distribution of Slope in Indira Gandhi Wildlife Sanctuary
SLOPE (Degree) AREA (sq km) % of AREA
0-10 204.80 21.33
10-20 281.08 29.27
20-30 252.77 26.32
30-45 177.79 18.52
45-87.14 43.77 4.56
Total Geographic
Area 960.21 100.00
Table1.5. Area Distribution Slope Categories in Indira Gandhi Wildlife Sanctuary
SLOPE (Degree) Range 0-10 10-20 20-30 30-45 45-87.14
TOTAL
AMARAVATHI 71.38 52.88 44.54 27.28 5.27 201.34 MANAMBOLY 13.07 25.78 19.24 10.77 3.73 72.58 MANAMPALLY 11.72 24.80 18.92 9.67 1.28 66.38 POLACHI 21.22 24.66 28.60 25.68 7.76 107.90 UDUMALAIPETTAI 42.52 69.20 67.54 53.98 15.05 248.29 ULANDY 20.77 29.99 18.58 10.33 1.44 81.11 VALPARAI 24.13 53.78 55.35 40.09 9.25 182.60
Table1.6. Area Distribution of Slope Categories in different Range of Indira
Gandhi Wildlife Sanctuary

16
RANGE Min Slope (Degree
Max Slope (Degree)
Mean Slope(Degree)
AMARAVATHI 0 86 43 MANAMBOLY 0 84 42 MANAMPALLY 0 76 38 POLACHI 0 86 43 UDUMALAIPETTAI 0 85 42.5 ULANDY 0 79 39.5 VALPARAI 0 87 43.5
AT Sanctuary Level 0 87 43.5
Table1.7. Slope Description of different Range of Indira Gandhi Wildlife
Sanctuary
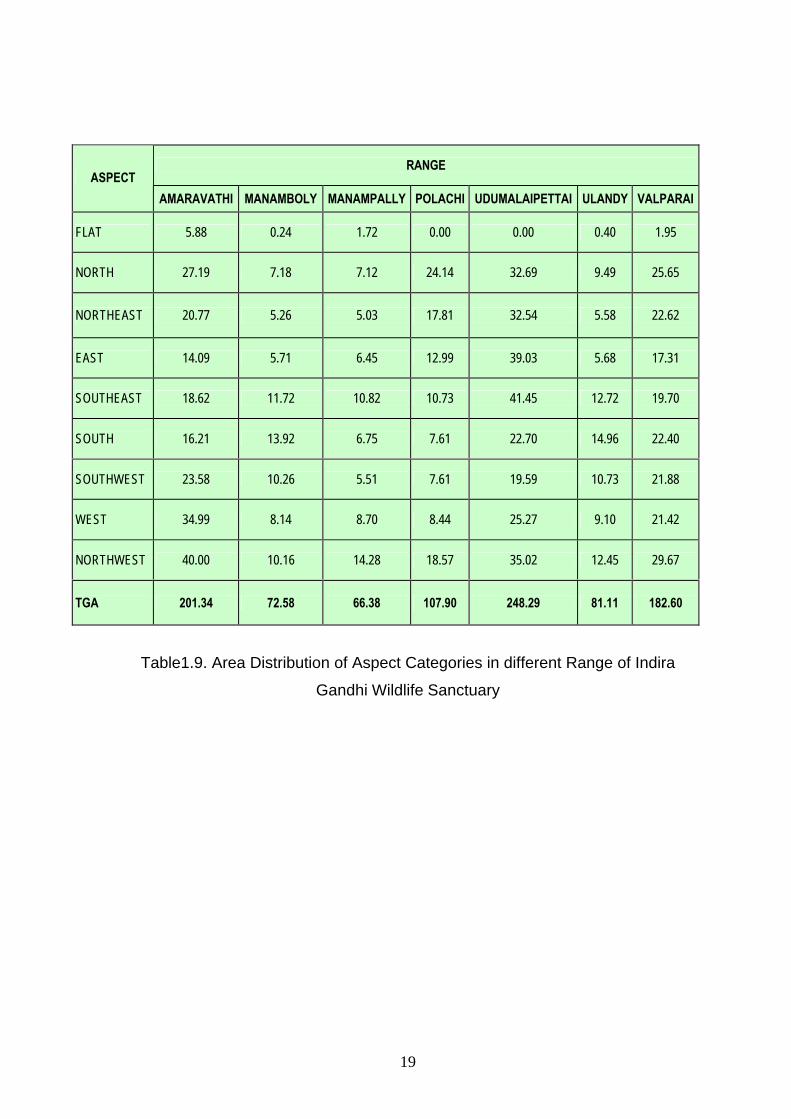
Aspect:
Slope information was derived from high resolution Digital Elevation Model with
10 meter resolution and eight classes were extracted as North, North-East, East,
South-East, South, South-West, West, and North-West (Figure 1.9 &1.10, Table
1.8 & 1.9). There is only 10.19 sq km area that having 0 degree slope means flat
surface. Slope is almost equally divided in all aspects except North-West
direction.

17
POTHAMADA BEAT
77°20'0"E
77°20'0"E
77°15'0"E
77°15'0"E
77°10'0"E
77°10'0"E
77°5'0"E
77°5'0"E
77°0'0"E
77°0'0"E
76°55'0"E
76°55'0"E
76°50'0"E
76°50'0"E
10°3
0'0"
N
10°3
0'0"
N
10°2
5'0"
N
10°2
5'0"
N
10°2
0'0"
N
10°2
0'0"
N
10°1
5'0"
N
10°1
5'0"
N
ASPECT MAP OF INDIRA GANDHI WILDLIFE SANCTUARY
0 3 61.5 Km
INDIA
Participating Organizations
National Remote Sensing CentreForest Department, Tamil Nadu
Wildlife Institute of IndiaSurvey of India
Funding Agency
SC-B\NNRMS, MoEF, GoI
TAMIL NADU
LegendFlatNorthNorth EastEastSouth EastSouthSouth WestWestNorth WestBoundary of IGWLSRange BoundaryOutside Sanctuary
Figure 1.9 Aspect Map of Indira Gandhi Wildlife Sanctuary

18
AREA DISTRIBUTION OF ASPECT IN INDIRA GANDHI WILDLIFE SANCTUARY
1.0613.90
11.42
10.55
13.10 10.89
10.32
12.09
16.68
FLAT
NORTH
NORTHEAST
EAST
SOUTHEAST
SOUTH
SOUTHWEST
WEST
NORTHWEST
Figure1.10. Percent Area Distribution of Aspect in Indira Gandhi Wildlife
Sanctuary
S. NO. Aspect AREA (sq
km)
% of
AREA
1 FLAT 10.19 1.06
2 NORTH 133.47 13.90
3 NORTHEAST 109.61 11.42
4 EAST 101.27 10.55
5 SOUTHEAST 125.77 13.10
6 SOUTH 104.56 10.89
7 SOUTHWEST 99.14 10.32
8 WEST 116.06 12.09
9 NORTHWEST 160.15 16.68
Total Geographic Area 960.21 100.00
Table1.8. Area Distribution Aspect Categories in Indira Gandhi Wildlife Sanctuary
19
Table1.9. Area Distribution of Aspect Categories in different Range of Indira
Gandhi Wildlife Sanctuary
RANGE ASPECT
AMARAVATHI MANAMBOLY MANAMPALLY POLACHI UDUMALAIPETTAI ULANDY VALPARAI
FLAT 5.88 0.24 1.72 0.00 0.00 0.40 1.95
NORTH 27.19 7.18 7.12 24.14 32.69 9.49 25.65
NORTHEAST 20.77 5.26 5.03 17.81 32.54 5.58 22.62
EAST 14.09 5.71 6.45 12.99 39.03 5.68 17.31
SOUTHEAST 18.62 11.72 10.82 10.73 41.45 12.72 19.70
SOUTH 16.21 13.92 6.75 7.61 22.70 14.96 22.40
SOUTHWEST 23.58 10.26 5.51 7.61 19.59 10.73 21.88
WEST 34.99 8.14 8.70 8.44 25.27 9.10 21.42
NORTHWEST 40.00 10.16 14.28 18.57 35.02 12.45 29.67
TGA 201.34 72.58 66.38 107.90 248.29 81.11 182.60

20
VALPARAI
AMARAVATHI
UDUMALAIPETTAI
POLACHI
ULANDY
MANAMBOLY
MANAMPALLY
77°20'0"E
77°20'0"E
77°15'0"E
77°15'0"E
77°10'0"E
77°10'0"E
77°5'0"E
77°5'0"E
77°0'0"E
77°0'0"E
76°55'0"E
76°55'0"E
76°50'0"E
76°50'0"E
10°3
0'0"
N
10°3
0'0"
N
10°2
5'0"
N
10°2
5'0"
N
10°2
0'0"
N
10°2
0'0"
N
10°1
5'0"
N
10°1
5'0"
N
DRAINAGE MAP OF INDIRA GANDHI WILDLIFE SANCTUARY
0 3 61.5 Km
INDIA
Participating Organizations
National Remote Sensing CentreForest Department, Tamil Nadu
Wildlife Institute of IndiaSurvey of India
Funding Agency
SC-B\NNRMS, MoEF, GoI
TAMIL NADU
Others
Water
Boundary of IGWLS
Range Boundary
Outside Sanctuary
River & River BanksWaterfalls
Legend
Canal & Canal Banks
1st Order Stream
2nd Order Stream
3rd Order Stream
4th & above Order Stream
Aqueduct on Canals
Figure1.11. Drainage Map of Indira Gandhi Wildlife Sanctuary.

21
Chapter - II
VEGETATION TYPE MAPPING
Forest type is defined as a unit of vegetation which possesses similar
characteristics of physiognomy, structure, function, floristic composition and
phenology influenced by climate and topography (Champion & Seth, 1968)). The
climatic and edaphic factors coupled with biotic disturbances in the study area
have given rise to a rich and varied flora. According to Champion & Seth, 1968
the forest types in the sanctuary were categorized into Tropical Evergreen,
Tropical Semi evergreen, Tropical moist mixed deciduous, tropical dry mixed
deciduous, Savannah-woodland forests and grasslands. An attempt has been
made to derive forest type information with reference to Champion and Seth
classification system using multi temporal satellite data and field species data
collected distributed over entire study area.
2.1 Methodology
IRS P6 LISS IV, IRS P6 LISS III satellite datasets of 2004 pertaining to
study area were procured from NRSC, Hyderabad. Remotely sensed data usually
contain both systematic and non systematic geometric errors. Some of the
important systematic errors are-scan skew, mirror scan velocity, panoramic
distortion, platform velocity, earth rotation, perspective, altitude, etc. Because of
these geometric errors, the satellite data immediately after acquisition is not
planimetrically true to the ground features.
Hence, in order to measure/estimate area from the satellite data it has to
be initially rectified from geometric errors and made planimetrically true to
available SOI topo maps. The systematic errors can be corrected through
analysis of sensors characteristics and ephemeris, these errors are corrected in
the preprocessing of data after initial data acquisition from satellite. However,
nonsystematic errors caused due to altitude (pitch, roll and yaw) can be corrected
only through the use of common Ground control points (GCP). A GCP is a point
on the surface of earth where both image coordinate and map coordinates can be
identified.

22
IRS P6 LISS III scenes were enhanced using linear contrast stretching and
histogram equalization to improve the image and help identify ground control
points in the rectification. Accordingly the coordinates of the GCPs on
georeference image data and the corresponding coordinates of the similar GCPs
on the raw satellite data have been used for transformation of the uncorrected
satellite data. This process of geometric correction of raw satellite data was
achieved using first order polynomial transformation fit. A nearest-neighbor
algorithm was used to perform the resampling procedure and the Image-to-Image
registrations, which yielded a root-mean-square error of 0.30 pixels for all data.
Images were projected to UTM projection and WGS84 datum using ERDAS
IMAGINE.
Image was enhanced using linear contrast stretching and histogram
equalization to improve the image and help to identify ground control points in the
rectification. These techniques expand the range of brightness values in an
image so that the image can be efficiently displayed in a manner desired by the
interpreter/analysts. It has also been noticed that the identification of different
forest type / density classes need thorough understanding in the field as well as
with the image signatures. After keen observation of certain known areas of
different forest categories, one can decide the optimum stretching parameters to
identify different land use / land cover including forest categories correctly. Using
such optimum stretching parameters, standard False Colour Composites (FCCs)
are to be generated for ground truth collection.
Color composites of different bands can yield varied levels of information
due to diverse reflectance pattern in bands. Mosaicing of satellite data,
corresponding to the study area was done. By using Wildlife Sanctuary boundary
as mask, study area has been extracted from IRS P6 LISS-III and LISS-IV
scenes (Figure 2). The ancillary data were from field (using GPS) and the Survey
of India (SOI) toposheets of 1:50,000 scale.
Standard FCC imagery generated by combining band 3, 2, and 1. In the
Image, the forests are appear in dark red to light red tone. The richness of the red
indicates the vigour of the leaves and their sizes. Patches of light red mottled

23
tones represent degraded forests and scrub vegetation. The light greenish to
white tones are barren lands. Water bodies were indicated in blue and black
tones. Supervised classification procedures are the most important analytical
tools used for the extraction of more information from remotely sensed digital
image data.
Prior to this, field inventory details and on the basis of tone, texture, colour,
spectral reflectance pattern, homogenous training sites for classification identified
on the satellite image. The mapping of vegetation and land cover was done at 1:
25,000 scale.

24
77°20'0"E
77°20'0"E
77°15'0"E
77°15'0"E
77°10'0"E
77°10'0"E
77°5'0"E
77°5'0"E
77°0'0"E
77°0'0"E
76°55'0"E
76°55'0"E
76°50'0"E
76°50'0"E
10°3
0'0"
N
10°3
0'0"
N
10°2
5'0"
N
10°2
5'0"
N
10°2
0'0"
N
10°2
0'0"
N
10°1
5'0"
N
10°1
5'0"
N
IRS P6 LISS IV FALSE COLOUR COMPOSITE IMAGE OF INDIRA GANDHI WILDLIFE SANCTUARY
0 2.5 51.25 Km
INDIA
Participating Organizations
National Remote Sensing CentreForest Department, Tamil Nadu
Wildlife Institute of IndiaSurvey of India
Funding Agency
SC-B\NNRMS, MoEF, GoI
TAMIL NADU
Legend
Boundary of IGWLS
Figure2.1. False Colour Composite Image of Indira Gandhi Wildlife Sanctuary

25
The vegetation type map has been prepared using IRS P6 LISS III and IRS P6
LISS IV satellite data of 2004 (Figure2.1). Care was taken in selection of optimal
season data to delineate moist and dry vegetation formations, with reference to
phenology (green wave and brown wave).
As per Transformed Divergence, best separability for vegetation classes are
achieved using IRS LISS IV data. According the overall accuracy assessment
also IRS LISS IV data classification along with MIR band of LISS III provides
good results. Classification Accuracy was assessed as 93.4%.
Revised classification system of forest types of India prepared by Champion and
Seth (1968) was consulted for mapping of forest types.
LEVEL 1 LEVEL 2 LEVEL 3
Code GROUP (16) SUBGROUP (20)
UNDER SUBGROUP (69 SUBTYPES)
1 TROPICAL WET EVERGREEN FORESTS
1A: Southern tropical wet evergreen
forests
C4 West tropical evergreen forest
C2 West Coast semievergreen forest
2 TROPICAL SEMI EVERGREEN FORESTS
2A: Southern tropical
semievergreen forests
C2: Southern moist mixed deciduous forests
3 TROPICAL MOIST DECIDUOUS FORESTS
3B: South Indian moist deciduous
forests
C3: Southern dry mixed deciduous forest
4 TROPICAL DRY DECIDUOUS FORESTS
5A: Southern tropical dry deciduous
forests
5 SUBTROPICAL BROADLEAVED FOREST
8A: Southern subtropical broadleaved hill forests
C1: Nilgiri subtropical hill forest (shola)
6 Savannah-Woodland 7 Degraded Forest 8 Scrub 9 Grassland
Table 2.1 Forest types of Indira Gandhi Wildlife sanctuary (Champion and Seth,
1968)

26
Of the 10 natural vegetation types, Savannah-woodland, degraded forest, scrub
and grassland are successional/degradational or edaphic types.
Figure2.2. Vegetation types in Indira Gandhi Wildlife Sanctuary

27
2.2 Results and Discussion
The land cover classes classified into 15 categories and area of each class has
been calculated (Table:2.2 ; Figure 2.3). The sanctuary is characterized by two
distinct vegetation zones, wet zone and dry zone. The wet zone is dominated by
evergreen forest and Grasslands.
Of the nine natural vegetation types, moist deciduous forests occupy higher area
followed by semi-evergreen, savannah-woodland and evergreen forests. There
are four plantations were found in the sanctuary, viz. teak, eucalyptus, tea and
cinchona.
IRS –LISS IV satellite data used for Forest and Land Use mapping provided the
advantage of deriving spatial details with better delineation. On the other hand
the temporal satellite data of IRS LISS-III and AWiFS have further provided
information on delineation of phenological formations like evergreen and
deciduous formations, grasslands. The satellite image showing, different forest
types as seen by satellite data are shown in figure2.3.
Owing to the spatial and temporal variations in rainfall and high degree of
topographic variations, the sanctuary exhibits diverse vegetation types. The
forest types include mixed species formations of evergreen and deciduous
forests, ecological unique formations like shoals and grasslands, typical
edaphically controlled, low rainfall and disturbed formations like savanna
woodlands, degraded forests and scrub areas.
28
VALPARAI RANGE
UDUMALAIPETTAI RANGE
AMARAVATHI RANGE
POLACHI RANGE
ULANDY RANGE
MANAMBOLY RANGE
MANAMPALLY RANGE
77°20'0"E
77°20'0"E
77°15'0"E
77°15'0"E
77°10'0"E
77°10'0"E
77°5'0"E
77°5'0"E
77°0'0"E
77°0'0"E
76°55'0"E
76°55'0"E
76°50'0"E
76°50'0"E10
°30'
0"N
10°3
0'0"
N
10°2
5'0"
N
10°2
5'0"
N
10°2
0'0"
N
10°2
0'0"
N
10°1
5'0"
N
10°1
5'0"
N
FOREST TYPE & LAND-USE MAP OF INDIRA GANDHI WILDLIFE SANCTUARY
0 3 61.5 Km
INDIA
Participating Organizations
National Remote Sensing CentreForest Department, Tamil Nadu
Wildlife Institute of IndiaSurvey of India
Funding Agency
SC-B\NNRMS, MoEF, GoI
TAMIL NADU
LegendForest Type
Degraded Forest
Dry Deciduous
Evergreen
Moist Deciduous
Savannah-Woodland
Semievergreen
Shola
Non-Forest
Plantations
Administrative UnitsBoundary of IGWLSRange BoundaryOutside Sanctuary
Barren landGrasslandScrub
Water
Cinchona PlantationEucalyptus PlantationTea PlantationTeak Plantation
Figure2.3. Forest Vegetation type and Land-Use map of Indira Gandhi Wildlife Sanctuary

29
S. NO. VEGETATION TYPE AREA ( sq km ) % of AREA
1 Evergreen 101.22 10.55 2 Semi evergreen 156.72 16.34 3 Moist Deciduous 324.76 33.85 4 Dry Deciduous 63.03 6.57 5 Shola 22.31 2.33 6 Savannah-Woodland 109.85 11.45 7 Degraded Forest 51.11 5.33 8 Scrub 71.14 7.41 9 Grassland 16.05 1.67
10 Teak Plantation 9.06 0.94 11 Eucalyptus Plantation 6.72 0.70 12 Tea Plantation 3.16 0.33 13 Cinchona Plantation 1.83 0.19 14 Barren land 10.81 1.13 15 Water 11.58 1.21
Total Geographic Area 959.36 100.00
Table: 2.2 - Area Statistics of Vegetation cover types in Indira Gandhi Wildlife Sanctuary (Area in sq.km)
AREA DISTRIBUTION OF FOREST TYPE & LANDUSE IN INDIRA GANDHI WILDLIFE SANCTUARY
10.55
16.34
33.856.57
2.33
11.45
5.337.41
1.67
1.13
1.21
1.64
0.52
Evergreen
Semievergreen
Moist Deciduous
Dry Deciduous
Shola
Savannah-Woodland
Degraded Forest
Scrub
Grassland
Barren land
Water
Forest Plantations
Agricultural Plantation
Figure2.4 Percent Area Distribution of Vegetation type and Land-Use in Indira
Gandhi Wildlife Sanctuary

30
At sanctuary level, evergreen/semi evergreen formations together constitute
26.89% of the sanctuary area and moist deciduous formations constitute 33.85%
of the total area.
Percentage Area Distribution of Different Forest Types in Different Ranges
0.00
10.00
20.00
30.00
40.00
50.00
60.00
70.00
Evergreen,Semievergreen
MoistDeciduous, Dry
Deciduous
Grassland,Shola
Savannah-Woodland,Degraded
Forest, Scrub
% a
rea
of T
otal
Geo
grap
hic
Are
a of
Ran
ge
Polachi Range
UdumalaipettaiRangeUlandy Range
Valparai Range
Manampally Range
Amaravathi Range
Manamboly Range
Figure2.5. Percent area Distribution of Different forest types in different ranges.
The evergreen and deciduous formations are prevalent in western and eastern
parts of the sanctuary respectively as there exists significant less rainfall in
eastern parts of the sanctuary. The percentage distribution of mixed species
formations (evergreen and deciduous), ecological unique formations and
disturbed formations in different ranges are given in Table2.2 and figures 2.4 &
2.5.Manamboly,Manampally,and Valparai, are the ranges having higher
evergreen formations. On the other hand the disturbed formations like savanna
wood lands, degraded forests and scrub are high in Polachi, Amaravathi, and
Udumalaipettai ranges. The range wise forest type and land use maps are given
in Figures-2.6 to 2.12.

31
S. No. VEGETATION TYPE POLACHI UDUMALAIPETTAI ULANDY VALPARAI 1 Evergreen 7.29 16.99 11.39 25.48 2 Semievergreen 7.97 34.37 17.07 41.65 3 Moist Deciduous 36.47 93.52 28.24 49.86 4 Dry Deciduous 6.23 21.58 1.18 3.49 5 Shola 8.87 13.44 6 Savannah-Woodland 17.20 25.71 10.75 18.23 7 Degraded Forest 9.33 15.56 0.68 2.54 8 Scrub 16.49 25.33 1.76 8.23 9 Grassland 0.04 2.45 0.02 13.32 10 Tea Plantation 0.31 11 Cinchona Plantation 12 Eucalyptus Plantation 5.48 13 Teak Plantation 8.60 14 Barren land 1.21 3.84 0.93 3.33 15 Water 0.07 0.02 0.40 2.19 Total Geographic Area (sq.
km.) 107.78 248.26 81.03 182.08
Table2.3.1. Range wise area distribution of Vegetation & Land-Use type of Indira Gandhi Wildlife Sanctuary (Area in sq km)
S. No. VEGETATION TYPE 1 Evergreen 2 Semievergreen 3 Moist Deciduous 4 Dry Deciduous 5 Shola 6 Savannah-Woodland 7 Degraded Forest 8 Scrub 9 Grassland
10 Tea Plantation 11 Cinchona Plantation 12 Eucalyptus Plantation 13 Teak Plantation 14 Barren land 15 Water
Total Geographic Area (sq. km.)

32
MANAMPALLY AMARAVATHI MANAMBOLY 15.59 4.11 20.38 16.48 13.74 25.42 21.78 77.80 17.08 3.55 26.91 0.08
3.89 32.36 1.72 0.42 21.52 1.05 1.71 17.41 0.22
0.03 0.20 2.85 1.83 1.24
0.45 0.67 0.53 0.29 1.78 6.92 0.20
66.31 201.31 72.57
Table2.3.2. Range wise area distribution of Vegetation & Land-Use type of Indira
Gandhi Wildlife Sanctuary (Area in sq km)

33
ANALI BEAT
MANAMPALLI BEAT
SHEIKALMUDI BEAT
URULIKAL BEAT
76°57'0"E76°54'0"E
76°54'0"E
76°51'0"E
76°51'0"E
10°2
4'0"
N
10°2
4'0"
N
10°2
1'0"
N
10°2
1'0"
N
FOREST TYPE & LAND-USE MAP OF MANAMPALLY RANGE OF INDIRA GANDHI WILDLIFE SANCTUARY
0 1 20.5 Km
Participating Organizations
National Remote Sensing CentreForest Department, Tamil Nadu
Wildlife Institute of IndiaSurvey of India
Funding Agency
SC-B\NNRMS, MoEF, GoI
Indira Gandhi Wildlfe SanctuaryTamil NaduIndia
LegendForest Type
Non-Forest
Plantation
Administrative Units
Range Boundary
Beat Boundaries
Teak
Degraded Forest
Dry Deciduous
Evergreen
Moist Deciduous
Savannah-Woodland
Semievergreen
Barren land
Grassland
Scrub
Water
Figure 2.6 Forest Type and Land-Use Map of Manampally Range

34
PERIYA KALLAR BEAT
CHINNAKALLAR BEAT
77°3'0"E
77°3'0"E
77°0'0"E
77°0'0"E
76°57'0"E
76°57'0"E
10°1
8'0"
N
10°1
8'0"
N
10°1
5'0"
N
10°1
5'0"
N
FOREST TYPE & LAND-USE MAP OF MANAMBOLY RANGE OF INDIRA GANDHI WILDLIFE SANCTUARY
0 1 20.5 Km
IndiaTamil Nadu
Indira Gandhi Wildlfe Sanctuary
Participating Organizations
National Remote Sensing CentreForest Department, Tamil Nadu
Wildlife Institute of IndiaSurvey of India
Funding Agency
SC-B\NNRMS, MoEF, GoI
Non-Forest
Administrative UnitsRange BoundaryBeat Boundaries
Barren land Grassland Scrub
Water
LegendForest Type
PlantationsDegraded Forest
Dry Deciduous
Evergreen
Moist Deciduous
Savannah-Woodland
Semievergreen
Cinchona Plantation Eucalyptus Plantation Tea Plantation
Figure 2.7 Forest Type and Land-Use Map of Manamboly Range

35
ALIYAR BEAT
VILLONNIE BEAT
MANGARAI BEAT
ARTHANRIPALAYAM BEAT
PACHATHANNIR BEAT
POTHAMADA BEAT
AYIRAMKAL BEAT
77°0'0"E
77°0'0"E
76°55'0"E
76°55'0"E
76°50'0"E
76°50'0"E
10°3
0'0"
N
10°3
0'0"
N
10°2
5'0"
N
FOREST TYPE & LAND-USE MAP OF POLACHI RANGE OF INDIRA GANDHI WILDLIFE SANCTUARY
0 1 20.5 Km
IndiaTamil Nadu
Indira Gandhi Wildlfe Sanctuary Participating Organizations
National Remote Sensing CentreForest Department, Tamil Nadu
Wildlife Institute of IndiaSurvey of India
Funding Agency
SC-B\NNRMS, MoEF, GoI
Legend
Non- Forest
Administrative Units
Barren land
Grassland
Scrub
Water
Range Boundary
Beat Boundaries
Forest Types
Degraded Forest
Dry Deciduous
Moist Deciduous
Savannah-Woodland
Semievergreen
Plantation
Eucalyptus
Evergreen
Figure 2.8 Forest Type and Land-Use Map of Polachi Range

36
KOMBU WEST BEATKARATTUR BEAT
EASAL THITTU EAST BEATTHIRUMURTHI MALAI BEAT
KURUMALAI BEAT
EASAL THITTU WEST BEAT
VALLAKONDAPURAM BEAT
KARATTUR BEAT
PARUTHIYUR BEAT
77°18'0"E77°15'0"E77°12'0"E
77°12'0"E
77°9'0"E
77°9'0"E
77°6'0"E
77°6'0"E
77°3'0"E
77°3'0"E77°0'0"E
10°3
0'0"
N
10°3
0'0"
N
10°2
7'0"
N
10°2
7'0"
N
10°2
4'0"
N
10°2
4'0"
N
10°2
1'0"
N
10°2
1'0"
N
FOREST TYPE & LAND-USE MAP OF UDUMALAIPETTAI RANGE OF INDIRA GANDHI WILDLIFE SANCTUARY
0 1 20.5 Km
Participating Organizations
National Remote Sensing CentreForest Department, Tamil Nadu
Wildlife Institute of IndiaSurvey of India
Funding Agency
SC-B\NNRMS, MoEF, GoI
India
Tamil Nadu
Indira Gandhi Wildlfe Sanctuary
Legend
Forest Types
Non-Forest
Administrative Units
Degraded Forest
Dry Deciduous
Evergreen
Moist Deciduous
Savannah-Woodland
Semievergreen
Shola
Barren land
Grassland
Scrub
Water
Range Boundary
Beat Boundaries
Figure 2.9 Forest Type and Land-Use Map of Udumalaipettai Range
37
TOPSLIP BEAT
VARAGALIYAR BEAT
CHINNAR BEAT
76°57'0"E
76°57'0"E
76°54'0"E
76°54'0"E
76°51'0"E
76°51'0"E
10°3
0'0"
N10
°27'
0"N
10°2
7'0"
N
10°2
4'0"
N
10°2
4'0"
N
FOREST TYPE & LAND-USE MAP OF ULANDY RANGE OF INDIRA GANDHI WILDLIFE SANCTUARY
0 1 20.5 Km
Participating Organizations
National Remote Sensing CentreForest Department, Tamil Nadu
Wildlife Institute of IndiaSurvey of India
Funding Agency
SC-B\NNRMS, MoEF, GoI
India Tamil Nadu Indira Gandhi Wildlfe Sanctuary
LegendNon-Forest
Plantations
Administrative Units
Scrub Grassland Barren land Water
Teak Plantation
Range BoundaryBeat Boundary
Forest TypeEvergreen Semievergreen
Moist Deciduous
Dry Deciduous
Savannah-Woodland
Degraded Forest
Figure 2.10 Forest Type and Land-Use Map of Ulandy Range

38
IYERPADI BEAT
GRASSHILLS BEAT
AKKAMALAI BEAT
UPPER ALIYAR BEAT
ATTAKATTY BEAT
KAVURKAL BEAT
ATTAKATTY BEAT
77°5'0"E
77°5'0"E
77°0'0"E
77°0'0"E10
°25'
0"N
10°2
5'0"
N
10°2
0'0"
N
10°2
0'0"
N
10°1
5'0"
N
FOREST TYPE & LAND-USE MAP OF VALPARAI RANGE OF INDIRA GANDHI WILDLIFE SANCTUARY
0 1 20.5 Km
INDIA
TAMIL NADU
Participating Organizations
National Remote Sensing CentreForest Department, Tamil Nadu
Wildlife Institute of IndiaSurvey of India
Funding Agency
SC-B\NNRMS, MoEF, GoI
INDIRA GANDHI WLS
LegendForest Type
Degraded Forest
Dry Deciduous
Evergreen
Moist Deciduous
Savannah-Woodland
Semievergreen
Shola
Non- Forest
Barren land
Grassland
Scrub
Water
PlantationsTea Plantation
Administrative Units
Range Boundary
Beat Boundary
Figure 2.11 Forest Type and Land-Use Map of Valparai Range
39
TALINGI BEAT
KALLAPURAM BEAT
KOMBU EAST BEAT
MANJANPATTI BEAT
KILANAVAYAL BEAT
77°20'0"E
77°20'0"E
77°15'0"E
77°15'0"E
10°2
5'0"
N
10°2
5'0"
N
10°2
0'0"
N
10°2
0'0"
N
10°1
5'0"
N
10°1
5'0"
N
FOREST TYPE & LAND-USE MAP OF AMRAVATHI RANGE OF INDIRA GANDHI WILDLIFE SANCTUARY
0 1 20.5 Km
Legend
Administrative Units
Non- Forest
Forest TypeEvergreen Semievergreen
Moist Deciduous
Dry Deciduous Savannah-Woodland Degraded Forest
Scrub Grassland
Barren land Water
Range BoundaryBeat Boundaries
INDIA
TAMIL NADU
Participating Organizations
National Remote Sensing CentreForest Department, Tamil Nadu
Wildlife Institute of IndiaSurvey of India
Funding Agency
SC-B\NNRMS, MoEF, GoI
INDIRA GANDHI WLS
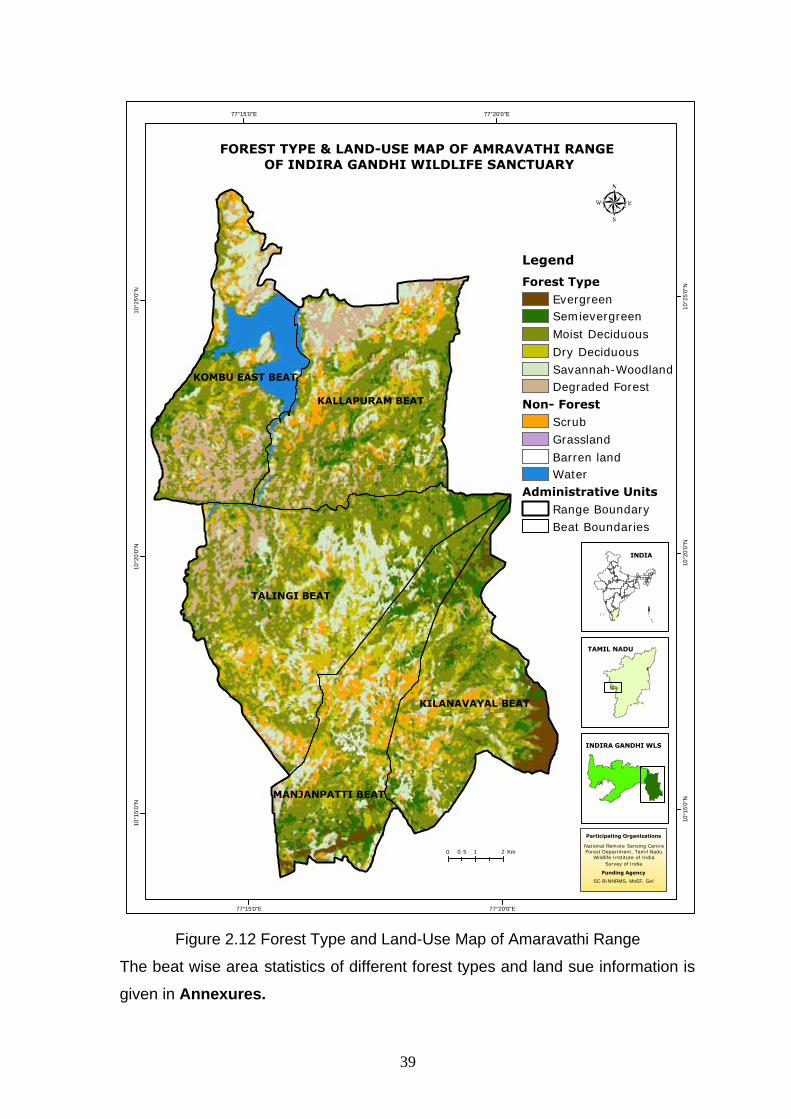
Figure 2.12 Forest Type and Land-Use Map of Amaravathi Range
The beat wise area statistics of different forest types and land sue information is
given in Annexures.

40
Chapter - III
FOREST CROWN DENSITY MAPPING
Crown density is the percentage of crown area where sunlight is blocked by
crown branches, foliage, and reproductive structures. Crown density estimates
crown condition relative to a typical tree for the site. Density also serves as an
indicator of future growth. High-density ratings (greater than 40 percent) indicate
a full, healthy, crown. Crown density is one of the primary inputs for the forest
working plan preparation.
The Crown Density data set provide an input to generation of stratification base
to understand the variability of growing stock at different forest beats and helps in
optimally designing the ground inventory for growing stock assessment.
3.1 Methodology
The crown density has been mapped at 1:25,000 scale using IRS P6 LISS IV
data with a spatial resolution of 5.6m. NDVI method is adopted for base level
information. five density classes were mapped using on screen visual
interpretation method (Very dense forest: >80%; Moderately Dense: 60-80%;
Dense forest 40-60%; Open forest 20-40%; Degraded forest with canopy 20%
canopy). (Figure3.2).

41
Figure3.1. Methodology Flow chart for Forest Type, Density & Bio-Richness
Maps
3.2 Results and Discussion
Spatial information on Forest crown density was generated using IRS-LISS IV
satellite data. The forest crown density map of the sanctuary and different ranges
is shown in figures 3.2 & 3.6 to 3.12. Range wise area statistic is given in
table3.3.1 & 3.3.2 and in figure3.5. The area statistics and distribution of different
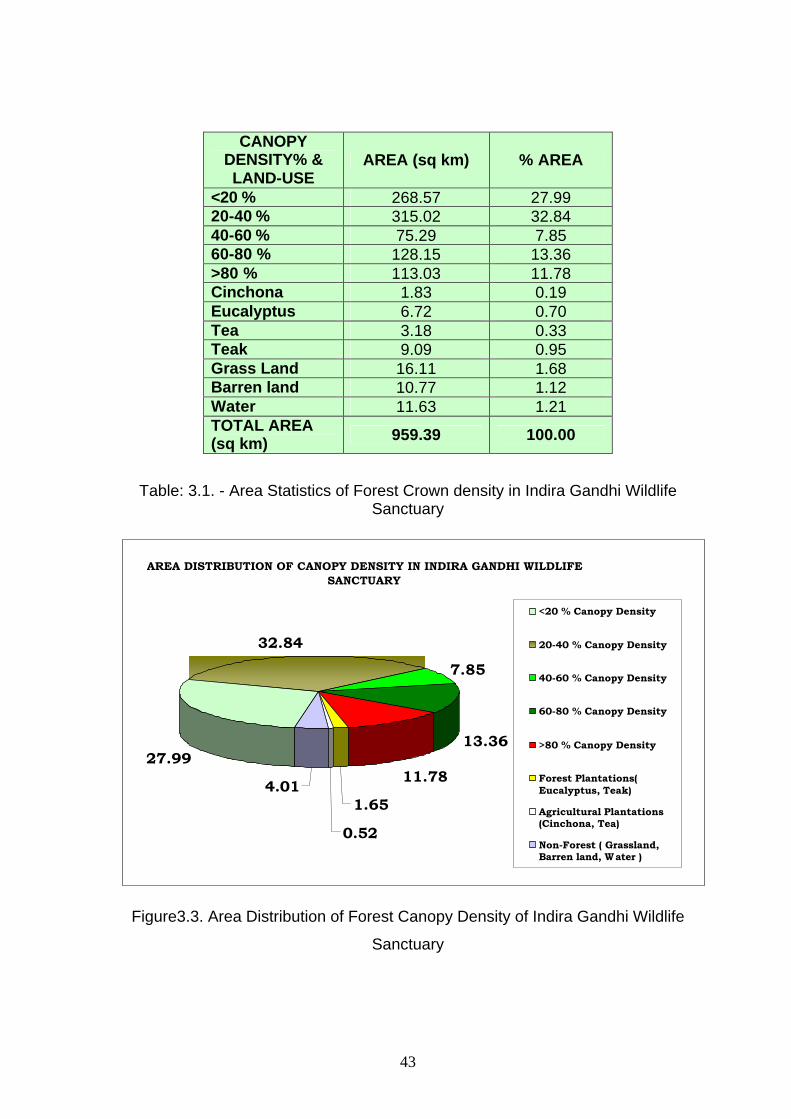
forest crown density classes at sanctuary level is given in table 3.1 and figure3.3.
93.78% of the sanctuary area is under forest cover, with 27.99% under >20%
crown density and 32.8% under 20-40% crown density. It may be noted that
forest and agriculture plantations covering 4.01% were not considered under
crown density delineation. The remaining area is found under grasslands, water
and barren areas. Of the five density classes, 20-40% crown class occupies
32.84% of total sanctuary area and 11.78 % area of the sanctuary, having >80
crown density. Amaravathi Range having highest area below <40% followed by
Polachi and then Udumalaipettai Range. Manamboly, Manampally and Valparai
Ranges having more area under category of >80% then other ranges. The
sanctuary has 583.58 sq km area is under <40 % canopy density, 60.83 % of
total geographic area of sanctuary, and 316.47 sq km area is under category >40
% canopy density, 32.99 % of total geographic area of sanctuary. Area statistics
of percent area and total area under < 40 % canopy density and >40 % canopy
density is given in table3.2 and figure3.4.
Topographic Thematic Mapping IRS-P6- L-IV
Slope, Aspect & Elevation, Drainage Road, Settlements. Fire lines Water body
Forest Density Maps – 5 classes (<.2 .2-.4, .4-.6, .6-.8 and > .8) Forest Type maps based on Champion & Seth’s
Phytosociological Analysis (stratified random transects )- Veg. composition Animal/ Avian Density Assessment
Field Data
Forest Type, Density & Bio-Richness Maps

42
VALPARAI RANGE
UDUMALAIPETTAI RANGE
AMARAVATHI RANGE
POLACHI RANGE
ULANDY RANGE
MANAMBOLY RANGE
MANAMPALLY RANGE
77°20'0"E
77°20'0"E
77°15'0"E
77°15'0"E
77°10'0"E
77°10'0"E
77°5'0"E
77°5'0"E
77°0'0"E
77°0'0"E
76°55'0"E
76°55'0"E
76°50'0"E
76°50'0"E
10°3
0'0"
N
10°3
0'0"
N
10°2
5'0"
N
10°2
5'0"
N
10°2
0'0"
N
10°2
0'0"
N
10°1
5'0"
N
10°1
5'0"
N
FOREST CANOPY DENSITY & LAND-USE MAP OF INDIRA GANDHI WILDLIFE SANCTUARY
0 3 61.5 Km
Legend
Administrative UnitsBoundary of IGWLSRange BoundaryOutside Sanctuary
Non- ForestGrass LandBarren landWater
Forest Canopy Density<20 % 20-40 %40-60 % 60-80 % >80 %
Plantations
Teak Tea Eucalyptus Cinchona
INDIA
Participating Organizations
National Remote Sensing CentreForest Department, Tamil Nadu
Wildlife Institute of IndiaSurvey of India
Funding Agency
SC-B\NNRMS, MoEF, GoI
TAMIL NADU
Figure3.2. Forest Canopy Density Map of Indira Gandhi Wildlife Sanctuary
43
CANOPY DENSITY% & LAND-USE
AREA (sq km) % AREA
<20 % 268.57 27.99 20-40 % 315.02 32.84 40-60 % 75.29 7.85 60-80 % 128.15 13.36 >80 % 113.03 11.78 Cinchona 1.83 0.19 Eucalyptus 6.72 0.70 Tea 3.18 0.33 Teak 9.09 0.95 Grass Land 16.11 1.68 Barren land 10.77 1.12 Water 11.63 1.21 TOTAL AREA (sq km) 959.39 100.00
Table: 3.1. - Area Statistics of Forest Crown density in Indira Gandhi Wildlife Sanctuary
AREA DISTRIBUTION OF CANOPY DENSITY IN INDIRA GANDHI WILDLIFE SANCTUARY
27.99
32.84
7.85
13.36
11.78
1.65
0.52
4.01
<20 % Canopy Density
20-40 % Canopy Density
40-60 % Canopy Density
60-80 % Canopy Density
>80 % Canopy Density
Forest Plantations(Eucalyptus, Teak)
Agricultural Plantations(Cinchona, Tea)
Non-Forest ( Grassland,Barren land, Water )
Figure3.3. Area Distribution of Forest Canopy Density of Indira Gandhi Wildlife
Sanctuary

44
Percentage Area of Canopy Density of Different Range
0.00
10.00
20.00
30.00
40.00
50.00
60.00
70.00
80.00
90.00
Canopy Density <40 % Canopy Density >40 %
% A
rea
of T
otal
Geo
grap
hic
Are
a of
Ran
ge
Polachi Range
Udumalaipettai Range
Ulandy Range
Valpara Rangei
Manampally Range
Amaravathi Range
Manamboly Range
Figure 3.4 Area Distribution of Canopy Density in different Ranges under <40% canopy Density and >40 % canopy Density
Density Classes
Total Area under Canopy Density (sq km ) % of Area
Range <40 % Canopy D
>40% Canopy D
<40 % Canopy D
>40% Canopy D
Polachi 81.92 19.06 81.13 18.87
Udumalaipettai 167.62 74.34 69.28 30.72
Ulandy 42.78 28.27 60.21 39.79
Valparai 79.86 83.02 49.03 50.97
Manampally 28.70 34.71 45.27 54.73
Amaravathi 162.55 31.29 83.86 16.14
Manamboly 20.14 45.79 30.55 69.45
Table3.2.Area Distribution of Canopy Density in different Ranges under <40% canopy Density and >40 % canopy Density

45
Area Distribution of Forest Canopy Density in Different Ranges
0.00
10.00
20.00
30.00
40.00
50.00
60.00
<20 % 20-40 % 40-60 % 60-80 % >80 %Forest Canopy Density
% A
rea
of C
anop
y D
ensi
ty
POLACHI
UDUMALAIPETTAI
ULANDY
VALPARAI
MANAMPALLY
AMARAVATHI
MANAMBOLY
Figure3.5 Area Distribution of different Forest Canopy Density Categories in
Different Ranges
CANOPY DENSITY% & LAND-
USE POLACHI UDUMALAIPETT
AI ULANDY
<20 % 52.75 79.30 15.59 20-40 % 29.17 88.32 27.19 40-60 % 7.98 24.21 1.64 60-80 % 6.94 26.88 16.20 >80 % 4.13 23.25 10.43 Cinchona Eucalyptus 5.48 Tea Teak 8.63 Grass Land 0.04 2.46 0.02 Barren land 1.21 3.83 0.93 Water 0.07 0.02 0.40
TOTAL AREA (sq km) 107.78 248.27 81.04
Table3.3.1 Range wise Forest Crown density distribution

46
CANOPY
DENSITY% & LAND-USE
VALPARAI
MANAMPALLY
AMARAVATHI
MANAMBOLY
<20 % 34.57 7.13 75.11 4.12 20-40 % 45.29 21.58 87.44 16.03 40-60 % 11.86 3.68 14.67 11.25 60-80 % 35.13 15.63 12.41 14.95 >80 % 36.03 15.40 4.21 19.59 Cinchona 1.83 Eucalyptus 1.24 Tea 0.31 2.87 Teak 0.46 Grass Land 13.36 0.03 0.21 Barren land 3.32 0.67 0.53 0.29 Water 2.21 1.79 6.93 0.21 TOTAL AREA (sq
km) 182.08 66.32 201.32 72.57
Table3.3.2. Range wise Forest Crown density distribution

47
TALINGI BEAT
KALLAPURAM BEAT
KOMBU EAST BEAT
MANJANPATTI BEAT
KILANAVAYAL BEAT
77°20'0"E
77°20'0"E
77°15'0"E
77°15'0"E
10°2
5'0"
N
10°2
5'0"
N
10°2
0'0"
N
10°2
0'0"
N
10°1
5'0"
N
10°1
5'0"
N
FOREST CANOPY DENSITY & LAND-USE MAP OF AMRAVATHI RANGE OF INDIRA GANDHI WILDLIFE SANCTUARY
0 1 20.5 Km
Legend
Forest Canopy Density
Non-Forest
Administrative Units
Beat Boundaries
Range Boundary
Water
Barren land
Grass Land
>80 %
60-80 %
40-60 %
20-40 %
<20 %
INDIA
TAMIL NADU
Participating Organizations
National Remote Sensing CentreForest Department, Tamil Nadu
Wildlife Institute of IndiaSurvey of India
Funding Agency
SC-B\NNRMS, MoEF, GoI
INDIRA GANDHI WLS
Figure3.6 Forest Canopy Density and Land-Use Map of Amaravathi Range
48
ANALI BEAT
MANAMPALLI BEAT
SHEIKALMUDI BEAT
URULIKAL BEAT
76°57'0"E
76°57'0"E
76°54'0"E
76°54'0"E
76°51'0"E
76°51'0"E
10°2
4'0"
N
10°2
4'0"
N
10°2
1'0"
N
10°2
1'0"
N
FOREST CANOPY DENSITY & LAND-USE MAP OF MANAMPALLY RANGE OF INDIRA GANDHI WILDLIFE SANCTUARY
0 1 20.5 Km
LegendForest Canopy Density
20-40 %
40-60 %
60-80 %
<20 %
>80 %
Non-Forest
Barren land
Grass Land
Water
Plantation
Teak
Administrative Units
Range Boundary
Beat Boundaries
Participating Organizations
National Remote Sensing CentreForest Department, Tamil Nadu
Wildlife Institute of IndiaSurvey of India
Funding Agency
SC-B\NNRMS, MoEF, GoI
Indira Gandhi Wildlfe SanctuaryTamil NaduIndia
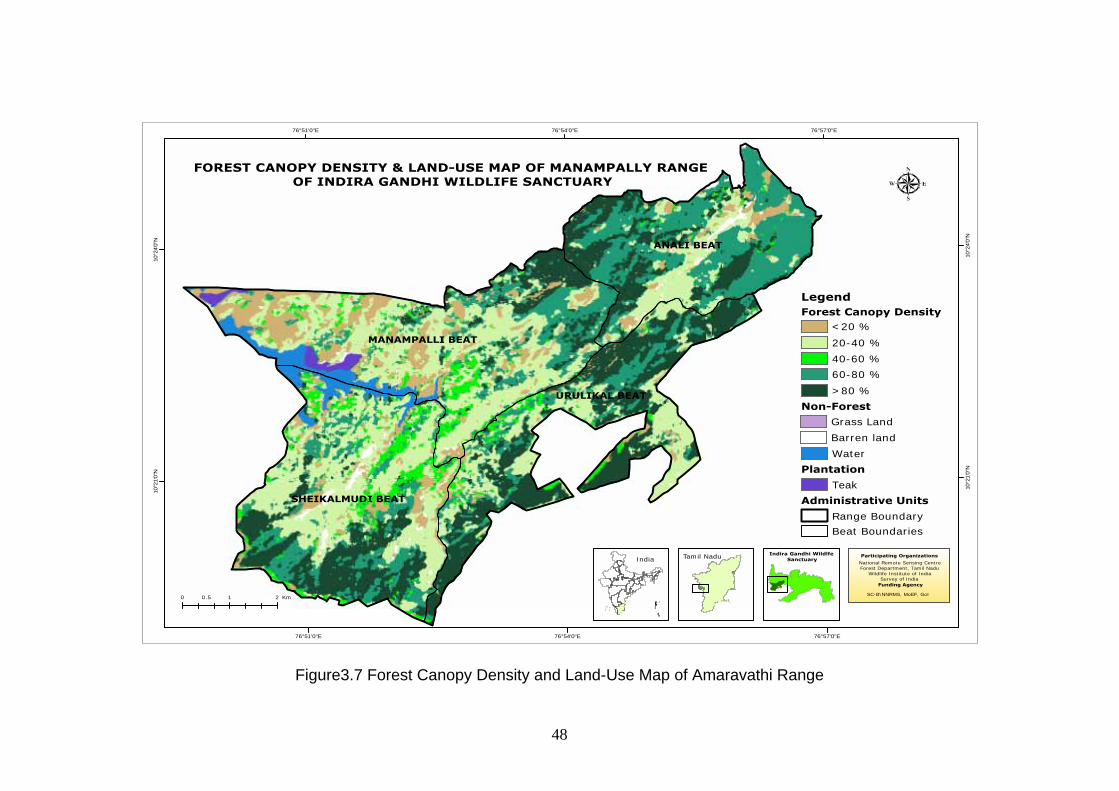
Figure3.7 Forest Canopy Density and Land-Use Map of Amaravathi Range
49
PERIYA KALLAR BEAT
CHINNAKALLAR BEAT
77°3'0"E
77°3'0"E
77°0'0"E
77°0'0"E
76°57'0"E
76°57'0"E
10°1
8'0"
N
10°1
8'0"
N
10°1
5'0"
N
10°1
5'0"
N
FOREST CANOPY DENSITY & LAND-USE MAP OF MANAMBOLY RANGE OF INDIRA GANDHI WILDLIFE SANCTUARY
0 1 20.5 Km
Legend
Plantations
Tea PlantationEucalyptus PlantationCinchona Plantation
Administrative UnitsRange BoundaryBeat BoundariesNon- Forest
Forest Canopy Density<20 %20-40 %40-60 %60-80 %>80 %
GrasslandBarren LandWater
IndiaTamil Nadu
Indira Gandhi Wildlfe Sanctuary
Participating Organizations
National Remote Sensing CentreForest Department, Tamil Nadu
Wildlife Institute of IndiaSurvey of India
Funding Agency
SC-B\NNRMS, MoEF, GoI
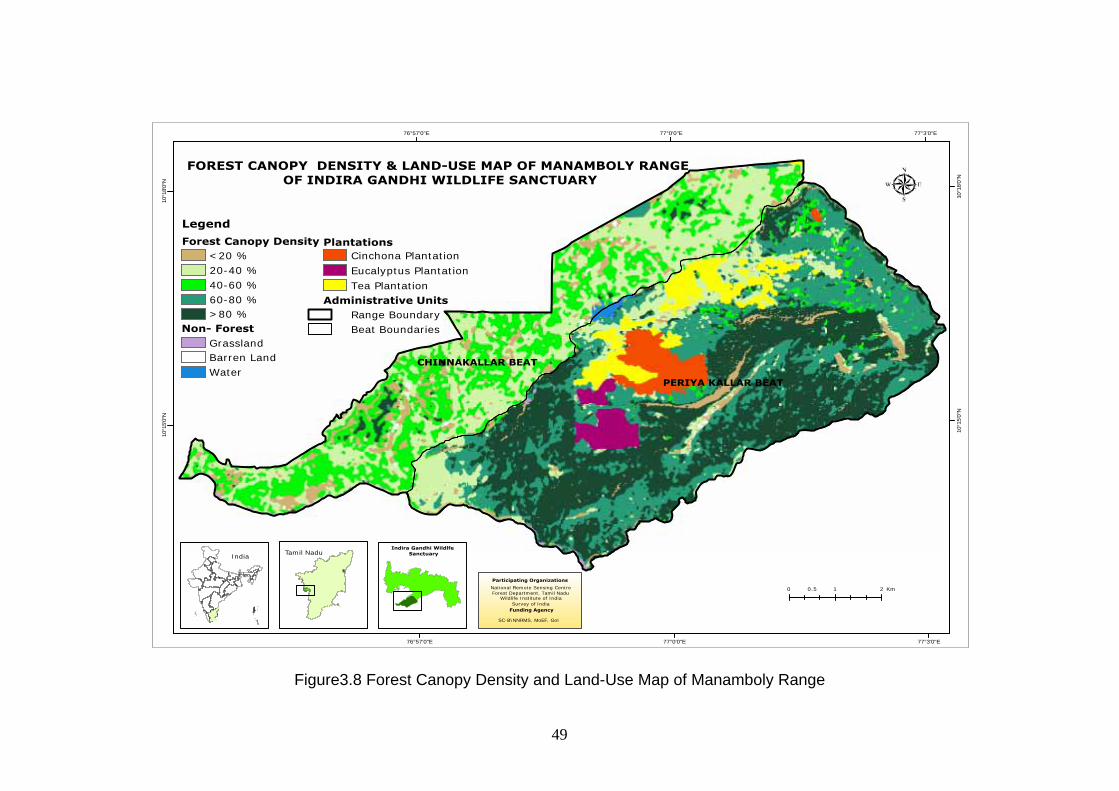
Figure3.8 Forest Canopy Density and Land-Use Map of Manamboly Range

50
ALIYAR BEAT
VILLONNIE BEAT
MANGARAI BEAT
ARTHANRIPALAYAM BEAT
PACHATHANNIR BEAT
POTHAMADA BEAT
AYIRAMKAL BEAT
77°0'0"E
77°0'0"E
76°55'0"E
76°55'0"E
76°50'0"E
76°50'0"E
10°3
0'0"
N
10°3
0'0"
N
10°2
5'0"
N
FOREST CANOPY DENSITY & LAND-USE MAP OF POLACHI RANGE OF INDIRA GANDHI WILDLIFE SANCTUARY
0 1 20.5 Km
IndiaTamil Nadu
Indira Gandhi Wildlfe Sanctuary Participating Organizations
National Remote Sensing CentreForest Department, Tamil Nadu
Wildlife Institute of IndiaSurvey of India
Funding Agency
SC-B\NNRMS, MoEF, GoI
Non-Forest
Administrative Units
Barren land
Grass Land
Water
Range Boundary
Beat Boundaries
Legend
Forest Canopy Density
Plantation
20-40 %
40-60 %
60-80 %
<20 %
>80 %
Eucalyptus
Figure3.9 Forest Canopy Density and Land-Use Map of Polachi Range

51
KOMBU WEST BEATKARATTUR BEAT
EASAL THITTU EAST BEATTHIRUMURTHI MALAI BEAT
KURUMALAI BEAT
EASAL THITTU WEST BEAT
VALLAKONDAPURAM BEAT
KARATTUR BEAT
PARUTHIYUR BEAT
77°15'0"E77°12'0"E
77°12'0"E
77°9'0"E
77°9'0"E
77°6'0"E
77°6'0"E
77°3'0"E
77°3'0"E77°0'0"E
10°3
0'0"
N
10°3
0'0"
N
10°2
7'0"
N
10°2
7'0"
N
10°2
4'0"
N
10°2
4'0"
N
10°2
1'0"
N
10°2
1'0"
N
FOREST CANOPY DENSITY & LAND-USE MAP OF UDUMALAIPETTAI RANGE OF INDIRA GANDHI WILDLIFE SANCTUARY
0 1 20.5 Km
Legend
Forest Canopy Density
Non-Forest
Administrative Units
20-40 %
40-60 %
60-80 %
<20 %
>80 %
Barren land
Grass Land
Water
Range Boundary
Beat Boundaries
India
Tamil Nadu
Indira Gandhi Wildlfe Sanctuary
Participating Organizations
National Remote Sensing CentreForest Department, Tamil Nadu
Wildlife Institute of IndiaSurvey of India
Funding Agency
SC-B\NNRMS, MoEF, GoI
Figure3.10 Forest Canopy Density and Land-Use Map of Udumalaipettai Range

52
76°57'0"E76°54'0"E
76°54'0"E
76°51'0"E
76°51'0"E
10°2
7'0
"N
10°2
7'0
"N
10°2
4'0
"N
10°2
4'0
"N
TOPSLIP BEAT
VARAGALIYAR BEAT
CHINNAR BEAT
FOREST CANOPY DENSITY & LAND-USE MAP OF ULANDY RANGE OF INDIRA GANDHI WILDLIFE SANCTUARY
0 1 20.5 Km
Participating Organizations
National Remote Sensing CentreForest Department, Tamil Nadu
Wildlife Institute of IndiaSurvey of India
Funding Agency
SC-B\NNRMS, MoEF, GoI
India Tamil Nadu Indira Gandhi Wildlfe Sanctuary
Legend
Plantations
Administrative Units
Non- Forest
Barren land
Grass Land
Water
Teak Plantation
Ulandy Range
Beat Boundary
Forest Canopy Density
20-40 %
40-60 %
60-80 %
<20 %
>80 %
Figure3.11 Forest Canopy Density and Land-Use Map of Ulandy Range
53
IYERPADI BEAT
GRASSHILLS BEAT
AKKAMALAI BEAT
UPPER ALIYAR BEAT
ATTAKATTY BEAT
KAVURKAL BEAT
ATTAKATTY BEAT
77°5'0"E
77°5'0"E
77°0'0"E
77°0'0"E
10°2
5'0"
N
10°2
5'0"
N
10°2
0'0"
N
10°2
0'0"
N
10°1
5'0"
N
FOREST CANOPY DENSITY & LAND-USE MAP OF VALPARAI RANGE OF INDIRA GANDHI WILDLIFE SANCTUARY
0 1 20.5 Km
INDIA
TAMIL NADU
Participating Organizations
National Remote Sensing CentreForest Department, Tamil Nadu
Wildlife Institute of IndiaSurvey of India
Funding Agency
SC-B\NNRMS, MoEF, GoI
INDIRA GANDHI WLS
Administrative Units
Non-Forest
Barren land
Grass Land
Water
Range Boundary
Beat Boundary
LegendForest Canopy Density
Plantations
Tea Plantation
20-40 %
40-60 %
60-80 %
<20 %
>80 %
Figure3.12 Forest Canopy Density and Land-Use Map of Valparai Range

54
Chapter - IV
PHYTOSOCIOLOGICAL STUDY
The ecological, social and economic roles of the forest were of great
importance. In present scenario, most of the forests are prone to high
anthropogenic disturbances, which bring out loss and extinction of valuable
species. Understanding of vegetation composition, diversity of species and their
habitats, and comparison with similar other habitats, may become a tool to
estimate the level of adaptation to the environment and their ecological
significance.
4.1 Methodology
Figure4.1. Phytosociological Sampling method
Field Sampling
Field Sampling – Line Transects with circular plot, laid in the smallest administrative unit (Beat) based on the major vegetation types, Elevation, Temperature and Precipitation.
200 m 200 m 3m
10m
Shrubs
Tree Species
Transect

55
Total no. of Beats - 32Beats covered during sampling - 14
Total no. of Transects - 19Total no. of plots - 246
Total no. of Beats - 32Beats covered during sampling - 14
Total no. of Transects - 19Total no. of plots - 246
Figure4.2.1. Sample Points location in Indira Gandhi Wildlife Sanctuary

56
VALPARAI RANGE
UDUMALAIPETTAI RANGE
AMARAVATHI RANGE
POLACHI RANGE
ULANDY RANGE
MANAMBOLY RANGE
MANAMPALLY RANGE
77°20'0"E
77°20'0"E
77°15'0"E
77°15'0"E
77°10'0"E
77°10'0"E
77°5'0"E
77°5'0"E
77°0'0"E
77°0'0"E
76°55'0"E
76°55'0"E
76°50'0"E
76°50'0"E
10°3
0'0"
N
10°3
0'0"
N
10°2
5'0"
N
10°2
5'0"
N
10°2
0'0"
N
10°2
0'0"
N
10°1
5'0"
N
10°1
5'0"
N
SAMPLE POINT LOCATION IN INDIRA GANDHI WILDLIFE SANCTUARY
0 3 61.5 Km
INDIA
Participating Organizations
National Remote Sensing CentreForest Department, Tamil Nadu
Wildlife Institute of IndiaSurvey of India
Funding Agency
SC-B\NNRMS, MoEF, GoI
TAMIL NADU
Legend
Boundary of IGWLS
Range Boundary
Sample Points
Outside Sanctuary
Figure4.2.2. Sample Points location in Indira Gandhi Wildlife Sanctuary
57
The preliminary survey conducted in March, 2005. Based on the preliminary
analysis and available literature, the sampling method has been standardized.
The line transects with circular plot has been used for the main survey conducted
in February and March, 2006 (Fig: 4-6). Out of 32 beats, 14 beats were selected
for the main survey based on major vegetation types, elevation, temperature and
precipitation. A total of 19 transects (Thirteen 2km transects + Six 1km transects)
with 179 sampling plots were collected. In addition, 67 sampling plots have been
collected randomly especially in shola forest and evergreen patches in both
(preliminary and main) surveys. Map of sample point location is given in
figure4.2.1 & 4.2.2. Table of Phytosociological sample point location with
geographic coordinates is given annexure.
Data analysis:
The vegetation data were quantitatively analyzed for relative density,
relative frequency and relative dominance. The importance value index (IVI) for
the tree species was determined as the sum of the relative frequency, relative
density and relative dominance (Cottam and Curtis, 1956; Phillips, 1959).
Species diversity of each forest type was determined using Shannon-Weiner
Index. (H’) = -Sum ((ni/N) ln (ni/N)). (Shannon and Weiner, 1963; Odum, 1971)
Where ni = IVI of individual species.
N= IVI of all species.

58
4.2 Result and Discussion
FLORISTIC COMPOSITION
As typical of tropical forest ecosystem, a wide range of tree species was
inventoried in the present study. About 172 tree species were found in the
sampling. Vateria indica is the dominant species in study area, followed by
Maesa indica, Anogeissus latifolia, Nephelium longana and Croton oblongifolius.
Sl.no. Species Relative Density
Relative Frequency
Relative Dominanc
e
IVI
1 Vateria indica 1.66 1.30 7.69 10.66 2 Maesa indica 4.90 3.08 2.29 10.28 3 Anogeissus
latifolia 3.91 2.49 3.26 9.66
4 Nephelum longana
2.58 2.14 3.17 7.89
5 Croton oblongifolius
3.31 2.37 2.02 7.70
6 Syzigium cumini 1.59 1.78 2.72 6.09 7 Persea macrantha 1.79 2.49 1.75 6.03 8 Vitex leucoxylon 3.31 1.66 0.92 5.90 9 Vitex altissima 1.66 2.25 1.98 5.89
10 Syzygium caryophyllatum
2.12 1.78 1.94 5.84
Table4.1. Ecological dominance of top ten species (based on IVI values) in
Sanctuary
59
Dominant species in individual forest types (Tables 4.2 to 4.7)
Sl. No Species Relative
Density Relative
Frequency Relative
Dominance IVI
1 Anogeissus latifolia 17.02 17.65 24.67 59.34
2 Dalbergia latifolia 8.51 7.35 15.07 30.93
3 Maesa indica 9.22 5.88 4.72 19.82
4 Terminalia paniculata 6.38 2.94 9.33 18.65
5 Albizia amara 4.96 4.41 8.69 18.06
6 Albizia odoratissima 4.96 2.94 6.96 14.86
7 Zyzipus oenoplia 4.96 7.35 1.28 13.60
8 Gyrocarpus americanus 2.84 2.94 5.11 10.89
9 Barringtonia acutangula 4.96 4.41 1.13 10.50
10 Terminalia bellirica 2.84 4.41 2.61 9.86
Table4.2 Top 10 dominant species in Dry deciduous forest of Indira Gandhi WLS
(Based on IVI values)
Sl. No Species Relative
Density Relative
Frequency Relative
Dominance IVI
1 Anogeissus latifolia 9.01 4.05 8.31 21.37
2 Maesa indica 8.07 6.08 4.53 18.69
3 Albizia odoratissima 3.73 3.38 8.14 15.25
4 Terminalia crenulata 2.48 2.70 8.67 13.86
5 Zyzipus oenoplia 6.21 3.38 2.71 12.30
6 Terminalia paniculata 1.24 1.35 9.69 12.28
7 Dalbergia paniculata 3.42 5.41 2.52 11.34
8 Tectona grandis 1.86 2.03 6.95 10.84
9 Barringtonia acutangula 4.97 3.38 1.60 9.94
10 Alstonia scholaris 5.59 2.70 1.41 9.70
Table4.3 Top 10 dominant species in Moist deciduous forest of Indira Gandhi WLS (Based on IVI values)

60
Sl. No Species Relative
Density Relative
Frequency Relative
Dominance IVI
1 Vateria indica 4.15 2.44 18.14 24.73
2 Persea macrantha 4.79 5.85 3.98 14.63
3 Croton oblongifolius 6.71 4.88 1.99 13.57
4 Eugenia calophyllifolia 6.07 2.93 4.15 13.14
5 Macrantha roxburgii 6.07 4.88 1.68 12.63
6 Syzygium caryophyllatum 5.43 2.93 3.73 12.09
7 Pallaquium ellipticum 3.83 3.90 2.26 10.00
8 Mesua ferrea 2.88 3.41 3.25 9.54 9 Vitex leucoxylon 5.11 2.93 0.93 8.97
10 Nephelum longana 3.83 3.41 1.57 8.82
Table4.4 Top 10 dominant species in Evergreen forest of Indira Gandhi WLS
(Based on IVI values)
Sl. No Species Relative
Density Relative
Frequency Relative
Dominance IVI
1 Nephelum longana 4.82 3.10 5.86 13.79
2 Maesa indica 6.71 3.79 3.17 13.67 3 Vateria indica 2.31 1.72 6.39 10.42
4 Terminalia bellirica 1.47 1.72 6.59 9.78
5 Vitex altissima 2.94 3.10 3.69 9.72
6 Lagerstromia microcarpa 1.05 1.72 6.60 9.37
7 Pallaquium ellipticum 2.52 1.72 3.43 7.67
8 Diospyros paniculata 3.56 2.41 1.55 7.53
9 Persea macrantha 2.52 3.10 1.80 7.42
10 Macrantha roxburgii 3.14 2.41 1.45 7.01
Table4.5 Top 10 dominant species in Semi-Evergreen forest of Indira Gandhi
WLS (Based on IVI values)

61
Sl. No Species Relative
Density Relative
Frequency Relative
Dominance IVI
1 Vitex leucoxylon 14.19 8.96 14.19 37.34
2 Croton oblongifolius 12.26 8.96 12.26 33.47
3 Dysoxylum malabaricum 10.32 7.46 10.32 28.11
4 Syzigium cumini 7.74 7.46 7.74 22.95
5 Cinnamomum sulphuratum 6.45 7.46 6.45 20.37
6 Eugenia calophyllifolia 7.74 2.99 7.74 18.47
7 Elaecarpus recurvatus 3.23 2.99 3.23 9.44
8 Holigarna arnottiana 3.23 2.99 3.23 9.44
9 Diospyros paniculata 2.58 2.99 2.58 8.15
10 Nephelum longana 2.58 2.99 2.58 8.15
Table4.6 Top 10 dominant species in Shola forest of Indira Gandhi WLS (Based
on IVI values)
Sl. No Species Relative
Density Relative
Frequency Relative
Dominance IVI
1 Albizia amara 13.68 10.94 29.71 54.34
2 Gyrocarpus americanus 7.37 7.81 12.98 28.17
3 Catunaregum spinosa 10.53 10.94 4.59 26.05
4 Acacia planifrons 10.53 7.81 7.61 25.95
5 Limonia crenulata 6.32 7.81 5.27 19.40
6 Ficus arnottiana 6.32 4.69 6.64 17.65 7 Euphorbia 5.26 3.13 4.95 13.33 8 Zyzipus oenoplia 5.26 4.69 3.14 13.09 9 Cordia monoica 4.21 6.25 2.02 12.48
10 Atalantia monophylla 3.16 3.13 3.98 10.26
Table4.7 Top 10 dominant species in Scrub forest of Indira Gandhi WLS (Based
on IVI values)
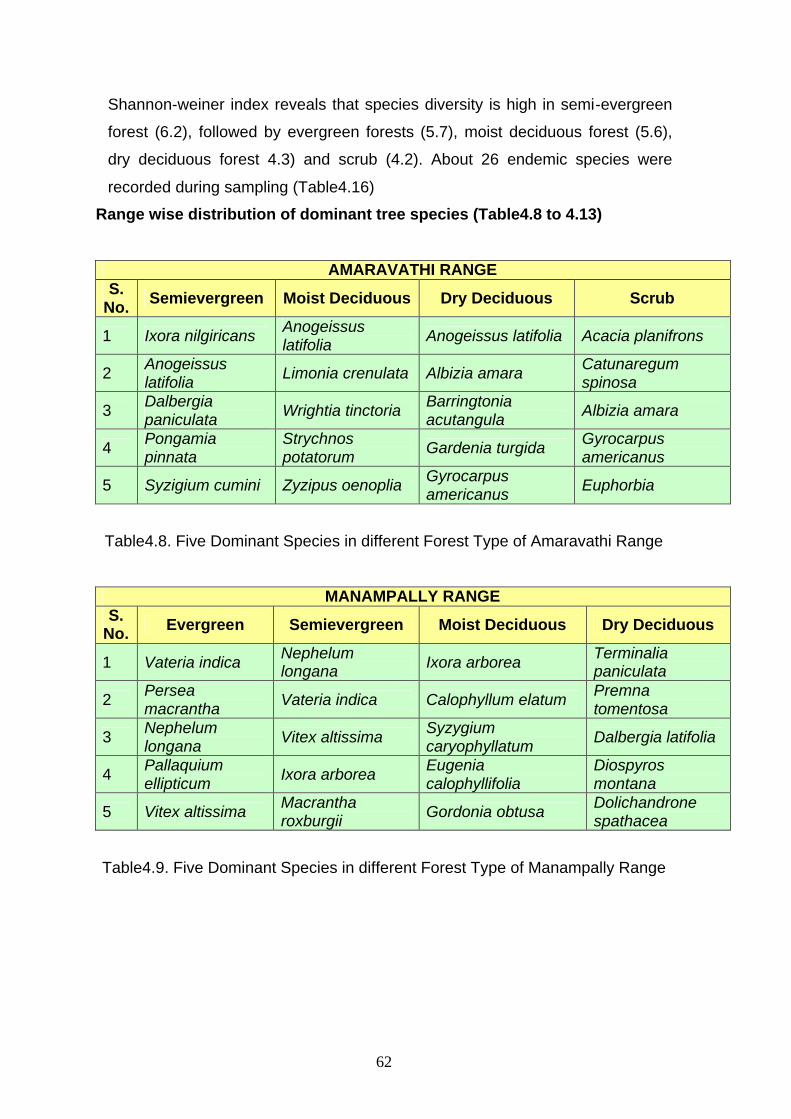
62
Shannon-weiner index reveals that species diversity is high in semi-evergreen
forest (6.2), followed by evergreen forests (5.7), moist deciduous forest (5.6),
dry deciduous forest 4.3) and scrub (4.2). About 26 endemic species were
recorded during sampling (Table4.16)
Range wise distribution of dominant tree species (Table4.8 to 4.13)
AMARAVATHI RANGE S.
No. Semievergreen Moist Deciduous Dry Deciduous Scrub
1 Ixora nilgiricans Anogeissus latifolia Anogeissus latifolia Acacia planifrons
2 Anogeissus latifolia Limonia crenulata Albizia amara Catunaregum
spinosa
3 Dalbergia paniculata Wrightia tinctoria Barringtonia
acutangula Albizia amara
4 Pongamia pinnata
Strychnos potatorum Gardenia turgida Gyrocarpus
americanus
5 Syzigium cumini Zyzipus oenoplia Gyrocarpus americanus Euphorbia
Table4.8. Five Dominant Species in different Forest Type of Amaravathi Range
MANAMPALLY RANGE S.
No. Evergreen Semievergreen Moist Deciduous Dry Deciduous
1 Vateria indica Nephelum longana Ixora arborea Terminalia
paniculata
2 Persea macrantha Vateria indica Calophyllum elatum Premna
tomentosa
3 Nephelum longana Vitex altissima Syzygium
caryophyllatum Dalbergia latifolia
4 Pallaquium ellipticum Ixora arborea Eugenia
calophyllifolia Diospyros montana
5 Vitex altissima Macrantha roxburgii Gordonia obtusa Dolichandrone
spathacea
Table4.9. Five Dominant Species in different Forest Type of Manampally Range

63
POLACHI RANGE S.
No. Semievergreen Moist Deciduous Shola
1 Diospyros foliosa Atalantia racemosa Elaecarpus recurvatus
2 Tabernaemontana dichotoma Albizia odoratissima Schefflera wallichiana
3 Alseodaphne semecarpifolia Tectona grandis Cinnamomum sulphuratum
4 Evodia lunu-ankenda Elaecarpus recurvatus Syzigium malabaricum 5 Schefflera wallichiana Terminalia crenulata Vatica chinensis
Table4.10. Five Dominant Species in different Forest Type of Polachi Range
UDUMALAIPETTAI RANGE S.
No. Semievergreen Moist Deciduous Dry Deciduous Scrub
1 Maesa indica Alstonia scholaris Maesa indica Albizia amara
2 Catunaregum spinosa Maesa indica Anogeissus
latifolia Ficus arnottiana
3 Diospyros paniculata Zyzipus oenoplia Bassia longifolia Zyzipus
oenoplia
4 Hibiscus surattensis
Barringtonia acutangula
Catunaregum spinosa
Ficus microcarpa
5 Mesua ferrea Anogeissus latifolia Terminalia bellirica Maesa indica
Table4.11.Five Dominant Species in different Forest Type of Udumalaipettai
Range
ULANDY RANGE S.
No. Evergreen Semievergreen Moist Deciduous
1 Alseodaphne semecarpifolia
Alseodaphne semecarpifolia Anogeissus latifolia
2 Polyalthia coffeiodes Cinnamomum sulphuratum Terminalia crenulata
3 Vatica chinensis Diospyros foliosa Terminalia paniculata
4 Aglaia tamilnadensis Aglaia roxburghiana Homalium zeylanicum
5 Tetrameles nudiflora Diospyros paniculata Tectona grandis
Table4.12. Five Dominant Species in different Forest Type of Ulandy Range

64
VALPARAI RANGE
S. No. Evergreen Semievergreen Moist Deciduous Shola
1 Croton oblongifolius Maesa indica Ixora arborea Vitex leucoxylon
2 Eugenia calophyllifolia Croton oblongifolius Maesa indica Croton
oblongifolius
3 Macrantha roxburgii Holigarna arnottiana Albizia
odoratissima Dysoxylum malabaricum
4 Vitex leucoxylon Macrantha roxburgii Syzygium caryophyllatum
Eugenia calophyllifolia
5 Syzygium caryophyllatum
Semecarpus anacardium
Pterocarpus marsupium Syzigium cumini
Table4.13. Five Dominant Species in different Forest Type of Valaprai Range
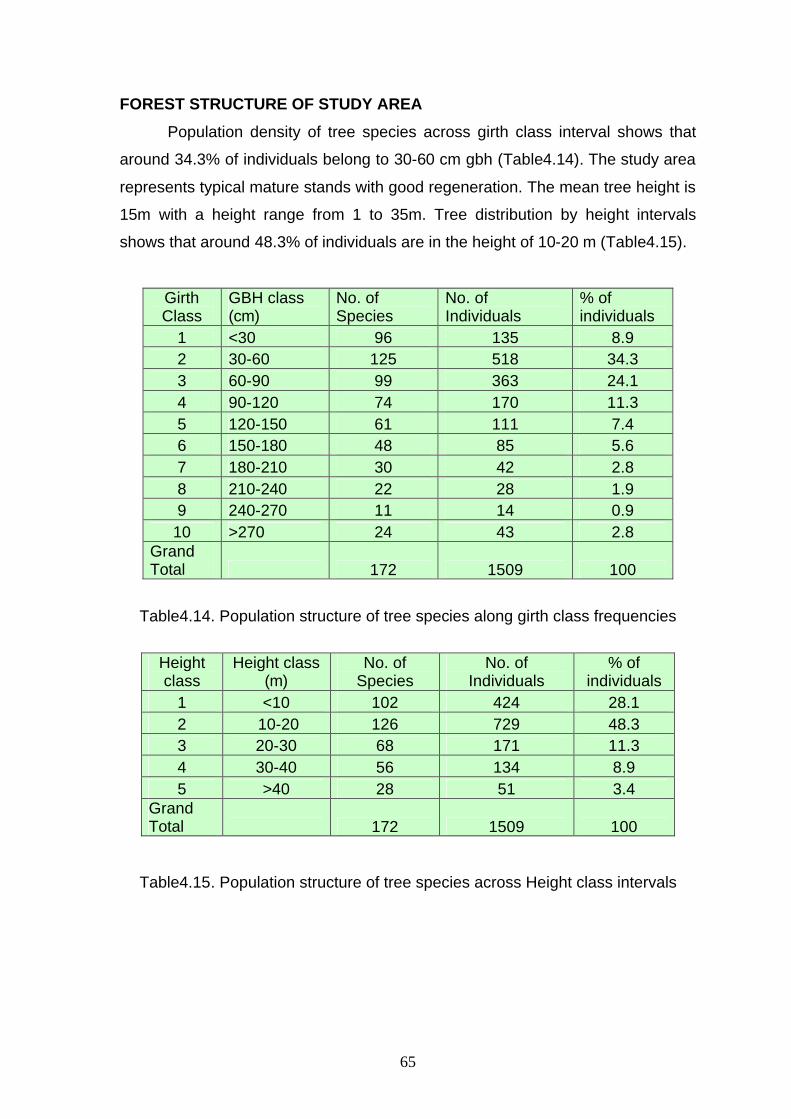
65
FOREST STRUCTURE OF STUDY AREA
Population density of tree species across girth class interval shows that
around 34.3% of individuals belong to 30-60 cm gbh (Table4.14). The study area
represents typical mature stands with good regeneration. The mean tree height is
15m with a height range from 1 to 35m. Tree distribution by height intervals
shows that around 48.3% of individuals are in the height of 10-20 m (Table4.15).
Girth Class
GBH class (cm)
No. of Species
No. of Individuals
% of individuals
1 <30 96 135 8.9 2 30-60 125 518 34.3 3 60-90 99 363 24.1 4 90-120 74 170 11.3 5 120-150 61 111 7.4 6 150-180 48 85 5.6 7 180-210 30 42 2.8 8 210-240 22 28 1.9 9 240-270 11 14 0.9
10 >270 24 43 2.8 Grand Total 172 1509 100
Table4.14. Population structure of tree species along girth class frequencies
Height class
Height class (m)
No. of Species
No. of Individuals
% of individuals
1 <10 102 424 28.1 2 10-20 126 729 48.3 3 20-30 68 171 11.3 4 30-40 56 134 8.9 5 >40 28 51 3.4
Grand Total 172 1509 100
Table4.15. Population structure of tree species across Height class intervals

66
Sl. No. Species Name
1 Aglaia tamilnadensis 14 Hydnocarpus pentandra 2 Artocarpus hirsutus 15 Lagerstromia microcarpa 3 Baccaurea courtallensis 16 Litsea wightiana 4 Diospyros bourdilloni 17 Manilkara roxburghiana 5 Diospyros paniculata 18 Myristica malabarica 6 Drypetes wightii 19 Pallaquium ellipticum 7 Dysoxylum beddomei 20 Polyathia fragrans 8 Dysoxylum malabaricum 21 Symplocos candolleana 9 Glochidion ellipticum 22 Syzigium densiflorum 10 Glochidion tomentosum 23 Syzigium malabaricum
11 Gordonia obtusa 24 Syzigium zeylanicum var. ellipticum
12 Holigarna arnottiana 25 Vateria indica 13 Hopea parviflora 26 Vernonia travancorica
Table4.16. Endemic species of Study area

67
4.3 Gradients of Diversity
The analysis of species/community–environment relationship has always
been a central issue in ecology. The importance of climate to explain animal and
plant distribution was recognized early on (De Candolle 1855). Climate in
combination with other environmental factors has been much used to explain the
main vegetation patterns around the world (Holdridge 1967; Ashton 1969;
Mcarthur 1972; Tilman 1982). More recently, studies have revealed species’
associations with topography, water and nutrient availability on local scales in
tropical forest worldwide (Clark et al. 1998; Cannon and Leighton 2004; Valencia
et al. 2004). These observations led to a variety of hypotheses to account for
high diversity at local scales (Hubbell et al. 2001; Wright 2002); many of these
hypotheses invoke density and frequency dependent mechanisms. The
fundamental principle to these hypothesis are resource allocation and thereby
niche differentiation with respect to available resources. The climate on a broad
scale and topography on a fine scale are two dependent parameters which
decides the resource availability and structure of climax community. Therefore,
efforts have been made to characterize the vegetation communities in response
to different environmental gradients and to identify the most important predictors
of diversity in Indira Gandhi Wildlife Sanctuary.
The temperature and rain fall data collected from WORLDCLIM website (Hijmans
et al. 2005) were used to analyze the role of rainfall and temperature gradients in
the distribution of species diversity. The altitude, slope and aspect were
generated from SRTM (Shuttle Radar Topographic Mission) data. The
temperature and rain fall data collected from WORLDCLIM website (Hijmans et
al. 2005) were used to analyze the role of rainfall and temperature gradients in
the distribution of species diversity. In order to investigate the relationships
between species richness and environmental variables, a canonical
correspondence analysis (CCA) was employed (ter Braak 1987), using the
software PC-ORD 4.0 (McCune and Mefford 1999). As required by CCA, we set
the data into two distinct matrices: the species matrix and the matrix of
environment variables. The species matrix contained number of species per plot.
68
The environmental variables matrix included are elevation, slope, aspect,
temperature and precipitation (Fig: 2). Multiple linear regression analysis was
conducted to identify the best predictor of diversity. A stepwise backward
elimination approach was adopted in which the analysis started with all the
continuous variables and eliminated the least significant variable in each
progressive step. The variables were removed if the probability of ‘F’ exceeds
0.05. The species richness was the dependent variable and elevation, slope,
aspect, rainfall and temperature were the independent variables.
Canonical correspondence analysis was performed for 169 species on 206 plots
with 5 environmental variables (Fig: 3). The eigenvalues for the first three CCA
axes were 0.749, 0.523 and 0.304 respectively. The cumulative percentage
variance accounted for those axes was 4.0% (1.9, 1.3 and 0.8 respectively),
indicating that a considerable amount of ‘noise’ still remained unexplained.
However, ter Braak (1995) considers low percentage of unexplained variance as
normal in vegetation data, and this fact does not weaken the significance of
species–environment relationships. In fact, the CCA produced high correlations
between species and environmental variables for these axes (0.943, 0.883, and
0.740 respectively). The first ordination axis was highly correlated, in descending
sequence, with precipitation, temperature, elevation and slope (Table: 1). The
second ordination axis has shown high correlation with elevation and
temperature while the third ordination axis is correlated with slope. The weighted
correlations between environmental variables showed strong interrelationships,
especially between elevation and climatic variables (temperature and
precipitation). Segregation of vegetation communities along the noted gradients
was also observed. The left side of the ordination space is dominated with
communities which are primarily evergreen species whereas the right side is
occupied by deciduous species (Fig: 3). The details of the communities are
further explained below.

69
Figure4.3. CCA ordination diagram (Axis 1 by Axis 2) with plots (scattered points)
and environmental variables (lines) in Anamalai wildlife sanctuary. Each circle represents partitioning of vegetation communities along environmental gradients. Variable Axis 1 Axis 2 Axis 3 Elevation Slope Aspect Precipitation Temperature
Elevation -0.662 0.734 0.063 1 0.422 0.181 0.757 -0.946
Slope -0.542 0.016 0.806 0.422 1 0.027 0.48 -0.436
Aspect -0.186 0.268 -0.123 0.181 0.027 1 0.186 -0.175
Precipitation -0.986 0.139 -0.052 0.757 0.48 0.186 1 -0.805
Temperature 0.715 -0.619 -0.131 -0.946 -0.436 -0.175 -0.805 1
Table4.17. Canonical correspondence analysis of 169 species in 206 plots in
Anamalai wildlife sanctuary. Matrix presents intraset correlation between environmental variables and first three axes and weighted correlations between
environmental variables.
P1
P2
P3
P4
P7
P8
P9
P10
P11
P12
P13
P14
P15
P16
P17
P18
P19
P20
P21
P22
P23 P24
P25
P26
P27
P28
P29
P30P31
P32
P33
P34
P35
P36
P37
P38
P39
P40
P41P42
P43
P44P45P46
P47P48
P49
P50
P51
P52
P53 P54
P55
P56
P57
P58
P59
P60
P61
P62
P63
P64
P66P67
P68
P69P70
P71
P72
P73
P74
P75P76P77
P78
P79P80
P81
P82P84P85
P86P89
P91
P92
P93
P94
P96
P97
P98
P100
P101
P102
P103
P105
P106
P107
P109
P110
P111
P112
P113
P114
P115P116
P117
P119 P120P121
P122P123P124P125
P126
P127
P128
P129
P130
P131P132
P133P134
P135
P136
P137P138
P139
P140
P141P142
P143
P145P146
P147
P148P149
P150
P151P152
P153P154
P155
P156
P157
P159P160
P161
P162
P163P164
P165
P167
P168
P169 P170P171
P172
P174
P175
P176
P178P179
P180
P181P182
P183
P184
P185P186
P188P189
P192
P193
P194P195P196
P197
P198
P199
P200
P201P202
P203
P204
P205
P206
P207P208
P209
P222P225
P227
P228
P229
P230
P231
P232
P233
P234
P235
P236
P237P238
P239
P240
P241
Elevatio
Slope
Precipit
Temperat
Axis 1
Axi
s 2
Evergreen communities
Montane shola forest communities
Semi-evergreen communities
Moist deciduous communities
Dry deciduous communities
Scrub forest communities

70
Evergreen communities: This group is characterized by the species such as
Vateria indica, Persea macrantha, Pallaquium ellipticum, Eugenia calophyllifolia
and Macrantha roxburgii. This species assemblage is more or less corresponds
to west coast tropical evergreen forest (1A/C4) of Champion and Seth’s (1967)
classification of Indian forests. This forest occurs in relatively undisturbed area at
an altitude of 950-1800 msl. They are enmarked by higher humidity, lower
temperature, lower understory, low canopy openings and high leaf litter.
Montane shola forest communities: The major species in shola forests are
Syzigium cumini, Vitex leucoxylon, Dysoxylum malabaricum, Cinnamomum
sulphuratum and Eugenia calophyllifolia. This group corresponds to southern
montane wet temperate forest (11A/C1) as per Champion and Seth’s
classification. It occurs at an elevation of more than 1800m. Annual precipitation
in these areas is about 5000 mm while annual temperature is approximately 5oC.
Geographically the area can be distinguished from the steep slopes and
mountain folding.
Semi-evergreen communities: These formations are distinguished by species
such as Nephelum longana, Pallaquium ellipticum, Vateria indica, Terminalia
bellirica and Vitex altissima and correspond to west coast tropical semi-evergreen
forest (2A/C2). This is found on an altitudinal range of 600 - 900 m and relatively
high precipitation areas.
Moist deciduous communities: They are characterized by the presence of
species such as Anogeissus latifolia, Maesa indica, Albizia odoratissima,
Terminalia crenulata and Zyzipus oenoplia and match up with Champion and
Seth’s southern moist mixed deciduous forest (3B/C2). This forest community
occurs at an altitude of 500 - 800 msl with relatively low rainfall zones.
Dry deciduous communities: This group is a composition of Anogeissus
latifolia, Dalbergia latifolia, Albizia amara, Maesa indica, and Terminalia
paniculata and corresponds to southern dry mixed deciduous forest (5A/C3). This
is found on areas where altitude ranges of 400 - 600 m with very low
precipitation.

71
Thorny Scrub forest communities: This community is formed in those areas
where human disturbance is maxima and rainfall is less. This is occurring in lower
altitudes (<400 m) with thorny species such as Albizia amara, Gyrocarpus
americanus, Catunaregum spinosa, Acacia planifrons and Limonia crenulata. It
corresponds to southern thorn scrub as per Champion and Seth’s (1967)
classification of Indian forest. Canopy openings and open spaces are
characteristics of the area. Cattle grazing and firewood collection is frequent in
the area.
The assessment of species richness from environmental variables yielded the
following model (Table: 2). The model fit was 0.50 (F – 39.82, p < 0.05). Though,
the overall model was significant, the values of “t” and its significance indicate
that each of these variables is not significantly contributing to the overall model.
Therefore, the variable having the least partial correlation coefficient (in this case
aspect) is eliminated from the model. The model is then refitted with all other
variables and this procedure is repeated until only statistically significant
variables are left in the model. In this case only one variable was found to be a
significant predictor of species number, i.e., precipitation (equation: 1). Because
of the strong correlation among variables (Table 1), this is not surprising, but it
also means that it is difficult to disentangle the separate effects of the
independent variables. The model fit was 0.485 (F – 192.91, p < 0.05).
1.311.-ion precipitat*0.004 Richness Species = ------------ (1)

72
Variable Coefficient Std. Error t Significance
Intercept 3.354 4.857 0.690 0.491
Elevation -0.002 0.001 -1.737 0.084
Slope 0.026 0.023 1.126 0.262
Aspect 0.001 0.001 0.628 0.531
Precipitation 0.004 0.000 8.248 0.000
Temperature -0.135 0.134 -1.003 0.317
Table4.18. Overall regression model of species richness from environmental variables in Anamalai wildlife sanctuary (R2 – 0.50, F – 39.82, df1 – 5, df2 – 199
and p - 2.98E-28).
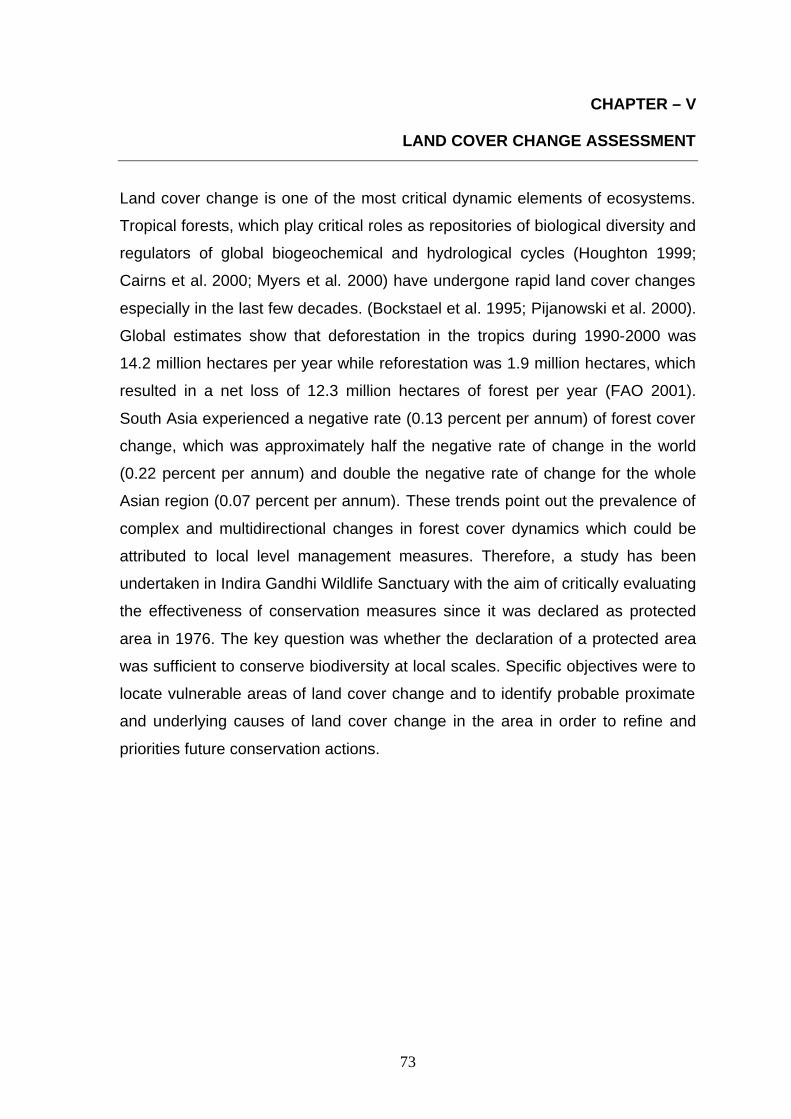
73
CHAPTER – V
LAND COVER CHANGE ASSESSMENT
Land cover change is one of the most critical dynamic elements of ecosystems.
Tropical forests, which play critical roles as repositories of biological diversity and
regulators of global biogeochemical and hydrological cycles (Houghton 1999;
Cairns et al. 2000; Myers et al. 2000) have undergone rapid land cover changes
especially in the last few decades. (Bockstael et al. 1995; Pijanowski et al. 2000).
Global estimates show that deforestation in the tropics during 1990-2000 was
14.2 million hectares per year while reforestation was 1.9 million hectares, which
resulted in a net loss of 12.3 million hectares of forest per year (FAO 2001).
South Asia experienced a negative rate (0.13 percent per annum) of forest cover
change, which was approximately half the negative rate of change in the world
(0.22 percent per annum) and double the negative rate of change for the whole
Asian region (0.07 percent per annum). These trends point out the prevalence of
complex and multidirectional changes in forest cover dynamics which could be
attributed to local level management measures. Therefore, a study has been
undertaken in Indira Gandhi Wildlife Sanctuary with the aim of critically evaluating
the effectiveness of conservation measures since it was declared as protected
area in 1976. The key question was whether the declaration of a protected area
was sufficient to conserve biodiversity at local scales. Specific objectives were to
locate vulnerable areas of land cover change and to identify probable proximate
and underlying causes of land cover change in the area in order to refine and
priorities future conservation actions.

74
5.1 Methodology
Two suitable cloud-free images were available for this study, spanning the
period from before the designation of protected area status to the present. A
Landsat Multi Spectral Scanner (MSS) image dated 9th February, 1973 was
downloaded from the Global Land Cover Facility (http://glcf.umiacs.umd.edu/)
and an IRS P6 LISS III image dated 8th March, 2006 was acquired from National
Remote Sensing Agency (NRSA) Data Center, Hyderabad, India. The Landsat
MSS data had a spatial resolution of 80m and four wavebands (0.5 – 0.6, 0.6 –
0.7, 0.7 – 0.8 and 0.8 – 1.1µm) while the LISS-III image had a spatial resolution
of 24m and four bands (0.52 – 0.59, 0.62 – 0.68, 0.77 – 0.86 and 1.55 – 1.70µm).
The imagery were geometrically corrected based on Ist order polynomial
regression between ground control points (RMSE<0.5 pixel) to compute the
coefficients for two co-ordinate transformation equations, and registered to the
UTM projection. The digital number (DN) values of the Landsat MSS and IRS P6
LISS III data were converted into radiance values using the corresponding
satellite sensor parameters.

75
Geocorrected MSS Data
Image Regression
Delineation of Forest/Non forest area by ThresholdingTechniques.
Mask (Binary Map) for Time T1
Mask (Binary Map) for Time T2
T2 > T1
Boolean AND
No Change Areas
(Mask (T1) – No change Area) > 0 (Mask (T2) – No change Area) > 0
Negative Change (Vegetation àother landcover)
Positive Change (other landcoverà Vegetation)
Change Map
NDVI MSS
Geocorrected LISS III Data
MSS DN to Radiance Conversion
LISS III DN to Radiance Conversion
MSS comparable radiance with respect to LISS III radiance
NDVI LISS III
Figure5.1. Flow diagram depicting the details of change detection technique
followed in the study.
The first stage of the change analysis was to perform a radiometric
intercalibration of the first three bands of the Landsat MSS and IRS P6 LISS III
images. This was done by identifying spatially homogenous calibration sites in
both the images where no land cover changes had taken place. For the
calibration sites, radiance values were collected from the two images and a least
square regression was performed. The radiance values of the entire MSS image
were transformed based on the regression model. The LISS III data, having a
spatial resolution of 24m, was resampled to 80 m, the original spatial resolution of
MSS data, for further analysis. Since the objective was to study the vegetation
condition changes over a period of time, Normalized Differential Vegetation Index

76
(NDVI) images were generated from the Landsat MSS and IRS P6 LISS III data.
The NDVI images were examined, mean and standard deviation values were
calculated and a thresholding technique (Tunf Fung and Ellesworth 1988) was
applied to separate vegetation from other land cover. Threshold values of ‘k’
standard deviations from the mean was iteratively selected. The ‘k’ value was 0.1
in the first iteration, which was increased in increments of 0.1 in subsequent
iterations, until an acceptable ‘k’ value of 0.7 was reached and this was applied to
both images. Binary images having values of 0 and 1 representing non-
vegetation and vegetation respectively were generated for the two different years.
A boolean operation ‘AND’ was applied between the two binary images to identify
the unchanged areas. Change due to conversion of vegetation to non-vegetation
was defined as a negative change while non-vegetated area converted into
vegetated area was defined as positive change. The positive change area was
determined by subtracting the unchanged areas from the 2006 dataset and
subtracting the same area from the 1973 data produces negative change. The
detailed methodology is explained in Fig. 2. The derived positive and negative
change images were filtered using neighborhood majority function through a 3x3
kernel in order to reduce errors from geometric correction. The filtered images
were overlaid on the original images in order to visually confirm the changes in
land cover from one category to other. A vector layer depicting land cover change
was generated and area statistics calculated.
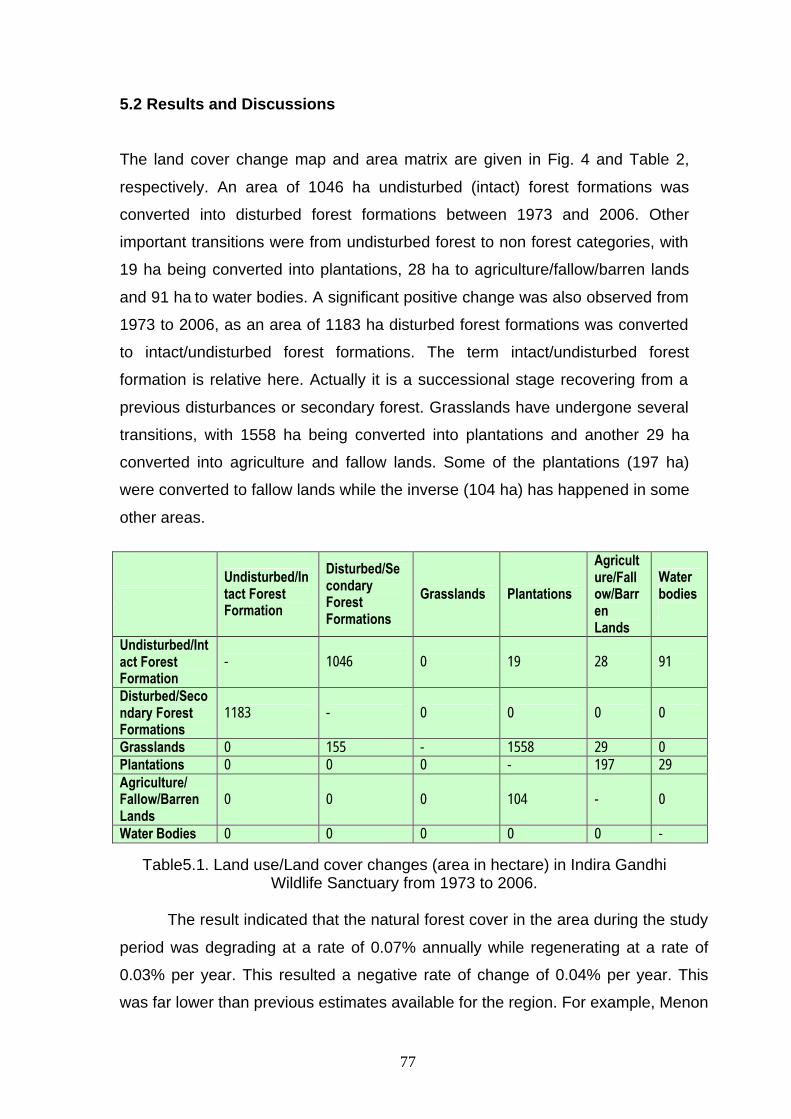
77
5.2 Results and Discussions
The land cover change map and area matrix are given in Fig. 4 and Table 2,
respectively. An area of 1046 ha undisturbed (intact) forest formations was
converted into disturbed forest formations between 1973 and 2006. Other
important transitions were from undisturbed forest to non forest categories, with
19 ha being converted into plantations, 28 ha to agriculture/fallow/barren lands
and 91 ha to water bodies. A significant positive change was also observed from
1973 to 2006, as an area of 1183 ha disturbed forest formations was converted
to intact/undisturbed forest formations. The term intact/undisturbed forest
formation is relative here. Actually it is a successional stage recovering from a
previous disturbances or secondary forest. Grasslands have undergone several
transitions, with 1558 ha being converted into plantations and another 29 ha
converted into agriculture and fallow lands. Some of the plantations (197 ha)
were converted to fallow lands while the inverse (104 ha) has happened in some
other areas.
Undisturbed/Intact Forest Formation
Disturbed/Secondary Forest Formations
Grasslands Plantations
Agriculture/Fallow/Barren Lands
Water bodies
Undisturbed/Intact Forest Formation
- 1046 0 19 28 91
Disturbed/Secondary Forest Formations
1183 - 0 0 0 0
Grasslands 0 155 - 1558 29 0 Plantations 0 0 0 - 197 29 Agriculture/ Fallow/Barren Lands
0 0 0 104 - 0
Water Bodies 0 0 0 0 0 -
Table5.1. Land use/Land cover changes (area in hectare) in Indira Gandhi Wildlife Sanctuary from 1973 to 2006.
The result indicated that the natural forest cover in the area during the study
period was degrading at a rate of 0.07% annually while regenerating at a rate of
0.03% per year. This resulted a negative rate of change of 0.04% per year. This
was far lower than previous estimates available for the region. For example, Menon

78
and Bawa (1997) estimated an annual rate of decline of 0.57% in the whole
Western Ghats during 1920 – 1990 and Jha et al. (2000) estimated a decline of
1.16% per year during the period of 1973–1995 in southern Western Ghats.
Prasad et al. (1998) estimated an amount of 0.9% (during 1961–1988) in the
Kerala part of Western Ghats (an adjacent area near to study area). These
studies, conducted on a regional basis, incorporated largely unprotected areas.
Hence, the present results demonstrate that designation of protected area status
has been effective in reducing rates of degradation and deforestation, though
current conservation strategies within the Indira Gandhi Wildlife Sanctuary may be
in need of some refinement.
The next step was to understand the proximate and underlying causes of
land cover change. Broadly speaking, two major and divergent trends,
degradational and successional, were observed in the study. The degradational
trend indicators are the transformation of undisturbed forest to disturbed forest
and other non-forest land covers. The spatial location of land cover change
indicated that most of these transformations have occurred on the fringes of the
sanctuary or near to settlements inside the sanctuary. These changes could
generally be attributed to four clusters of causes: livelihood dependence of local
people, infrastructure development, agricultural expansion and forestry
operations, at the proximate level.
A number of villages on the fringes of the sanctuary mainly depend on the
sanctuary for their livelihood. The population in these villages is over one
hundred thousand and the main occupation is agriculture. In addition, there are
about 36 tribal settlements, two privately owned tea plantations and one area of
revenue land inside the sanctuary. It has been observed that there is a high
population growth rate in these settlements and their economic condition is far
below satisfactory (Sajeev et al. 2002). The major demands of the population on
the forest of the sanctuary are timber for building construction, small timber for
agricultural implements, huts and fencing purposes, firewood for domestic
consumption, grasses for rearing goats and cattle and for roofing of houses. In
addition, infrastructure developments like construction and maintenance of roads
and buildings for the support of people who are residing inside the sanctuary and
79
associated movement of machinery are contributing to the degradation of a
system which was already under pressure. Another major threat is grazing. The
tribes settled in the dry forests on the eastern side maintain large stocks of cattle,
buffalo, sheep, goats, horses and ass. There has been an alarming increase in
the number of livestock that graze in the forests (Kumar et al. 2002) and this is
probably playing an important role in the degradation of undisturbed or intact
forest.
Agriculture is the most common occupation of the villagers. Towards
higher elevation in the Valparai region, people are more occupied with the
plantation crops of tea, coffee and cardamom, whereas the north-eastern portion
in the lower reaches is dominated by rice (Oryza sativa), ground nut (Arachis
hypogaea), sorghum (Zea mays), ragi (Eleusine coracana), tapioca (Manihot
esculenta) and banana (Musa acuminata) cultivation. Before the declaration of
protected area status, villagers used to cultivate millet and tubers using a shifting
cultivation method. The restriction on shifting cultivation has caused an
expansion of cultivation near to settlements, observed in the present study as an
area increment of 0.6 km2 in agriculture/fallow/barren lands since 1973 at the
expense of forest and grasslands. Geist and Lambin (2002) made a similar
observation that agricultural expansion is, by far, the most important land use
change associated with deforestation globally.
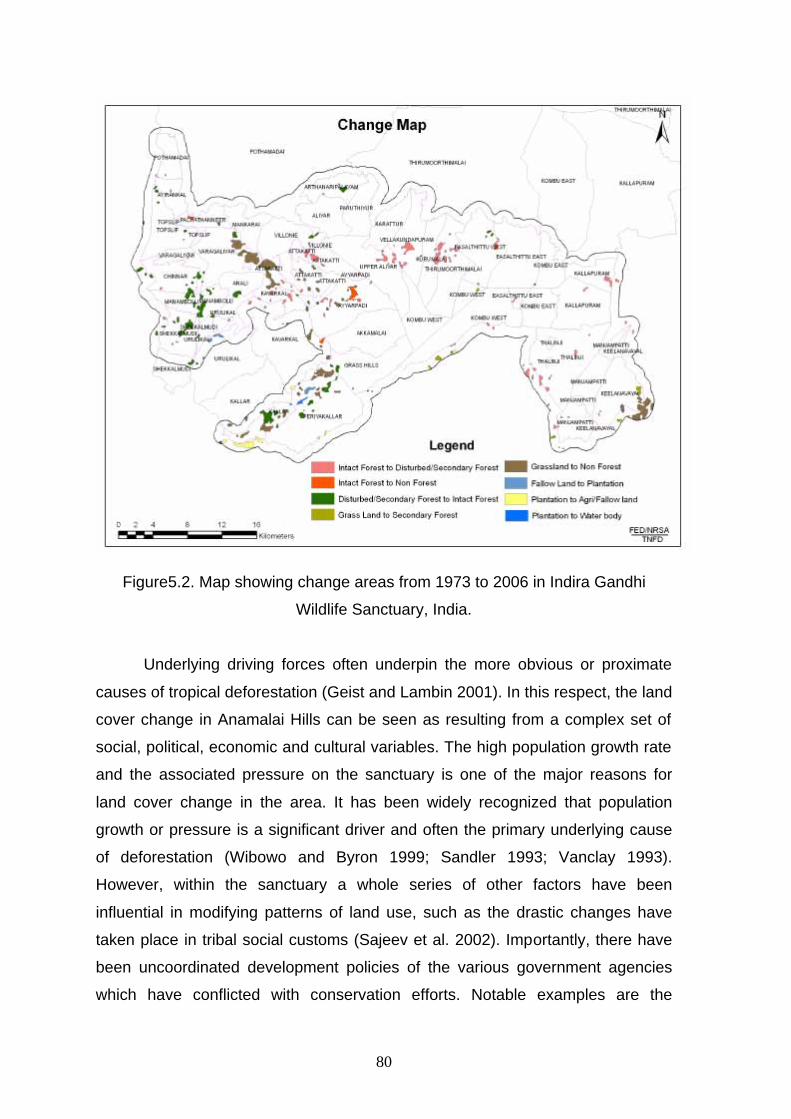
80
Figure5.2. Map showing change areas from 1973 to 2006 in Indira Gandhi
Wildlife Sanctuary, India.
Underlying driving forces often underpin the more obvious or proximate
causes of tropical deforestation (Geist and Lambin 2001). In this respect, the land
cover change in Anamalai Hills can be seen as resulting from a complex set of
social, political, economic and cultural variables. The high population growth rate
and the associated pressure on the sanctuary is one of the major reasons for
land cover change in the area. It has been widely recognized that population
growth or pressure is a significant driver and often the primary underlying cause
of deforestation (Wibowo and Byron 1999; Sandler 1993; Vanclay 1993).
However, within the sanctuary a whole series of other factors have been
influential in modifying patterns of land use, such as the drastic changes have
taken place in tribal social customs (Sajeev et al. 2002). Importantly, there have
been uncoordinated development policies of the various government agencies
which have conflicted with conservation efforts. Notable examples are the
81
provision of grants for goat grazing and lemon grass collection while these
activities are prohibited within the sanctuary.
Positive land cover changes or successional trends in vegetation at the
study site were indicated by the conversion of disturbed forests and plantations to
the undisturbed forest category which was observed particularly in the western
part of the sanctuary. The abandonment of teak and coffee plantations and the
efforts of the forest department to plant indigenous species as well as natural
regeneration, a high level of protection and favourable climatic conditions might
have contributed to the positive land cover changes. This provides some
indication of the natural resilience of the system even after the prolonged human
disturbances.
Conservation Implications
There is a need to support successional indicators while controlling
degradational indicators. Increasing the level of protection especially in
vulnerable areas should be a priority for conservation. Increasing the pace of
planting of indigenous species in abandoned plantations could considerably
enhance the positive land cover changes. At the same time, it is essential to
reduce the livelihood over-dependence of people from outside and inside the
sanctuary on forest. Small scale encroachments and agriculture expansion
should be prevented. Sustainable infrastructure development by different
government agencies should be coordinated and monitored by a single nodal
agency.

82
Conclusion
This study has demonstrated that remotely-sensed based assessments of land
cover dynamics can have an important contribution to monitoring the
consequences of land management strategies and deepening our understanding of
the processes that underpin land use changes. Land cover change assessment for
a period of 33 years helped to identify the rates and characteristics of land cover
transformations. Two major and divergent trends, degradational and successional,
were observed in the study. The degradational trend was indicated by the
transformation of undisturbed forest to disturbed forest and other non-forest
categories. These changes can be attributed to a number of causes, principally
livelihood dependence, agricultural expansion and infrastructure development
resulting from population growth in and around the area and uncoordinated policies
of the different government agencies. The positive successional changes resulting
from protection of the area showed the resilience of the system even after
prolonged disturbances on vegetation cover. The observed degradational
transitions exceed the rates of successional changes. Hence, the sanctuary
appears susceptible to continuing disturbances under the current management
regime, however, the impacts of such processes are substantially lower than in
surrounding unprotected areas.

83
Chapter VI
Conclusions and Recommendations
The tropical rain forests are the most species rich terrestrial environments with
multi-layered arrangement. In recent times the forest are being destroyed through
forest cutting for fire wood or to make away for agriculture leading to high
fragmentation of forest of virgin areas. Such forest fragmentation not only leaves
the organisms that remain within them a smaller habitat but also exposes them to
stressful environment conditions, particularly at the forest edge, that differ from
those deeper within the forest.
The Indira Gandhi Wildlife Sanctuary, Tamil nadu was selected for the study due
to its high biological richness having distribution in variety of vegetation types
such as Evergreen, Shola, Semi-evergreen, Moist, Dry deciduous to scrub
forests.
Study has developed forest type map, crown density map and other land cover
details on 1:25,000 scale using IRS P6 LISS IV data. Spatially explicit database
developed would stand as baseline for subsequent monitoring and assessment.
The sanctuary is a main wildlife corridor in Western Ghats fulfilling Species and
Ecosystem based criteria to be considered as one of the Ecologically Sensitive
Area. Covering the entire Wildlife Sanctuary, stratified transect method data was
collected from 210 plots. It was observed that the biodiversity index derived from
Shannon and Weiner index was high in Tropical semi evergreen forests followed
by evergreen forests. The high value of Shannon-weiner index in case of semi
evergreen forest was likely due to the association of various species of
evergreen, deciduous and riparian elements.
Forest fires were limited to only deciduous forests and scrub areas mainly in
eastern part of sanctuary. Besides the sanctuary is experiencing very high
anthropogenic activities in eastern part thereby high fragmentation and
disturbances were observed. Hence such areas need to be understood to

84
prioritize potential areas for conservation and prepare management plans for
restoration and rehabilitation of endangered species. Further the degraded areas
are to be restored through intensive afforestation programmes by introducing
locally growing plant species thereby protecting biodiversity and also restore the
ecological stability to the area under study.
Phytosociological data (forest type-wise), topographical variables (elevation,
slope, aspect), infrastructure data and drainage can be used as baseline
information for further studies in this protected area, through suitably average
weighted approach using RS & GIS techniques.
It is recommended for regular geospatial monitoring system integrating spatial
datasets with bio-physical, socio-economic, meteorological, ecological
observations along with forest management prescriptions, would pave the way for
a state-of-the-art decision support system for regular and contingent decision
making, in the context of increasing concerns about biotic pressures and
vulnerability to global changes.

85
Reference
Annaselvam, J., Parthasarathy, R. (1999). Inventories of understory plants in
tropical evergreen forest in Anamalais, Western Ghats, India. Ecotropica,
5, 197-211.
Aplet GH, Hughes RF, Vitousek PM (1998) Ecosystem development on Hawaiian
lava flows: biomass and species composition. Journal of Vegetation
Science 9: 17 – 26.
Ashton PS (1969) Speciation among tropical forest trees: some deductions in
light of recent evidence. Biological Journal of the Linnean Society 1: 155-
196.
Ashton PS, Hall P (1992) Comparisons of structure among mixed dipterocarp
forests of northwestern Borneo. Ecology 80: 459-481.
Blasco F (1970) Aspects of flora and ecology of the savannas of the south Indian
hills. Journal of the Bombay Natural History Society 67: 522–534.
Bockstael, N., Costanza, R., Strand, I., Boyton, W., Bell, K. Wagner, L. (1995).
Ecological economic modelling and valuation of ecosystems. Ecological
Economics, 14, 143–159.
Cairns, M. A., Haggerty, P.K., Alvarez, R., De Jong, B.H.J., Olmsted, I. (2000).
Tropical Mexico’s recent land-use change: a region’s contribution to the
global carbon cycle. Ecological Applications, 10, 1426–41.
Cannon CH, Leighton M (2004) Tree species distributions across five habitats in
a Bornean rain forest. Journal of Vegetation Science 15: 257-266.
Champion HG, Seth SK (1968) A revised survey of the forest types of India.
Manager of Publications, Govt.of India. Delhi.

86
Cincotta, R. P., Wisnewski, J., Engelman, R. (2000). Human population in the
biodiversity hotspots. Nature, 404, 990-992.
Clark DB, Clark DA, Read JM (1998) Edaphic variation and the mesoscale
distribution of tree species in a neotropical rain forest. Journal of Ecology
86: 101-112.
Clinebell HRR, Phillips L, Gentry AH, Stark N, Zuuring H (1995) Prediction of
neotropical tree and liana species richness from soil and climatic data.
Biodiversity and Conservation 4: 56-90.
Cohen, W.B., Spies, T.A., Alig, R.J., Oetter, D.R., Maiersperger, T.K., Fiorella, M.
(2002). Characterizing 23 years (1972–95) of stand replacement
disturbance in western Oregon forests with Landsat imagery. Ecosystems,
5, 122–137.
Coley PD, Barone JA (1996) Herbivory and plant defenses in tropical forests.
Annual Review of Ecology and Systematics 27: 305 – 315.
Congreve, C.R.T. (1938). The Anamalais (Tamil Nadu Forest Department,
Madras).
Connell J. H., Tracey J. G., Webb J. 1984. Compensatory recruitment growth and
mortality as factors maintaining rain forest tree diversity. Ecological
Monographs 54: 14 – 64.
Connell JH (1971) On the role of natural enemies in preventing competitive
exclusion in some marine animals and in rainforest trees In: Denboer PJ,
Gradwell GR (eds) Dynamics of Populations. Centre for Agricultural
Publishing and Documentation. Wageningen, The Netherlands, pp 298 –
313.
87
Coppin, P., Jonckhere, I., Nackarts, K., Muys, B. (2004). Digital change detection
methods in ecosystem monitoring: a review. International Journal of
Remote Sensing, 25 (9), 1565–1596.
Davidar P, Puyravaud J P, Leigh EG (2005) Changes in rain forest tree diversity,
dominance and rarity across a seasonality gradient in the Western Ghats,
India. Journal of Biogeography 32:493-501.
Davidar P, Rajagopal B, Mohandass D, Puyravaud J-P, Condit R, Wright S J,
Leigh EG (2007) The effect of climatic gradients, topographic variation and
species traits on the beta diversity of rain forest trees. Global Ecology and
Biogeography 16:510-518.
De Candolle AI (1855) Geographique botanique raisonneae Masson, Paris.
ERDAS, 2006, ERDAS Iamgine tour guides, Leica Geosystems Geospatial
Imaging, LLC.
FAO, 2001, Global Forest Resources Assessment 2000 (Food and Agricultural
Organization, Rome).
Gauch, H.G. 1982. Multivariate Analysis in Community Ecology. Cambridge
University Press, Cambridge.
Geist, H.J., Lambin, E.F. (2001). What drives tropical deforestation? A meta-
analysis of proximate and underlying causes of deforestation based on
subnational case study evidence. Louvain-la-Neuve (Belgium): LUCC
International Project Office, LUCC Report Series no. 4.
Geist, H.J., Lambin, E.F. (2002). Proximate causes and underlying driving forces
of tropical deforestation. Bioscience, 52, 143–150.
Gentry AH (1982) Neotropical floristic diversity: phytogeographical connections
between Central and South America, Pleistocoene climatic fluctuatios, or

88
an accident of the Andean orogeny? Annals of the Missouri Botanical
Garden 69: 557-593.
Gentry AH (1992) Tropical forest biodiversity: Distributional patterns and their
conservational significance. Oikos 63: 19-28.
Givnish TJ (1999) On the causes of gradients in tropical tree diversity. Journal of
Ecology 87: 193-210.
Guisan A, Zimmermann NE (2000) Predictive habitat distribution models in
ecology, Ecological Modelling 135: 147-186.
Hijmans RJ, Cameron SE, Parra JL, Jones PG, Jarvis A (2005) Very high
resolution interpolated climate surfaces for global land areas. International
Journal of Climatology 25: 1965-1978.
Hill M O (1974) Correspondence analysis: a neglected multivariate method. Appl.
Stat. 23: 340–354.
Holdridge LR (1967) Life Zone Ecology, Tropical Science Center, San Jose´,
Costa Rica.
Houghton, R.A. (1999). The annual net ?ux of carbon to the atmosphere from
changes in land use 1850–1990. Tellus, 51 (B), 298–313.
Hubbell SP (2001) The Unified Neutral Theory of Biodiversity and Biogeography,
Princeton University Press.
Hubbell SP, Condit R, Foster RB (1990) Presence and absence of density
dependence in a neotropical tree community. Philosophical Transactions
of the Royal Society of London Series B, 330: 269 – 281.
Janzen DH (1970) Herbivores and the number of tree species in tropical forests.
American Naturalist 104: 501-528.

89
Jensen, J.R., Cowen, D.J., Althausen, J.D., Narumalani, S., Weathebee, O.
(1993). An evaluation of the Coast watch change detection protocol in
South Carolina. Photogrammetric Engineering and Remote Sensing, 59,
1039–1046.
Jha, C.S., Dutt, C.B.S., And Bawa, K.S. (2000). Deforestation and land use
changes in Western Ghats, India. Current Science, 79 (2), 231-238.
Joseph, S. (2008). Assessment of landcover dynamics and its conservation
implications in tropical forests of Western Ghats, India. Paper presented at
the Conference on Conservation Science, 25-27 March. Cambridge
University.
Joseph, S., G. A. Blackburn, et al. (in press). Monitoring conservation
effectiveness in a global biodiversity hotspot: the contribution of land cover
change assessment. Environmental Monitoring and Assessment, Doi:
10.1007/s10661-008-0571-4.
Kalluri, S., Desch, A., Curry, T., Altstatt, A., Devers, D., Townshend, J.R.G.,
Tucker, C. J. (2001). Historical Satellite data used to map Pan-Amazon
forest cover. EOS Transactions 82 (18), 201.
Kumar, M.A., Singh, M., Srivastava, S. K., Udhayan, A., Kumar, H.N., Sharma, A.
K. (2002). Distribution Patterns, Relative Abundance and Management of
mammals in Indira Gandhi Wildlife Sanctuary, Tamil Nadu, India. Journal
of Bombay Natural History Society, 99 (2), 184 – 210.
Lambin, E.F., Geist, H.J., Lepers, E. (2003). Dynamics of land-use and cover
change. Annual Review of Environment and Resources, 28, 205–41.
Leigh EG, Jr, Davidar P, Dick CW et al. (2004) Why do some tropical forests
have so many species of trees? Biotropica, 36, 447–473.

90
Lu, D., Mausel, P., Brond´Zio, E., Moran, E. (2004). Change detection
techniques. International Journal of Remote Sensing, 25(12), 2365–2407.
Mausel, P., Wu, Y., Li, Y., Moran, E.F., Brondizio, E.S. (1993). Spectral
identification of successional stages following deforestation in the Amazon.
Geocarto International, 4, 61–71.
McArthur R H (1972) Geographical Ecology: Patterns in the Distribution of
Species. Harper and Row, New York.
McCunne B, Mefford MJ (1999) Multivariate Analysis of Ecological Data Ver:
4.14. MjM Software, Oregon, U.S.A.
Menon, S, Bawa, K.S. (1997). Application of GIS, remote sensing and landscape
ecology approach to biodiversity conservation approach in the western
ghats. Current Science, 73,134-145.
Myers, N., Mittermeier, R.A., Mittermeier, C.G., Da Fonseca, G.A.B., Kent, J.,
(2000). Biodiversity hotspots for conservation priorities. Nature, 403, 853–
858.
Nachlinger J, Reese GA (1996) Plant community classification of the Spring
Mountains National Recreation Area, Clark and Nye Counties, Nevada.
Unpublished report, Toiyabe National Forest, Spring Mountains National
Recreation Area, Las Vegas, NV.
Nair NC, Daniel P (1986) The floristic diversity of the Western Ghats and its
conservation: a review. Proceedings of the Indian Academy of Sciences
(Animal Sciences/Plant Sciences Supplement), 127–163.
Nair, S.C. (1991). The southern western ghats: a biodiversity conservation plan.
(International Trust for Art and Cultural Heritage, India).
Nayar, M. P. (1996). Hotspots of Endemic Plants of India. (Tropical Botanic
Garden Research Institute, India).

91
Nelson, R., Holben, B. (1986). Identifying deforestation in Brazil using
multiresolution satellite data. International Journal of Remote Sensing, 7,
429–48.
O’Brien EM, Field R, Whittaker RJ (2000) Climatic gradients in woody plant (tree
and shrub) diversity: water-energy dynamics, residual variation, and
topography. Oikos, 89, 588–600.
Olson DM, Dinerstien E (1998) The global 200: a representative approach to
conserving the earth’s most biologically valuable ecoregions. Conservation
Biology 12: 502-515.
Pijanowski, B. C., Gage, S.H., Long, D.T. And Cooper, W.E., 2000, A Land
Transformation Model for the Saginaw Bay Watershed In J. Sanderson
and L. D. Harris (eds), Landscape Ecology – A Top-Down Approach, pp
162 – 178 (Lewis Publishers).
Prasad, S.N., Vijayan, L., Balachandran, S., Ramachandran, V.S., Verghese,
C.P.A. (1998). Conservation planning for the Western Ghats of
Kerala: I. A GIS approach for location of biodiversity hot spots. Current Science,
75(3), 211-219.
Ramesh, B. R., Pascal, J. P. (1997) Atlas of Endemics of the Western Ghats
(India), (Institute Francias de Pondicherry).
Sader, S. A., Stone, T.A. Joyce, A.T. (1990). Remote sensing of tropical forests:
An overview of research and applications using non photographic sensors.
Photogrammetric Engineering and Remote Sensing, 56, 1343 – 1351
Sajeev, T.K., Srivastava, S.K., Raphael, M.G., Dutt, S., Ramachandran, N.K.
Tyagi, P.C. (2002). Management of Forests in India for Biological Diversity
and Forests Productivity: A New Perspective - Volume III: Anaimalai

92
Conservation Area (ACA). WII-USDA Forest Service Collaborative Project
Report, Wildlife Institute of India, Dehra Dun.
Sandler, T. (1993). Tropical deforestation - Markets and market failures. Land
Economics, 69(3), 225-233.
Shi, H., Singh, A., Kant, S., Zhu, Z., Waller, E. (2005) Integrating Habitat Status,
Human Population Pressure, and Protection Status into Biodiversity
Conservation Priority Setting. Conservation Biology, 19, 1273-1285.
Stibig, H-J., Achard, F., (2003). Assessment of Tropical Forest Cover from
Satellite Images at Different geographical scales: Case studies from
Southeast Asia In P.S. Roy (ed), Geoinformatics for Tropical Ecosystems,
pp 33-48. (Bishen Singh Mahendra Pal Singh, Dehradun, India).
Sundararaju, R. (1987). Management Plan for Indira Gandhi Wildlife Sanctuary
(Office of the Chief Wildlife Warden, Chennai).
ter Braak CJF (1987) The analysis of vegetation-environment relationships by
canonical correspondence analysis. Vegetatio 69: 69–77.
ter Braak CJF (1988) CANOCO: an extension of DECORANA to analyze
species-environment relationships. Vegetatio 75: 159– 160.
ter Braak CJF (1994)Canonical community ordination. Part I: Basic theory and
linear methods. Ecoscience 1:127-140.
ter Braak CJF (1995) Ordination. In: Jongman RHG, ter Braak CJF, van
Togeren OFR (eds) Data analysis in community and landscape ecology.
Cambridge University Press, New York, pp 91–173.
Tilman D (1982) Resource Competition and Community Structure. Princeton
University Press, Princeton, New Jersey.
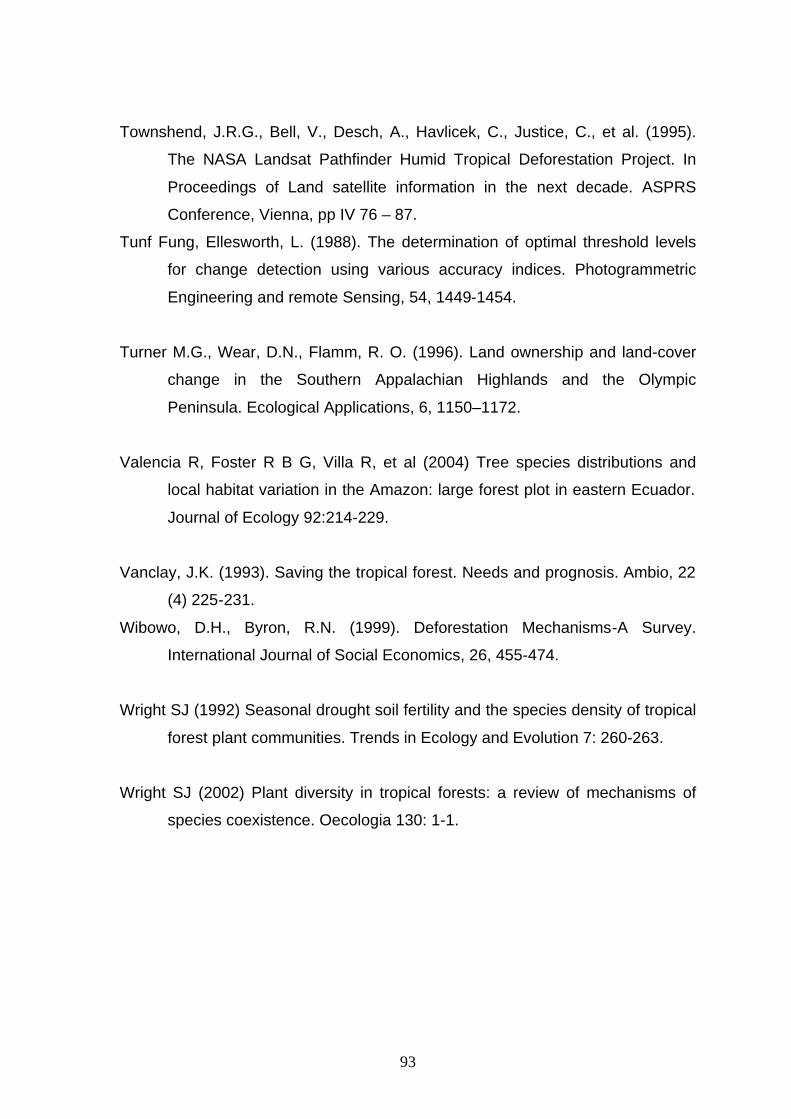
93
Townshend, J.R.G., Bell, V., Desch, A., Havlicek, C., Justice, C., et al. (1995).
The NASA Landsat Pathfinder Humid Tropical Deforestation Project. In
Proceedings of Land satellite information in the next decade. ASPRS
Conference, Vienna, pp IV 76 – 87.
Tunf Fung, Ellesworth, L. (1988). The determination of optimal threshold levels
for change detection using various accuracy indices. Photogrammetric
Engineering and remote Sensing, 54, 1449-1454.
Turner M.G., Wear, D.N., Flamm, R. O. (1996). Land ownership and land-cover
change in the Southern Appalachian Highlands and the Olympic
Peninsula. Ecological Applications, 6, 1150–1172.
Valencia R, Foster R B G, Villa R, et al (2004) Tree species distributions and
local habitat variation in the Amazon: large forest plot in eastern Ecuador.
Journal of Ecology 92:214-229.
Vanclay, J.K. (1993). Saving the tropical forest. Needs and prognosis. Ambio, 22
(4) 225-231.
Wibowo, D.H., Byron, R.N. (1999). Deforestation Mechanisms-A Survey.
International Journal of Social Economics, 26, 455-474.
Wright SJ (1992) Seasonal drought soil fertility and the species density of tropical
forest plant communities. Trends in Ecology and Evolution 7: 260-263.
Wright SJ (2002) Plant diversity in tropical forests: a review of mechanisms of
species coexistence. Oecologia 130: 1-1.

Annuxre1
Area Distribution of Canopy Density in Polachi Range of Indira Gandhi Wildlife Sanctuary
48.95 27.07
7.416.443.835.081.22
<20 % Canopy Density
20-40 % Canopy Density
40-60 % Canopy Density
60-80 % Canopy Density
>80 % Canopy Density
Forest Plantation
Non-Forest
Area Distribution of Canopy Density in Udumalaipettai Range of Indira Gandhi Wildlife Sanctuary
31.94
35.57
9.75
10.839.362.54
<20 % Canopy Density
20-40 % Canopy Density
40-60 % Canopy Density
60-80 % Canopy Density
>80 % Canopy Density
Non-Forest

Area Distribution of Canopy Density in Ulandy Range of Indira Gandhi Wildlife Sanctuary
19.23
33.562.02
19.99
12.87
10.65 1.67
<20 % Canopy Density
20-40 % Canopy Density
40-60 % Canopy Density
60-80 % Canopy Density
>80 % Canopy Density
Forest Plantation
Non-Forest
Area Distribution of Canopy Density in Valparai Range of Indira Gandhi Wildlife Sanctuary
18.99
24.88
6.51 19.30
19.79
0.1710.37
<20 % Canopy Density
20-40 % Canopy Density
40-60 % Canopy Density
60-80 % Canopy Density
>80 % Canopy Density
Agricultural Plantation
Non-Forest
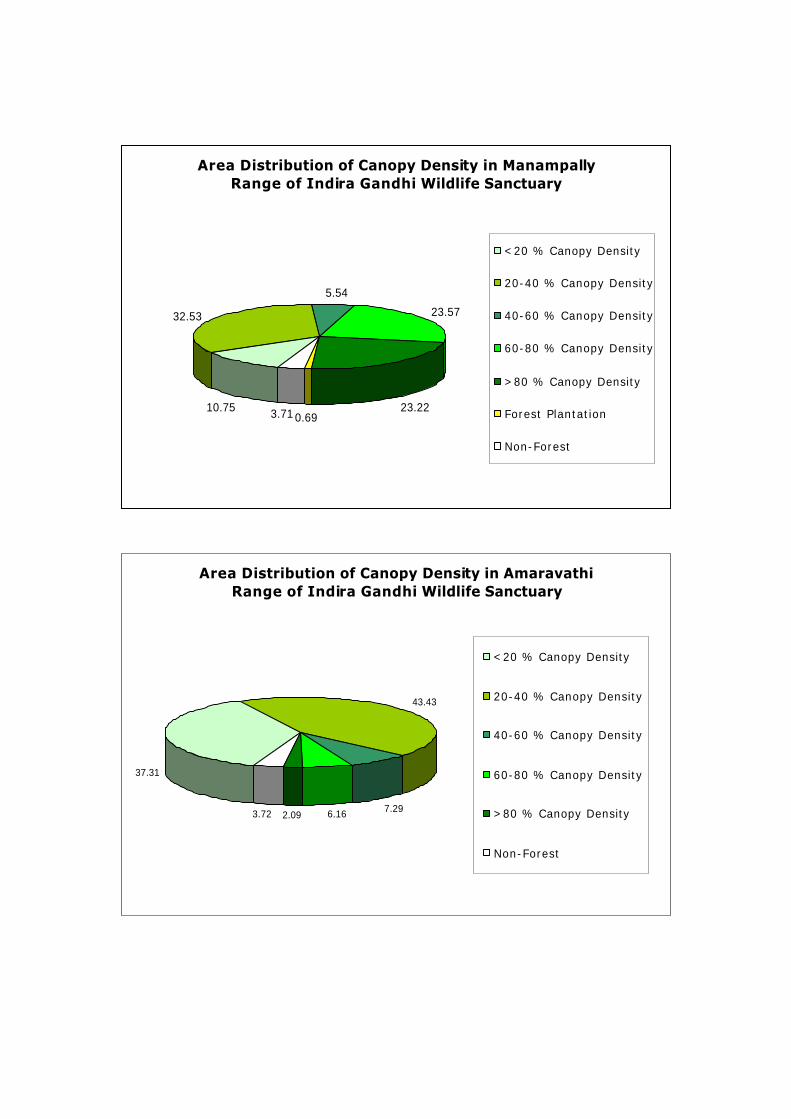
Area Distribution of Canopy Density in Manampally Range of Indira Gandhi Wildlife Sanctuary
10.75
32.53
5.54
23.57
23.223.71 0.69
<20 % Canopy Density
20-40 % Canopy Density
40-60 % Canopy Density
60-80 % Canopy Density
>80 % Canopy Density
Forest Plantation
Non-Forest
Area Distribution of Canopy Density in Amaravathi Range of Indira Gandhi Wildlife Sanctuary
37.31
43.43
7.296.162.093.72
<20 % Canopy Density
20-40 % Canopy Density
40-60 % Canopy Density
60-80 % Canopy Density
>80 % Canopy Density
Non-Forest

Area Distribution of Canopy Density in Manamboly Range of Indira Gandhi Wildlife Sanctuary
5.67
22.09
15.51 20.60
26.99
6.48
1.71
0.96
<20 % Canopy Density
20-40 % Canopy Density
40-60 % Canopy Density
60-80 % Canopy Density
>80 % Canopy Density
Agricultural Plantation
Forest Plantation
Non-Forest

Annuxre2
Area Distribution of Vegetation type & Land-Use in Polachi Range of Indira Gandhi Wildlife Sanctuary
7.127.79
35.656.09
16.81
9.13
16.12
0.04
1.19
0.07
5.36
Evergreen
Semievergreen
Moist Deciduous
Dry Deciduous
Savannah-Woodland
Degraded Forest
Scrub
Grassland
Barren land
Water
Forest Plantation
Area Distribution of Vegetation Type & Land-Use in Udumalaipettai Range of Indira Gandhi Wildlife
Sanctuary
6.8413.85
37.678.69
3.57
10.36
6.2710.20
0.99
1.55
0.01
Evergreen
Semievergreen
Moist Deciduous
Dry Dec iduous
Shola
Savannah-Woodland
Degraded Forest
Scrub
Grassland
Barren land
Water

Area Distribution of Vegetation type & Land-Use in Ulandy Range of Indira Gandhi Wildlife Sanctuary
15.73
23.5738.99
1.6414.84
0.94
2.43
0.02
1.28
0.55
11.88
Evergreen
Semievergreen
Moist Deciduous
Dry Deciduous
Savannah-Woodland
Degraded Forest
Scrub
Grassland
Barren land
Water
Forest Plantation
Area Distribution of Vegetation type & Land-Use in Valparai Range of Indira Gandhi Wildlife Sanctuary
14.02
22.92
27.431.92
7.39
10.03
1.40
4.537.33
1.83
1.21
0.17 Evergreen
Semievergreen
Moist Deciduous
Dry Dec iduous
Shola
Savannah-Woodland
Degraded Forest
Scrub
Grassland
Barren land
Water
Agricultural Plantation
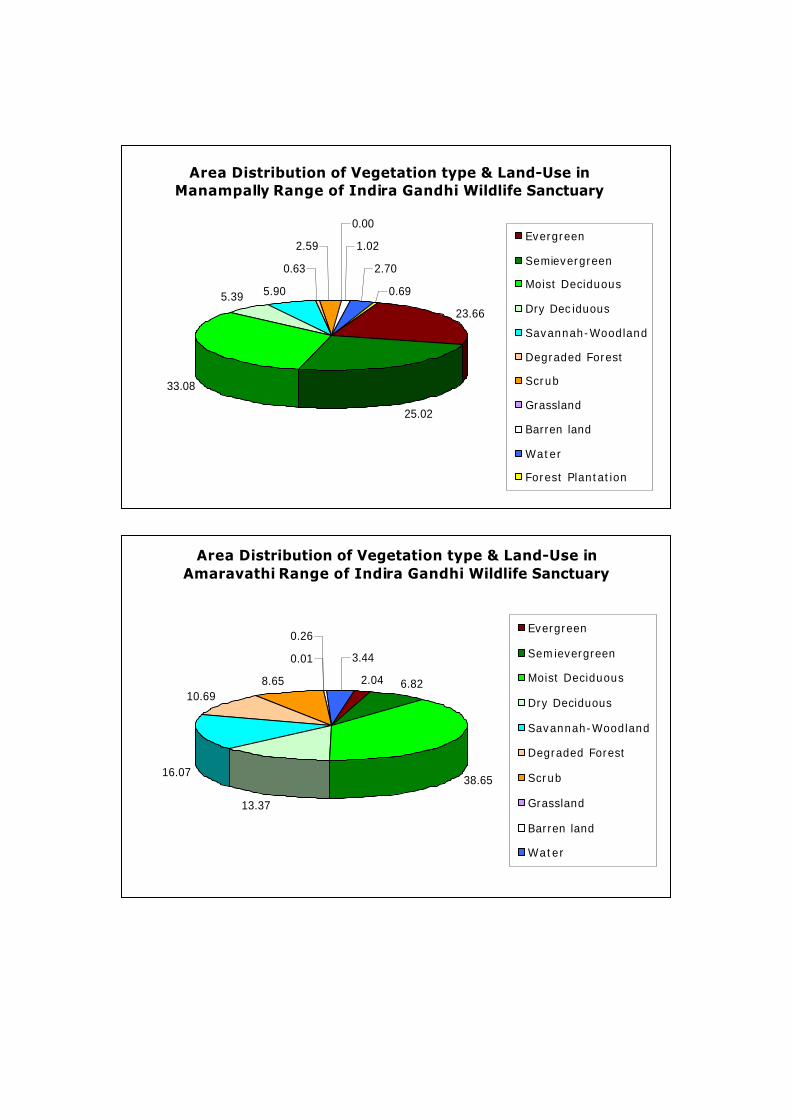
Area Distribution of Vegetation type & Land-Use in Manampally Range of Indira Gandhi Wildlife Sanctuary
23.66
25.02
33.08
5.39 5.90
0.63
2.59
0.00
1.02
2.70
0.69
Evergreen
Semievergreen
Moist Deciduous
Dry Dec iduous
Savannah-Woodland
Degraded Forest
Scrub
Grassland
Barren land
Water
Forest Plantation
Area Distribution of Vegetation type & Land-Use in Amaravathi Range of Indira Gandhi Wildlife Sanctuary
2.04 6.82
38.65
13.37
16.07
10.698.65
0.01
0.26
3.44
Evergreen
Semievergreen
Moist Deciduous
Dry Deciduous
Savannah-Woodland
Degraded Forest
Scrub
Grassland
Barren land
Water
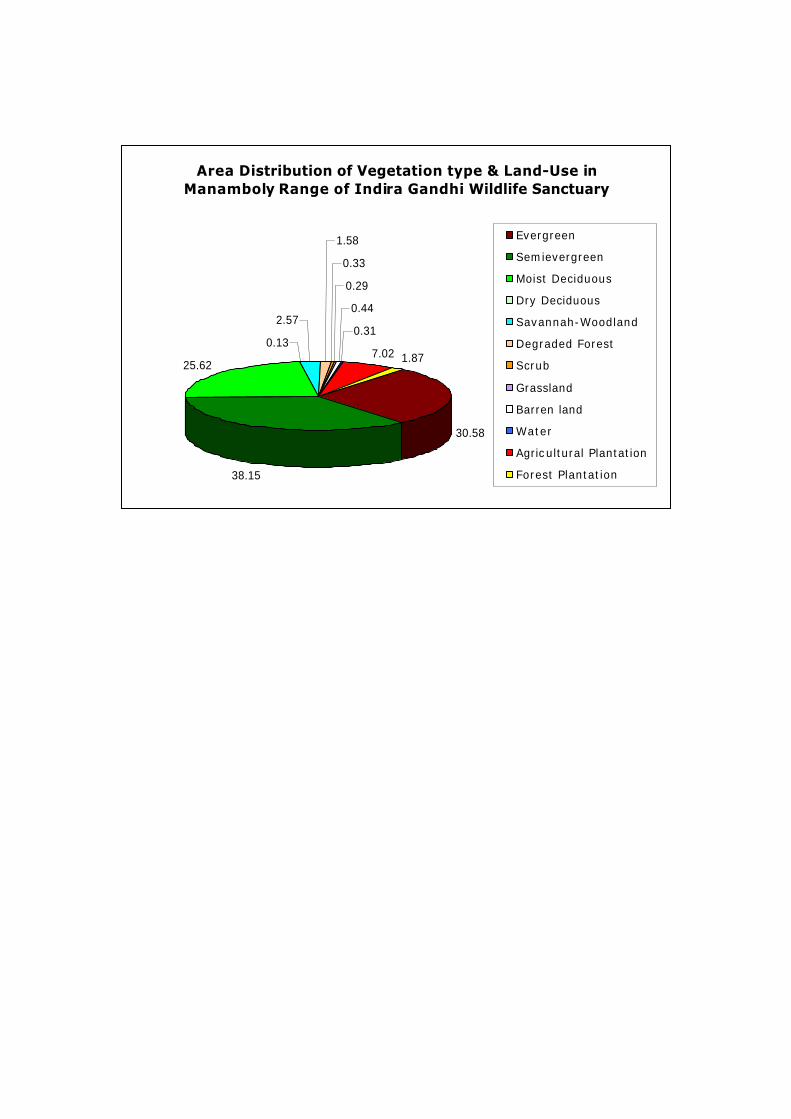
Area Distribution of Vegetation type & Land-Use in Manamboly Range of Indira Gandhi Wildlife Sanctuary
30.58
38.15
25.62
0.13
2.57
1.58
0.33
0.29
0.44
0.31
7.02 1.87
Evergreen
Semievergreen
Moist Deciduous
Dry Deciduous
Savannah-Woodland
Degraded Forest
Scrub
Grassland
Barren land
Water
Agricultural Plantation
Forest Plantation
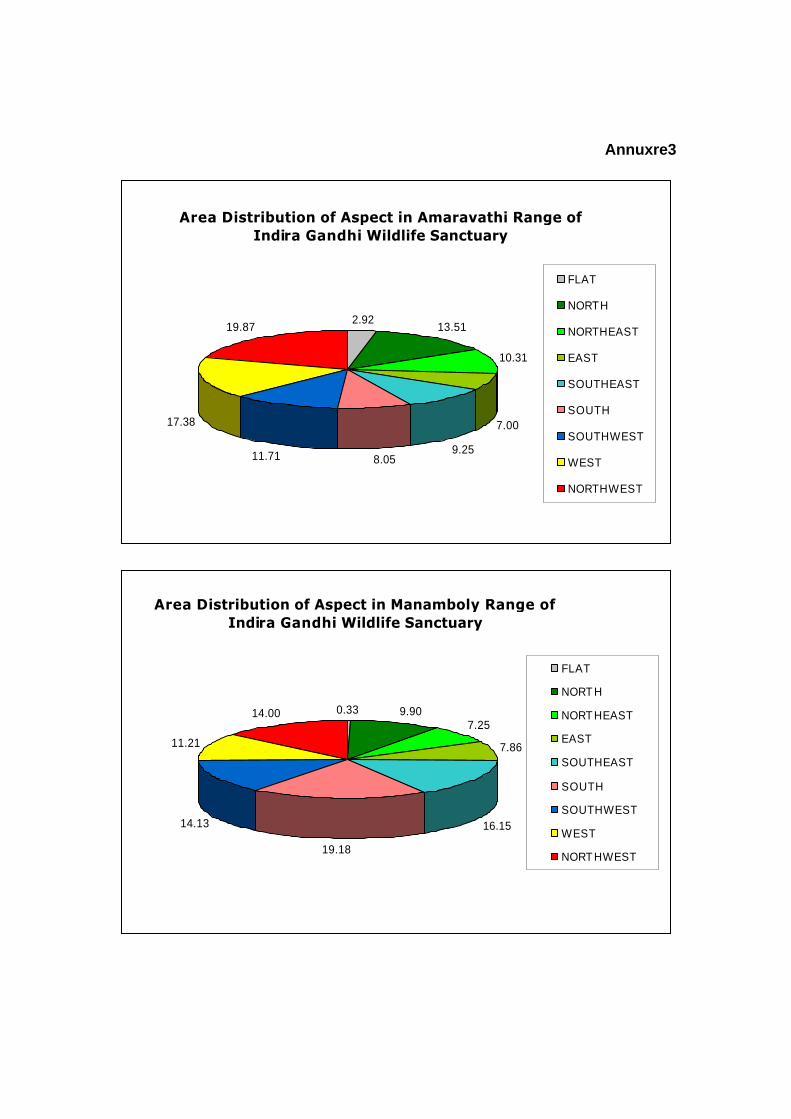
Annuxre3
Area Distribution of Aspect in Amaravathi Range of Indira Gandhi Wildlife Sanctuary
2.9213.51
10.31
7.00
9.258.0511.71
17.38
19.87
FLAT
NORTH
NORTHEAST
EAST
SOUTHEAST
SOUTH
SOUTHWEST
WEST
NORTHWEST
Area Distribution of Aspect in Manamboly Range of Indira Gandhi Wildlife Sanctuary
0.33 9.907.25
7.86
16.15
19.18
14.13
11.21
14.00
FLAT
NORTH
NORTHEAST
EAST
SOUTHEAST
SOUTH
SOUTHWEST
WEST
NORTHWEST

Area Distribution of Aspect in Manampally Range of Indira Gandhi Wildlife Sanctuary
2.59 10.72
7.58
9.72
16.2910.17
8.30
13.11
21.51
FLAT
NORTH
NORTHEAST
EAST
SOUTHEAST
SOUTH
SOUTHWEST
WEST
NORTHWEST
Area Distribution of Aspect in Polachi Range of Indira Gandhi Wildlife Sanctuary
22.37
16.51
12.049.957.06
7.05
7.82
17.21
NORTH
NORTHEAST
EAST
SOUTHEAST
SOUTH
SOUTHWEST
WEST
NORTHWEST
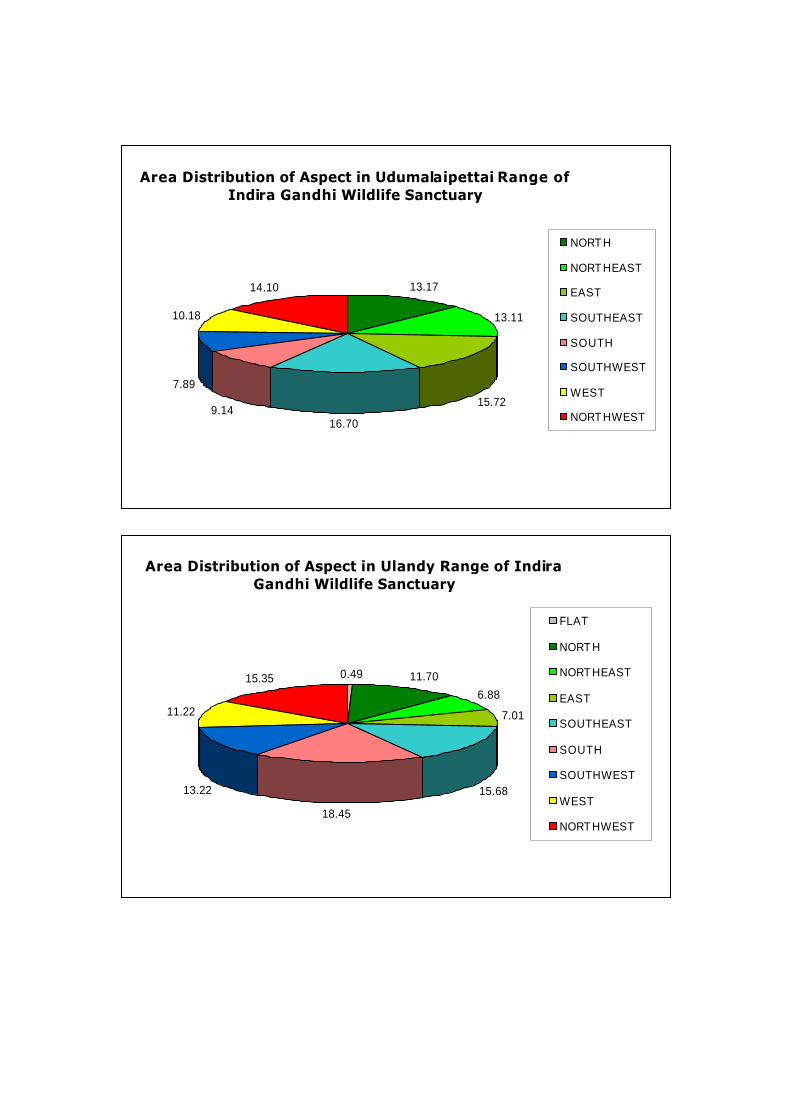
Area Distribution of Aspect in Udumalaipettai Range of Indira Gandhi Wildlife Sanctuary
13.17
13.11
15.72
16.709.14
7.89
10.18
14.10
NORTH
NORTHEAST
EAST
SOUTHEAST
SOUTH
SOUTHWEST
WEST
NORTHWEST
Area Distribution of Aspect in Ulandy Range of Indira Gandhi Wildlife Sanctuary
0.49 11.70
6.88
7.01
15.68
18.45
13.22
11.22
15.35
FLAT
NORTH
NORTHEAST
EAST
SOUTHEAST
SOUTH
SOUTHWEST
WEST
NORTHWEST

Area Distribution of Aspect in Valparai Range of Indira Gandhi Wildlife Sanctuary
1.07 14.05
12.39
9.48
10.7912.27
11.98
11.73
16.25
FLAT
NORTH
NORTHEAST
EAST
SOUTHEAST
SOUTH
SOUTHWEST
WEST
NORTHWEST

Annuxre4
Area Distribution of Elevation in Amaravathi Range of Indira Gandhi Wildlife Sanctuary
27.89
49.77
14.326.70 1.32
175-500 Meter
500-1000 Meter
1000-1500 Meter
1500-2000 Meter
2000-2514 Meter
Area Distribution of Elevation in Manamboly Range of Indira Gandhi Wildlife Sanctuary
15.92
73.99
10.09 500-1000 Meter
1000-1500 Meter
1500-2000 Meter

Area Distribution of Elevation in Manampally Range of Indira Gandhi Wildlife Sanctuar
81.08
17.92 1.00 500-1000 Meter
1000-1500 Meter
1500-2000 Meter
Area Distribution ofElevation in Polachi Range of Indira Gandhi Wildlife Sanctuary
38.76
45.75
15.26 0.24175-500 Meter
500-1000 Meter
1000-1500 Meter
1500-2000 Meter
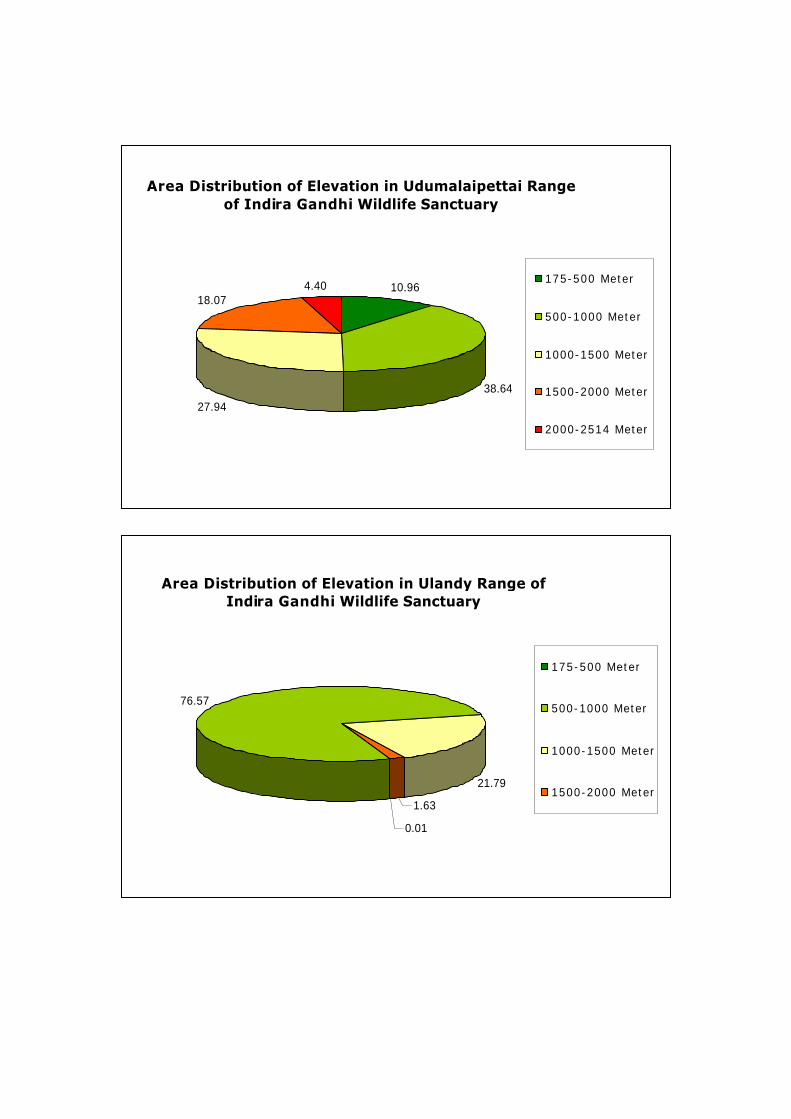
Area Distribution of Elevation in Udumalaipettai Range of Indira Gandhi Wildlife Sanctuary
10.96
38.64
27.94
18.074.40 175-500 Meter
500-1000 Meter
1000-1500 Meter
1500-2000 Meter
2000-2514 Meter
Area Distribution of Elevation in Ulandy Range of Indira Gandhi Wildlife Sanctuary
0.01
76.57
21.79
1.63
175-500 Meter
500-1000 Meter
1000-1500 Meter
1500-2000 Meter

Area Distribution of Elevation in Valparai Range of Indira Gandhi Wildlife Sanctuary
43.63
30.84
19.81
5.72500-1000 Meter
1000-1500 Meter
1500-2000 Meter
2000-2514 Meter
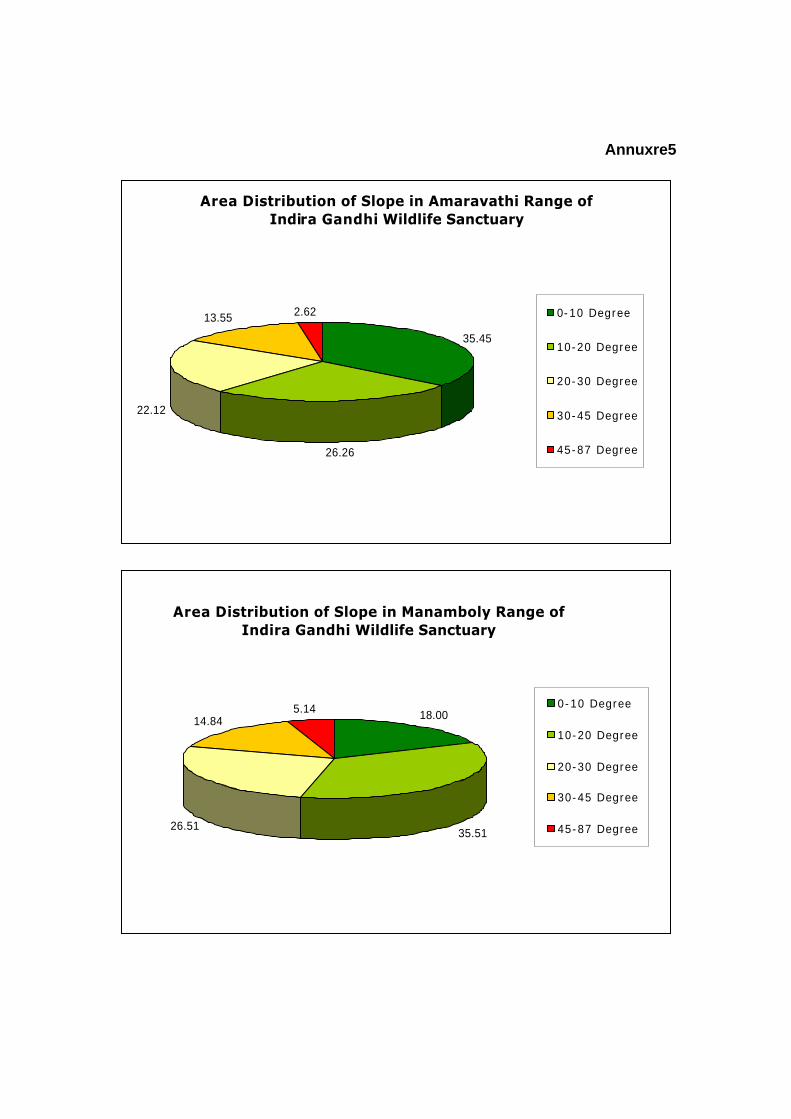
Annuxre5
Area Distribution of Slope in Amaravathi Range of Indira Gandhi Wildlife Sanctuary
35.45
26.26
22.12
13.55 2.62 0-10 Degree
10-20 Degree
20-30 Degree
30-45 Degree
45-87 Degree
Area Distribution of Slope in Manamboly Range of Indira Gandhi Wildlife Sanctuary
18.00
35.5126.51
14.845.14 0-10 Degree
10-20 Degree
20-30 Degree
30-45 Degree
45-87 Degree

Area Distribution of Slope in Manampally Range of Indira Gandhi Wildlife Sanctuary
17.66
37.3528.50
14.57 1.920-10 Degree
10-20 Degree
20-30 Degree
30-45 Degree
45-87 Degree
Area Distribution in Polachi Range of Indira Gandhi Wildlife Sanctuary
19.66
22.85
26.50
23.79
7.190-10 Degree
10-20 Degree
20-30 Degree
30-45 Degree
45-87 Degree

Area Distribution of Slope in Udumalaipettai Range of Indira Gandhi Wildlife Sanctuary
17.12
27.87
27.20
21.74
6.06 0-10 Degree
10-20 Degree
20-30 Degree
30-45 Degree
45-87 Degree
Area Distribution of Slope in Ulandy Range of Indira Gandhi Wildlife Sanctuary
25.60
36.97
22.91
12.74 1.78
0-10 Degree
10-20 Degree
20-30 Degree
30-45 Degree
45-87 Degree

Annuxre6 6.1 Beat and Section Wise area Distribution of Landuse & Landcover of Polachi Range of Indira Gandhi Wildlife
Sanctuary
Range: Polachi
Section Name ALIYAR SETHULMADI EAST SETHULMADI WEST
Beat Name ALIYA
R ARTHANRIPALAYA
M VILLONNI
E MANGARA
I PACHATHANNI
R AYIRAMKA
L POTHAMAD
A Vegetation Type & Land-Use
Evergreen 0.06 0.10 2.53 1.63 2.65 0.32 0.01 Shola Semievergreen 0.20 0.32 2.86 2.39 1.67 0.48 0.05 Moist Deciduous 4.31 3.63 9.22 7.11 5.26 4.10 2.85 Dry Deciduous 1.99 0.72 1.71 0.32 0.07 0.38 1.04 Savannah-Woodland 4.88 4.71 2.17 1.55 0.88 1.20 1.82 Teak Plantation Grassland 0.01 0.03 Degraded Forest 3.03 3.38 1.58 1.21 0.02 0.02 0.10 Scrub 4.57 3.69 2.76 0.61 0.11 0.51 4.24 Barren land 0.12 0.06 0.45 0.14 0.01 0.13 0.29 Water 0.04 0.03 Tea Plantation Eucalyptus Plantation 0.39 3.55 1.54 Cinchona Plantation Total Area (sq km) 19.21 16.62 23.34 15.03 11.07 10.69 11.94

6.2 Beat and Section Wise area Distribution of Landuse & Landcover of Udumalaipettai Range of Indira Gandhi
Wildlife Sanctuary
Range : Udumalaipettai Section Name MANUPATTI KARATTUR DHALI
Beat Name
EASAL THITTU EAST
EASAL THITTU WEST
KOMBU WEST KARATTUR KARATTUR PARUTHIYUR KURUMALAI THIRUMURTHI
MALAI VALLAKONDAPURAM
Vegetation Type & Land-Use
Evergreen 0.11 0.62 2.73 0.78 5.19 0.11 2.14 4.26 1.03 Shola 2.50 3.00 0.01 3.36 Semievergreen 3.39 4.29 11.22 0.82 6.22 0.22 3.04 3.73 1.44 Moist Deciduous 18.65 16.45 14.74 6.58 1.66 3.79 9.48 9.74 12.42 Dry Deciduous 6.25 2.14 2.77 2.98 1.98 1.30 1.70 2.47 Savannah-Woodland 4.25 2.48 5.69 1.11 0.26 2.71 1.80 3.80 3.59 Teak Plantation Grassland 0.02 1.07 1.08 0.29 Degraded Forest 3.86 1.68 5.15 1.03 0.08 0.82 0.56 1.16 1.22 Scrub 3.55 1.53 1.70 2.27 0.44 7.20 1.56 3.25 3.83 Barren land 0.03 0.13 0.27 0.04 0.09 0.63 0.13 0.26 2.27 Water 0.02 Tea Plantation Eucalyptus Plantation Cinchona Plantation Total Area (sq km) 40.11 29.39 47.85 15.61 18.02 17.46 20.03 31.55 28.27

6.3 Beat and Section Wise area Distribution of Landuse & Landcover of ValparaiRange of Indira Gandhi Wildlife Sanctuary
Range: Valparai Section Name AKKAMALAI ATTAKATTY IYERPADI
Beat Name AKKAMALAI GRASSHILLS ATTAKATTY ATTAKATTY UPPER ALIYAR IYERPADI KAVURKAL
Vegetation Type & Land-Use
Evergreen 3.18 9.66 0.01 3.13 1.47 6.48 1.55 Shola 7.57 4.25 1.62 Semievergreen 2.35 9.65 0.15 7.36 3.34 15.36 3.44 Moist Deciduous 2.27 2.76 1.38 13.27 14.92 10.28 4.99 Dry Deciduous 0.88 0.05 2.56 0.00 0.00 Savannah-Woodland 5.26 3.42 0.33 1.23 5.20 2.36 0.44 Teak Plantation Grassland 8.85 3.59 0.10 0.79 Degraded Forest 0.54 0.32 0.03 0.17 1.11 0.19 0.19 Scrub 0.97 0.78 0.52 0.86 3.97 0.75 0.38 Barren land 0.89 1.43 NIL 0.01 0.05 0.24 0.70 Water 0.65 0.53 1.01 Tea Plantation 0.31 Eucalyptus Plantation Cinchona Plantation Total Area (sq km) 31.86 36.17 3.29 27.10 33.26 39.10 11.82

6.4 Beat and Section Wise area Distribution of Landuse & Landcover of Amaravathi Range of Indira Gandhi Wildlife Sanctuary
Range: Amaravathi Section Name KALLAPURAM MANJANPATTI
Beat Name KALLAPURAM KOMBU EAST KILANAVAYAL MANJANPATTI TALINGI
Vegetation Type & Land-Use Evergreen 0.07 0.02 2.74 1.23 0.05 Shola Semievergreen 2.42 1.15 3.78 3.73 2.66 Moist Deciduous 18.75 10.13 13.77 12.76 22.39 Dry Deciduous 4.60 1.95 5.26 5.35 9.75 Savannah-Woodland 6.43 4.72 3.54 6.05 11.63 Teak Plantation Grassland 0.02 0.01 Degraded Forest 6.95 6.97 1.09 0.97 5.54 Scrub 4.46 2.64 2.67 3.70 3.94 Barren land 0.03 0.07 0.02 0.30 0.11 Water 0.57 6.22 0.13 Tea Plantation Eucalyptus Plantation Cinchona Plantation Total Area (sq km) 44.27 33.87 32.87 34.12 56.22

6.5 Beat and Section Wise area Distribution of Landuse & Landcover of Ulandy Range of Indira Gandhi Wildlife Sanctuary
Range:Ulandy Sections Name TOPSLIP VARAGALIYAR
Beat Name TOPSLIP CHINNAR VARAGALIYAR
Vegetation Type & Land-Use Evergreen 1.95 0.25 9.19 Shola Semievergreen 4.44 1.48 11.16 Moist Deciduous 13.94 4.78 9.52 Dry Deciduous 0.73 0.33 0.13 Savannah-Woodland 3.80 4.02 2.93 Teak Plantation 1.38 6.79 0.44 Grassland 0.02 Degraded Forest 0.31 0.09 0.28 Scrub 0.54 0.67 0.56 Barren land 0.14 0.12 0.68 Water 0.00 0.40 Tea Plantation Eucalyptus Plantation Cinchona Plantation Total Area (sq km) 27.24 18.91 34.96
6.6 Beat and Section Wise area Distribution of Landuse & Landcover of
Manamboly Range of Indira Gandhi Wildlife Sanctuary
Range: Manamboly Section Name KALLAR Beat Name CHINNAKALLAR PERIYA KALLAR Vegetation Type & Land-Use Evergreen 0.56 19.82 Shola Semievergreen 9.43 16.00 Moist Deciduous 11.91 5.17 Dry Deciduous 0.08 0.01 Savannah-Woodland 1.30 0.41

Range: Manamboly Section Name KALLAR Beat Name CHINNAKALLAR PERIYA KALLAR Vegetation Type & Land-Use Teak Plantation Grassland 0.09 0.11 Degraded Forest 1.02 0.04 Scrub 0.16 0.06 Barren land 0.20 0.09 Water 0.07 0.13 Tea Plantation 0.03 2.82 Eucalyptus Plantation 1.24 Cinchona Plantation 1.83 Total Area (sq km) 24.86 47.72
6.7 Beat and Section Wise area Distribution of Landuse & Landcover of
Manampally Range of Indira Gandhi Wildlife Sanctuary
Range: Manampally Section Name MANAMPALLY Beat Name ANALI MANAMPALLI SHEIKALMUDI URULIKAL Vegetation Type & Land-Use
Evergreen 3.31 2.23 3.77 6.28 Shola Semievergreen 6.59 3.42 3.87 2.60 Moist Deciduous 2.55 7.89 7.06 4.29 Dry Deciduous 1.50 1.85 0.19 Savannah-Woodland 0.38 2.44 0.90 0.17 Teak Plantation 0.45 Grassland Degraded Forest 0.07 0.29 0.05 0.01 Scrub 0.16 0.95 0.51 0.08 Barren land 0.26 0.08 0.32 0.01 Water 1.06 0.71 Tea Plantation Eucalyptus Plantation Cinchona Plantation Total Area (sq km) 13.37 20.32 19.05 13.65
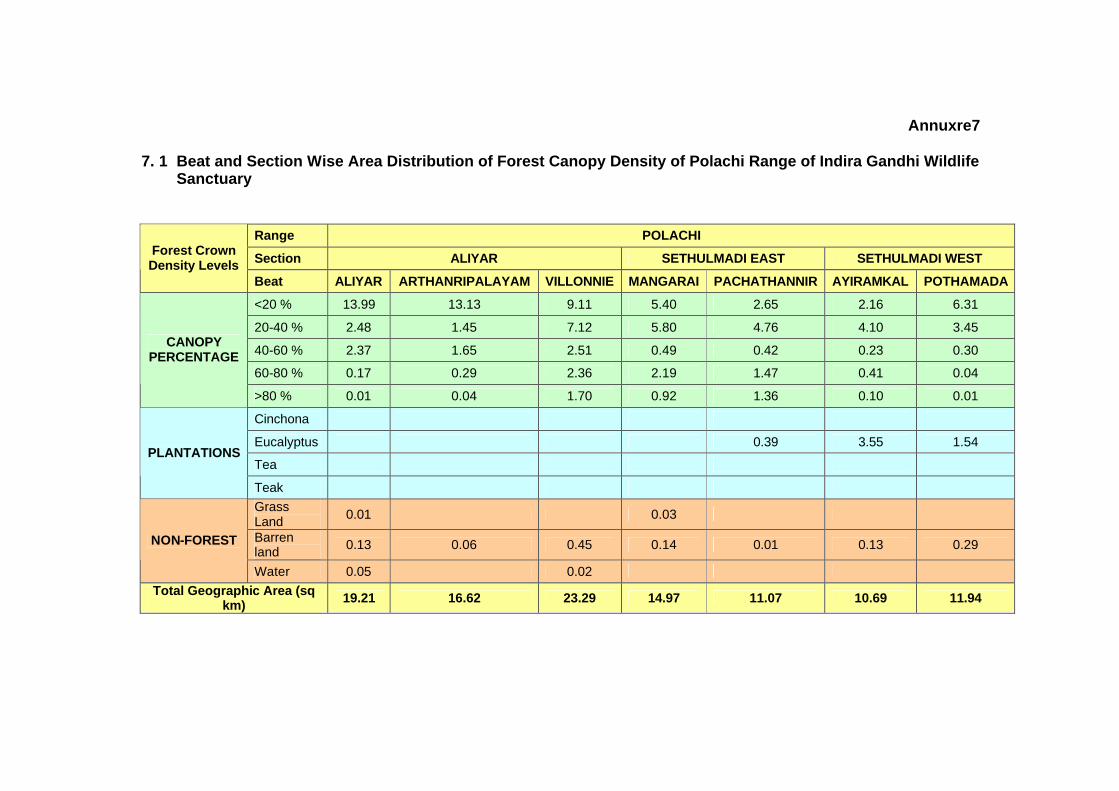
Annuxre7 7. 1 Beat and Section Wise Area Distribution of Forest Canopy Density of Polachi Range of Indira Gandhi Wildlife
Sanctuary
Range POLACHI
Section ALIYAR SETHULMADI EAST SETHULMADI WEST Forest Crown Density Levels
Beat ALIYAR ARTHANRIPALAYAM VILLONNIE MANGARAI PACHATHANNIR AYIRAMKAL POTHAMADA
<20 % 13.99 13.13 9.11 5.40 2.65 2.16 6.31
20-40 % 2.48 1.45 7.12 5.80 4.76 4.10 3.45
40-60 % 2.37 1.65 2.51 0.49 0.42 0.23 0.30
60-80 % 0.17 0.29 2.36 2.19 1.47 0.41 0.04
CANOPY PERCENTAGE
>80 % 0.01 0.04 1.70 0.92 1.36 0.10 0.01
Cinchona
Eucalyptus 0.39 3.55 1.54
Tea PLANTATIONS
Teak Grass Land 0.01 0.03
Barren land 0.13 0.06 0.45 0.14 0.01 0.13 0.29 NON-FOREST
Water 0.05 0.02 Total Geographic Area (sq
km) 19.21 16.62 23.29 14.97 11.07 10.69 11.94

7.2 Beat and Section Wise Area Distribution of Forest Canopy Density of Udumalaipettai Range of Indira Gandhi
Wildlife Sanctuary
Range UDUMALAIPETTAI Section MANUPATTI KARATTUR DHALI Forest Crown
Density Levels Beat
EASAL THITT
U EAST
EASAL THITTU WEST
KOMBU WEST
KARATTUR
KARATTUR
PARUTHIYUR
KURUMALAI
THIRUMURTHI MALAI
VALLAKONDAPURAM
<20 % 12.91 8.67 13.62 6.03 2.02 11.50 4.74 9.98 9.83 20-40 % 21.28 11.58 15.90 5.80 0.76 3.48 8.64 8.82 12.07 40-60 % 2.67 5.62 1.54 2.84 3.21 1.66 2.02 2.38 2.30 60-80 % 3.12 2.79 10.38 0.74 3.54 0.18 2.48 2.74 0.92
CANOPY PERCENTAG
E >80 % 0.10 0.56 5.08 0.17 7.32 0.02 2.03 7.08 0.89 Cinchona Eucalyptus
Tea
PLANTATIONS
Teak Grass Land 0.02 1.07 1.08 0.29
Barren land 0.03 0.13 0.27 0.04 0.09 0.62 0.12 0.26 2.27
NON-FOREST
Water 0.02 Total Geographic Area
(sq km) 40.10 29.38 47.85 15.60 18.02 17.46 20.03 31.55 28.27

7. 3 Beat and Section Wise Area Distribution of Forest Canopy Density of Valparai Range of Indira Gandhi
Wildlife Sanctuary
Range VALPARAI
Section AKKAMALAI ATTAKATTY IYERPADI Forest Crown Density Levels
Beat AKKAMALAI GRASSHILLS ATTAKATTY ATTAKATTY UPPER ALIYAR IYERPADI KAVURKAL
<20 % 7.55 6.19 0.96 2.85 11.54 4.19 1.28 20-40 % 2.02 2.51 1.43 11.98 13.53 9.35 4.47 40-60 % 0.66 0.84 0.77 2.16 3.54 3.13 0.77 60-80 % 1.69 8.77 0.13 6.12 2.69 12.78 2.95
CANOPY PERCENTAGE
>80 % 10.18 12.54 0.00 2.94 1.26 7.57 1.53
Cinchona
Eucalyptus Tea 0.31
PLANTATIONS
Teak
Grass Land 8.87 3.59 0.10 0.80
Barren land 0.89 1.42 0.01 0.05 0.24 0.70
NON-FOREST
Water 0.65 0.55 1.02
Total Geographic Area (sq km) 31.86 36.17 3.29 26.71 33.26 39.08 11.70

7.4 Beat and Section Wise Area Distribution of Forest Canopy Density of Amaravathi Range of Indira Gandhi
Wildlife Sanctuary
Range AMARAVATHI Section KALLAPURAM MANJANPATTI Forest Crown
Density Levels Beat KALLAPURAM KOMBU EAST KILANAVAYAL MANJANPATTI TALINGI <20 % 19.04 14.81 8.63 10.96 21.66 20-40 % 19.06 11.36 14.13 15.49 27.40 40-60 % 3.21 0.27 4.19 3.00 4.00 60-80 % 2.29 1.12 2.90 3.39 2.71
CANOPY PERCENTAGE
>80 % 0.06 0.01 2.99 0.96 0.19 Cinchona Eucalyptus Tea
PLANTATIONS
Teak Grass Land 0.02 0.01 Barren land 0.03 0.07 0.02 0.31 0.11 NON-FOREST Water 0.57 6.23 0.13
Total Geographic Area (sq km) 44.27 33.86 32.86 34.12 56.21

7.5 Beat and Section Wise Area Distribution of Forest Canopy Density of Manampally Range of Indira Gandhi Wildlife Sanctuary
7.6 Beat and Section Wise Area Distribution of Forest Canopy Density of
Ulandy Range of Indira Gandhi Wildlife Sanctuary
Range ULANDY Section TOPSLIP VARAGALIYAR Forest Crown
Density Levels Beat TOPSLIP CHINNAR VARAGALIYAR <20 % 5.54 5.21 4.84 20-40 % 13.72 4.80 8.67 40-60 % 0.93 0.15 0.55 60-80 % 4.00 1.28 10.92
CANOPY PERCENTAGE
>80 % 1.50 0.14 8.79 Cinchona Eucalyptus Tea
PLANTATIONS
Teak 1.38 6.80 0.45 Grass Land 0.02 Barren land 0.14 0.12 0.67 NON-FOREST Water 0.00 0.40
Total Geographic Area (sq km) 27.24 18.91 34.89
Range MANAMPALLY Section MANAMPALLY
Forest Crown Density Levels
Beat ANALI MANAMPALLI SHEIKALMUDI URULIKAL <20 % 0.79 4.23 1.66 0.45 20-40 % 2.38 8.00 7.28 3.91 40-60 % 0.15 1.11 1.79 0.63 60-80 % 6.46 3.25 3.51 2.41
CANOPY PERCENTAGE
>80 % 3.28 2.11 3.77 6.24 Cinchona Eucalyptus Tea
PLANTATIONS
Teak 0.46 Grass Land
Barren land 0.26 0.07 0.33 0.01 NON-FOREST
Water 1.08 0.71 Total Geographic Area (sq
km) 13.32 20.32 19.05 13.64

7.7 Beat and Section Wise Area Distribution of Forest Canopy Density of
Manambolly Range of Indira Gandhi Wildlife Sanctuary
Range MANAMBOLY Section KALLAR
Forest Crown Density Levels
Beat CHINNAKALLAR PERIYA KALLAR <20 % 2.48 1.63 20-40 % 11.19 4.84 40-60 % 10.00 1.25 60-80 % 0.23 14.72
CANOPY PERCENTAGE
>80 % 0.55 19.03 Cinchona 1.83 Eucalyptus 1.24 Tea 0.03 2.84
PLANTATIONS
Teak Grass Land 0.10 0.11 Barren land 0.20 0.09 NON-FOREST Water 0.07 0.14
Total Geographic Area (sq km) 24.85 47.72

Annuxre8
TALINGI
IYERPADIKOMBU WEST
KALLAPURAM
TOPSLIP
PERIYA KALLAR
GRASSHILLS
AKKAMALAI
ALIYAR
VARAGALIYAR
ANALI
VILLONNIE
CHINNAR
MANAMPALLI
KOMBU EAST
MANJANPATTI
ATTAKATTY
KILANAVAYAL
UPPER ALIYAR EASAL THITTU EAST
KARATTUR
KURUMALAI
CHINNAKALLAR
KARATTUR
THIRUMURTHI MALAI
EASAL THITTU WESTVALLAKONDAPURAM
MANGARAI
URULIKAL
SHEIKALMUDI
PARUTHIYUR
KAVURKAL
POTHAMADA
AYIRAMKALARTHANRIPALAYAM
PACHATHANNIR
ATTAKATTY
77°20'0"E
77°20'0"E
77°15'0"E
77°15'0"E
77°10'0"E
77°10'0"E
77°5'0"E
77°5'0"E
77°0'0"E
77°0'0"E
76°55'0"E
76°55'0"E
76°50'0"E
76°50'0"E
10°3
0'0"
N
10°3
0'0"
N
10°2
5'0"
N
10°2
5'0"
N
10°2
0'0"
N
10°2
0'0"
N
10°1
5'0"
N
10°1
5'0"
N
STATUS OF BARKING DEER IN INDIRA GANDHI WILDLIFE SANCTUARY
0 3 61.5 Km
INDIA
Participating Organizations
National Remote Sensing CentreForest Department, Tamil Nadu
Wildlife Institute of IndiaSurvey of India
Funding Agency
SC-B\NNRMS, MoEF, GoI
TAMIL NADU
Legend
Barking Deer
Encounter Rate (Animal/km)
Boundary of IGWLS
Absent
Low (1-2)
Medium (3-4)
High (5)
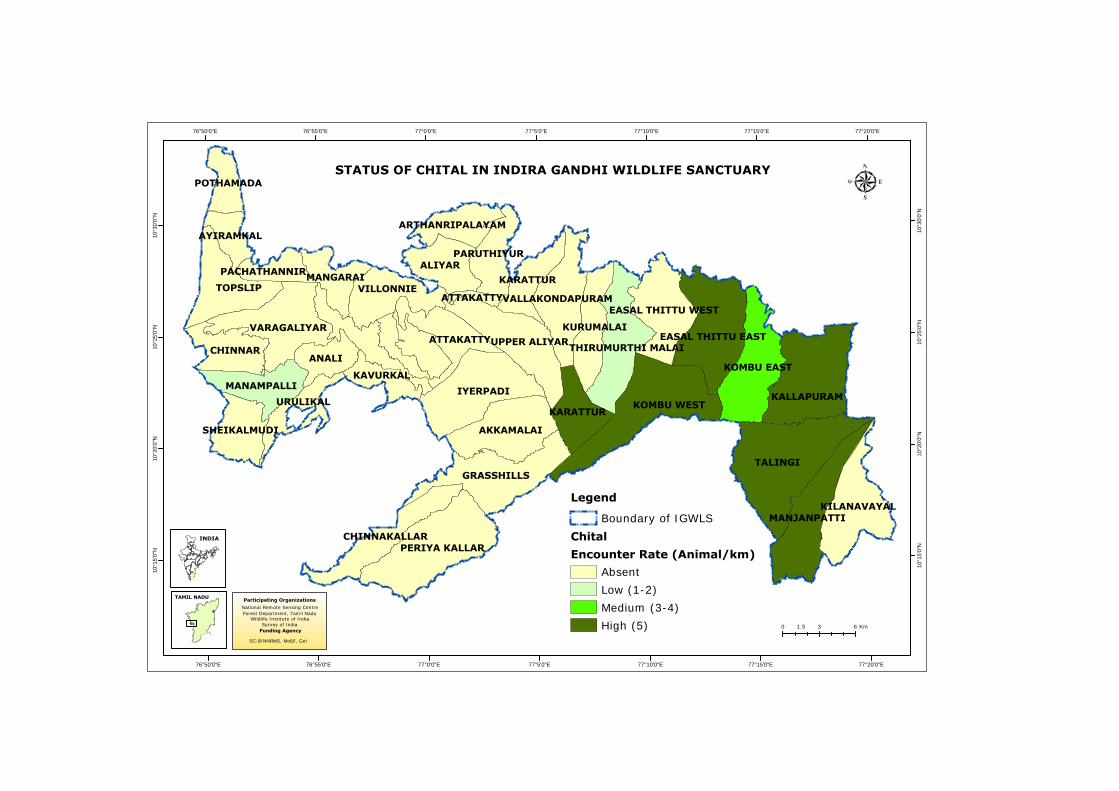
TALINGI
IYERPADIKOMBU WEST
KALLAPURAM
TOPSLIP
PERIYA KALLAR
GRASSHILLS
AKKAMALAI
ALIYAR
VARAGALIYAR
ANALI
VILLONNIE
CHINNAR
MANAMPALLI
KOMBU EAST
MANJANPATTI
ATTAKATTY
KILANAVAYAL
UPPER ALIYAR EASAL THITTU EAST
KARATTUR
KURUMALAI
CHINNAKALLAR
KARATTUR
THIRUMURTHI MALAI
EASAL THITTU WESTVALLAKONDAPURAM
MANGARAI
URULIKAL
SHEIKALMUDI
PARUTHIYUR
KAVURKAL
POTHAMADA
AYIRAMKALARTHANRIPALAYAM
PACHATHANNIR
ATTAKATTY
77°20'0"E
77°20'0"E
77°15'0"E
77°15'0"E
77°10'0"E
77°10'0"E
77°5'0"E
77°5'0"E
77°0'0"E
77°0'0"E
76°55'0"E
76°55'0"E
76°50'0"E
76°50'0"E
10°3
0'0"
N
10°3
0'0"
N
10°2
5'0"
N
10°2
5'0"
N
10°2
0'0"
N
10°2
0'0"
N
10°1
5'0"
N
10°1
5'0"
N
STATUS OF CHITAL IN INDIRA GANDHI WILDLIFE SANCTUARY
0 3 61.5 Km
INDIA
Participating Organizations
National Remote Sensing CentreForest Department, Tamil Nadu
Wildlife Institute of IndiaSurvey of India
Funding Agency
SC-B\NNRMS, MoEF, GoI
TAMIL NADU
Legend
Chital
Encounter Rate (Animal/km)
Boundary of IGWLS
Absent
Low (1-2)
Medium (3-4)
High (5)
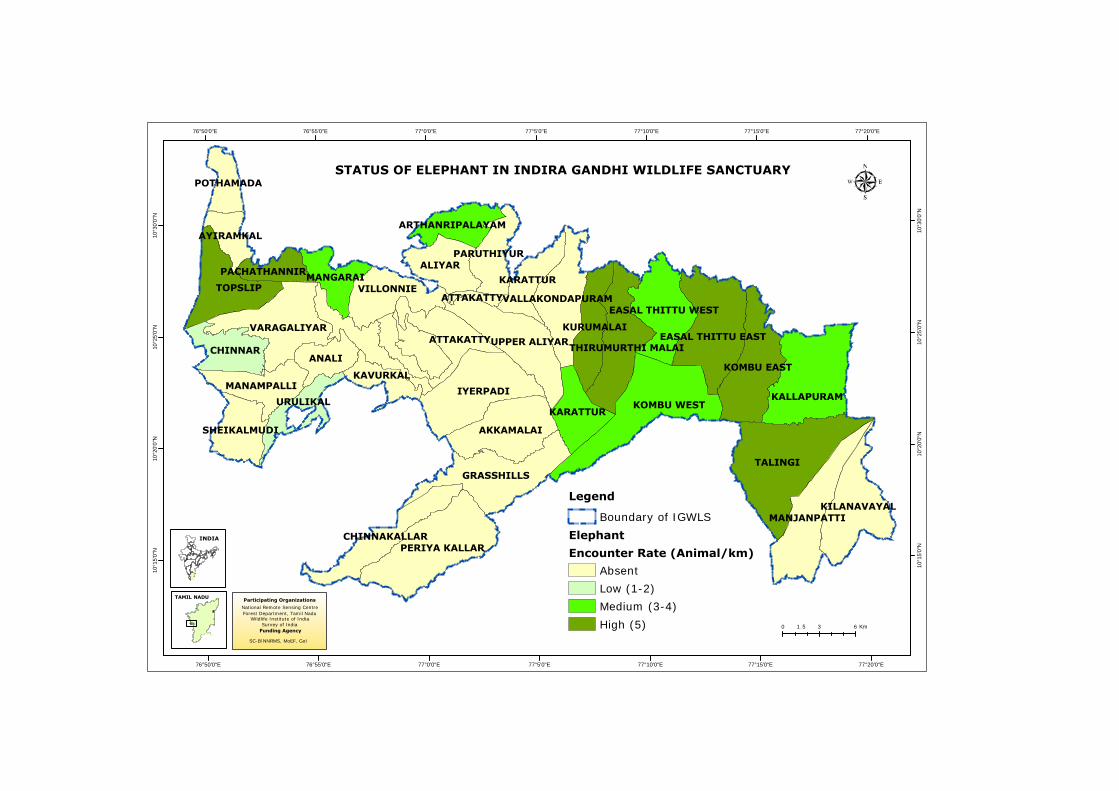
TALINGI
IYERPADIKOMBU WEST
KALLAPURAM
TOPSLIP
PERIYA KALLAR
GRASSHILLS
AKKAMALAI
ALIYAR
VARAGALIYAR
ANALI
VILLONNIE
CHINNAR
MANAMPALLI
KOMBU EAST
MANJANPATTI
ATTAKATTY
KILANAVAYAL
UPPER ALIYAR EASAL THITTU EAST
KARATTUR
KURUMALAI
CHINNAKALLAR
KARATTUR
THIRUMURTHI MALAI
EASAL THITTU WESTVALLAKONDAPURAM
MANGARAI
URULIKAL
SHEIKALMUDI
PARUTHIYUR
KAVURKAL
POTHAMADA
AYIRAMKALARTHANRIPALAYAM
PACHATHANNIR
ATTAKATTY
77°20'0"E
77°20'0"E
77°15'0"E
77°15'0"E
77°10'0"E
77°10'0"E
77°5'0"E
77°5'0"E
77°0'0"E
77°0'0"E
76°55'0"E
76°55'0"E
76°50'0"E
76°50'0"E
10°3
0'0"
N
10°3
0'0"
N
10°2
5'0"
N
10°2
5'0"
N
10°2
0'0"
N
10°2
0'0"
N
10°1
5'0"
N
10°1
5'0"
N
STATUS OF ELEPHANT IN INDIRA GANDHI WILDLIFE SANCTUARY
0 3 61.5 Km
INDIA
Participating Organizations
National Remote Sensing CentreForest Department, Tamil Nadu
Wildlife Institute of IndiaSurvey of India
Funding Agency
SC-B\NNRMS, MoEF, GoI
TAMIL NADU
Legend
Elephant
Encounter Rate (Animal/km)
Boundary of IGWLS
Absent
Low (1-2)
Medium (3-4)
High (5)

TALINGI
IYERPADIKOMBU WEST
KALLAPURAM
TOPSLIP
PERIYA KALLAR
GRASSHILLS
AKKAMALAI
ALIYAR
VARAGALIYAR
ANALI
VILLONNIE
CHINNAR
MANAMPALLI
KOMBU EAST
MANJANPATTI
ATTAKATTY
KILANAVAYAL
UPPER ALIYAR EASAL THITTU EAST
KARATTUR
KURUMALAI
CHINNAKALLAR
KARATTUR
THIRUMURTHI MALAI
EASAL THITTU WESTVALLAKONDAPURAM
MANGARAI
URULIKAL
SHEIKALMUDI
PARUTHIYUR
KAVURKAL
POTHAMADA
AYIRAMKALARTHANRIPALAYAM
PACHATHANNIR
ATTAKATTY
77°20'0"E
77°20'0"E
77°15'0"E
77°15'0"E
77°10'0"E
77°10'0"E
77°5'0"E
77°5'0"E
77°0'0"E
77°0'0"E
76°55'0"E
76°55'0"E
76°50'0"E
76°50'0"E
10°3
0'0"
N
10°3
0'0"
N
10°2
5'0"
N
10°2
5'0"
N
10°2
0'0"
N
10°2
0'0"
N
10°1
5'0"
N
10°1
5'0"
N
STATUS OF GAUR IN INDIRA GANDHI WILDLIFE SANCTUARY
0 3 61.5 Km
INDIA
Participating Organizations
National Remote Sensing CentreForest Department, Tamil Nadu
Wildlife Institute of IndiaSurvey of India
Funding Agency
SC-B\NNRMS, MoEF, GoI
TAMIL NADU
Legend
Boundary of IGWLS
Gaur
Encounter Rate (Animal/km)
Absent
Low (1-2)
Medium (3-4)

TALINGI
IYERPADIKOMBU WEST
KALLAPURAM
TOPSLIP
PERIYA KALLAR
GRASSHILLS
AKKAMALAI
ALIYAR
VARAGALIYAR
ANALI
VILLONNIE
CHINNAR
MANAMPALLI
KOMBU EAST
MANJANPATTI
ATTAKATTY
KILANAVAYAL
UPPER ALIYAR EASAL THITTU EAST
KARATTUR
KURUMALAI
CHINNAKALLAR
KARATTUR
THIRUMURTHI MALAI
EASAL THITTU WESTVALLAKONDAPURAM
MANGARAI
URULIKAL
SHEIKALMUDI
PARUTHIYUR
KAVURKAL
POTHAMADA
AYIRAMKALARTHANRIPALAYAM
PACHATHANNIR
ATTAKATTY
77°20'0"E
77°20'0"E
77°15'0"E
77°15'0"E
77°10'0"E
77°10'0"E
77°5'0"E
77°5'0"E
77°0'0"E
77°0'0"E
76°55'0"E
76°55'0"E
76°50'0"E
76°50'0"E
10°3
0'0"
N
10°3
0'0"
N
10°2
5'0"
N
10°2
5'0"
N
10°2
0'0"
N
10°2
0'0"
N
10°1
5'0"
N
10°1
5'0"
N
STATUS OF HARE IN INDIRA GANDHI WILDLIFE SANCTUARY
0 3 61.5 Km
INDIA
Participating Organizations
National Remote Sensing CentreForest Department, Tamil Nadu
Wildlife Institute of IndiaSurvey of India
Funding Agency
SC-B\NNRMS, MoEF, GoI
TAMIL NADU
Legend
Hare
Encounter Rate (Animal/km)
Boundary of IGWLS
Absent
Low (1-2)
Medium (3-4)

TALINGI
IYERPADIKOMBU WEST
KALLAPURAM
TOPSLIP
PERIYA KALLAR
GRASSHILLS
AKKAMALAI
ALIYAR
VARAGALIYAR
ANALI
VILLONNIE
CHINNAR
MANAMPALLI
KOMBU EAST
MANJANPATTI
ATTAKATTY
KILANAVAYAL
UPPER ALIYAR EASAL THITTU EAST
KARATTUR
KURUMALAI
CHINNAKALLAR
KARATTUR
THIRUMURTHI MALAI
EASAL THITTU WESTVALLAKONDAPURAM
MANGARAI
URULIKAL
SHEIKALMUDI
PARUTHIYUR
KAVURKAL
POTHAMADA
AYIRAMKALARTHANRIPALAYAM
PACHATHANNIR
ATTAKATTY
77°20'0"E
77°20'0"E
77°15'0"E
77°15'0"E
77°10'0"E
77°10'0"E
77°5'0"E
77°5'0"E
77°0'0"E
77°0'0"E
76°55'0"E
76°55'0"E
76°50'0"E
76°50'0"E
10°3
0'0"
N
10°3
0'0"
N
10°2
5'0"
N
10°2
5'0"
N
10°2
0'0"
N
10°2
0'0"
N
10°1
5'0"
N
10°1
5'0"
N
STATUS OF LEOPARD IN INDIRA GANDHI WILDLIFE SANCTUARY
0 3 61.5 Km
INDIA
Participating Organizations
National Remote Sensing CentreForest Department, Tamil Nadu
Wildlife Institute of IndiaSurvey of India
Funding Agency
SC-B\NNRMS, MoEF, GoI
TAMIL NADU
Legend
Leopard
Encounter Rate (Animal/km)
Boundary of IGWLS
Absent
Low (1-2)
Medium (3-4)
High (5)

TALINGI
IYERPADIKOMBU WEST
KALLAPURAM
TOPSLIP
PERIYA KALLAR
GRASSHILLS
AKKAMALAI
ALIYAR
VARAGALIYAR
ANALI
VILLONNIE
CHINNAR
MANAMPALLI
KOMBU EAST
MANJANPATTI
ATTAKATTY
KILANAVAYAL
UPPER ALIYAR EASAL THITTU EAST
KARATTUR
KURUMALAI
CHINNAKALLAR
KARATTUR
THIRUMURTHI MALAI
EASAL THITTU WESTVALLAKONDAPURAM
MANGARAI
URULIKAL
SHEIKALMUDI
PARUTHIYUR
KAVURKAL
POTHAMADA
AYIRAMKALARTHANRIPALAYAM
PACHATHANNIR
ATTAKATTY
77°20'0"E
77°20'0"E
77°15'0"E
77°15'0"E
77°10'0"E
77°10'0"E
77°5'0"E
77°5'0"E
77°0'0"E
77°0'0"E
76°55'0"E
76°55'0"E
76°50'0"E
76°50'0"E
10°3
0'0"
N
10°3
0'0"
N
10°2
5'0"
N
10°2
5'0"
N
10°2
0'0"
N
10°2
0'0"
N
10°1
5'0"
N
10°1
5'0"
N
STATUS OF SAMBAR IN INDIRA GANDHI WILDLIFE SANCTUARY
0 3 61.5 Km
INDIA
Participating Organizations
National Remote Sensing CentreForest Department, Tamil Nadu
Wildlife Institute of IndiaSurvey of India
Funding Agency
SC-B\NNRMS, MoEF, GoI
TAMIL NADU
Legend
Boundary of IGWLS
Sambar
Encounter Rate (Animal/km)
Absent
Low (1-2)
Medium (3-4)
High (5)

TALINGI
IYERPADIKOMBU WEST
KALLAPURAM
TOPSLIP
PERIYA KALLAR
GRASSHILLS
AKKAMALAI
ALIYAR
VARAGALIYAR
ANALI
VILLONNIE
CHINNAR
MANAMPALLI
KOMBU EAST
MANJANPATTI
ATTAKATTY
KILANAVAYAL
UPPER ALIYAR EASAL THITTU EAST
KARATTUR
KURUMALAI
CHINNAKALLAR
KARATTUR
THIRUMURTHI MALAI
EASAL THITTU WESTVALLAKONDAPURAM
MANGARAI
URULIKAL
SHEIKALMUDI
PARUTHIYUR
KAVURKAL
POTHAMADA
AYIRAMKALARTHANRIPALAYAM
PACHATHANNIR
ATTAKATTY
77°20'0"E
77°20'0"E
77°15'0"E
77°15'0"E
77°10'0"E
77°10'0"E
77°5'0"E
77°5'0"E
77°0'0"E
77°0'0"E
76°55'0"E
76°55'0"E
76°50'0"E
76°50'0"E
10°3
0'0"
N
10°3
0'0"
N
10°2
5'0"
N
10°2
5'0"
N
10°2
0'0"
N
10°2
0'0"
N
10°1
5'0"
N
10°1
5'0"
N
STATUS OF SLOTH BEAR IN INDIRA GANDHI WILDLIFE SANCTUARY
0 3 61.5 Km
INDIA
Participating Organizations
National Remote Sensing CentreForest Department, Tamil Nadu
Wildlife Institute of IndiaSurvey of India
Funding Agency
SC-B\NNRMS, MoEF, GoI
TAMIL NADU
Legend
Sloth Bear
Encounter Rate (Animal/km)
Boundary of IGWLS
Absent
Low (1-2)
Medium (3-4)
High (5)
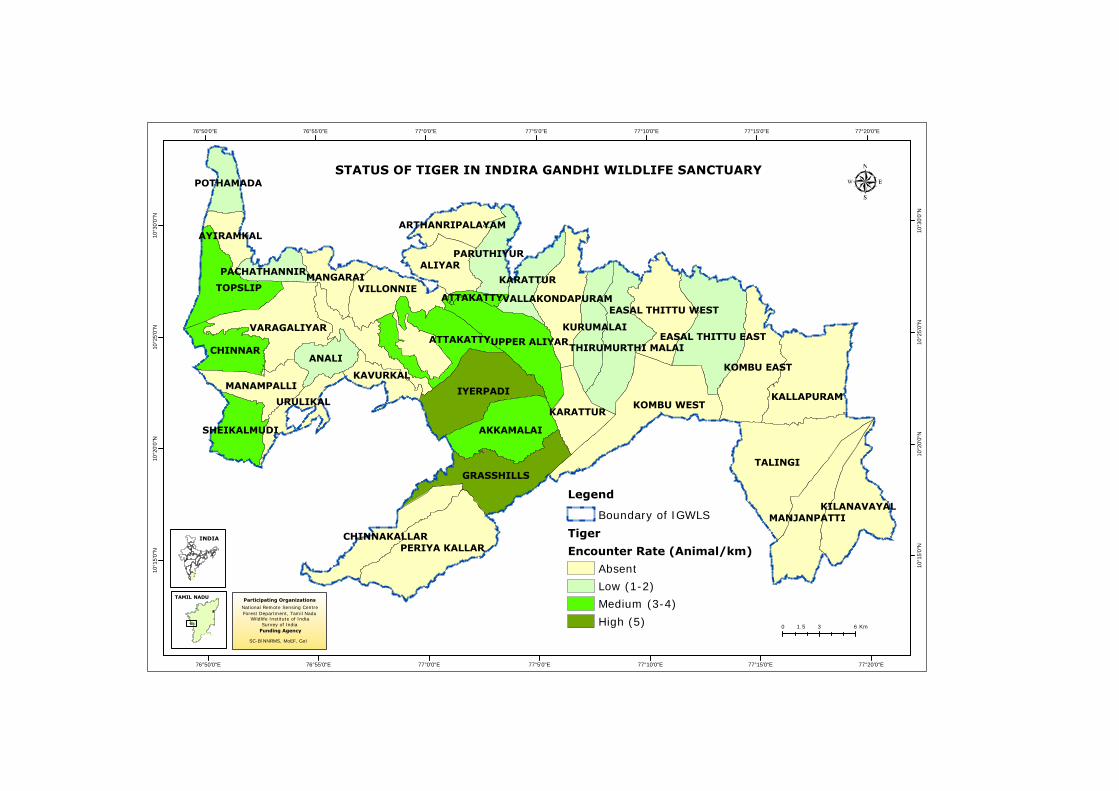
TALINGI
IYERPADIKOMBU WEST
KALLAPURAM
TOPSLIP
PERIYA KALLAR
GRASSHILLS
AKKAMALAI
ALIYAR
VARAGALIYAR
ANALI
VILLONNIE
CHINNAR
MANAMPALLI
KOMBU EAST
MANJANPATTI
ATTAKATTY
KILANAVAYAL
UPPER ALIYAR EASAL THITTU EAST
KARATTUR
KURUMALAI
CHINNAKALLAR
KARATTUR
THIRUMURTHI MALAI
EASAL THITTU WESTVALLAKONDAPURAM
MANGARAI
URULIKAL
SHEIKALMUDI
PARUTHIYUR
KAVURKAL
POTHAMADA
AYIRAMKALARTHANRIPALAYAM
PACHATHANNIR
ATTAKATTY
77°20'0"E
77°20'0"E
77°15'0"E
77°15'0"E
77°10'0"E
77°10'0"E
77°5'0"E
77°5'0"E
77°0'0"E
77°0'0"E
76°55'0"E
76°55'0"E
76°50'0"E
76°50'0"E
10°3
0'0"
N
10°3
0'0"
N
10°2
5'0"
N
10°2
5'0"
N
10°2
0'0"
N
10°2
0'0"
N
10°1
5'0"
N
10°1
5'0"
N
STATUS OF TIGER IN INDIRA GANDHI WILDLIFE SANCTUARY
0 3 61.5 Km
INDIA
Participating Organizations
National Remote Sensing CentreForest Department, Tamil Nadu
Wildlife Institute of IndiaSurvey of India
Funding Agency
SC-B\NNRMS, MoEF, GoI
TAMIL NADU
Legend
Tiger
Encounter Rate (Animal/km)
Boundary of IGWLS
Absent
Low (1-2)
Medium (3-4)
High (5)
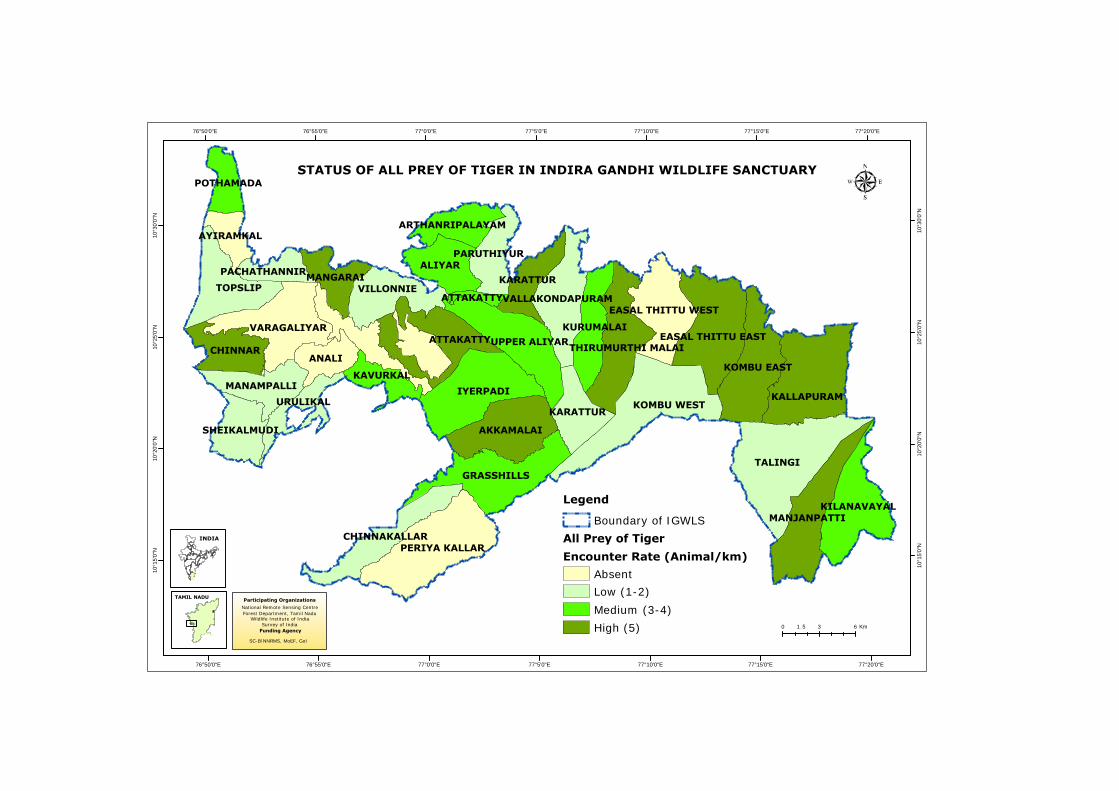
TALINGI
IYERPADIKOMBU WEST
KALLAPURAM
TOPSLIP
PERIYA KALLAR
GRASSHILLS
AKKAMALAI
ALIYAR
VARAGALIYAR
ANALI
VILLONNIE
CHINNAR
MANAMPALLI
KOMBU EAST
MANJANPATTI
ATTAKATTY
KILANAVAYAL
UPPER ALIYAR EASAL THITTU EAST
KARATTUR
KURUMALAI
CHINNAKALLAR
KARATTUR
THIRUMURTHI MALAI
EASAL THITTU WESTVALLAKONDAPURAM
MANGARAI
URULIKAL
SHEIKALMUDI
PARUTHIYUR
KAVURKAL
POTHAMADA
AYIRAMKALARTHANRIPALAYAM
PACHATHANNIR
ATTAKATTY
77°20'0"E
77°20'0"E
77°15'0"E
77°15'0"E
77°10'0"E
77°10'0"E
77°5'0"E
77°5'0"E
77°0'0"E
77°0'0"E
76°55'0"E
76°55'0"E
76°50'0"E
76°50'0"E
10°3
0'0"
N
10°3
0'0"
N
10°2
5'0"
N
10°2
5'0"
N
10°2
0'0"
N
10°2
0'0"
N
10°1
5'0"
N
10°1
5'0"
N
STATUS OF ALL PREY OF TIGER IN INDIRA GANDHI WILDLIFE SANCTUARY
0 3 61.5 Km
INDIA
Participating Organizations
National Remote Sensing CentreForest Department, Tamil Nadu
Wildlife Institute of IndiaSurvey of India
Funding Agency
SC-B\NNRMS, MoEF, GoI
TAMIL NADU
Legend
All Prey of Tiger
Encounter Rate (Animal/km)
Boundary of IGWLS
Absent
Low (1-2)
Medium (3-4)
High (5)
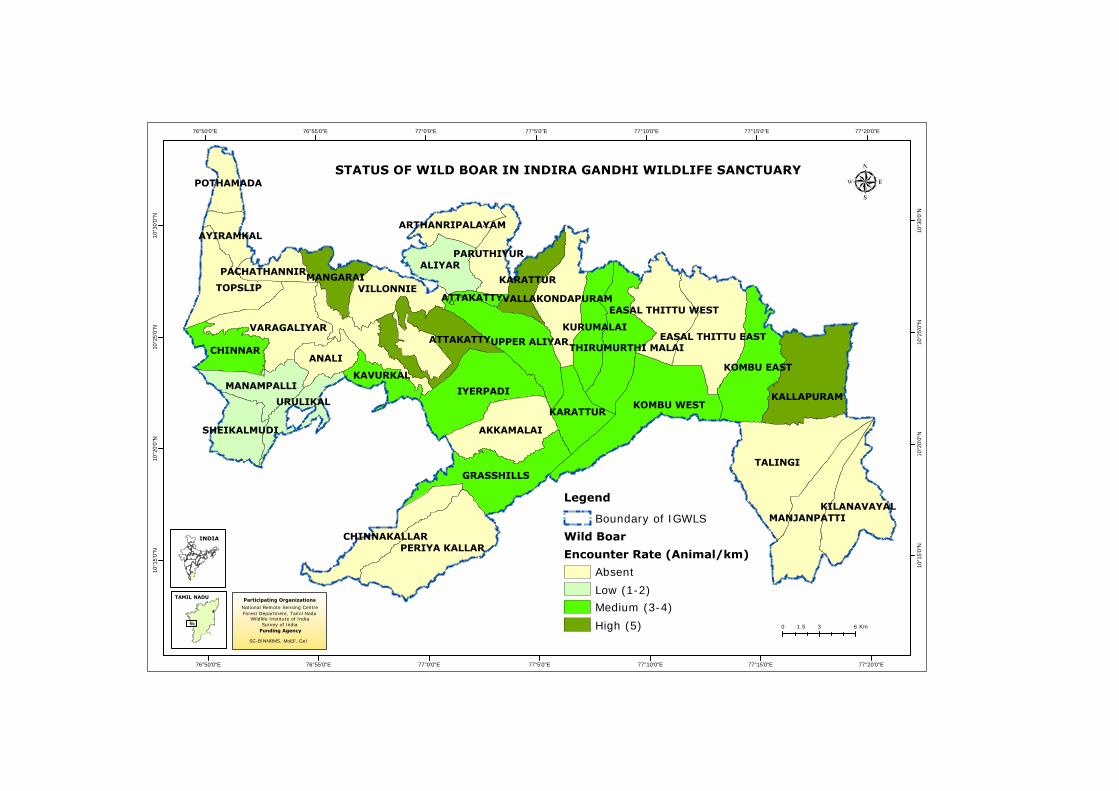
TALINGI
IYERPADIKOMBU WEST
KALLAPURAM
TOPSLIP
PERIYA KALLAR
GRASSHILLS
AKKAMALAI
ALIYAR
VARAGALIYAR
ANALI
VILLONNIE
CHINNAR
MANAMPALLI
KOMBU EAST
MANJANPATTI
ATTAKATTY
KILANAVAYAL
UPPER ALIYAR EASAL THITTU EAST
KARATTUR
KURUMALAI
CHINNAKALLAR
KARATTUR
THIRUMURTHI MALAI
EASAL THITTU WESTVALLAKONDAPURAM
MANGARAI
URULIKAL
SHEIKALMUDI
PARUTHIYUR
KAVURKAL
POTHAMADA
AYIRAMKALARTHANRIPALAYAM
PACHATHANNIR
ATTAKATTY
77°20'0"E
77°20'0"E
77°15'0"E
77°15'0"E
77°10'0"E
77°10'0"E
77°5'0"E
77°5'0"E
77°0'0"E
77°0'0"E
76°55'0"E
76°55'0"E
76°50'0"E
76°50'0"E
10°3
0'0"
N
10°3
0'0"
N
10°2
5'0"
N
10°2
5'0"
N
10°2
0'0"
N
10°2
0'0"
N
10°1
5'0"
N
10°1
5'0"
N
STATUS OF WILD BOAR IN INDIRA GANDHI WILDLIFE SANCTUARY
0 3 61.5 Km
INDIA
Participating Organizations
National Remote Sensing CentreForest Department, Tamil Nadu
Wildlife Institute of IndiaSurvey of India
Funding Agency
SC-B\NNRMS, MoEF, GoI
TAMIL NADU
Legend
Wild Boar
Encounter Rate (Animal/km)
Boundary of IGWLS
Absent
Low (1-2)
Medium (3-4)
High (5)

TALINGI
IYERPADIKOMBU WEST
KALLAPURAM
TOPSLIP
PERIYA KALLAR
GRASSHILLS
AKKAMALAI
ALIYAR
VARAGALIYAR
ANALI
VILLONNIE
CHINNAR
MANAMPALLI
KOMBU EAST
MANJANPATTI
ATTAKATTY
KILANAVAYAL
UPPER ALIYAR EASAL THITTU EAST
KARATTUR
KURUMALAI
CHINNAKALLAR
KARATTUR
THIRUMURTHI MALAI
EASAL THITTU WESTVALLAKONDAPURAM
MANGARAI
URULIKAL
SHEIKALMUDI
PARUTHIYUR
KAVURKAL
POTHAMADA
AYIRAMKALARTHANRIPALAYAM
PACHATHANNIR
ATTAKATTY
77°20'0"E
77°20'0"E
77°15'0"E
77°15'0"E
77°10'0"E
77°10'0"E
77°5'0"E
77°5'0"E
77°0'0"E
77°0'0"E
76°55'0"E
76°55'0"E
76°50'0"E
76°50'0"E
10°3
0'0"
N
10°3
0'0"
N
10°2
5'0"
N
10°2
5'0"
N
10°2
0'0"
N
10°2
0'0"
N
10°1
5'0"
N
10°1
5'0"
N
STATUS OF WILD DOG IN INDIRA GANDHI WILDLIFE SANCTUARY
0 3 61.5 Km
INDIA
Participating Organizations
National Remote Sensing CentreForest Department, Tamil Nadu
Wildlife Institute of IndiaSurvey of India
Funding Agency
SC-B\NNRMS, MoEF, GoI
TAMIL NADU
Legend
Wild Dog
Encounter Rate (Animal/km)
Boundary of IGWLS
Absent
Low (1-2)
Medium (3-4)
High (5)

Annuxre9 Phytosociological Sample Point Location in Indira Gandhi Wildlife Sanctuary
Sl. No. Uniq_no. Vegetation type Longitude Latitude Elevation (m)
1 1 Moist Deciduous 76.8521 10.4441 693 2 2 Semievergreen 76.8876 10.3569 798 3 3 Evergreen 76.8883 10.3570 828 4 4 Evergreen 76.8876 10.3531 879 5 7 Semievergreen 76.8951 10.3576 804 6 8 Semievergreen 76.8346 10.4766 792 7 9 Semievergreen 76.8365 10.4733 780 8 10 Semievergreen 76.8317 10.4753 780 9 11 Semievergreen 76.8299 10.4794 810
10 12 Semievergreen 76.8302 10.4838 837 11 13 Semievergreen 76.8479 10.4900 486 12 14 Shola 76.8351 10.5024 1205 13 15 Shola 76.8340 10.5016 1237 14 16 Shola 76.8363 10.5011 1187 15 17 Moist Deciduous 76.8462 10.4849 635 16 18 Moist Deciduous 76.8431 10.4809 709 17 19 Semievergreen 76.8355 10.4615 699 18 20 Evergreen 76.8324 10.4267 799 19 21 Evergreen 76.8355 10.4268 786 20 22 Semievergreen 76.8371 10.4258 786 21 23 Moist Deciduous 76.8391 10.4271 774 22 24 Evergreen 76.8313 10.4214 735 23 25 Semievergreen 76.8311 10.4219 753 24 26 Evergreen 76.8276 10.4205 744 25 27 Evergreen 76.8277 10.4210 723 26 28 Moist Deciduous 76.8777 10.3570 605 27 29 Evergreen 76.8751 10.3605 609 28 30 Semievergreen 76.8761 10.3634 590 29 31 Semievergreen 76.8781 10.3662 613 30 32 Semievergreen 76.8711 10.3636 622 31 33 Evergreen 76.8794 10.3665 627 32 34 Evergreen 76.8769 10.3657 603 33 35 Semievergreen 76.8766 10.3721 590 34 36 Semievergreen 76.8764 10.3568 604 35 37 Semievergreen 76.8778 10.3569 600 36 38 Semievergreen 76.8794 10.3565 611 37 39 Moist Deciduous 76.8792 10.3556 631

Sl. No. Uniq_no. Vegetation type Longitude Latitude Elevation (m)
38 40 Semievergreen 76.8751 10.3571 600 39 41 Evergreen 76.8742 10.3578 623 40 42 Semievergreen 76.8741 10.3593 627 41 43 Evergreen 77.0241 10.3299 1668 42 44 Evergreen 77.0249 10.3286 1660 43 45 Evergreen 77.0270 10.3286 1668 44 46 Evergreen 77.0298 10.3296 1725 45 47 Evergreen 77.0323 10.3297 1783 46 48 Semievergreen 77.0431 10.3330 1857 47 49 Semievergreen 77.0469 10.3321 1916 48 50 Semievergreen 77.0405 10.3314 1820 49 51 Semievergreen 77.0405 10.3313 1766 50 52 Shola 77.0353 10.3296 1690 51 53 Shola 77.0259 10.3278 1643 52 54 Evergreen 76.9822 10.4129 1468 53 55 Moist Deciduous 76.9875 10.4308 1186 54 56 Moist Deciduous 76.9889 10.4318 1073 55 57 Semievergreen 76.9847 10.4391 936 56 58 Moist Deciduous 76.9839 10.4384 972 57 59 Moist Deciduous 76.9835 10.4376 981 58 60 Moist Deciduous 76.9707 10.4549 410 59 61 Dry Deciduous 76.9720 10.4520 468 60 62 Moist Deciduous 76.9698 10.4528 450 61 63 Moist Deciduous 76.9916 10.3749 1306 62 64 Scrub 77.3093 10.4232 355 63 66 Scrub 77.3074 10.4202 360 64 67 Scrub 77.3068 10.4184 362 65 68 Scrub 77.3061 10.4171 366 66 69 Scrub 77.3057 10.4151 382 67 70 Scrub 77.3047 10.4144 380 68 71 Scrub 77.3035 10.4126 399 69 72 Scrub 77.3016 10.4124 397 70 73 Scrub 77.3000 10.4118 430 71 74 Scrub 77.2982 10.4119 433 72 75 Dry Deciduous 77.2731 10.4168 346 73 76 Moist Deciduous 77.2739 10.4152 354 74 77 Scrub 77.2749 10.4135 359 75 78 Scrub 77.2756 10.4120 362 76 79 Scrub 77.2763 10.4105 364 77 80 Scrub 77.2775 10.4087 357 78 81 Scrub 77.2784 10.4074 356 79 82 Scrub 77.2794 10.4061 360 80 84 Scrub 77.2813 10.4030 367

Sl. No. Uniq_no. Vegetation type Longitude Latitude Elevation (m)
81 85 Scrub 77.2825 10.4012 376 82 86 Scrub 77.2215 10.3595 470 83 89 Scrub 77.2261 10.3568 457 84 91 Dry Deciduous 77.2295 10.3553 451 85 92 Scrub 77.2310 10.3544 447 86 93 Scrub 77.2326 10.3535 443 87 94 Dry Deciduous 77.2344 10.3528 436 88 96 Semievergreen 77.2379 10.3529 431 89 97 Scrub 77.2541 10.3028 561 90 98 Dry Deciduous 77.2551 10.3016 566 91 100 Scrub 77.2567 10.2985 606 92 101 Dry Deciduous 77.2570 20.2975 659 93 102 Dry Deciduous 77.2582 10.2960 659 94 103 Scrub 77.2596 20.2948 631 95 105 Scrub 77.2606 20.2909 663 96 106 Scrub 77.2613 10.2892 692 97 107 Dry Deciduous 77.2616 10.2874 709 98 109 Scrub 77.2599 10.3062 563 99 110 Scrub 77.2618 10.3072 582
100 111 Scrub 77.2632 10.3079 665 101 112 Scrub 77.2648 10.3096 690 102 113 Scrub 77.2655 10.3108 716 103 114 Dry Deciduous 77.2729 10.2594 745 104 115 Dry Deciduous 77.2748 10.2602 736 105 116 Moist Deciduous 77.2763 10.2608 737 106 117 Semievergreen 77.2781 10.2613 721 107 119 Dry Deciduous 77.2811 10.2630 749 108 120 Dry Deciduous 77.2861 10.2764 661 109 121 Moist Deciduous 77.2880 10.2784 680 110 122 Moist Deciduous 77.2882 10.2786 676 111 123 Dry Deciduous 77.2896 10.2798 678 112 124 Moist Deciduous 77.2899 10.2823 685 113 125 Moist Deciduous 77.2902 10.2832 687 114 126 Dry Deciduous 77.2914 10.2854 721 115 127 Moist Deciduous 77.2923 10.2868 729 116 128 Dry Deciduous 77.2932 10.2883 728 117 129 Dry Deciduous 77.2943 10.2901 746 118 130 Dry Deciduous 77.2945 10.2919 772 119 131 Dry Deciduous 77.1518 10.4651 431 120 132 Scrub 77.1501 10.4649 452 121 133 Scrub 77.1483 10.4648 475 122 134 Scrub 77.1464 10.4645 532 123 135 Scrub 77.1452 10.4640 547

Sl. No. Uniq_no. Vegetation type Longitude Latitude Elevation (m)
124 136 Dry Deciduous 77.1433 10.4636 592 125 137 Semievergreen 77.1526 10.4424 674 126 138 Scrub 77.1515 10.4415 682 127 139 Moist Deciduous 77.1508 10.4392 706 128 140 Moist Deciduous 77.1501 10.4375 733 129 141 Moist Deciduous 77.1492 10.4358 750 130 142 Dry Deciduous 77.1496 10.4344 778 131 143 Moist Deciduous 77.1504 10.4306 832 132 145 Dry Deciduous 77.1498 10.4292 871 133 146 Semievergreen 77.1488 10.4278 946 134 147 Moist Deciduous 77.1488 10.4262 1016 135 148 Semievergreen 77.1303 10.4333 1048 136 149 Dry Deciduous 77.1288 10.4349 1052 137 150 Moist Deciduous 77.1291 10.4368 1065 138 151 Dry Deciduous 77.1269 10.4373 1087 139 152 Dry Deciduous 77.1280 10.4396 1106 140 153 Dry Deciduous 77.1275 10.4413 1116 141 154 Moist Deciduous 77.1278 10.4431 1133 142 155 Moist Deciduous 77.1280 10.4451 1170 143 156 Dry Deciduous 77.1284 10.4466 1183 144 157 Semievergreen 77.1287 10.4484 1168 145 159 Moist Deciduous 77.1237 10.4450 1177 146 160 Semievergreen 77.1235 10.4433 1182 147 161 Dry Deciduous 77.1231 10.4415 1169 148 162 Semievergreen 77.1218 10.4403 1175 149 163 Moist Deciduous 77.1209 10.4389 1176 150 164 Moist Deciduous 77.1193 10.4377 1181 151 165 Semievergreen 77.1176 10.4368 1181 152 167 Moist Deciduous 77.1159 10.4343 1188 153 168 Moist Deciduous 77.1148 10.4326 1216 154 169 Dry Deciduous 77.1146 10.4310 1226 155 170 Moist Deciduous 77.0977 10.4506 1015 156 171 Scrub 77.0975 10.4523 1024 157 172 Scrub 77.0973 10.4540 1020 158 174 Dry Deciduous 77.0958 10.4571 1034 159 175 Scrub 77.0952 10.4586 1028 160 176 Semievergreen 77.0130 10.4435 902 161 178 Moist Deciduous 77.0164 10.4423 893 162 179 Semievergreen 77.0186 10.4420 886 163 180 Moist Deciduous 77.0204 10.4415 902 164 181 Semievergreen 77.0213 10.4415 882 165 182 Semievergreen 77.0236 10.4408 868 166 183 Semievergreen 77.0253 10.4406 875
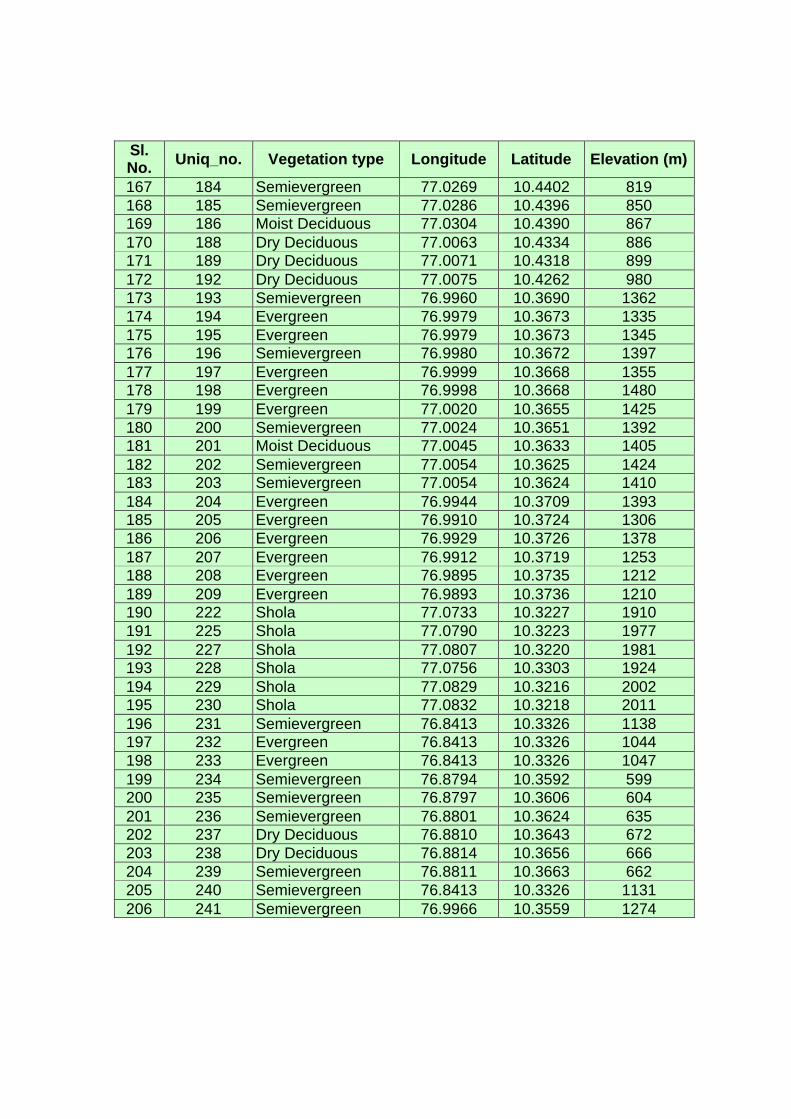
Sl. No. Uniq_no. Vegetation type Longitude Latitude Elevation (m)
167 184 Semievergreen 77.0269 10.4402 819 168 185 Semievergreen 77.0286 10.4396 850 169 186 Moist Deciduous 77.0304 10.4390 867 170 188 Dry Deciduous 77.0063 10.4334 886 171 189 Dry Deciduous 77.0071 10.4318 899 172 192 Dry Deciduous 77.0075 10.4262 980 173 193 Semievergreen 76.9960 10.3690 1362 174 194 Evergreen 76.9979 10.3673 1335 175 195 Evergreen 76.9979 10.3673 1345 176 196 Semievergreen 76.9980 10.3672 1397 177 197 Evergreen 76.9999 10.3668 1355 178 198 Evergreen 76.9998 10.3668 1480 179 199 Evergreen 77.0020 10.3655 1425 180 200 Semievergreen 77.0024 10.3651 1392 181 201 Moist Deciduous 77.0045 10.3633 1405 182 202 Semievergreen 77.0054 10.3625 1424 183 203 Semievergreen 77.0054 10.3624 1410 184 204 Evergreen 76.9944 10.3709 1393 185 205 Evergreen 76.9910 10.3724 1306 186 206 Evergreen 76.9929 10.3726 1378 187 207 Evergreen 76.9912 10.3719 1253 188 208 Evergreen 76.9895 10.3735 1212 189 209 Evergreen 76.9893 10.3736 1210 190 222 Shola 77.0733 10.3227 1910 191 225 Shola 77.0790 10.3223 1977 192 227 Shola 77.0807 10.3220 1981 193 228 Shola 77.0756 10.3303 1924 194 229 Shola 77.0829 10.3216 2002 195 230 Shola 77.0832 10.3218 2011 196 231 Semievergreen 76.8413 10.3326 1138 197 232 Evergreen 76.8413 10.3326 1044 198 233 Evergreen 76.8413 10.3326 1047 199 234 Semievergreen 76.8794 10.3592 599 200 235 Semievergreen 76.8797 10.3606 604 201 236 Semievergreen 76.8801 10.3624 635 202 237 Dry Deciduous 76.8810 10.3643 672 203 238 Dry Deciduous 76.8814 10.3656 666 204 239 Semievergreen 76.8811 10.3663 662 205 240 Semievergreen 76.8413 10.3326 1131 206 241 Semievergreen 76.9966 10.3559 1274


