Mapping Protein-Protein Interactions MEDG 505 (Genome Analysis) 13 January 2005 •Morin: -Overview -IP-MS -Data integration •Student presentations: -Y2H interactions -RNA vs Protein expression analysis •Discussion: -Lessons -Application
Transcript
Mapping Protein-Protein Interactions
MEDG 505 (Genome Analysis)13 January 2005
•Morin: -Overview-IP-MS-Data integration
•Student presentations:-Y2H interactions-RNA vs Protein expression analysis
•Discussion:-Lessons-Application
Central Dogma
DNA RNA Protein Function
Humans:- ~25,000 genes- 25-40% with functional annotations
General Goal: Annotation of proteome -Identify disease related proteins-Identify therapeutic targets
How identify protein functions?
Protein Function
General purpose of proteins is to interaction with other molecules-Enzyme/substrate-Protein/protein
Cellular processes governed by complex networks of interacting proteins-Determination of protein-protein interactions infers functional hypotheses
Protein Annotation
-verifies biological role-translation to humans
problematic-differences in biology cloud
interpretation
-can verify biological role-binary interactions-often protein fragments-high false positives-extensively employed
-comprehensive and HTP-mRNAs infer proteome-identifies expression changes-silent to PTMs-cause and effect difficult to infer -interactions difficult to predict
Large Scale Methods for annotation of protein function:-Genetic
-Mutational analysis in model organisms-Yeast 2-hybrid
-Genomic-mRNA profiling
-Biochemical-MS analysis of purified protein complexes
-identifies interactions directly-yields higher order interactions -identifies PTMs-binding affinity can be employed-technically challengingLesson: All methods need to be employed to fully annotate proteome.
IP-MS
Immunoprecipitation -
Mass Spectrometry
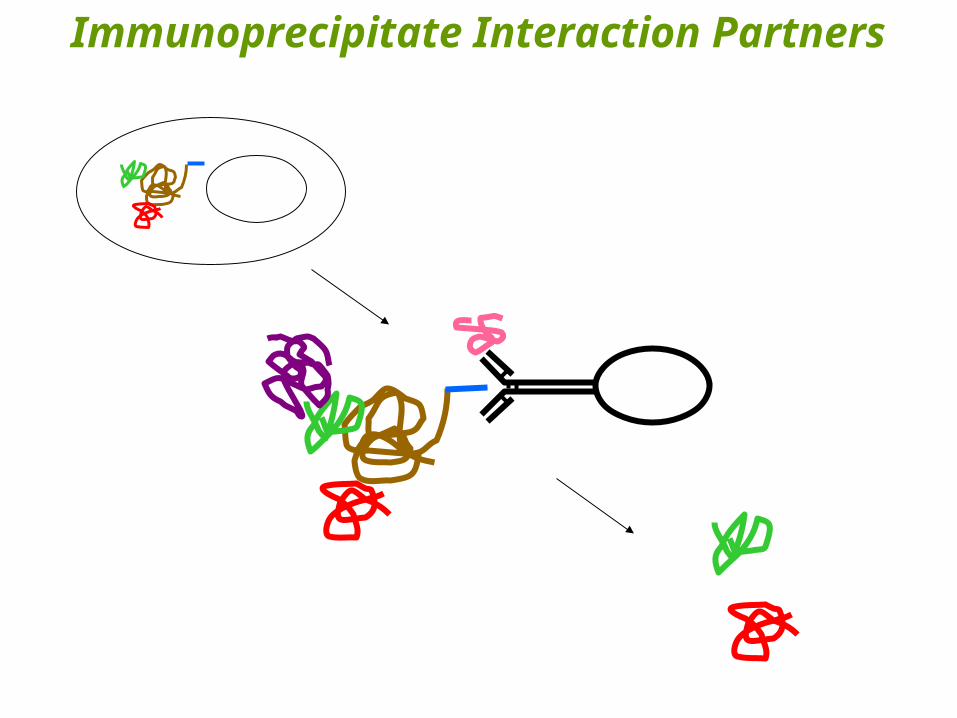
Immunoprecipitate Interaction Partners
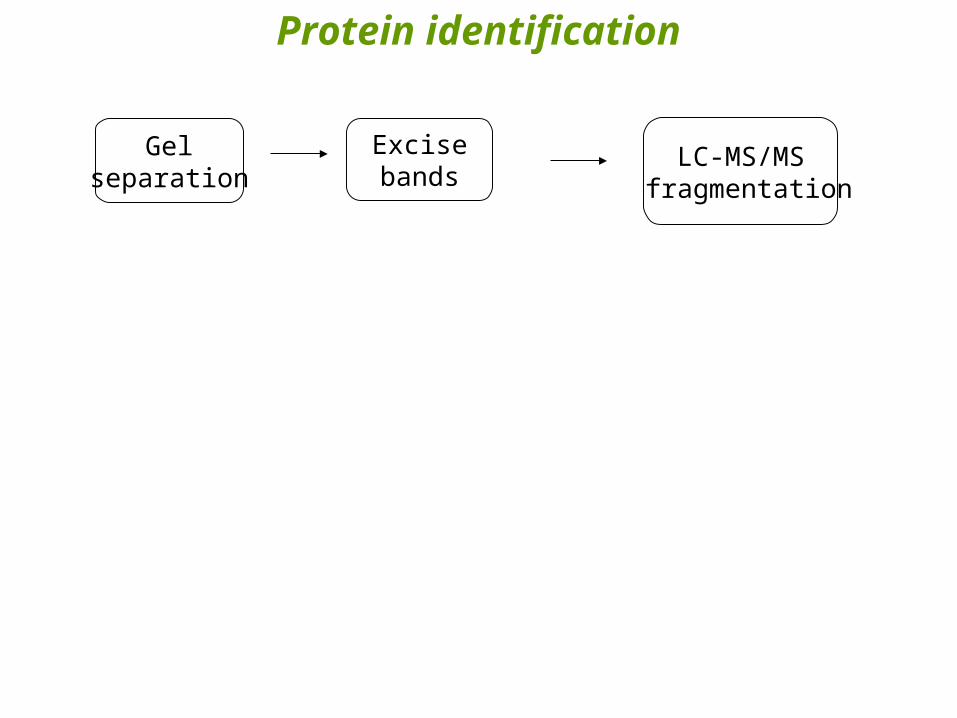
Protein identification
Excisebands
LC-MS/MS fragmentation
Gelseparation
Tagged Protein Structure
ORF FLAGloxlox
C-tagged construct
N-tagged construct FLAG lox ORFlox
CMV
CMV
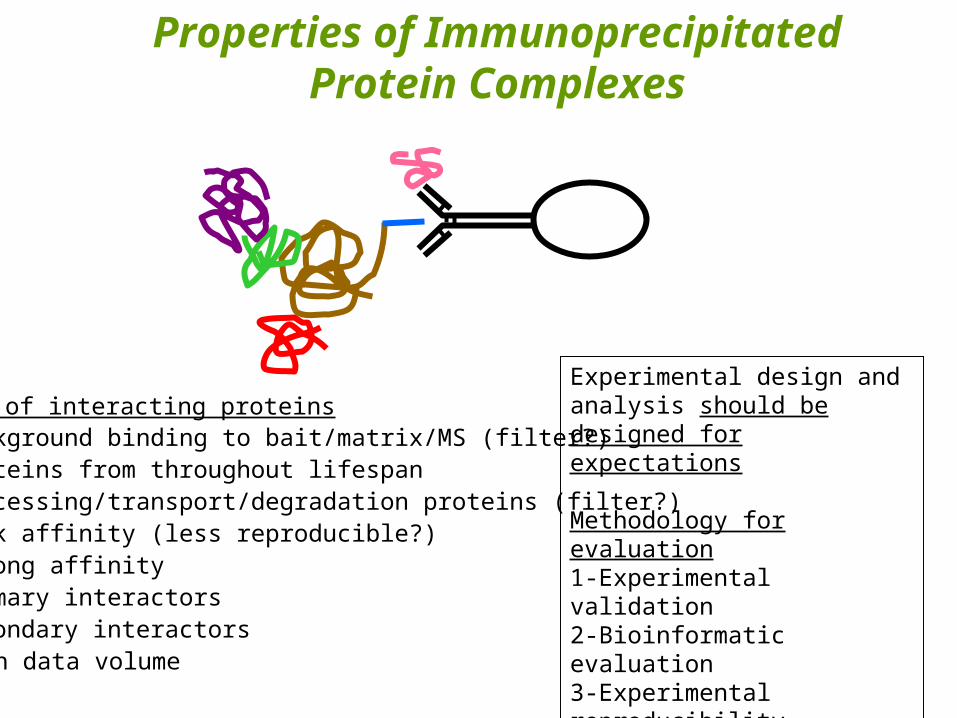
Properties of Immunoprecipitated Protein Complexes
Types of interacting proteins• Background binding to bait/matrix/MS (filter?)• Proteins from throughout lifespan • Processing/transport/degradation proteins (filter?)• Weak affinity (less reproducible?)• Strong affinity• Primary interactors• Secondary interactors• High data volume
Experimental design and analysis should be designed for expectations
Methodology for evaluation1-Experimental validation2-Bioinformatic evaluation3-Experimental reproducibility
-transfection/IP protocols
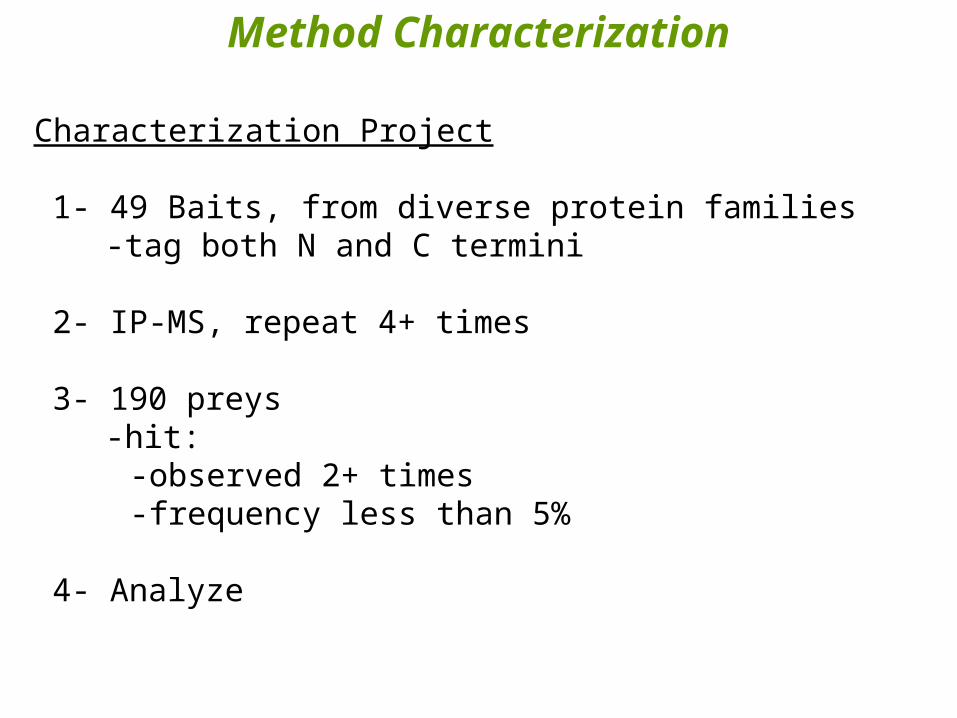
Method Characterization
Characterization Project
1- 49 Baits, from diverse protein families-tag both N and C termini
2- IP-MS, repeat 4+ times
3- 190 preys-hit:
-observed 2+ times-frequency less than 5%
4- Analyze
N- & C-Tag Hit Overlap
# hitsseen with N only 110 0.68seen with C only 29 0.18seen in both N&C 15 0.09seen when N+C are combined 8 0.05total 162
% of total hits
Lessons:1) 5 Hits per Bait.2) N-tags interfere less than C-tags.3) Both tags needed to get good representation.
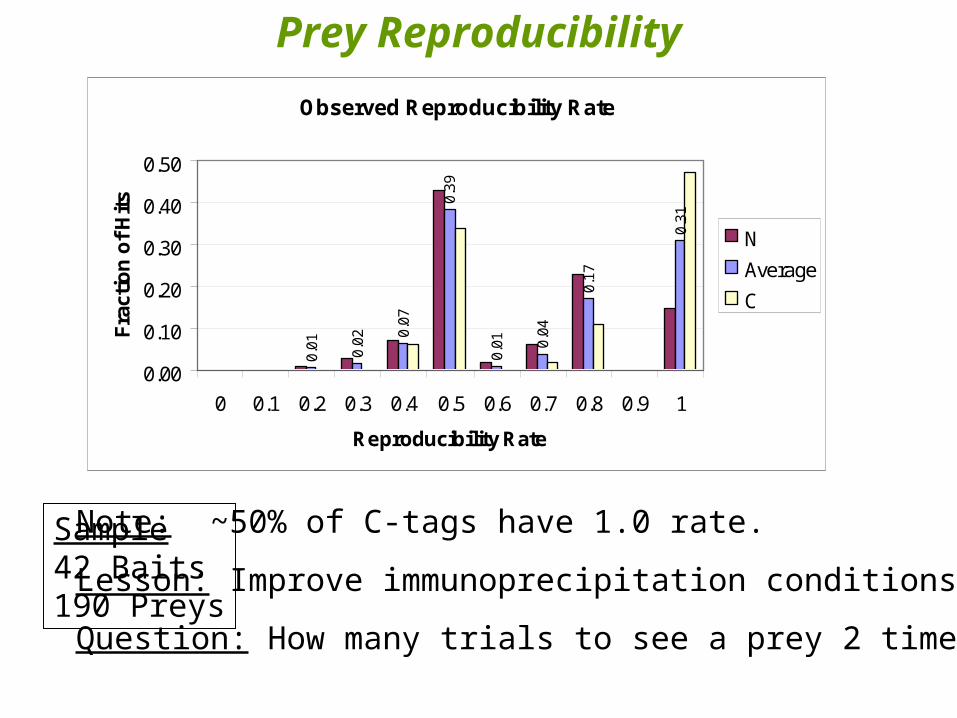
Predicted Fraction of Prey Pool NOT Found in X # of trialsReproducibility
Rate
Lesson:•1 or 2 trials provides highly
incomplete dataset.
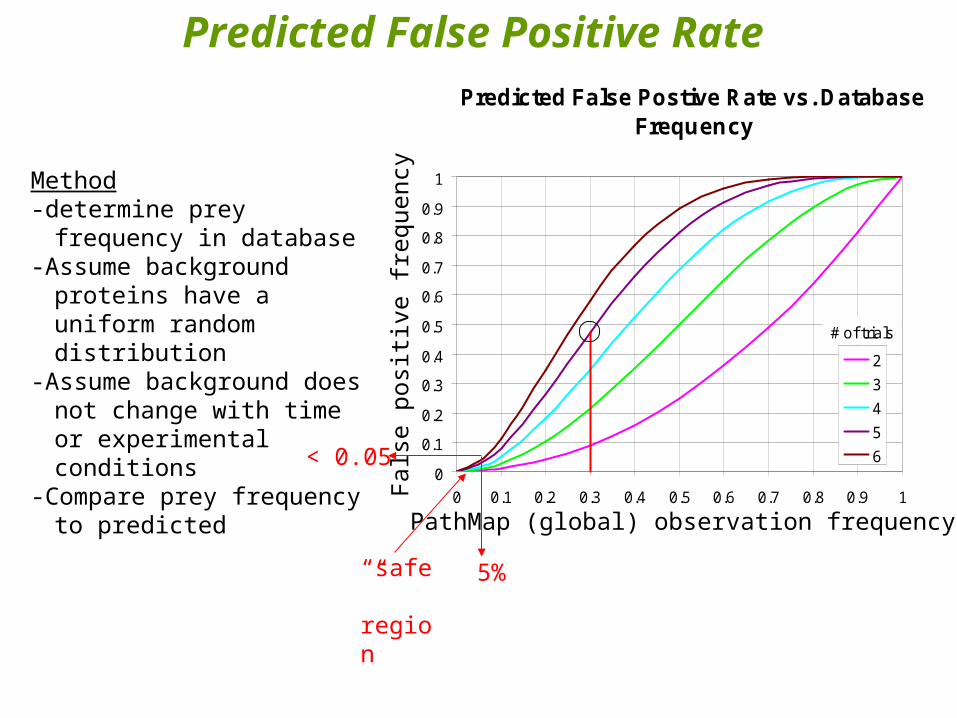
Predicted False Positive Rate Predicted False Postive Rate vs. Database
Frequency
0
0.1
0.2
0.3
0.4
0.5
0.6
0.7
0.8
0.9
1
0 0.1 0.2 0.3 0.4 0.5 0.6 0.7 0.8 0.9 1
2
3
4
5
6
# of trials
PathMap (global) observation frequency
Fals
e po
siti
ve f
requ
ency
Method-determine prey frequency in
database-Assume background proteins have
a uniform random distribution-Assume background does not
change with time or experimental conditions
-Compare prey frequency to predicted observation rate
)()((cutoff)E
))1)((()!(!
!)(
0
ivefalseposit
2
pNumhitsprisk
ppknk
nprisk
cutoffp
p
nm
k
knk
p: prey observation frequency
n: number of trials
k: number of observations required (2)
Efalsepositive: expected number of false positives
cutoff: frequency cutoff
Numhits(p): number of hits at each prey observation frequency
5%
< 0.05
“safe” region
Estimated Experimental False Positive Rate
Random Sampling Method -randomly reassign bait labels for each IP for all 49 baits-repeat -obtain 3, 4, and 5 trial sets, 49 baits each, with preys randomly assigned to a bait
(5% database frequency)-assume random distribution (no relation between baits)
# trials numberpercent (n=190)
Calculated number of false postives
3 1 1% < 14 6 3% < 25 7 4% < 3
Observed reproduced hits (false positives)
Results
-false positive rate 2-3X greater than calculated.-non-uniform distribution
Reasons-not independent experiments
-non-random-baits are related
-cross-contamination-equipment contamination
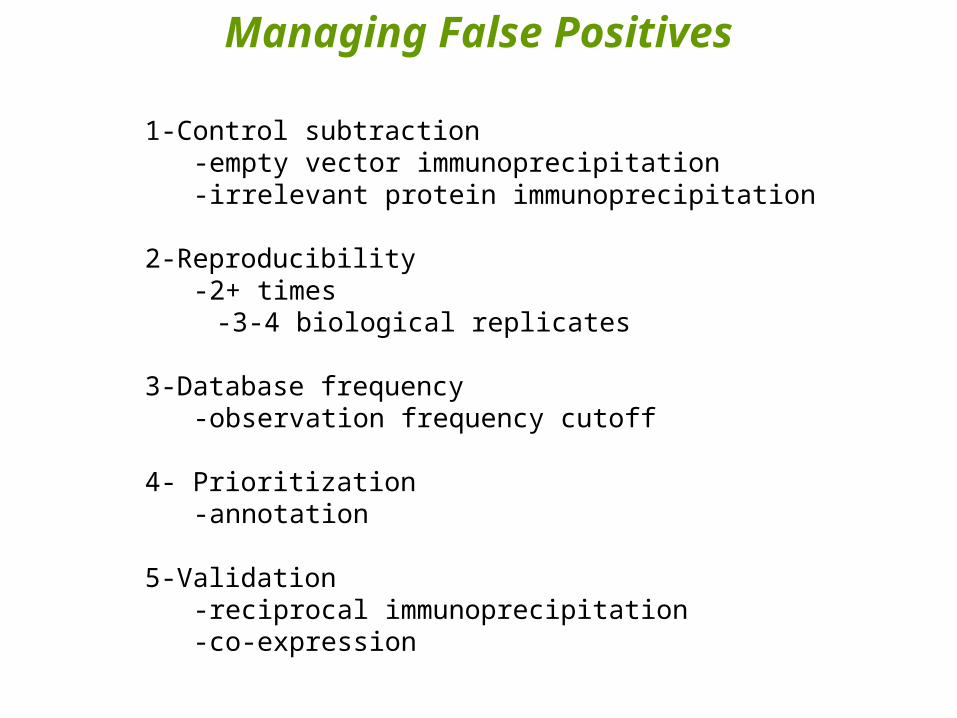
Managing False Positives
1-Control subtraction-empty vector immunoprecipitation-irrelevant protein immunoprecipitation
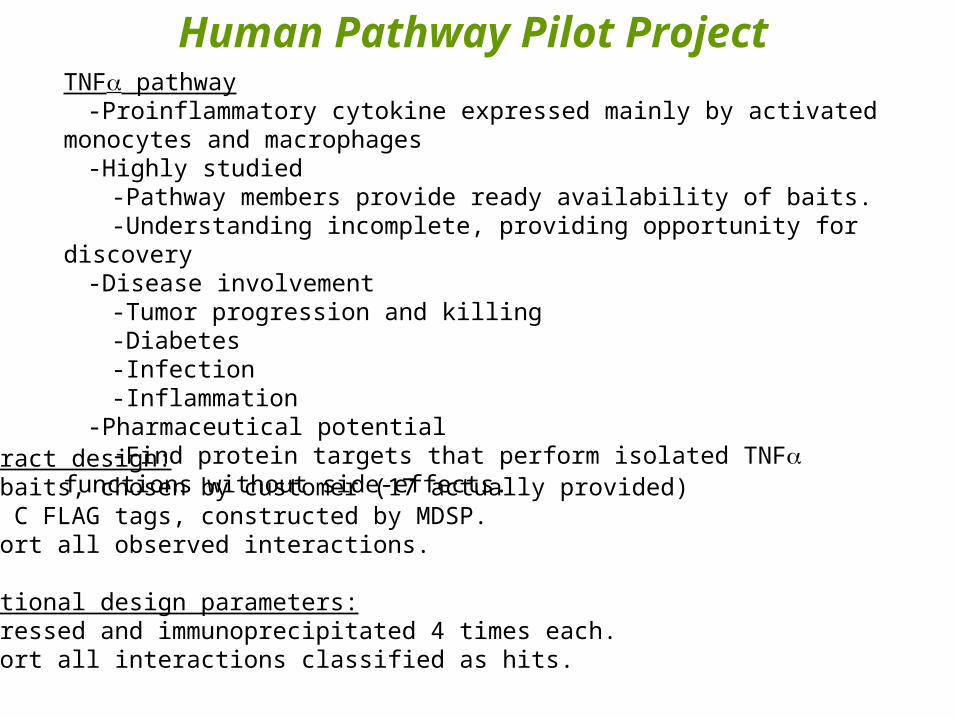
Contract design:-20 baits, chosen by customer (17 actually provided)-N & C FLAG tags, constructed by MDSP.-Report all observed interactions.
Additional design parameters:-Expressed and immunoprecipitated 4 times each.-Report all interactions classified as hits.
TNF pathway-Proinflammatory cytokine expressed mainly by activated monocytes and macrophages-Highly studied
-Pathway members provide ready availability of baits.-Understanding incomplete, providing opportunity for discovery
-Disease involvement-Tumor progression and killing -Diabetes-Infection-Inflammation
-Pharmaceutical potential-Find protein targets that perform isolated TNF functions without side-effects.
Nucleus
NK CellFunction
???
xxx5
Rab5
EndocytosisRegulation
CS1
NaChannels
SGK
kinase
CyclinCell cycleControl
???
Transcription
SGK Gene
IKAP
RIPK2
CLARP
FADD
PPP1R3
CaspasesJak
Stat
IL10RBTGFr
NF-kB
IKK-1
IKB
TRAF6
NIK
TANK
CD40 KIAAxxx
Src
Ptyr PP
Fas
PPP
ENaC
CS1/Jasmine/19A24 Gene
A20
TNFr
Cell Death
IL10RA
xxx4
xxxA1xxxA8
KIAAxxx
PITSLRE(8)
xxxGP
xxxA' xxxBxxxA9
B-xxx1
Protein Sorting / Targetingxxx23, xxx-SR, xxx3, FLJxxx, xxx3, xxx4
DNA repair/Damagexxx14, xxx2
OthersxxxL1, xxxC1, FLJxxx,FLJxxx, xxx1, MGCxxx,
KIAAxxx,FLJxxx, xxxA11
xxxA13
xxx12
xxx1A
FLJxxx
CDC2
Xxxx
XRCC7
xxxL1
xxx7
xxx
xxxB12
xxx
xxxA3 xxx8
xxx1
xxx1D
Gxxx
FLJxxx
xxxA1
KIAAxxx
14-3-3
14-3-3 14-3-3
14-3-3
14-3-3
xxx8
xxx37xxx1-L
xxxCB
xxxF1
xxx15
xxx1
xxx4
TRAF2xxxCATBK1
TRAF3
3-xxxxxx1
xxxxxx1
xxx-99
GYS1
PP1CB
xxx
xxx130xxxL1xxxG4
xxx4
xxx14
xxx11
Transcriptional Regulation
xxx13xxx19
Protein Transport
xxx4, xxxA, xxxE, xxxG1, xxxG2, xxx4
xxxB
Transcription
Transcription
TNFa Bait Protein
Other TNFa Pathway protein
Prey protein
Interactions with Bait protein
Activation
Inhibition
Causal (indirect) interactions
with PreysTNFα Pathway: Inflammation/Cancer
- 17 Baits- Both N & C tags- 4 Immunoprecipitations
TNF Pathway Project Summary
Bait information number commentbaits 17membrane baits 3expressed 14 2 not expected to expressmembrane baits expressed 2baits with interactions 13expressed baits with no TNF context 7
Bait/Prey informationpreys 99known interactions 13new interactions 86baits placed in context 5new bait/prey/bait linkages 4 also observed 1 known linkage
Prey informationenzymes 37
proteins in druggable families 20+protease, GTPase, ATPase, kinase, phosphatase, receptor
proteins with no function 13 6 enzymes, 1 receptorhypothetical proteins 4transmembrane (TM) domain containing proteins 15
7 TM 1 receptor?potential plasma membrane proteins 8 others ER or mitochondrial
Potential antibody targets
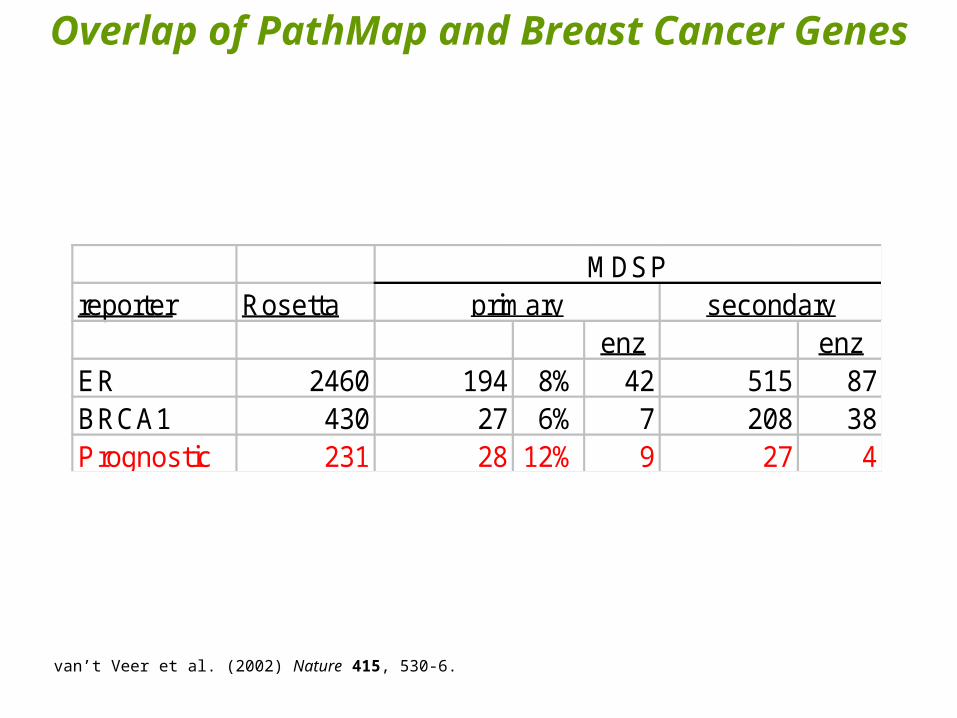
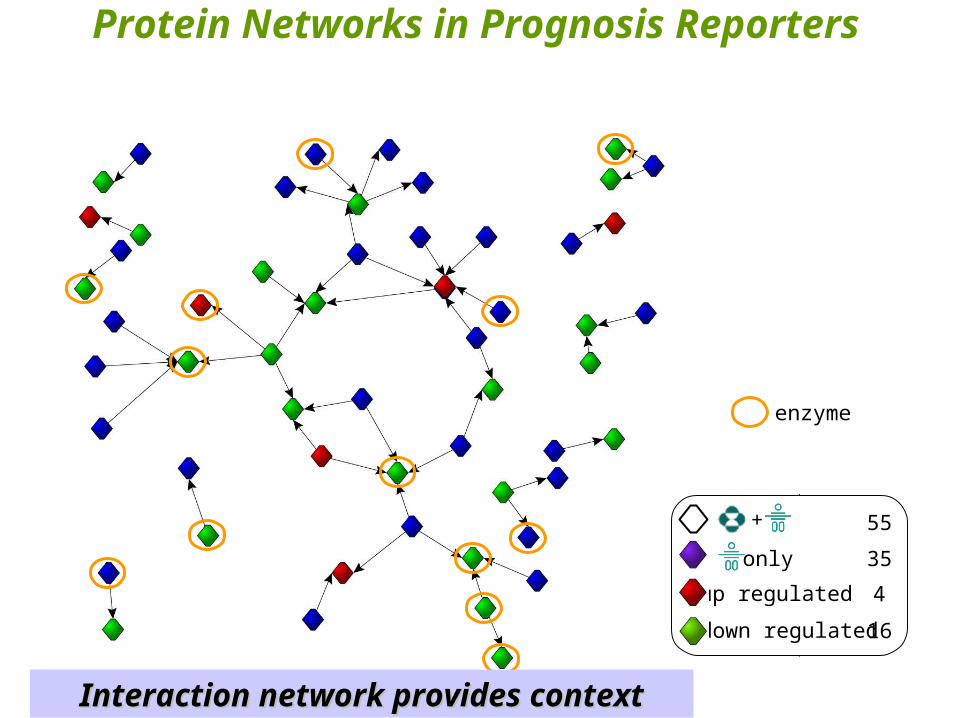
Integrating Proteomic and Genomic Information
Genes Regulating Cell Growth and Division
Systematic identification of pathways that couple cell growth and division in yeast
Science 297: 395-400, 2002.
Paul Jorgensen Joy L. Nishikawa
Bobby-Joe BreitkreutzMike Tyers
Program in Molecular Biology and CancerSamuel Lunenfeld Research Institute
Mount Sinai HospitalToronto, Ontario, Canada
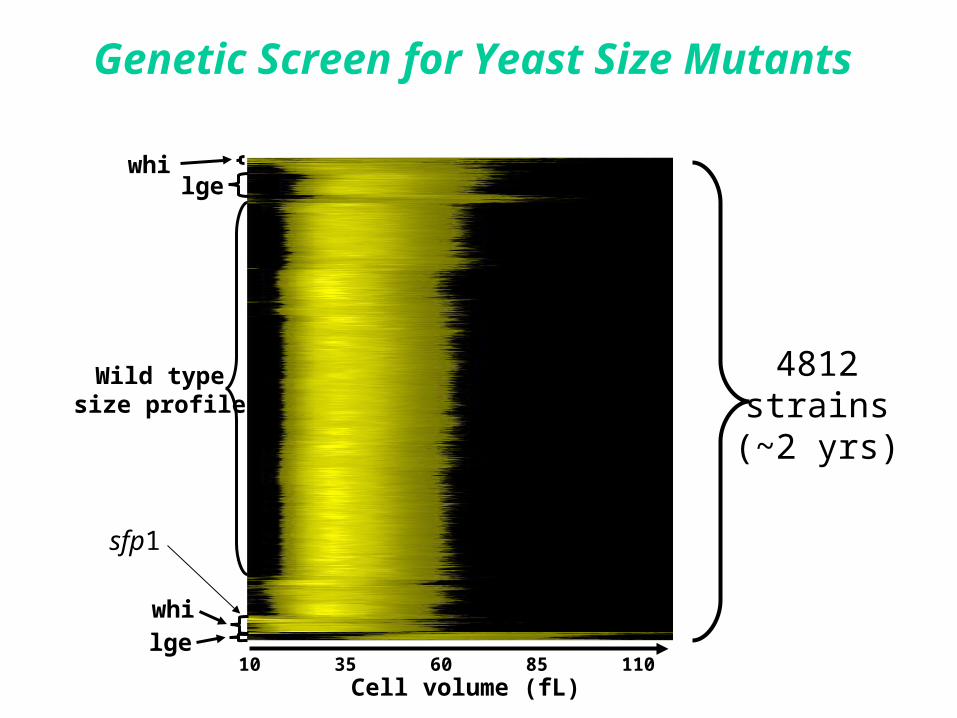
Genetic Screen for Yeast Size Mutants
lge
lge
Wild typesize profile
whi
whi
Cell volume (fL)10 35 60 85 110
4812strains(~2 yrs)
sfp1
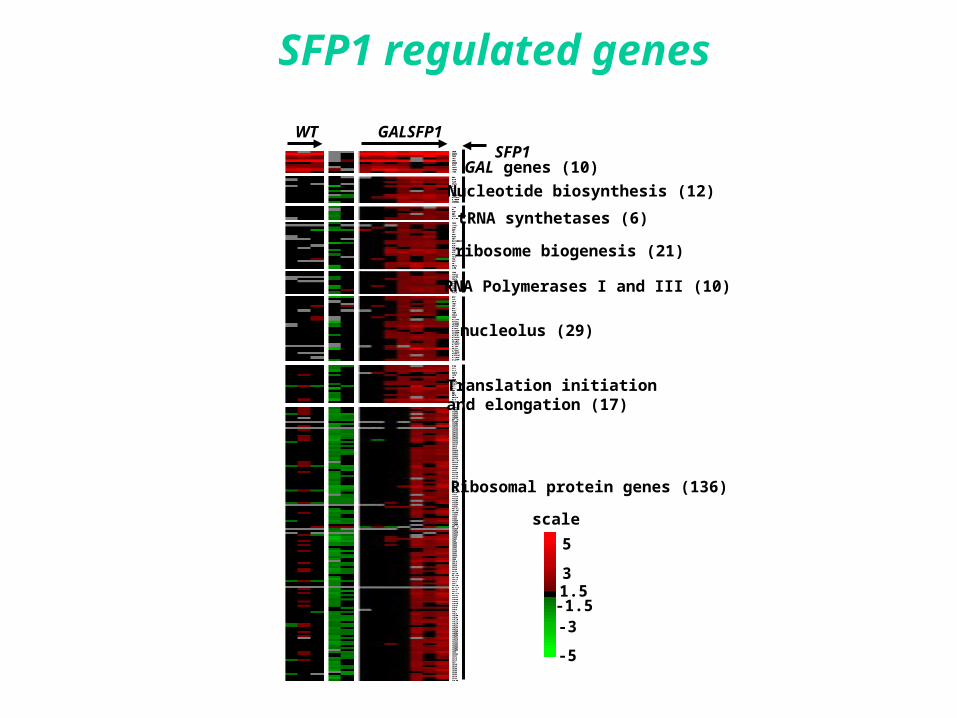
GALSFP1WT
GAL genes (10)
Nucleotide biosynthesis (12)
tRNA synthetases (6)
ribosome biogenesis (21)
RNA Polymerases I and III (10)
nucleolus (29)
Translation initiationand elongation (17)
Ribosomal protein genes (136)
SFP1
5
31.5-1.5-3
-5
scale
SFP1 regulated genes
Yeast Interaction Map
Ho et al. Nature 10:180-3, 2002.FLAG IP > LC-MS/MS