s Mapping Regional Drought Vulnerability: A Case Study M. Karamouz a *, A. Zeynolabedin b , M.A. Olyaei c a Professor, School of Civil Engineering, University of Tehran, Tehran, Iran, [email protected]b Research assistant, School of Civil Engineering, University of Tehran, Tehran, Iran, [email protected]c Ph.D. Candidate, School of Civil Engineering, University of Tehran, Tehran, Iran, [email protected]KEY WORDS: Drought, MCDM, Regional Assessment, Climate Variability, Vulnerability Maps, GIS ABSTRACT: Drought is among the natural disaster that causes damages and affects many people’s life in many part of the world including in Iran. Recently, some factors such as climate variability and the impact of climate change have influenced drought frequency and intensity in many parts of the world. Drought can be divided into four categories of meteorological, hydrological, agricultural and social- economic. In meteorological the important feature is lack of rainfall. In hydrological drought river flows and dam storage are considered. Lack of soil moisture is the key factor in agricultural droughts while in social-economic type of drought the relation between supply and demand and social-economic damages due to water deficiency is studied. While the first three types relates to the lack of some hydrological characteristics, social-economic type of drought is actually the consequence of other types expressed in monetary values. Many indices are used in assessing drought; each has its own advantages and disadvantages and can be used for specific types of drought. Therefore knowing the types of drought can provide a better understanding of shortages and their characteristics. Drought vulnerability is a concept which shows the likelihood of damages from hazard in a particular place by focusing on the system status prior to the disaster. Drought vulnerability has been viewed as a potential for losses in the region due to water deficiency at the time of drought. In this study the application of vulnerability concept in drought management in East Azarbaijan province in Iran is investigated by providing vulnerability maps which demonstrates spatial characteristics of drought vulnerability. In the first step, certain governing parameters in drought analysis such as precipitation, temperature, land use, topography, solar radiation and ground water elevation have been investigated in the region. They are described in details and calculated in suitable time series. Vulnerabilities are ranked in 5 intervals and for each parameter vulnerability maps are prepared in GIS environment. Selection of theses parameters are based on factors such as regional features and availability of data. Considering the fact that the aforementioned parameters have different level of importance in vulnerability maps, different weights are assigned to the parameters considering how critical each parameter is in the overall drought analysis. Expert's opinion is selected in assigning weights. A multi-criteria decision making (MCDM) framework is used to check the consistency of the provided information. Then the weighted maps are overlaid to find the overall vulnerability map. The map shows very low, low, medium, intense and very intense regional vulnerabilities. According to the results, the west part of East Azarbaijan province is the most vulnerable region to drought which is expected due to the vicinity of this part to Urumia Lake that has been lost most of its water during the last decades. The least vulnerable part seems to be the Eastern part of the province with longer lasting resources. Taking into consideration that Caspian Sea is near this part with high precipitation record, the outcome of this study is in line with the general expectations. The result of this study can be used for preparedness planning and for allocating resources for facing droughts in this region. * Corresponding author 1. INTRODUCTION One of the complex natural hazards that have extreme effects on society, environment and economy is drought. So realizing its features can provide a better preparedness to face it. Various definitions have been provided for drought but in general the lack of water resources in a specific period in a geographical area is considered as drought (Rossi, 2000) which implies this phenomenon as a regional hazard. Intensity, duration and area extent are three important features in drought (Rossi et al., 1992). Drought can be divided into four categories which are meteorological, hydrological, agricultural and social-economic (Wilhite and Glantz, 1985; Rasmussen et al., 1993). In meteorological the important feature is lack of rainfall. In hydrological drought river flows and dam capacities are considered. Low soil moisture is the key factor in agricultural droughts while in social-economic type of drought the relation between supply and demand and social-economic damages due to water deficiency is studied. While the first three types relates to the lack of some hydrological characteristics, social- economic type of drought is actually the consequence of other droughts in terms of monetary losses (Keyantash and Dracup, 2002). There are a number of indices used in assessing drought; each has its own advantages and disadvantages and can be used for a specific types of drought. Therefore depending on the types of drought a region is concerned about, the assessment and monitoring of that could be significantly different. The International Archives of the Photogrammetry, Remote Sensing and Spatial Information Sciences, Volume XL-1/W5, 2015 International Conference on Sensors & Models in Remote Sensing & Photogrammetry, 23–25 Nov 2015, Kish Island, Iran This contribution has been peer-reviewed. doi:10.5194/isprsarchives-XL-1-W5-369-2015 369
Transcript
s
Mapping Regional Drought Vulnerability: A Case Study
M. Karamouz a*, A. Zeynolabedin b, M.A. Olyaei c
a Professor, School of Civil Engineering, University of Tehran, Tehran, Iran, [email protected]
b Research assistant, School of Civil Engineering, University of Tehran, Tehran, Iran, [email protected]
c Ph.D. Candidate, School of Civil Engineering, University of Tehran, Tehran, Iran, [email protected]
Drought is among the natural disaster that causes damages and affects many people’s life in many part of the world including in Iran.
Recently, some factors such as climate variability and the impact of climate change have influenced drought frequency and intensity
in many parts of the world. Drought can be divided into four categories of meteorological, hydrological, agricultural and social-
economic. In meteorological the important feature is lack of rainfall. In hydrological drought river flows and dam storage are
considered. Lack of soil moisture is the key factor in agricultural droughts while in social-economic type of drought the relation
between supply and demand and social-economic damages due to water deficiency is studied. While the first three types relates to
the lack of some hydrological characteristics, social-economic type of drought is actually the consequence of other types expressed in
monetary values. Many indices are used in assessing drought; each has its own advantages and disadvantages and can be used for
specific types of drought. Therefore knowing the types of drought can provide a better understanding of shortages and their
characteristics. Drought vulnerability is a concept which shows the likelihood of damages from hazard in a particular place by
focusing on the system status prior to the disaster. Drought vulnerability has been viewed as a potential for losses in the region due
to water deficiency at the time of drought. In this study the application of vulnerability concept in drought management in East
Azarbaijan province in Iran is investigated by providing vulnerability maps which demonstrates spatial characteristics of drought
vulnerability. In the first step, certain governing parameters in drought analysis such as precipitation, temperature, land use,
topography, solar radiation and ground water elevation have been investigated in the region. They are described in details and
calculated in suitable time series. Vulnerabilities are ranked in 5 intervals and for each parameter vulnerability maps are prepared in
GIS environment. Selection of theses parameters are based on factors such as regional features and availability of data. Considering
the fact that the aforementioned parameters have different level of importance in vulnerability maps, different weights are assigned to
the parameters considering how critical each parameter is in the overall drought analysis. Expert's opinion is selected in assigning
weights. A multi-criteria decision making (MCDM) framework is used to check the consistency of the provided information. Then
the weighted maps are overlaid to find the overall vulnerability map. The map shows very low, low, medium, intense and very
intense regional vulnerabilities. According to the results, the west part of East Azarbaijan province is the most vulnerable region to
drought which is expected due to the vicinity of this part to Urumia Lake that has been lost most of its water during the last decades.
The least vulnerable part seems to be the Eastern part of the province with longer lasting resources. Taking into consideration that
Caspian Sea is near this part with high precipitation record, the outcome of this study is in line with the general expectations. The
result of this study can be used for preparedness planning and for allocating resources for facing droughts in this region.
* Corresponding author
1. INTRODUCTION
One of the complex natural hazards that have extreme effects on
society, environment and economy is drought. So realizing its
features can provide a better preparedness to face it. Various
definitions have been provided for drought but in general the
lack of water resources in a specific period in a geographical
area is considered as drought (Rossi, 2000) which implies this
phenomenon as a regional hazard. Intensity, duration and area
extent are three important features in drought (Rossi et al.,
1992).
Drought can be divided into four categories which are
meteorological, hydrological, agricultural and social-economic
(Wilhite and Glantz, 1985; Rasmussen et al., 1993). In
meteorological the important feature is lack of rainfall. In
hydrological drought river flows and dam capacities are
considered. Low soil moisture is the key factor in agricultural
droughts while in social-economic type of drought the relation
between supply and demand and social-economic damages due
to water deficiency is studied. While the first three types relates
to the lack of some hydrological characteristics, social-
economic type of drought is actually the consequence of other
droughts in terms of monetary losses (Keyantash and Dracup,
2002). There are a number of indices used in assessing drought;
each has its own advantages and disadvantages and can be used
for a specific types of drought. Therefore depending on the
types of drought a region is concerned about, the assessment
and monitoring of that could be significantly different.
The International Archives of the Photogrammetry, Remote Sensing and Spatial Information Sciences, Volume XL-1/W5, 2015 International Conference on Sensors & Models in Remote Sensing & Photogrammetry, 23–25 Nov 2015, Kish Island, Iran
This contribution has been peer-reviewed. doi:10.5194/isprsarchives-XL-1-W5-369-2015
369
Dziegielewski et al. (1992) works can be noted in the social-
economic drought field. After examining the economic
consequences water supply shortage, he recommended long-
term drought management plan for Phoenix in the United
States. About hydrological drought, Garen (1993) research can
be referred. He investigated Flat Head river flow in Montana
using the revised index of surface water supply index which is
called SWSI (Shafer and Dezman 1982). Shin et al. (2000)
analyzed regional drought using neutral networks. Karamouz et
al. (2004) analyzed hydrological and agricultural droughts in
the central region of Iran using statistical analysis. In this study
a water balance model has been developed for estimating
hydrological and agricultural parameters in order to calculate
excess rainfall under normal conditions that is required for
determining PDSI and soil moisture anomaly Z indices.
Karamouz et al. (2009) presented a hybrid index for
meteorological, agricultural and hydrological drought and
compared the results one by one. Karamouz et al. (2013)
developed an integrated drought evaluation and monitoring
system for Aharchay river basin.
Vulnerability is the important concepts in natural hazards
including drought (Klein et al., 2003). Vulnerability shows the
likelihood of damages from hazard in a certain place by
focusing on the system status prior to the disaster (Zhou et al.,
2010). However, there are some other definitions of
vulnerability (Cutter et al., 2003; Etkin et al., 2004; Turner et
al., 2003; Gallopin, 2006). Vulnerability can be studied in four
concepts: exposure, susceptibility, coping capacity and adaptive
capacity (Neema et al., 2010).
Many studies have been done in applying vulnerability concept
in drought. Anderson (1995) delivered a general framework for
assessing vulnerability. Bohle et al. (1994) investigated climate
change and social vulnerability toward a sociology and
geography of food insecurity. Lourens (1995) developed a
system for drought monitoring and severity assessment. Liu and
Kogan (1996) developed a way to monitor regional drought
using the vegetation condition index. Chang et al. (1997)
developed a GIS procedure for the study of evaporation and
infiltration in case of drought. Keenan and Krannich (1997)
investigated the social context of perceived drought
vulnerability. Wilhelmi and Wilhite (2000) assessed
vulnerability to agricultural drought in Nebraska. Jackson
(2001) assessed and mapped drought hazard for Nevis. Some
researchers have assessed specific drought vulnerability for a
region. Eriyagama et al. (2009) mapped drought pattern and
impacts as a global perspective. Slejko et al. (2010) assessed
agricultural drought vulnerability for the west part of Slovenia
which results in a vulnerability map that provide decision
makers with information about which region is under a risk of
being affected by drought. Moring et al. (2012) mapped drought
vulnerability on the basis of some parameters like climate, land
use and soil parameters using GIS technique.
The aim of this study is to assess the spatial vulnerability of the
region by applying some important parameters.
In general, previous studies on droughts mostly have paid
attention to drought assessment index calculation, determination
of its severity, and detection the threshold of drought
occurrence. In vulnerability concept, a more comprehensive
approach has been implemented by considering more
parameters than previous works in assessing drought
vulnerability maps.
In the following section, methodology has been described in
details and results have been presented cussed and finally a
summary and conclusion is given.
2. METHODOLOGY
In the following section the procedure for creating vulnerability
maps is discussed. To achieve this objective, first, the
vulnerability maps of the region is obtained by analyzing and
overlaying the spatial maps of important parameters in drought
context like topography, solar radiation, precipitation,
temperature, land use and ground water elevation.
2.1 Vulnerability Assessment
Drought vulnerability has been viewed as a potential for losses
in a region due to water deficiency at the time of drought. In
this section, development of drought vulnerability map is
discussed extending the methodology utilized by Slejko (2010).
For this purpose six parameters have been selected which are
precipitation, temperature, solar radiation, slope, land use and
ground water level. The data needed was obtained from Iran
Meteorological Organization (IRIMO), Water Resources
Management Company and Forests, Range, Watershed
Management Organization which is showed in Table 1 by
details. Data duration for all parameters is from 2001 until
2011.
Precipitation, temperature,
solar radiation, ground water
level
Meteorological Organization
(IRIMO)
DEM files for slope map Water Resources Management
Company
Land use Forests, Range, Watershed
Management Organization
Table 1- Data resources from agencies in Iran
For each parameter a category map has been created using GIS
which shows variability of that parameter in the region.
Vulnerability has been divided into five categories. In the end a
weight has been assigned to each category map using AHP
method and finally all six category maps have been overlaid and
a unique drought vulnerability map has been developed. In the
following sections, each parameter has been described in
details.
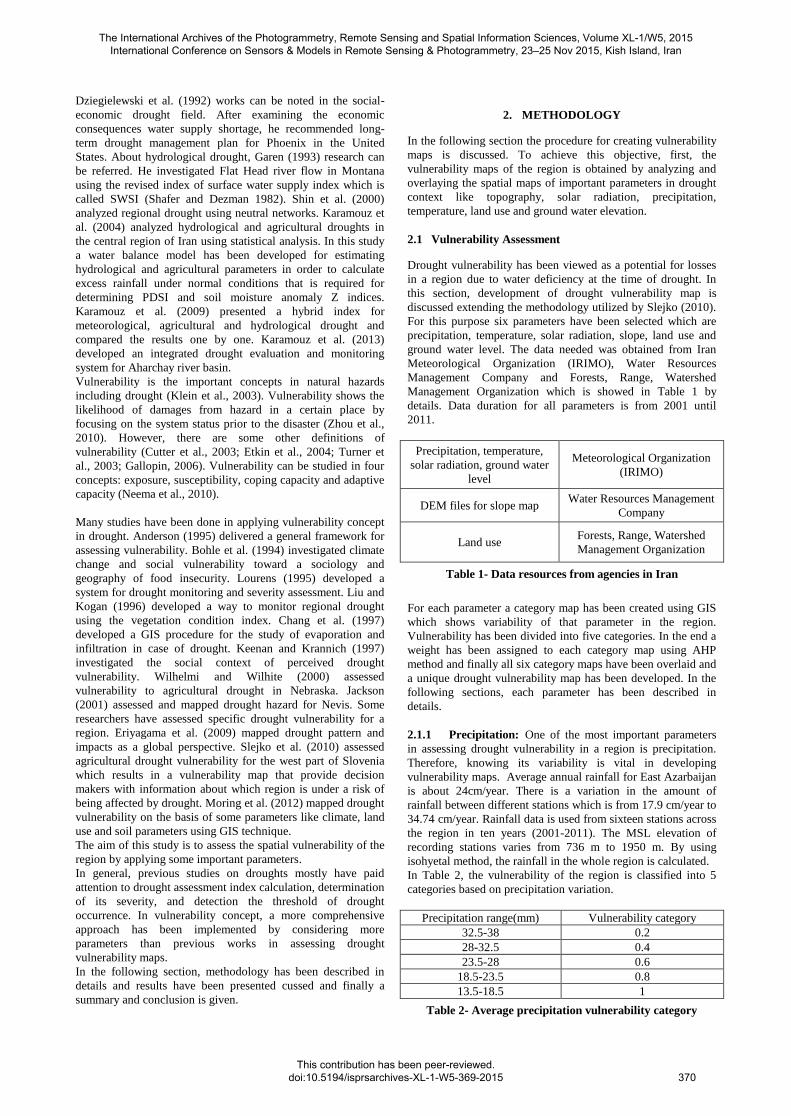
2.1.1 Precipitation: One of the most important parameters
in assessing drought vulnerability in a region is precipitation.
Therefore, knowing its variability is vital in developing
vulnerability maps. Average annual rainfall for East Azarbaijan
is about 24cm/year. There is a variation in the amount of
rainfall between different stations which is from 17.9 cm/year to
34.74 cm/year. Rainfall data is used from sixteen stations across
the region in ten years (2001-2011). The MSL elevation of
recording stations varies from 736 m to 1950 m. By using
isohyetal method, the rainfall in the whole region is calculated.
In Table 2, the vulnerability of the region is classified into 5
categories based on precipitation variation.
Precipitation range(mm) Vulnerability category
32.5-38 0.2
28-32.5 0.4
23.5-28 0.6
18.5-23.5 0.8
13.5-18.5 1
Table 2- Average precipitation vulnerability category
The International Archives of the Photogrammetry, Remote Sensing and Spatial Information Sciences, Volume XL-1/W5, 2015 International Conference on Sensors & Models in Remote Sensing & Photogrammetry, 23–25 Nov 2015, Kish Island, Iran
This contribution has been peer-reviewed. doi:10.5194/isprsarchives-XL-1-W5-369-2015
370
2.1.2 Temperature: Temperature is another important factor
in assessing vulnerability due to its direct impact on
transpiration. Due to the high elevation of a region from sea
level (considering the fact that the temperature drops 1C with
the 100 meters increase in altitude) and the mountainous
topography, cool weather is expected in area. Average annual
temperature for East Azarbaijan varies from 8 to 16C. Higher
temperature will cause more evapotranspiration and can make
the region more vulnerable. For vulnerability classification, the
average temperature for each station is calculated in duration of
time series. In Table 3, the classification of vulnerability based
on the temperature is given.
Temperature range(C) Vulnerability category
<9.5 0.2
9.5-11 0.4
11-12.5 0.6
12.5-14 0.8
>14 1
Table 3- Temperature vulnerability category
2.1.3 Solar Radiation: Solar radiation is another factor that
is considered because of its importance in energy conservation
field issues and it is considered as one of the factors in
evaluating evapotranspiration. Due to low number of solar
radiation sites and lack of accuracy in direct measurement of
solar radiation with old tools in Iran, a number of empirical
formulas and methods have been developed to estimate daily or
monthly global radiation at different places in the world. The
availability of meteorological parameters, which are used as the
input of radiation models, is the key factor in choosing the
proper radiation models at any location.
Many researches have been done in this field and some methods
such as Angstrom (1924), Paltridge (1976), Sabbagh (1977) and
Daneshyar (1978) have been proposed for evaluating solar
radiation each of which has its own input parameters.
In this study Sabbagh method has been used due to adaptability
and availability of data in Iran. This model which is described
in below is applicable to dry arid and semi-arid regions such as
Iran.
Sabbagh formula for evaluating solar radiation is:
)]1
-100
RH -
12
n)exp[L(0.06407(K=
max
0.333
gestT
R
where Rest = total daily global radiation (MJ.m-2.day-1)
n = monthly average daily real sunshine duration (hr)
RH = relative humidity (%)
Tmax =monthly average of daily maximum air
temperature(C)
Kg = the geographical factor (g.cal.cm-2.day-1)
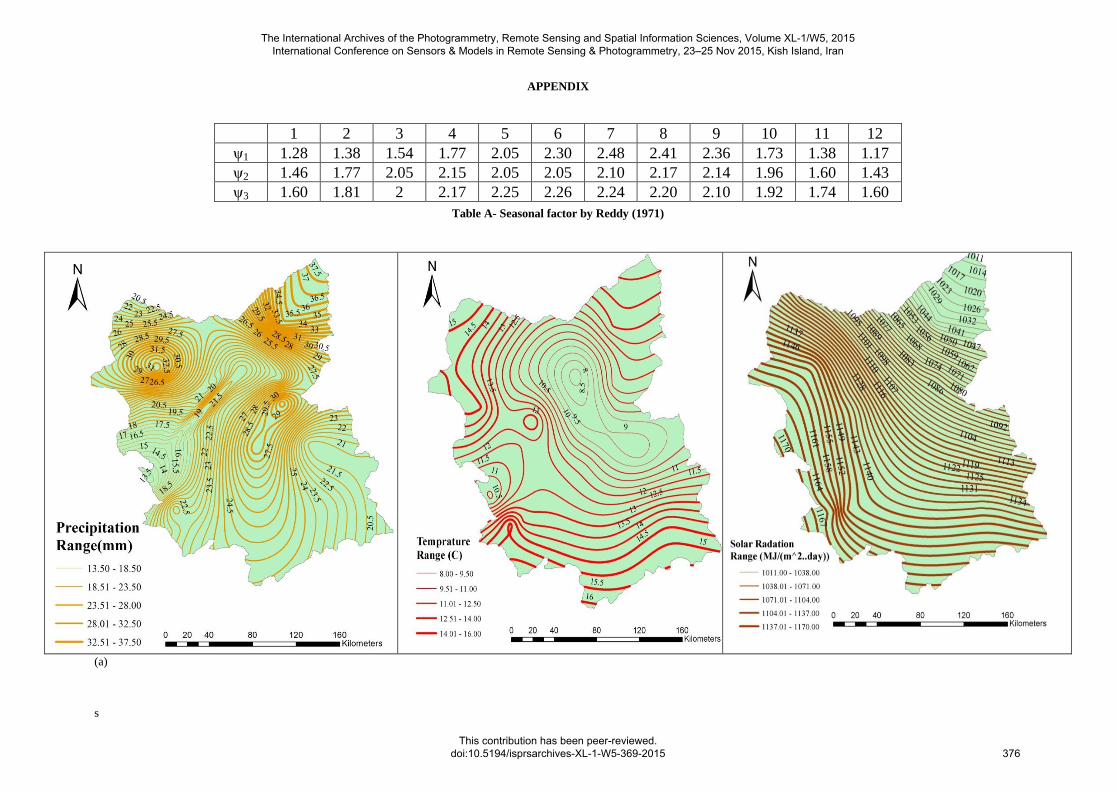
Kg of Sabbagh method is suggested by Reddy (1971):
osL)100(= ,g cNK ji
where L = latitude of the place in degrees
N = monthly average of daily maximum possible
sunshine duration in hour
λ = latitude factor
ψi,j = seasonal factor
λ is estimated as:
0.1L)(1
0.2=
ψi,j is seasonal factor (i=1,2,3 for inland station, coastal stations
and hilly stations respectively while j=1,2,3,…,12 is the month
index from January to December) delivered in Table A (in
appendix).
Sabbagh equation input data is obtained from ten (10) stations
around the region in ten (10) years. Solar radiation has a direct
relationship with transpiration. Higher values will cause more
transpiration and so it is considered as higher vulnerable. Thus,
vulnerability is classified in 5 categories which are shown in
Table 4.
Total daily global radiation
range (MJ.m-2.day-1)
Vulnerability
category
1007-1043 0.2
1043-1079 0.4
1079-1114 0.6
1114-1150 0.8
1150-1185 1
Table 4- Solar Radiation Vulnerability Category
2.1.4 Slope: Slope maps represent topography of the region.
Larger slope could produce larger amount of runoff, therefore,
less ground water storage could be produced. As a result, in this
study larger slope is considered to be more vulnerable. This
may not always be the case but it is assumed here and as also
indicated by Slejko (2010). Slope in the region varies from 0 to
90 degrees which represents a wide topography in the region.
For slope variation, vulnerability is classified into 5 categories
which are shown in Table 5.
Slope range (degree) Vulnerability category
0-5 0.2
5-12 0.4
12-20 0.6
20-35 0.8
35-90 1
Table 5- Slope Vulnerability Category
2.1.5 Land Use: The way the lands are used in a region has
a direct impact on water resources and as result it is considered
in the drought vulnerability analysis. Land use could influence
on water resources through changes in catchment yields,
infiltration rates, dissolved organic carbon and nutrient transfers
(Weatherhead and Howden, 2009). In this study water demand
for each land use type has been assumed as a factor that directly
influences drought vulnerability. For instance, salt lands have
low water demand and as a result it is considered to have the
lowest vulnerability to drought. On the other hand, irrigated
areas have a large water demand which makes them the most
vulnerable land use type when it comes to having water
shortages. Different land uses types have been recognized in the
study region which are wetland, forest, fishery poll, woodland,
range, mountain range, garden, urban, salt lake, dry farming,
irrigated area, salt lands and bare lands. They have been
categorized into 5 groups which are showed in Table 6.
(1)
(2)
(3)
The International Archives of the Photogrammetry, Remote Sensing and Spatial Information Sciences, Volume XL-1/W5, 2015 International Conference on Sensors & Models in Remote Sensing & Photogrammetry, 23–25 Nov 2015, Kish Island, Iran
This contribution has been peer-reviewed. doi:10.5194/isprsarchives-XL-1-W5-369-2015
371
Land Use Vulnerability category
Salt lands, bare lands,
mountain range 0.2
Wetlands, dense forest, good
range 0.4
Urban, moderate range,
moderate forest, dry farming 0.6
Low forest, poor range 0.8
Irrigated area, lake, garden,
fishery pool 1
Table 6- Land Use Vulnerability Category
2.1.6 Ground Water Level: Ground water is an important
source of water supply in the region, particularly at the time of
drought. Therefore, ground water level is also considered for
developing vulnerability maps. It should be noted that water
storage in the surface reservoirs is also important but it is not
included because: 1) surface water storage have discrete values
and interpolation between its scattered values is not
representative for regional vulnerability studies as presented
here; 2) It doesn't have distribution characteristics all over the
region and cannot be mapped like the other parameters. Table 7
shows the 5 vulnerability categories for groundwater level
variation.
Ground water level range(m) Vulnerability category
< 15 0.2
15-33 0.4
33-54 0.6
54-75 0.8
> 75 1
Table 7- Ground Water Level Vulnerability Category
3. CASE STUDY
The case study is East Azarbaijan province (Figure 1) which
contains watersheds such as Aharchay, Sufichay, Tajyar and
Shahrchay. As it is displayed in Figure 1, this province consists
of 19 counties with a total area of approximately 47,830 km2.
The data from 16 hydrological stations including rain gauge
stations and groundwater level monitoring stations are used for
evaluation of vulnerability.
Figure 1- East Azarbaijan Province
4. RESULTS
In Figure A (in Appendix), the variation of each parameter
(precipitation, temperature, solar radiation, slope, land use and
groundwater) in vulnerability assessment is shown. These maps
were obtained using ArcGIS software. For each map the
variation is classified in five groups as it was mentioned in
Table 2 to Table 7.
Finally, all 6 category maps were overlaid to produce total
vulnerability map for the region. For overlaying, weights are
assigned for the map of each parameter based on their
importance and influence on drought vulnerability. AHP
method has been used for this task which uses experts' opinions.
Table 8 shows each category map weights.
Parameter Weight
Precipitation 0.25
Temperature 0.15
Land use 0.2
Ground water level 0.2
Solar radiation 0.15
Slope angle 0.05
Table 8- Category Maps Weights
The International Archives of the Photogrammetry, Remote Sensing and Spatial Information Sciences, Volume XL-1/W5, 2015 International Conference on Sensors & Models in Remote Sensing & Photogrammetry, 23–25 Nov 2015, Kish Island, Iran
This contribution has been peer-reviewed. doi:10.5194/isprsarchives-XL-1-W5-369-2015
372
Figure 2- Final vulnerability map including some strategic
locations
Figure 2 shows the final vulnerability variation of the region. As
it can be seen the vulnerability almost increases gradually from
east to west. The western part has the highest vulnerability
value (nearly 0.83). This part is next to Urumia Lake. This lake
has lost most of its resources during the last decades due to the
over utilization of its resources causing excessive depletion in
this lake. Table 9 shows vulnerability value of some important
locations shown in Figure 2.
Location Vulnerability value
Tabriz 0.53
Varzaghan 0.41
Kalrybar 0.35
Sarab 0.38
Mianeh 0.68
Maragheh 0.62
Table 9- Vulnerability values for selected regions
On the other hand, the eastern part of Figure 2, particularly
northeast part, has the lowest vulnerability value (0.32).
Considering the fact that this region is near Caspian sea with
high amount of precipitation, the result seems reasonable.
It should be noted that most of the factors that were considered
in vulnerability evaluation are greatly related to the intrinsic
nature of the region. This means that these features cannot be
changed easily. Therefore, drought occurrence is to some extend
inevitable. In other word, preventing drought might not be
achievable. A good idea in management of this hazard is
focusing on resiliency of the region which shows how region is
capable of facing this hazard in a timely manner. Resilient
region has the ability to cope with drought and become more
sustainable.
5. SUMMARY AND CONCLUSION
In this study, a drought vulnerability map has been created for
East Azarbaijan based on 6 parameters of precipitation,
temperature, solar radiation, slope, land use and ground water
level. For this purpose each parameter is classified into 5 groups
and their spatial distribution were mapped in GIS to show
variability of that parameter. Maps have been weighted and then
overlaid to provide drought vulnerability map. The results show
that western and southern parts of the region are more
vulnerable to drought and therefore more resources and
strategies should be implemented in those parts of for drought
preparedness planning the methodology of this study could be
utilized in other arid and semiarid regions.
REFERENCES
Anderson, M. B. (1995). Vulnerability to disaster and
sustainable development: A general framework for assessing
vulnerability. Disaster Prevention for Sustainable Development:
Economic and Policy Issues. Washington, DC: World Bank, 41-
59.
Angstrom, A. (1924). Solar and terrestrial radiation. Report to
the international commission for solar research on actinometric
investigations of solar and atmospheric radiation. Quarterly
Journal of the Royal Meteorological Society,50(210), 121-126.
Bohle, H. G., Downing, T. E., & Watts, M. J. (1994). Climate
change and social vulnerability: toward a sociology and
geography of food insecurity. Global Environmental
Change, 4(1), 37-48.
Chang, T., (1990). Effects of Drought on Streamflow
Characteristics. J. Irrig. Drain Eng., 116(3), 332–341.
Chang, T. J., Germain, R., & Bartrand, T. A. (1997).
Development of a GIS procedure for the study of evaporation
and infiltration in case of drought. In Computing in Civil
Engineering (pp. 606-614).ASCE.
Cutter, S. L., Boruff, B. J., & Shirley, W. L. (2003). Social
vulnerability to environmental hazards. Social science
quarterly, 84(2), 242-261.
Daneshyar, M. (1978). Solar radiation statistics for Iran. Solar
Energy, 21(4), 345-349.
Dziegielewski, B., Mee, W. R., Larson, K. R., (1992).
Developing a long-term drought plan for Phoenix, Journal-
American Water Works Association, Vol. 84, No. 10, pp. 46-51
Etkin D, Haque E, Bellisario L, Burton I (2004). An assessment
of natural hazards and disasters in Canada.The Canadian natural
hazards assessment project. Public safety and emergency
preparedness Canada and environment Canada, Ottawa
Gallopín, G. C. (2006). Linkages between vulnerability,
resilience, and adaptive capacity. Global environmental
change, 16(3), 293-303.
Garen, D. C., (1993). Revised surface-water supply index for
western United States, Journal of Water Resources Planning
Islamic Republic of Iran Meteorological Organization (IRIMO),
website: http://www.irimo.ir/far/
The International Archives of the Photogrammetry, Remote Sensing and Spatial Information Sciences, Volume XL-1/W5, 2015 International Conference on Sensors & Models in Remote Sensing & Photogrammetry, 23–25 Nov 2015, Kish Island, Iran
This contribution has been peer-reviewed. doi:10.5194/isprsarchives-XL-1-W5-369-2015
Statistical Center of Iran, website:http://www.amar.org.ir/
Turner, B. L., Kasperson, R. E., Matson, P. A., McCarthy, J. J.,
Corell, R. W., Christensen, L., ... & Schiller, A. (2003). A
framework for vulnerability analysis in sustainability
science. Proceedings of the national academy of
sciences,100(14), 8074-8079.
Weatherhead, E. K., & Howden, N. J. K. (2009). The
relationship between land use and surface water resources in the
UK, Land Use Policy, 26, S243-S250.
Wilhite, D. A., & Glantz, M. H. (1985). Understanding: the
drought phenomenon: the role of definitions. Water
international, 10(3), 111-120.
Wilhelmi, O. V. (1999). Methodology for assessing
vulnerability to agricultural drought: A Nebraska case
study (Doctoral dissertation, University of Nebraska, Lincoln).
Zhou, H., Wan, J., & Jia, H. (2010). Resilience to natural
hazards: a geographic perspective, Natural Hazards, 53(1), 21-
41.
Smith, J., 1987a. Close range photogrammetry for analyzing
distressed trees. Photogrammetria, 42(1), pp. 47-56.
Smith, J., 1987b. Economic printing of color orthophotos.
Report KRL-01234, Kennedy Research Laboratories, Arlington,
VA, USA.
The International Archives of the Photogrammetry, Remote Sensing and Spatial Information Sciences, Volume XL-1/W5, 2015 International Conference on Sensors & Models in Remote Sensing & Photogrammetry, 23–25 Nov 2015, Kish Island, Iran
This contribution has been peer-reviewed. doi:10.5194/isprsarchives-XL-1-W5-369-2015
374
Smith, J., 1989. Space Data from Earth Sciences. Elsevier,
Amsterdam, pp. 321-332.
Smith, J., 2000. Remote sensing to predict volcano outbursts.
In: The International Archives of the Photogrammetry, Remote
Sensing and Spatial Information Sciences, Kyoto, Japan, Vol.
XXVII, Part B1, pp. 456-469.
The International Archives of the Photogrammetry, Remote Sensing and Spatial Information Sciences, Volume XL-1/W5, 2015 International Conference on Sensors & Models in Remote Sensing & Photogrammetry, 23–25 Nov 2015, Kish Island, Iran
This contribution has been peer-reviewed. doi:10.5194/isprsarchives-XL-1-W5-369-2015
376
(b)
Figure A- Variation map of the effective parameters in drought vulnerability assessment, (a): Precipitation, Temperature and solar radiation range map, (b): Solar map, Land use and
Ground water level map
The International Archives of the Photogrammetry, Remote Sensing and Spatial Information Sciences, Volume XL-1/W5, 2015 International Conference on Sensors & Models in Remote Sensing & Photogrammetry, 23–25 Nov 2015, Kish Island, Iran
This contribution has been peer-reviewed. doi:10.5194/isprsarchives-XL-1-W5-369-2015