1 These cut scores also may be considered to define the boundary or borderline between A2 and B1 proficiency and B2 and C1 proficiency.
3
• [Paper-based] Test of English as a Foreign Language (TOEFL). The TOEFL measures
the ability of non-native communicators of English ability to understand English as it is
spoken in North American academic contexts (Listening skill), to recognize language
appropriate for standard written English (Structure skill), this being part of the larger
writing construct complemented by the TWE), and to understand short passages similar
in topic and style to academic texts used in North American colleges and universities
(Reading skill). The [Paper-based] TOEFL is a selected-response (multiple-choice) test
that is reported on a scale that ranges from a low of 310 to a high of 677.
• Test of English for International Communication (TOEIC). The TOEIC measures the
ability of non-native English communicators to communicate in English in the global
workplace. The TOEIC addresses listening comprehension skills and reading
comprehension skills. The test items are developed from samples of spoken and written
English from countries around the world. The TOEIC is a selected-response test that is
reported on a scale that ranges from a low of 10 to a high of 9902.
Panelist Training
The first major event of the training process had panelists summarizing the key
descriptors of a B1 level of proficiency on the CEF and a C1 level of proficiency. This was done
in two small groups, one focusing on the B1 level and the other on the C1 level. Each level was
defined in terms of the English-language skill(s) being measured by the particular test that was
the immediate focus. For example, the first test to be addressed by Panel 1 was the TSE;
therefore, the B1 and C1 levels of the CEF corresponding to speaking were summarized. Each
small group was asked to record on chart paper the main points that defined their assigned CEF
level. This exercise was designed to bring the groups to an agreed upon, shared understanding of
the CEF levels. Each group’s charted summary was posted and discussed so that the whole panel
had an opportunity to comment and, as appropriate, suggest modifications. The whole-panel
agreed-upon summaries remained posted to guide the standard-setting judgment process for the
TSE. (Prior to the meeting, each panelist was given a “homework” assignment to review the CEF
and selected tables of level descriptors and to write down key indicators. Panelists were
2 Different reporting scales are used across the tests (TSE, TWE, TOEFL TOEIC) to avoid confusion and to help ensure that one score is not substituted for a score on another test that has a different meaning.
4
encouraged to refer to their homework notes to facilitate the summarization exercise. See the
Appendix B for a copy of the homework assignment, and for Tables A through F in Appendix C
for copies of each panels’ agreed-upon key indicator summaries for each language skill.)
The exercise of summarizing the B1 and C1 levels was repeated in turn for each of the
language skills addressed by the test of focus. Once the standard-setting judgments were
completed for the TSE, the TWE was presented, so the summary process was repeated for
writing. After standard-setting judgments were completed for the TWE, the TOEFL became the
focus. The exercise was then repeated for reading and listening. The CEF Writing descriptors
included aspects of writing relevant to the TOEFL structure section. The panel that worked on
the TOEIC test completed the same exercise for the listening and reading, the two language skills
measured by the TOEIC.
Standard-Setting Process for Constructed-response Tests
The TSE and the TWE are considered constructed-response tests in that candidates are
required to produce original responses, not to select from a set of given options, as in the case of
multiple-choice tests. The standard-setting process as applied to the TSE will be described in
some detail. An abbreviated presentation of the process will follow for the TWE because the
same process was used` in both cases.
The standard-setting process applied to the TSE is variously known as the Benchmark
Method (Faggen, 1994) or the Examinee Paper Selection Method (Hambleton, Jaeger, Plake, &
Mills, 2000). As applied to the TSE, the process included the panelists first reviewing the nine
items of the TSE and the scoring rubric. Operationally, the panelists were asked to read a TSE
item and to listen to sample spoken responses to the item that served to illustrate each whole-
number score point on the rubric (20, 30, 40, 50, 60). The panelists were asked to consider the
difficulty of the English language skill addressed by the item, the language features valued by the
rubric, and the skill set of a B1-level candidate (as previously defined). Panelists, independently,
were asked to pick the lowest scoring sample response that, in their expert judgment, most
appropriately reflected the response of a candidate who was just at the B1-level of proficiency.
Because, as noted previously, TSE responses are averaged, panelists were able to pick from
among the range of reported scores (20, 25, 30, 35, 40, 45, 50, 55, 60). So for example, if a
panelist believed that a B1-level candidate would score higher than a 30 on an item, but not quite
5
as high as a 40, the panelist would be able to pick a score of 35. They were then asked to repeat
the judgment process for a candidate at the C1-level of proficiency. This basic process was
followed for each of the nine TSE items.
Panelists independently completed their B1 judgment and C1 judgment for the first TSE
item and were asked to stop. Panelists were then asked to share their judgments for the first
item—what scores did they give for the B1-level candidate and the C1-level candidate? The
purpose of the facilitated discussion was for panelists to hear the judgment rationales of their
peers. The goal was to make more explicit the diversity of relevant perspectives reflected by the
panel and to give panelists an opportunity to consider a viewpoint that they had not previously
considered; the goal was not to have panelists conform to single expectation of B1 or C1 levels
of performance on TSE items. This practice opportunity was also used to clarify any
misunderstandings of the judgment process. At this point, panelists were formally asked to
acknowledge if they understood what they were being asked to do and the overall judgment
process. They did this by signing a training evaluation form confirming their understanding and
readiness to proceed. In the event that a panelist was not yet prepared to proceed, he or she
would have been given additional training by one of the ETS facilitators. All panelists signed off
on their understanding and readiness to proceed. Panelists were given the chance to change their
B1 and C1 judgments for the first item before proceeding, independently, on to the remaining
eight items of the TSE. The completion of the B1 and C1 judgments for all nine of the TSE items
was considered to be first-round judgments.
The ETS facilitators computed each panelist’s B1 and C1 standard-setting judgments for
the TSE, taking the average score across the nine items for each panelist. The average cut score
across all panelists was computed, as was the median, standard deviation, minimum cut score,
and maximum cut score. The cross-panelist summary information was posted and used to
facilitate a discussion. Each panelist also had his or her own B1 and C1 TSE cut scores. In
general, the panelists with the minimum score and maximum score were asked to begin the
discussion, with other panelists encouraged to share their judgments and decision rationales. At
the conclusion of the group discussion, the panelists were given an opportunity to change their
overall B1 and C1 TSE cut scores if they felt that they wished to reflect some aspect of the
discussion in their final judgment. Panelists were reminded that they could keep their first-round
scores; they were not obligated or expected to change their scores. Panelists then recorded their
6
second-round (final) judgments. (See the Appendix D for a copy of the judgment recording
form—for first-round and second-round decisions—completed by each panelist.)
This basic process was also applied to the Test of Written English (TWE). The TWE is
also a constructed-response assessment for which candidates produce an essay in response to a
given topic. There is only one topic, so, in essence, the TWE is a single-item test. As with the
TSE, panelists reviewed the essay topic and scoring rubric. They then reviewed sample essays
illustrative of each of the rubric score points. Panelists, independently, were asked to pick the
sample response that, in their expert judgment, reflected most appropriately the response of a
candidate just at the B1-level of proficiency, and then just at the C1-level of proficiency.
Panelists were able to pick half-point scores, as with the TSE. So, for example, if a panelist
believed that a B1-level candidate would score higher than a 4, but not quite as high as a 5, the
panelist would be able to pick a cut score of 4.5. The first-round of independent judgments was
followed by a whole-group discussion. Panelists were then given the opportunity to change their
B1- and C1-level judgments.
Standard-Setting Process for Selected-response (Multiple-choice) Tests
The [Paper-based] TOEFL and TOEIC tests are considered selected-response tests in that
candidates chose or select a response to an item from a given set of options. The standard-setting
process as applied to the TOEFL will be described in some detail. The same process was
subsequently applied to the TOEIC test reviewed by Panel 2.
The general standard-setting process applied to the TOEFL is known as the Angoff
Method (Angoff, 1971). The general approach remains the most widely used standard-setting
method for selected-response tests (Mehrens, 1995; Cizek, 1993; Hurtz & Auerbach, 2003). The
first section of the TOEFL test addressed was Structure. This section measures the ability of a
non-native communicator to recognize language appropriate for standard written English. There
are 40 items in the Structure section. As applied to the Structure section, panelists were asked to
read an item, consider the difficulty of the English-language skill addressed by the item, and to
judge the probability that a B1-level candidate would know the correct response. Panelists
recorded their item-level judgments on a form (see the Appendix D for an example of a judgment
form used for a selected-response section), with the following probability scale: 0.1, 0.2, 0.3, 0.4,
0.5, 0.6, 0.7, 0.8, 0.9. A judgment of 0.1, for example, corresponds to a 10 percent probability of
7
knowing the correct answer. As a rule-of-thumb, panelists were informed that a difficult item—
that is, one that requires a relatively high-level of English proficiency—might fall into the range
of 0.1 to 0.3: a 10- to 30-percent probability of knowing the correct answer. A relative easy item
might fall into the 0.7 to 0.9 range: 70- to 90-percent probability of knowing the correct answer;
and a moderately difficult item might fall into the range of 0.4 to 0.6: 40- to 60-percent
probability of knowing the correct answer.
Prior to making their “live” first-round standard-setting judgments for the Structure
items, panelists were given an opportunity to practice making judgments on five sample
Structure items from a previously administered [Paper-based] edition of the TOEFL. The edition
chosen had been administered to more than 750,000 examinees in 1997-1998. For each sample
item, each panelist was asked to record the probability that a B1-level candidate would know the
correct answer and then the probability that a C1-level candidate would know the correct answer
(practice recoding forms were provided.) Once each panelist noted his or her response, a whole-
group discussion occurred whereby panelists were asked to share their item-level decision
rationales. After the discussion of each item, the correct answer was revealed, as was the
proportion of 1997-1998 examinees that chose the correct answer, and whether the item would
be classified as being easy, of medium difficulty, or difficult, based on our rule-of-thumb
guidelines. (It was clarified that these percent correct values were based on the general
population of TOEFL examinees and that the panels’ task was to consider how an examinee at
the B1 level and an examinee at the C1 level would perform.) The practice session helped to
calibrate the panelists and helped to make explicit the diversity of relevant professional
perspectives reflected by the panel. The practice session also helped to clarify any
misunderstanding of the judgment process. Panelists were then asked to complete their “live”
B1- and C1-level judgments for the first four items of the Structure section and then to stop. This
provided an opportunity to answer panelists’ questions. The panelists confirmed that they
understood the process and were then asked to complete their round-one judgments for the
Structure section.
The ETS facilitators computed each panelist’s B1 and C1 standard-setting judgments for
the TOEFL Structure section, summing the probabilities across the 40 items, first for the B1
judgments and then for the C1 judgments. For example, if a panelist recorded a 0.5 for each of
the 40 items for a B1-level candidate, that panelist’s B1 score would be 20; so according to that
8
panelist, 20 items would need to be answered correctly for a candidate to be considered at the B1
proficiency level of the CEF. If a panelist recorded 0.8 for each of the 40 items for a C1-level
candidate, that panelist’s C1 score would be 32; so according to that panelist 32 items would
need to be answered correctly for a candidate to be considered at the C1 proficiency level of the
CEF. The average score across all panelists was computed, as was the median, standard
deviation, minimum score, and maximum score. The cross-panelist summary information was
posted and used to facilitate a discussion. Each panelist also had his or her own B1 and C1
TOEFL Structure scores. In general, the panelists with the minimum score and maximum score
were asked to begin the discussion, with other panelists encouraged to share their judgments. At
the conclusion of the group discussion, the panelists were given an opportunity to change their
overall B1 and C1 TOEFL Structure scores. Panelists were reminded that they could keep their
first-round scores; they were not obligated or expected to change their scores. Panelists then
recorded their second-round (final) judgments.
This same process of practice and discussion followed by “live” round-one judgments,
discussion, and a final (round-two) judgment, was followed for the 44 reading items and the 50
listening items of the TOEFL. (For the Listening section, panelists listened to the taped-recorded
speaking stimulus for each item.) The same process was also implemented for the TOEIC test
sections, 100 reading items and 100 listening items addressed by Panel 2.
Section II: Panel 1 Results—TSE, TWE, TOEFL
Panelists
Twenty-one experts served on the panel that focused on mapping scores from the Test of
Spoken English (TSE), the Test of Written English (TWE), and the Test of English as a Foreign
Language (TOEFL) onto the CEF. The English language specialist from ETS Europe, located in
Utrecht, The Netherlands, organized the recruitment of the experts. The experts were selected for
their experience with English language instruction, learning, and testing, and their familiarity
with the Common European Framework (CEF). They were also selected to represent an array of
European countries. Table 1 presents the demographic characteristics of the 21 panelists.
Appendix E provides the panelists’ affiliations.
9
Table 1
TSE, TWE, TOEFL Panel Demographics
Number Percent
Gender
Female
Male
11
10
52%
48%
Panelist Selection Criteria3
Teacher of English as a Second Language at TOEFL levels within a
Language School or within a Language Center of a University
18
Administrator of School/Program where TOEFL classes/equivalent taught 11
Assessment expert in field of English as a Second/Foreign Language 8
Member of Assessment Policy group for assessing Second/Foreign
languages within the Common European Framework
8
Country4
Belgium 1 5%
Germany 2 9%
Greece 1 5%
Hungary 3 14%
Italy 3 14%
Malta 1 5%
Netherlands 1 5%
Norway 1 5%
Poland 1 5%
Scotland 1 5%
Slovakia 1 5%
Slovenia 1 5%
Spain 2 9%
Sweden 1 5%
Turkey 1 5%
3 Some members met more than one criterion, so percentages are not reported. 4 Some members represented a region that they were not originally from.
10
The first-round and second-round section-level judgments for each of the tests are
presented in a series of tables (Tables G through K in the Appendix F). Each panelist’s
individual B1 and C1 cut scores are presented for each round, as are the cross-panel summary
statistics (mean, median, standard deviation, minimum, and maximum). Table 2 below presents
B1-level cross-panel statistics for each of the three tests.
Table 3 below presents the statistics for the C1-level judgments. Note that for the TOEFL
test, first the raw-score statistics are presented; raw scores are based on the panelists’ judgments
of the TOEFL items. The total TOEFL raw score is equal to the sum of the three section
scores—Structure, Reading, and Listening—multiplied by ten thirds. The scaled-score means
and medians are also presented. Scaled scores reflect the [Paper-based] TOEFL reporting scale.
The mean and median raw section-level scores were translated to scaled scores using a
conversion table. The total TOEFL scaled scores were computed from the sum of the section
scaled scores multiplied by ten thirds. The scaled scores represent the panel-recommended B1
and C1 cut scores for TOEFL. The presented TSE and TWE scores reflect the reporting scale for
these tests.
Table 2
First- and Second-Round B1-level Judgments: TSE, TWE, TOEFL
The B1 and C1 cut score means (and medians) changed slightly from round one to round
two as can be seen in Table 2 and 3. The variability (standard deviation) of the panelists’
judgments for both the B1 and C1 levels tended to decrease from round one to round two,
indicating a greater degree of panelist consensus; although there was a nominal increase in the
TSE variability.
The second-round mean scores may be accepted as the panel-recommended cut scores,
that is the minimum scores necessary to qualify for the B1- and C1-levels on the CEF. Thus the
TSE B1 and C1 cut scores are 45 and 555 respectively, for the TWE they are 4.56 and 5.57
respectively, and for the [Paper-based] TOEFL the scaled scores are 457 and 560 respectively.
Section II: Panel 2 Results—TOEIC
Panelists
Twenty-one experts served on the panel that focused on mapping the Test of English for
International Communication (TOEIC) onto the CEF. (Three panelists had also served on the
TSE, TWE, and TOEFL panel.) The Director of Development, TOEIC Programme, France, and
the language specialist from ETS Europe, organized the recruitment of the experts. The experts
were selected for their experience with English language instruction, learning, and testing in the
workplace, and their familiarity with the Common European Framework (CEF). They were also
5 The TSE Round 2 mean C1 judgment was 56 points, but the reporting scale is in increments of 5. Thus, the C1 cut score is 55. 6 The TWE Round 2 mean B1 judgment was 4.4, but the reporting scale is in increments of .5. Thus the B1 cut score is 4.5. 7 The TWE Round 2 mean C1 judgment was 5.7, but the reporting scale is in increments of .5. Thus the B1 cut score is 5.5.
12
selected to be representative of the European market. Table 4 presents the demographic
characteristics of the 21 panelists. Appendix G provides the panelists’ affiliations.
Table 4
TOEIC Panel Demographics Number Percent
Gender
Female 10 48%
Male 11 52%
Panelist Selection Criteria8
Teacher of English as a Second Language at TOIEC levels within a
Language School or Language Center of a University
13
Administrator of School/Program offering TOEIC classes/equivalent 16
Assessment expert in field of English as a Second/Foreign Language 8
Member of Assessment Policy group for assessing Second/Foreign
languages within the Common European Framework
6
Human Resources administrator responsible for language training 2
Country9
Belgium 1 5%
England 1 5%
France 3 14%
Germany 5 24%
Greece 1 5%
Hungary 4 19%
Ireland 1 5%
Italy 2 10%
Malta 1 5%
Poland 1 5%
Switzerland 1 5%
8 Some members met more than one criterion, so percentages are not reported. 9 Some members represented a region that they were not originally from.
13
The first-round and second-round section-level judgments for the TOEIC test are
presented in Appendix H Tables L (Listening) and M (Reading). Each panelist’s individual B1
and C1 cut scores are presented for each round, as are the cross-panel summary statistics (mean,
median, standard deviation, minimum, and maximum). Table 5 below presents B1-level cross-
panel statistics for the TOEIC; and Table 6 below presents the same for the C1-level statistics.
The TOEIC total scaled score means and medians were obtained from the sum of the section
level scaled scores (Listening and Reading), which came from a raw-to-scaled score TOEIC
conversion table. The scaled scores represent the panel-recommended B1 and C1 cut scores for
TOEIC.
Table 5
First- and Second-Round B1-level Judgments: TOEIC
Round 1 Round 2 B-1 Judgments
Mean Median SD Mean Median SD
TOEIC (raw scores) 114 115 15.0 112 114 9.5
TOEIC (scaled scores) 555 565 550 560
Note. Mean and median raw values are truncated.
Table 6
First- and Second-Round C1-level Judgments: TOEIC
Round 1 Round 2 C-1 Judgments
Mean Median SD Mean Median SD
TOEIC (raw scores) 166 166 6.6 167 165 7.1
TOEIC (scaled scores) 875 880 880 875
Note. Mean and median raw values are truncated.
The B1 and C1 cut score means (and medians) changed slightly from round one to round
two as can be seen in Tables 5 and 6. The variability (standard deviation) of the panelists’
judgments for the B1 level decreased from round one to round two, indicating a greater degree of
panelist consensus; the variability increased somewhat for the C1 level between the two rounds.
14
The second-round mean scores may be accepted as the panel-recommended cut scores,
that is the minimum scores necessary to qualify for the B1- and C1-levels on the CEF. Thus the
TOEIC B1 and C1 scaled cut scores are 550 and 880 respectively.
Conclusions
The purpose of this study was to arrive at Common European Framework (CEF) B1-level
and C1-level recommended cut scores on a series of language proficiency tests, thus creating an
operational bridge between the descriptive levels of the CEF and standardized tests of English
language proficiencies. Two panels, each of 21 experts, were invited to participate in the
standard-setting studies. The Benchmark Method (Faggen, 1994)—also referred to as the
Examinee Paper Selection Method (Hambleton, Jaeger, Plake, & Mills, 2000)—and a
modification of the Angoff Method (1971) were applied to the constructed-response questions
and selected-response questions respectively. Table 7 below summarizes the B1 and C1 cut
scores for the four tests.
Table 7
Summary of B1 and C1 recommended cut scores
Test B1 cut score C1 cut score
Test of Spoken English 45 55
Test of Written English 4.5 5.5
[Paper-based] TOEFL 457 560
TOEIC 550 880
15
References
Angoff, W.H. (1971). Scales, norms, and equivalent scores. In R.L. Thorndike (Ed.),
Educational Measurement (2nd ed., pp. 508-600). Washington, DC: American Council on Education.
American Educational Research Association, American Psychological Association, and National Council on Measurement in Education (1999). Standards for educational and psychological testing. Washington, DC: American Educational Research Association.
Cizek, G.J. (1993). Reactions to National Academy of Education report: Setting performance standards for student achievement. Washington, DC: National Assessment Governing Board.
Faggen, J. (1994). Setting standards for constructed response tests: An overview (ETS RM 94-19). Princeton, NJ: Educational Testing Service.
Hurtz, G.M., & Auerbach, M.A. (2003). A meta-analysis of the effects of modifications to the Angoff method on cutoff scores and judgment consensus. Educational and Psychological Measurement, 63, 584-601.
Mehrens, W.A. (1995). Methodological issues in standard setting for educational exams. In Proceedings of Joint Conference on Standard Setting for Large-Scale Assessments (pp.221-263). Washington, DC: National Assessment Governing Board and National Center for Education Statistics.
The Common European Framework in its political and educational context, p. 1. Retrieved March 2, 2004, (http://culture2.coe.int/portfolio/documents/0521803136txt.pdf.)
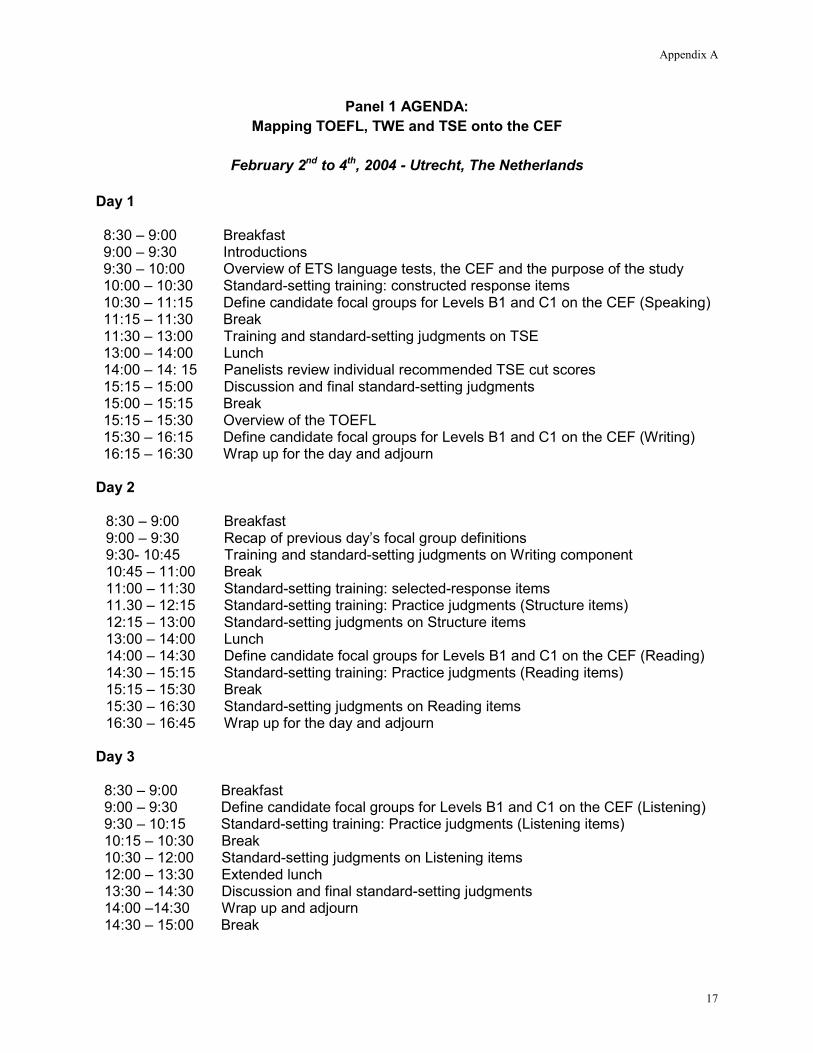
Panel 1 AGENDA: Mapping TOEFL, TWE and TSE onto the CEF
February 2nd to 4th, 2004 - Utrecht, The Netherlands
Day 1 8:30 – 9:00 Breakfast 9:00 – 9:30 Introductions 9:30 – 10:00 Overview of ETS language tests, the CEF and the purpose of the study 10:00 – 10:30 Standard-setting training: constructed response items 10:30 – 11:15 Define candidate focal groups for Levels B1 and C1 on the CEF (Speaking) 11:15 – 11:30 Break 11:30 – 13:00 Training and standard-setting judgments on TSE 13:00 – 14:00 Lunch 14:00 – 14: 15 Panelists review individual recommended TSE cut scores 15:15 – 15:00 Discussion and final standard-setting judgments 15:00 – 15:15 Break 15:15 – 15:30 Overview of the TOEFL 15:30 – 16:15 Define candidate focal groups for Levels B1 and C1 on the CEF (Writing) 16:15 – 16:30 Wrap up for the day and adjourn
Day 2
8:30 – 9:00 Breakfast 9:00 – 9:30 Recap of previous day’s focal group definitions 9:30- 10:45 Training and standard-setting judgments on Writing component 10:45 – 11:00 Break 11:00 – 11:30 Standard-setting training: selected-response items 11.30 – 12:15 Standard-setting training: Practice judgments (Structure items) 12:15 – 13:00 Standard-setting judgments on Structure items 13:00 – 14:00 Lunch 14:00 – 14:30 Define candidate focal groups for Levels B1 and C1 on the CEF (Reading) 14:30 – 15:15 Standard-setting training: Practice judgments (Reading items) 15:15 – 15:30 Break 15:30 – 16:30 Standard-setting judgments on Reading items 16:30 – 16:45 Wrap up for the day and adjourn
Day 3
8:30 – 9:00 Breakfast 9:00 – 9:30 Define candidate focal groups for Levels B1 and C1 on the CEF (Listening) 9:30 – 10:15 Standard-setting training: Practice judgments (Listening items) 10:15 – 10:30 Break 10:30 – 12:00 Standard-setting judgments on Listening items 12:00 – 13:30 Extended lunch 13:30 – 14:30 Discussion and final standard-setting judgments 14:00 –14:30 Wrap up and adjourn 14:30 – 15:00 Break
17
Appendix A
Panel 2 AGENDA: Mapping TOEIC onto the CEF
February 5th to 6th, 2004 – Utrecht, The Netherlands
Day 1
8:30 – 9:00 Breakfast 9:00 – 9:30 Introductions 9:30 – 10:00 Overview of TOEIC, the CEF and the purpose of the study 10:00 – 10:30 Standard-setting training: Selected response items 10:30 – 11:15 Define candidate focal groups for Levels B1 and C1 on the CEF (Listening) 11:15 – 11:30 Break 11:30 – 12:30 Standard-setting training: Practice judgments (Listening items) 12:30 – 13:30 Lunch 13:30 – 15:30 Standard-setting judgments on Listening items 15:30 – 15:45 Break 15:45- 16:30 Define candidate focal groups for Levels B1 and C1 on the CEF (Reading) 16:30 – 16:45 Wrap up for the day and adjourn
Day 2 8:30 – 9:00 Breakfast 9:00 – 9:30 Recap of previous day’s focal group definitions 9:30 – 10:15 Standard-setting training: Practice judgments (Reading items) 10:15 – 10:30 Break 10:30 – 12:30 Standard-setting judgments on Reading items 12:00 – 13:30 Extended lunch 13:30 – 14:30 Discussion and final standard-setting judgments (Reading & Listening
sections) 14:30 – 15:00 Wrap up and adjourn
18
Appendix B
Homework Task for Panel 1
Study to Map the Test of English as a Foreign Language, the Test of Spoken English, and the Test of Written English onto the Common European Framework
The role of the Common European Framework (CEF) is to foster mutual understanding across countries for users and language testers by providing a common language to describe the stages of language learning. Educational Testing Service is seeking to benchmark several of its English Language proficiency tests onto this framework, using an expert judgment standard-setting approach. At the study you will be familiarized with the tests, receive training in the standard-setting process, and have an opportunity to practice making judgments. During the study itself, the discussions will focus around the B1 and C1 levels of the CEF. In order to facilitate discussions, it is very important that you become familiar with the CEF in general and these two levels in particular. A PDF version of the Framework can be found at the following address: http://www.culture2.coe.int/portfolio/documents/0521803136txt.pdf The ETS tests that we will be benchmarking at the study address the four modalities of Speaking, Listening, Reading and Writing, and we will be discussing the characteristics of a B1 and C1 candidate by language modality. In the section below, relevant tables from the CEF have been identified by page number and title. Please review these CEF tables, paying close attention to the B1 and C1 levels. Highlight key words or phrases. Speaking: Page 58, Overall Oral Production; Page 59, Sustained Monologue (both tables); Pg 74, Overall Spoken Interaction; Pg 75, Understanding a Native Speaker Interlocutor; Pg 112, Vocabulary Range; Pg 112, Vocabulary Control; Pg 117, Phonological Control
Writing: Pg 61, Overall Written Production; Pg 62, Reports and Essays; Pg 83, Overall Written Interaction; Pg 112 Vocabulary Range; Pg 112, Vocabulary Control; Pg 114, Grammatical Accuracy; Pg 118, Orthographic Control
Listening: Pg 66, Overall Listening Comprehension; Pg 66, Understanding Conversation between Native Speakers; Pg 67, Listening as a Member of a Live Audience
Reading: Pg 69, Overall Reading Comprehension; Pg 70, Reading for Orientation; Pg 70, Reading for Information and Argument On the following sheet, at the top of the table, there is a global descriptor of a candidate with B1-level proficiencies and C1-level proficiencies. Having reviewed the relevant CEF tables, complete the attached sheet by briefly noting in your own words, in the space provided, the key characteristics or indicators from the CEF tables that describe an English Language learner who:
1. you believe is at the B1-level of proficiency 2. you believe is at the C1-level of proficiency
For example, considering first the tables that defining proficiencies related to Speaking, review each of the CEF tables listed above, and identify critical descriptors in the tables that help you distinguish between the B1 and C1 levels of proficiency. For example, you might note among other things that a B1 learner can provide a “straightforward description as a linear sequence of points” while a C1 learner can provide a “clear, detailed description.” Your notes, along with those of your colleagues, will form the starting point for discussion during the study itself.
Key Characteristics by Language Modality of a B1 and C1 English Language Learner
B1 global descriptor: Can understand the main points of clear standard input on familiar matters regularly encountered in work, school, leisure, etc. Can deal with most situations likely to arise whilst traveling in an area where the language is spoken. Can produce simple connected text on topics which are familiar or of personal interest. Can describe experiences and events, dreams, hopes and ambitions and briefly give reasons and explanations for opinions and plans.
C1 global descriptor: Can understand a wide range of demanding, longer texts, and recognize implicit meaning. Can express him/ herself fluently and spontaneously without much obvious searching for expressions. Can use language flexibly and effectively for social, academic and professional purposes. Can produce clear, well-structured, detailed text on complex subjects, showing controlled use of organizational patterns, connectors and cohesive devices.
Speaking
Writing
Reading
Listening
Please bring this completed sheet with you to the meeting February 2nd. Thank you.
20
Appendix B
Homework Task for Panel 2
Study to Map the Test of English for International Communication onto the Common European Framework
The role of the Common European Framework (CEF) is to foster mutual understanding across countries for users and language testers by providing a common language to describe the stages of language learning. Educational Testing Service is seeking to benchmark one of its English Language proficiency tests onto this framework, using an expert judgment standard-setting approach. At the study you will be familiarized with the test, receive training in the standard-setting process, and have an opportunity to practice making judgments. During the study itself, the discussions will focus around the B1 and C1 levels of the CEF. In order to facilitate discussions, it is very important that you become familiar with the CEF in general and these two levels in particular. A PDF version of the Framework can be found at http://www.culture2.coe.int/portfolio/documents/0521803136txt.pdf. The ETS test that we will be benchmarking at the study addresses the modalities of Listening and Reading, and we will be discussing the characteristics of a B1 and C1 candidate by language modality. In the section below, relevant tables from the CEF have been identified by page number and title. Please review these CEF tables, paying close attention to the B1 and C1 levels. Highlight key words or phrases. Listening: Pg 66, Overall Listening Comprehension; Pg 66, Understanding Conversation between Native Speakers; Pg 67, Listening as a Member of a Live Audience
Reading: Pg 69, Overall Reading Comprehension; Pg 70, Reading for Orientation; Pg 70, Reading for Information and Argument On the following sheet, at the top of the table, there is a global descriptor of a candidate with B1-level proficiencies and C1-level proficiencies. Having reviewed the relevant CEF tables, complete the attached sheet by briefly noting in your own words, in the space provided, the key characteristics or indicators from the CEF tables that describe an English Language learner who:
1. you believe is at the B1-level of proficiency 2. you believe is at the C1-level of proficiency
For example, considering first the tables that defining proficiencies related to Listening, review each of the CEF tables listed above, and identify critical descriptors in the tables that help you distinguish between the B1 and C1 levels of proficiency. For example, you might note among other things that a B1 learner can understand “straightforward factual information” while a C1 learner can understand “extended speech on abstract and complex topics.” Your notes, along with those of your colleagues, will form the starting point for discussion during the study itself.
Key Characteristics by Language Modality of a B1 and C1 English Language Learner
B1 global descriptor: Can understand the main points of clear standard input on familiar matters regularly encountered in work, school, leisure, etc. Can deal with most situations likely to arise whilst traveling in an area where the language is spoken. Can produce simple connected text on topics which are familiar or of personal interest. Can describe experiences and events, dreams, hopes and ambitions and briefly give reasons and explanations for opinions and plans.
C1 global descriptor: Can understand a wide range of demanding, longer texts, and recognize implicit meaning. Can express him/ herself fluently and spontaneously without much obvious searching for expressions. Can use language flexibly and effectively for social, academic and professional purposes. Can produce clear, well-structured, detailed text on complex subjects, showing controlled use of organizational patterns, connectors and cohesive devices.
Listening
Reading
Please bring this completed sheet with you to the meeting February 5th. Thank you
22
Appendix C
Table A: Panel 1 indicators of B1 and C1 Proficiency in Speaking
B1 Speaking
�� Can speak about familiar topics
�� Can convey an opinion
�� Sufficient structures/templates to express oneself
�� Clear and intelligible speech
�� Coping strategies for filling in gaps in language knowledge when speaking
�� Can extract/understand the major points from conversations, presentations
�� Understands speech when it is clear, standard language, well articulated
C1 Speaking
�� Detailed and complex range of subjects and language
�� Extensive range of lexis and idioms
�� Generally accurate, no significant errors
�� Speech is fluent and effortless
�� Can tailor language to be appropriate in a wide range of contexts and situations
�� Can vary intonation and stress in order to express shades of meaning
23
Appendix C
Table B: Panel 1 indicators of B1 and C1 Proficiency in Writing
B1 writing
�� Can write straightforward connected texts
�� Can respond to topics of personal interest and give simply formulated opinions about
factual (and abstract) information
�� Errors in everyday vocabulary, but they do not hinder understanding
�� Errors in grammar, but they do not hinder understanding
�� Intelligible spelling, punctuation and layout
C1 writing
�� Genre awareness – proper use of one genre
�� Register awareness – proper use of register
�� Appropriate style
�� Consistent point of view
�� Can manage abstractions
�� Clarity and precision of expression – coherence/cohesion, lexicon-grammar, idiomatic
structures/collocation
�� Ability to support, expand and conclude complex arguments
�� Layout, paragraphing and punctuation consistent and appropriate
�� Flexibility, effectiveness and efficiency of language choices (allusions, etc.)
24
Appendix C
Table C: Panel 1 indicators of B1 and C1 Proficiency in Listening
B1 Listening
�� Can process simple conversations
�� Understand standard familiar accent, clear speech
�� Comprehend straightforward information
�� Can pick out main points of message
�� Understands details on familiar topics
C1 Listening
�� Can follow most lectures, broadcasts, debates
�� Can decide what’s relevant
�� Can identify attitudes and implied information
�� Can understand nonstandard accents and speaking with some sound interference
�� Can understand idioms and colloquial speech
�� May not be able to understand everything in culturally or context-related situations (e.g.,
sitcoms)
25
Appendix C
Table D: Panel 1 indicators of B1 and C1 Proficiency in Reading
B1 Reading
�� Can understand straightforward factual texts on familiar subjects
�� Can scan for facts and details
�� Can skim for gist
�� Can follow lines of argument and identify main conclusions in argumentative texts
�� Can understand and identify clearly signaled, explicitly stated information
�� Can recognize and comprehend basic genres
C1 Reading
�� Can comprehensive detailed, lengthy texts outside one’s field
�� Can understand the main points, finer points and details in a wide variety of professional
and academic texts
�� Can scan newspapers, articles and reports on a wide range of topics and decide what is
relevant for further detailed reading
�� Can identify attitudes and implied information
26
Appendix C
Table E: Panel 2 indicators of B1 and C1 Proficiency in Listening
B1 Listening
�� Can understand:
o Straightforward, factual information
o Standard speech (everyday conversation) in standard dialect/ accent, clearly
articulated
�� Can follow main points of discussion between native speakers
�� Can follow / understand clear, concrete instructions presented in a structured manner
�� Can follow a speech/ lecture on a familiar subject
C1 Listening
�� Can understand abstract and complex and technical topics – beyond own field 85%
�� Can understand:
o Non-standard usage
o Unpredictable situations/ context
�� Can understand fast native speaker speech in films/ newscasts/ lectures
�� Can understand
o Cultural contexts
o Implicit meanings
o Implied relationships
�� Can identify levels of formality with relative ease
�� Can understand extended / lengthy speech in most professional contexts
27
Appendix C
Table F: Panel 2 indicators of B1 and C1 Proficiency in Reading
B1 Reading
�� Can understand straightforward factual texts on familiar subjects
�� Scans long texts on everyday material and extracts main points
�� Can recognize explicit line of argument in topic / issue, but not in finer detail
�� Can identify main conclusions in logically organized texts
C1 Reading
�� Can understand in detail lengthy/ complex, related/ unrelated texts
�� Can differentiate between key and subtle points (weigh information)
�� Requires occasional support/ re-reading in lengthier, more technical texts
�� Can scan quickly for specific/ implicit information
28
Appendix D
Test of Spoken English ID# _____________________ Round 1 Judgments
Item Circle the score that a Level B1 candidate would
achieve on each item Circle the score that a Level C1 candidate would
Mean raw score (truncated) 23 41 23 41 Median raw score (truncated) 23 41 23 41 Standard Deviation 4.8 2.0 3.7 1.5 Minimum raw score 10 36 10 38 Maximum raw score 32 44 28 44 Mean scaled score 46 56 46 56 Median scaled score 46 56 46 56
37
Appendix G
Panel 2 Standard-Setting Participants
Name Affiliation
Abdi Kazeroni Université de Technologie de Compiègne, France
Brunella Casucci Belluomini Language Data Bank, Italy
Hajdu Csaba M-Prospect Language School, Hungary
Douglas Stevenson Memori-X Language Lab, Budapest, Hungary
Volker Gehmlich University of Applied Sciences at Osnabrueck, Germany
Gina Noonan Institute of Technology, Carlow, Ireland
Charalambos Kollias Business English Instructor, Greece
Isabelle Mangini-Nennot Language Training Supervisor of EADS, France
Jan van Maele Group T, Belgium
Hegedus Judit International Business School, Hungary
Klaus Oelschlegel Georg-Simon-Ohm Fachhochschule, Nürnberg, Germany
Lucia Katona Institute for Foreign Languages, Hungary
Lynn Strebel AKAD Language and Culture, Switzerland
Mary Petersen Logik Sprachtraining, Germany
Maurice Cassidy International House, UK
Roberta Farber The British School of Pisa, Italy
Sue Luther Georg-Simon-Ohm University of Applied Sciences, Nürnberg, Germany
Vera Dickman Ecole Nationale Superieure des Telecommunications, Paris, France
Wolfgang Rothfritz University of Applied Sciences at Suedwestfallen, Germany
Zbigniew Szczepanczyk Global Village, Kielce, Poland
Martin Musumeci Academic Division, MABEC Support Unit, University of Malta