1 Markus, T A ‘The role of building performance measure- ment and appraisal in design method’ in G Broadbent and A Ward (eds) Design Methods in Architecture, Lund Humphries, London (1969) 2 Maver, T W ‘Appraisal in the building design process’ in GT Moore (ed) Emerging Methods in Environmental Design and Planning, MIT Press, Cam- bridge, MA (1970) www.elsevier.com/locate/destud 0142-694X/01 $ - see front matter Design Studies 22 (2001) 211–232 PII: S0142-694X(00)00026-0 211 2001 Elsevier Science Ltd All rights reserved Printed in Great Britain Mapping the conceptual design activity of interdisciplinary teams Simon Austin, Department of Civil and Building Engineering, Loughborough University, Loughborough, Leicestershire, LE11 3TU, UK John Steele, Sebastian Macmillan, Paul Kirby and Robin Spence, The Martin Centre for Architectural and Urban Studies, Department of Architecture, University of Cambridge, 6 Chaucer Road, Cambridge, CB2 2EB, UK The conceptual design phase of any project is, by its very nature, a vibrant, creative and dynamic period. It can also be disorganised with much backtracking accompanying the exchange of information between design team members. The transfer of information, ideas and opinion is critical to the development of concepts and as such, rather than being recognised as merely a component of conceptual design activity, it needs to be understood and, ultimately, managed. This paper describes an experimental workshop involving fifteen design professionals in which conceptual design activity was tracked, and subsequently mapped, in order to test and validate a tentative design framework (phase and activity model). The nature of the design progression of the various teams is captured and analysed, allowing a number of conclusions to be drawn regarding both the iterative nature of this phase of design and how teams of professionals actually design together. q c 2001 Elsevier Science Ltd. All rights reserved. Keywords: conceptual design, design process, interdisciplinary, design activity, teamwork M any writers in the field of design research have produced maps and procedures for negotiating what has become commonly known as the design process. Markus 1 and Maver 2 , French 3 , Archer 4 , Pugh and Morley 5 , Pahl and Beitz 6 and Cross 7 are just some of the many writers, from across the architectural and engineering design domain, who have attempted to generate standardised design procedures. Yet it is disturbing that, although the work of these many writers has been utilised with varying degrees of success in a number of engineering
Transcript
1 Markus, T A ‘The role ofbuilding performance measure-ment and appraisal in designmethod’ in G Broadbent and AWard (eds) Design Methods inArchitecture, Lund Humphries,London (1969)2 Maver, T W ‘Appraisal in thebuilding design process’ in G TMoore (ed) Emerging Methodsin Environmental Design andPlanning, MIT Press, Cam-bridge, MA (1970)
www.elsevier.com/locate/destud0142-694X/01 $ - see front matterDesign Studies22 (2001) 211–232PII: S0142-694X(00)00026-0 211 2001 Elsevier Science Ltd All rights reserved Printed in Great Britain
Mapping the conceptual designactivity of interdisciplinary teams
Simon Austin,Department of Civil and Building Engineering,Loughborough University, Loughborough, Leicestershire, LE11 3TU,UKJohn Steele, Sebastian Macmillan, Paul KirbyandRobin Spence,TheMartin Centre for Architectural and Urban Studies, Department ofArchitecture, University of Cambridge, 6 Chaucer Road, Cambridge,CB2 2EB, UK
The conceptual design phase of any project is, by its very nature, avibrant, creative and dynamic period. It can also be disorganised withmuch backtracking accompanying the exchange of information betweendesign team members. The transfer of information, ideas and opinion iscritical to the development of concepts and as such, rather than beingrecognised as merely a component of conceptual design activity, it needsto be understood and, ultimately, managed. This paper describes anexperimental workshop involving fifteen design professionals in whichconceptual design activity was tracked, and subsequently mapped, inorder to test and validate a tentative design framework (phase andactivity model). The nature of the design progression of the variousteams is captured and analysed, allowing a number of conclusions to bedrawn regarding both the iterative nature of this phase of design andhow teams of professionals actually design together.qc 2001 ElsevierScience Ltd. All rights reserved.
Many writers in the field of design research have produced mapsand procedures for negotiating what has become commonlyknown as the design process. Markus1 and Maver2, French3,
Archer4, Pugh and Morley5, Pahl and Beitz6 and Cross7 are just some ofthe many writers, from across the architectural and engineering designdomain, who have attempted to generate standardised design procedures.Yet it is disturbing that, although the work of these many writers has beenutilised with varying degrees of success in a number of engineering
3 French, M J EngineeringDesign: The Conceptual StageHeinemann Educational Books,London (1971)4 Archer, B L ‘Systematicmethod for designers’ in NCross (ed) Developments inDesign Methodology, Wiley,Chichester (1984) pp 57–825 Pugh, S and Morley, I ETowards a Theory of TotalDesign Design Division, Univer-sity of Strathclyde, UK (1988)6 Pahl, G and Beitz, W Engin-eering Design: A SystematicApproach The DesignCouncil/Springer Verlag,London/Berlin (1988)7 Cross, N Engineering DesignMethods: Strategies for ProductDesign John Wiley and Sons,New York (1989)8 Austin, S, Baldwin, A, Li, Band Waskett, P ‘Analyticaldesign planning technique: amodel of the detailed buildingdesign process’ Design Studies20(3) (1999) 279–2969 Austin, S, Baldwin, A, Li, Band Waskett, P ‘Analyticaldesign planning technique forprogramming the building designprocess’ Proceedings of theInstitution of Civil Engineers,Structures and Building 134(2)(1999) 111–11810 BAA plc The Project Pro-cess: A Guide to the BAA ProjectProcess Internal publication BAAplc, London Aug (1995)11 Kagioglou, M et al A Gen-eric Guide to the Design andConstruction Process ProtocolThe University of Salford (1988)12 Plan of Work for DesignTeam Operation—Royal Instituteof British Architects, RIBA Lon-don (1969)
212 Design Studies Vol 22 No. 3 May 2001
domains, the construction industry has shown little interest in defining aprocedure aimed at improving the efficiency of their design activity. Thisis not to say that the building industry has failed to benefit from theimplementation of standardised procedure altogether, as the constructionphase of any building project is planned thoroughly in a bid to improveefficiency and reduce time spans. So why has there been little transfer ofthis philosophy to the activity of design?
The lack of appreciation of the rewards that can be gained from planningdesign activity seems to owe much to the fact that design and constructionare often perceived as being mutually exclusive activities. This is to saythat the activity of designing was undertaken by a discrete group of individ-uals that would hand over their work to the construction engineers, at whichpoint their input to the project would end. Thus, the activities of designand construction became segregated. This resulted in the common miscon-ception that design could be managed without the help of specific planningand management tools, whilst in construction there were clearer and moreeasily realisable benefits from improved planning8.
In today’s lean construction environment this myth is being dispelled andit has become generally recognised that efficiency and client satisfactioncan be improved if design activity is planned and managed. Thus, methodssuch as the Analytical Design Planning Technique (ADePT) have beendeveloped, which have focused to date on the development of models ofthe detailed design phase9 and are currently being applied within the con-struction industry. Through the collaborative research work of a numberof academic institutions, construction organisations and clients, attemptshave been made to closely integrate all the phases involved in bringing abuilding to a customer. This research has resulted in the production ofseveral standardised process maps, the most notable of which are the BAAProject Process10 and the Process Protocol11, which seem to be convergingtoward a similar format. However, at present the RIBA Plan of Work forDesign Team Operation12, which was developed some 30 years ago,remains the most widely used model of building design, although it iscurrently under revision in the light of these latest developments.
1 Research focus
1.1 Demystifying the design processThe areas of building industry research documented above have focusedon improving understanding of the entire design process but investigationshave also been undertaken which concentrate on the individual stages ofthe process. It could be argued that these more detailed analyses are of
13 Minneman, S L The socialconstruction of a technicalreality: empirical studies of groupengineering design practice.PhD dissertation Stanford Uni-versity, USA (1991)14 Hales, C Analysis of theengineering design process in anindustrial context. PhD thesisCambridge University Press(1987)15 Blessing, L T M A ProcessBased Approach to ComputerSupported Engineering DesignBlack Bear Press Ltd, Cam-bridge, UK (1996)16 Hubka, V Principles ofEngineering DesignButterworths and Co, Oxford(1982)17 Macmillan S, Steele J,Austin S, Spence R and KirbyP ‘Mapping the early stages ofthe design process—a compari-son between engineering andconstruction’ Proceedings of12th International Conference onEngineering Design (ICED ’99)Munich, Germany (1999)
213Mapping the conceptual design activity of interdisciplinary teams
more direct relevance to the industry as they de-mystify the intricacies ofdesign activity at a deeper and more detailed level. Moreover, it is onlyby understanding the activities involved within the individual stages ofdesign that the interfaces between stages of work can be understood andsubsequently managed.
The existing systematic design procedures advocated by the engineeringresearchers have rarely been subjected to any realistic evaluation in prac-tice13–15. Nevertheless, it is still claimed that their use will lead to betterquality artefacts and/or shorter time to design completion13. In the fewinstances that the earlier models have been tested on live projects theirphases account for only a fraction of the actual activity that occurs14,15.For example, when the systematic design model of Pahl and Beitz16 wassubjected to a detailed investigation in a live design project in practice,the activities that were accounted for by the model made up only 47% ofthe design team work14. The more recently developed models of the designprocess, such as those generated using ADePT, have proven significantlymore robust, with models of the detailed design phase proving to be 90%generic in applications to date8. Testing of Hubka’s16 model of engineeringdesign failed to validate claims that design cycle time or artefact qualitywere positively affected by the use of systematic procedure13.
The Mapping the design process during the conceptual phase of buildingprojects(MDP) research project, currently being undertaken at the Univer-sity of Cambridge, with support from the Department of Civil and BuildingEngineering, Loughborough University, is investigating the most vibrantbut disorganised of the phases, namely conceptual design. This paperdescribes the testing of a preliminary conceptual design framework (phaseand activity model) that has been developed over the course of this project.An experimental session was held in a bid to both verify the frameworkstructure and ensure that its components were subjected to rigorous testingin a live design environment. It also allowed the research team to monitorand subsequently analyse how design professionals undertake collaborativedesign activity.
1.2 Development of the conceptual design frameworkAn extensive literature search, which involved the collection, and sub-sequent analysis, of the existing design process models, enabled a directcomparison to be made between the phases outlined in these variousdescriptions, the details of which are provided elsewhere17. In addition tothis, two further sources of information were added. First, several casestudy investigations, involving systematic interviewing and archive analy-sis, were undertaken to gain an understanding of the activities and phases
18 Austin S, Steele J, Macmil-lan S, Kirby P and Spence R‘Using training workshops tomap interdisciplinary team work-ing’. Proceedings of CharteredInstitute of Building ServicesEngineers National Conference1999, Harrogate, UK (1999)19 Macmillan, S, Steele, J,Austin, S, Spence, R andKirby, P ‘Development and veri-fication of a generic frameworkfor conceptual design’ DesignStudies Vol 22 (2000) 169–191
214 Design Studies Vol 22 No. 3 May 2001
Figure 1 The preliminary conceptual design framework
performed over the conceptual phase of various building industry projects.Second, a previous workshop that had been held, the form of which mirrorsthat of the workshop described here, enabled the phases of design pro-gression over a concentrated period to be recorded and analysed18. Thesubsequent combination of these three sources of information allowed apreliminary conceptual design framework (Fig. 1) to be developed for test-ing19.
2 Overview of the workshop
2.1 Workshop descriptionThe workshop was held over a two-day period and involved delegatesfrom a number of building design industry organisations, representing theindustrial collaborators from the MDP research project. The workshop hadthree major aims: to test the applicability and validity of a preliminarymodel of the conceptual design phase; to provide an additional opportunityto monitor interdisciplinary design teams in practice; and to test a numberof ‘Team Thinking Tools’ that had been identified during the course ofthe research.
The session involved 15 design professionals in total, with each of thecollaborating organisations being represented. The 15 delegates were div-ided into three teams, each team comprising five designers, with eachorganisation being represented once in every team. This ensured that eachteam had a full complement of the relevant building design disciplines,namely architects, building services engineers, civil/structural engineers.This also reflected the way in which teams are newly formed in practice.
Two of the teams were designated as test groups and the third as the control
20 Macmillan S, Steele J,Austin S, Spence R and KirbyP (1999) ‘Testing design tools inan interdisciplinary designenvironment’ Working paper,The Martin Centre, University ofCambridge, UK
215Mapping the conceptual design activity of interdisciplinary teams
group. The two test groups were provided with a copy of the preliminaryconceptual design framework (shown in Fig. 1) and tutored on its termin-ology and structure. One team was given the option to follow it while theother team was asked to follow it. The two teams were then introduced tothe brief and told to begin the exercise. The third team was asked to solvethe design problem without the framework model.
Each team was provided with a booklet of Team Thinking Tools (designtechniques or methods such as brainstorming and mind mapping) whichthey were asked to use during the exercise. A brief presentation of thesetools was provided, which gave the delegates an insight into how to applyand use the tools and which particular periods of design each tool wasdeveloped to assist. Details of this component of the investigation are pro-vided elsewhere20.
2.2 Workshop formatEach team was asked to design an adaptable and flexible modular windowsystem that could be used to reclad existing office buildings. The briefstated that the system should be a manufactured product, available virtuallyfrom stock, and should enhance the environmental performance of thebuilding. A number of design requirements and parameters were outlined,which provided the teams with some initial constraints. A half-hour presen-tation was given to introduce the cladding exercise, which comprised awide-ranging and well illustrated review of the function and history of thewindow. This presentation drew examples of many types and forms ofwindow and introduced a number of passive environmental conditioningstrategies such as the use of Brise-soleil and low emissivity glazing.
Upon completion of the exercise, the individual team members were askedto complete questionnaires. Teams A and B completed questionnaires relat-ing to the design framework model, the respective team performance, andthe usefulness of the design techniques. Team C completed the lattertwo only.
During actual design activity, a member of each team recorded the phasesof design as they were being undertaken and the design activities perfor-med. This recording was undertaken at five-minute intervals throughoutthe duration of the exercise. To verify and support this self-assessment,members of the research group monitored each team and made notes ofboth the time and activities being observed. This provided additional infor-mation regarding the design activity and also acted as a means of verifyingthe self-assessment records. The information provided by these question-naires, combined with the observations made during the course of the
216 Design Studies Vol 22 No. 3 May 2001
design activity, allowed a number of preliminary findings to be drawn.Additionally, the data gathered during the session allowed patterns of eachteam’s design progression to be generated.
Once finished, the respective concept proposals were presented in a 20-minute pin-up. Although it was not a pre-requisite, each team memberpresented a section of the proposal. Three independent experts critiquedthe proposals and ranked them with respect to the ease of which they couldbe subsequently developed into workable solutions that satisfy the brief.
3 Workshop findingsThis particular design problem, although appearing to be relatively simple,has the advantage of requiring input from each of the design disciplines.Those teams that realise the need for integration of the disciplinary issuesinto simple systems tend to be most successful. Each of the teams producedappropriate concepts that they believed could be subsequently developedinto working systems. However, the manner in which the teams workedand the nature of the proposals produced were quite different.
3.1 Observation and team member perception
3.1.1 Team ATeam A was given the option to use the framework as a guide to the designstages but were not encouraged to use it as a systematic procedure. Theteam spent 305 minutes designing over the course of the workshop. Fig.2 provides a detailed outline of the activities undertaken and the time spentwithin each activity and phase of the framework.
Figure 2 The design activity of team A
217Mapping the conceptual design activity of interdisciplinary teams
Team A followed the design framework to some extent but jumpedbetween activities. However, although the iteration was indiscriminate inmanner, a noticeable sequential pattern is apparent which suggests that theframework has actually been followed, albeit fairly loosely. It is importantto note that a reasonable period of design time, approximately 1 hour,could not be classified within the proposed framework.
Team A produced a ‘kit of parts’ solution to the problem, which compriseda number of interchangeable, standardised components from which a clientcould select the most applicable arrangement. The phrase ’kit of parts’ notonly describes the solution but also the way in which the team worked.The group did not interact well. Instead, each member looked at a differentelement of the problem, with these partial solutions being brought togetherat the end. There was little, if any, integration between the disciplinesdespite the fact that the disciplinary components were connected.
The team leader (who had assumed this role) appeared to guide the groupthrough the design activity without agreeing this direction with the remain-der of the team. It was commented that ‘the design appeared to be a vehiclefor the leader’s enthusiasms’. Later, the leader commented that he hadtaken control because the team was too timid as a group, with no one beingprepared to take the lead role. As such, the leader progressed through theactivities without consulting the other team members.
This opportunistic design progression led to discontentment between mem-bers of the team, and resulted in a confrontational atmosphere and lack ofcohesion between individuals. To this end the team in their own words‘sometimes lacked direction’, with a ‘split in focus of team members’ andas a result, the team members ‘grew frustrated’. One team member statedthat the lack of common agreement on how to progress was the basis ofthe team’s problems. Even though the team discussed the lack of cohesionfelt by some of the design members at the start of the second day; no actionwas undertaken to address it. However, the dissatisfied team members feltthat ‘the design collaboration improved’ to some extent, thus they boughtback into the design progression. However, there were ‘still undercurrentsof a lack of collaboration’ and as such, team members soon fell back intotheir disciplinary sub-teams as the work progressed. The divisionsremained apparent throughout the exercise. It was also noted that therewas a clash of personalities within the team; a factor that did not aid thesituation.
Team members reported that the framework could guide the design processif the entire team would agree to follow it (findings would suggest that
218 Design Studies Vol 22 No. 3 May 2001
agreement on any procedure would improve team interaction, collabor-ation, and resultantly, team effectiveness). The early jumping betweenactivities did not help the team, making the individual members frustrated.Interestingly, it was stated that because the framework was not followedin sufficient detail, being referred to after the fact, it was not used as itshould have been e.g. as a guiding principal. Additionally, it was statedthat ‘someone needed to catch the process, as [the team] tended to jumparound the process rather than use it as a [sequential] process’. Severalteam members agreed that concerns were not aired at an early enough timein the process to enable the team to make changes and remedy the situation.
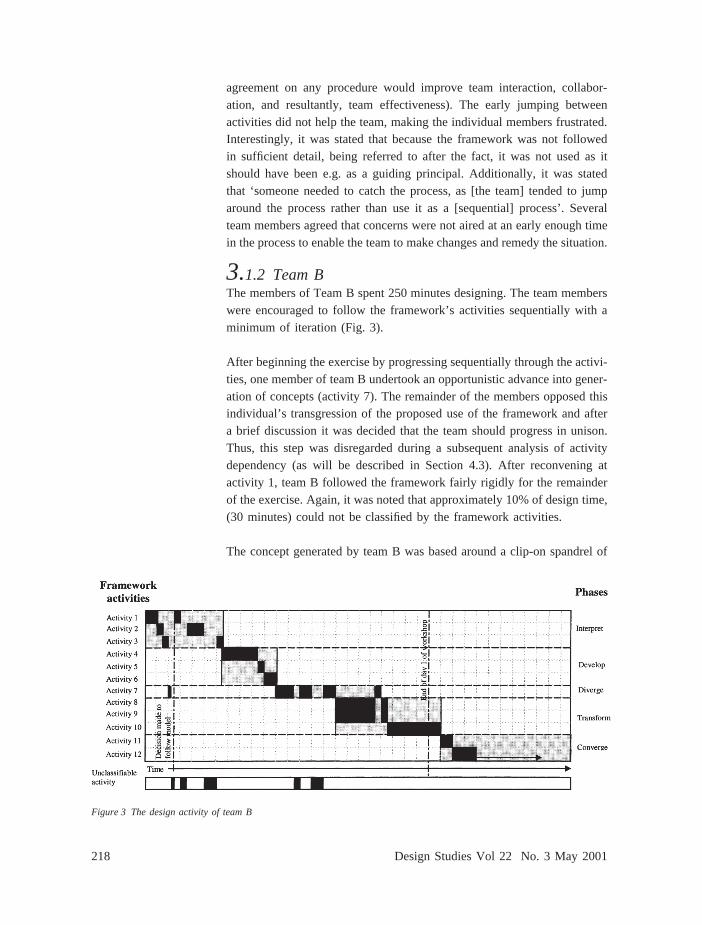
3.1.2 Team BThe members of Team B spent 250 minutes designing. The team memberswere encouraged to follow the framework’s activities sequentially with aminimum of iteration (Fig. 3).
After beginning the exercise by progressing sequentially through the activi-ties, one member of team B undertook an opportunistic advance into gener-ation of concepts (activity 7). The remainder of the members opposed thisindividual’s transgression of the proposed use of the framework and aftera brief discussion it was decided that the team should progress in unison.Thus, this step was disregarded during a subsequent analysis of activitydependency (as will be described in Section 4.3). After reconvening atactivity 1, team B followed the framework fairly rigidly for the remainderof the exercise. Again, it was noted that approximately 10% of design time,(30 minutes) could not be classified by the framework activities.
The concept generated by team B was based around a clip-on spandrel of
Figure 3 The design activity of team B
219Mapping the conceptual design activity of interdisciplinary teams
limited use in terms of either aesthetics or shading. The design conceptwas generally undeveloped, with the concept tending to re-create the typeof environmental problem that it was attempting to remedy.
The crudity of the solution seemed to be the result of a mistaken beliefthat the problem was simple. Generally, a high level of cohesion was appar-ent within the group but, though the team interacted well throughout, theresulting concept was judged fairly poor by the expert assessors.
The team members discussed their roles in advance of the design activityand, with one exception, were happy about their positions, with individualsbeing flexible in their approach to forwarding ideas across the boundariesof the disciplines. The objector, whose background was in project manage-ment, felt that the leader had assumed sole responsibility for the position,and had not let the other team members become involved in progressingthe design. However, on reflection, no other member of the team statedthat they had wanted to ‘lead’ the design at any time before, during orafter the exercise. In fact, one individual stated that ‘the group workedtogether very well right from the start, but became even more organisedas time went on’.
It was suggested that the team selection is a key factor in the success ofdesign activity. One suggestion for getting the interaction element correctwas to let the team members pick themselves. One team member felt thatthere was too much interest in details, rather than in ensuring that thestrategy/concept was defined.
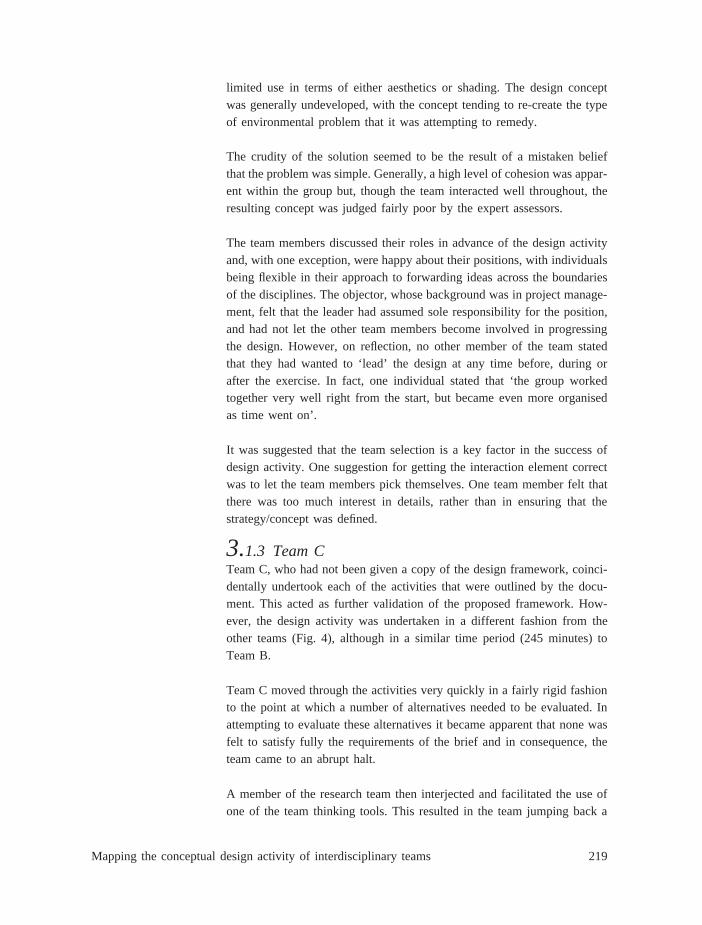
3.1.3 Team CTeam C, who had not been given a copy of the design framework, coinci-dentally undertook each of the activities that were outlined by the docu-ment. This acted as further validation of the proposed framework. How-ever, the design activity was undertaken in a different fashion from theother teams (Fig. 4), although in a similar time period (245 minutes) toTeam B.
Team C moved through the activities very quickly in a fairly rigid fashionto the point at which a number of alternatives needed to be evaluated. Inattempting to evaluate these alternatives it became apparent that none wasfelt to satisfy fully the requirements of the brief and in consequence, theteam came to an abrupt halt.
A member of the research team then interjected and facilitated the use ofone of the team thinking tools. This resulted in the team jumping back a
220 Design Studies Vol 22 No. 3 May 2001
Figure 4 The design activity of team C
number of stages and recommencing their design activity from an earlierphase (see double iteration in Fig. 4). Again, a considerable amount oftime (40 minutes) was not classifiable.
Although the team’s concept design was not quantified fully, it was judgedto be imaginative and to have recognised the areas of incompatibilitybetween sub-elements of the problem. It was apparent that the team haddifferentiated between interconnected and unconnected characteristics.Thus, the solution was fairly simple, while still addressing the requirementsof the brief.
The team highlighted their frustration at not having any certain directionduring the design exercise. The group attributed this to not having beengiven, nor defining for themselves, a process to follow prior to commenc-ing the design activity. As such, they approached the design activity in anad hoc manner; a factor that the team believed led to a ‘general lack ofdirection’ and caused frustration. Even so, the team generally followedthe activities outlined in the conceptual framework that the other teamswere given.
One team member stated that the team ‘often lacked guidance and littleprocess [was] used’. He felt that the team avoided confrontation and gener-ally agreed on the way forward, but ‘[they] stumbled forward in designterms’. Additionally, it was felt that there was a need to capture and recordideas as they came; a lack of this combined with a lack of an agreed processcaused frustration. However, despite some individuals having doubts about
221Mapping the conceptual design activity of interdisciplinary teams
the potential contribution that they could provide in the early stages of theactivity, a full team effort did occur later in the process.
Another team member held a similar view, stating that ‘at the beginningof the exercise the team members did not really gel’. He felt that thisinitially caused different stances to be taken by individuals during the ideadevelopment stages. This individual suggested that the problem would havebeen overcome if they had had a process, either imposed or self generated,with which to harmonise their activity.
3.1.4 Critique of the three schemesA critique was held at the end of the design period. Of the three teams,team C was adjudged to have produced the best proposal. This appearedto owe much to the team sharing the leadership, with each member tendingto advise and then ask for comment, instead of simply dominating the flowof work. The negative aspect of this was the occasional lack of leadership,with no single member being willing to take the lead in times of dispute(the group was too polite to allow that to happen). The key to the successof the proposal seems to be that they had a wide knowledge base and werewilling to listen to one another.
3.2 Questionnaire responsesThe information gathered from the design framework and team perform-ance questionnaires is shown below. A five point Likert scale was appliedwith 5 and 1 representing the maximum positive and negative responsesrespectively and 3 as neutral. Figs. 5 and 6 provide an overall teamresponse to each question. The team responses have been plotted againstone another to allow a comparison to be drawn.
On average team B scored their performance higher than teams A and Cand in all cases positively. Teams C and A rated themselves similarly to
Figure 5 Team performance questionnaire responses by team
222 Design Studies Vol 22 No. 3 May 2001
Figure 6 Design framework
questionnaire responses by
team
team B for their group member contribution and for the way their individ-ual ideas had been included in the design sketches respectively. The latterrating undoubtedly owes much to the fact that team A generated a kit-of-parts solution, which included the ideas of all its members, rather thandeciding to develop a single concept.
Only team A responded negatively to any of the questions—these relatedto group organisation and individual’s satisfaction with the way the teamused its time.
Teams A and B found the framework and its terminology to be equallyunderstandable. However, the responses of team A averaged between 0.5and 1.5 points lower than those of team B; a differential which was alsoapparent in the responses to the team performance questionnaire. Thisfinding appears to suggest that there is a connection between the mannerin which the framework is utilised and individual perception of team per-formance.
4 Analysis of data
4.1 Activity and phase durationTable 1 provides a breakdown of the percentage of time spent by the teamson each of the activities and phases (represented graphically in Fig. 7).
There is little consistency in the time spent on each of the activities(average co-efficient of variation=42%). However, there was significantlyless variability in the time spent on each phase (average co-efficient of
223Mapping the conceptual design activity of interdisciplinary teams
Table 1 Percentages of time spent on each design activity and phase
% of design time spent in seciton of the framework
Phase Activity Team (A) Team (B) Team (C)
Interpret 1 Specify the need 6 21 7 22 9 212 Assess functional 7 11 6
principlesTransform 8 Transform and 3 5 14 32 14 16
combine solutionprinciples
9 Select suitablecombinations
10 Firm up into 2 18 2concept variants
Converge 11 Evaluation and 10 10 4 4 16 16choice of
alternatives12 Improve details Not included in comparison
Time unclassified by phases of model 21 10 17Total spent in phases 1–6 42 36 31Total spent in phases 7–12 37 54 52
variation=15%), particularly during phase 1 (Interpret: 2%) and phase 3(divergence: 8%). However, it is unclear without further investigationwhether this correlation has any significance in improving understandingof conceptual design activity.
Figure 7 Time spent on
each design activity and
phase
224 Design Studies Vol 22 No. 3 May 2001
4.2 Unclassifiable activityAs can be seen from Table 1, between 10% and 21% of the time spentdesigning could not be classified within the preliminary conceptual designframework model. This time was spent on a number of activities:
O Introductions by team members.O Individuals outlining their roles within the design team.O The pooling of knowledge—team members giving a synopsis of their
knowledge of window system design and precedent cases.O Planning and discussing the process of design to be followed.O The development of a shared understanding of the requirements of
the system.O The generation of programmes to allocate time periods to particular
activities.O Identifying interconnected and unconnected elements of the design
problem and solution.O Discussion of problems regarding the performance of the team
Upon further analysis of this final point it became apparent that discussionswere generally based on five specific issues:
O Working as a team (initial introductions, roles, responsibilities: defin-ing teamwork)
O Maintaining interaction between membersO Lack of communicationO Team dynamics (attempts to maintain collaboration between team
members)O Redirecting the team to maintain efficiency
To this end, it was recognised that one of the main elements missing fromthe design framework is the need to recognise and manage team mainte-nance. This needs to be addressed and accounted for in a realistic modelof conceptual design activity.
4.3 Dependency across activitiesThe patterns of actual design progression of the teams through the frame-work activities (Figs. 2–4) could be the result of one of two things: (i)there is some form of dependency between those activities; or (ii) the teampicked the next activity to be addressed at random, simply because theyrecognised that it had to be visited at some point during the process. How-ever, if the latter eventually proves to be true then present attempts tounderstand conceptual design are doomed to fail. For the purposes of thisresearch it has been assumed that design progression has an underlyingrationale, and it is this that the authors seek to discover and, ultimately,support.
21 Steward, D Analysis andManagement: Structure, Strat-egy and Design Petrocelli Books,Princeton, NJ (1981)22 McCord K and Eppinger S‘Managing the integration prob-lem in concurrent engineering’Working paper, MIT SloanSchool of Management, WP3594-93 (1993)23 Rogers J and Padula S ‘Anintelligent advisor for the designmanager’ NASA TechnicalReport, TM-101558 (1989)24 Huovila P, Koskela L, Lau-tanala M and Tanhuanpaa V‘Use of the design structurematrix in construction’ in Pro-ceedings of 3rd InternationalWorkshop on Lean Construction,Albuquerque (1995)25 Austin S, Baldwin A, Li Band Waskett P ‘Development ofthe ADePT methodology: aninterim report on the Link IDAC100 Project’ Department of Civiland Building Engineering,Loughborough University, UK(1998)
225Mapping the conceptual design activity of interdisciplinary teams
Figure 8 DSMs representing design progression of team A
A technique developed in the 1980s21 known as the dependency structurematrix (DSM), which has been applied previously in design research22–25
to portray the dependencies between sets of activities, may be utilised toanalyse design progression. In the context of this investigation, the DSMis produced by assuming that, as the various patterns of progression depictthe actual design activity of the teams, progression from one activity toanother must be the result of some dependency between those activities.The DSM works on the premise that the activities are undertaken in theorder suggested by the rows (and columns; which are always in the sameorder). The dependence of one activity (e.g. 2) on another (e.g. 4) is indi-cated by placing a mark in row 2, column 4 of the matrix. A mark placedabove the diagonal indicates feedback (i.e. dependence on a future activity)and hence, iteration.
A DSM is usually evolved from a previously defined process model ofactivities and dependencies. The optimum order of activities (minimisingiteration) can be found by applying a ‘partitioning’ algorithm. In thisinstance the process has been reversed: the sequence in the pattern of pro-gression has been used to infer the activity dependencies and hence, con-struct the matrix.
Once the DSM has been produced it can be used to identify ‘loops’ ofactivities based on the boundary of those marks which appear above theleading diagonal (the shaded areas), where iteration occurred between sev-eral activities. DSMs representing each team’s design progression areshown in Figs. 8–10.
4.3.1 Team AThe DSM of team A [Fig. 8(a)] portrays a large interdependency blockwithin and between activities 1 and 9. During this period, rather than com-pleting one activity entirely before progressing to the next, the team jumped
226 Design Studies Vol 22 No. 3 May 2001
Figure 9 DSM representing
design progression of team
B
between them. Once they had selected suitable combinations of concepts(activity 9) they progressed sequentially through the remainder of thedesign activity.
However, within the large iterative block of activities a differentiation canbe drawn between the nature of dependencies. If those marks furthest fromthe leading diagonal are designated as having a different level of depen-dency (marked B) to those representing a lesser backward step (i.e. thosefalling closer to the leading diagonal) it is apparent that iterations withincertain clusters of activities fall inside the higher level of iteration rep-resented by the large dependency block. This revised DSM [Fig. 8(b)]moves closer to the DSM describing team B’s design activity (Fig. 9).
4.3.2 Team BThe design progression of team B is very similar to that of team A [Fig.8(a)], with each describing two blocks of interdependence. However, theydiffer in the fact that the blocks of iteration described in Fig. 9 are inde-pendent of one another and are not contained within a larger iterative loop.Activities 1–3 are interdependent, after which there is a sequential pro-gression up to the determination of project characteristics (activity 6). Upon
Figure 10 DSMs representing design progression of team C
227Mapping the conceptual design activity of interdisciplinary teams
completion of this activity, the following three activities—(7) searching forsolution principles; (8) transforming and combining these, and (9) selectingsuitable combinations, were undertaken in an iterative manner. Again, oncethis ‘loop’ was complete the remaining design activity was undertakensequentially.
4.3.3 Team CLike team A [Fig. 8(a)], the DSM developed from team C [Fig. 10(a)]portrays a single large block of interdependency. However, the interdepen-dency lies within and across activities 3–12, rather than activities 1–9. Theteam progressed sequentially through the first two activities before enteringthis large iterative loop. If, as with team A’s DSM, marks furthest fromthe leading diagonal are represented differently to those near to it, twoindependent clusters of interdependent activities lay within the larger iterat-ive block.
However, it is important to note that, once the team had identified theessential problems (at activity 3), they undertook what appear to be twosimilar processes to complete the exercise. Upon further examination it isapparent that, if the two similar processes are considered separately, thedesign progression, and the resulting DSMs, are very similar to those exhi-bited by team B.
4.4 Duration and nature of phase interdependencyThe DSMs in Figs. 8–10 describe the varying degrees of interdependencybetween the 12 activities as undertaken by the workshop teams. However,considering the manner in which the five, second level, phases were under-taken provides further insights into the nature of conceptual design activity(Table 2).
Team B spent the majority of their design time working through the phasesin series, first completing one phase before commencing the next, and only
Table 2 Nature of design activity by phase interdependency and duration
Team Addressing No. of phases addressed in parallel Total designa single time up to
phase only activity 12final step
2 3 4
% of total time A 20% 57% 23% N/A 305 minB 84% 16% N/A N/A 250 minC 24% 39% 20% 16% 245 min
228 Design Studies Vol 22 No. 3 May 2001
a small proportion (approximately 16%) in parallel. This iterative behav-iour represented divergent search for concepts and their ensuing transform-ation. This sequential progression is the direct result of following theexperimental procedure.
The more important observation relates to the manner in which teams Aand C progressed with respect to addressing phases in parallel (Table 2).Team A, which had a copy of the framework to utilise as a guiding prin-ciple, addressed two phases in parallel for the majority of the time (57%),followed by three phases for 23%, and a single phase for only 20%. At nopoint during the exercise did they attempt to address four phases in parallel.
Team C however, which had no framework, although spending a similarproportion of time undertaking more than one phase, spent approximately16% of their design time considering four phases simultaneously.
Team C spent much longer than team A ‘Interpreting the need’ in isolationof the other phases, before attempting to address other issues simul-taneously. After this point team A addressed only three, or less, phases inparallel for the remainder of the exercise. Team C however, mid-waythrough their design activity, spent 40 minutes (approximately 16% of theiroverall design time) addressing four phases in parallel.
It must be remembered that team C’s progression through the activities,once activity four had been completed, represented two discrete iterations(Fig. 4). Table 3 considers these two progression patterns individually,based on the premise that phase one is common to both iterations.
This data suggests that a larger proportion of time, approximately 65%,was spent undertaking phases in isolation of one another. Additionally,rather than considering four phases in unison for periods during the designactivity, team C actually considered three phases in parallel during the firstiteration and then only two during the second. This implies that team C,
Table 3 Analysis of two individual iterations performed by team C
Iteration Addressing No. of phases addressed in parallel Total designa single time up to
phase only activity 12final step
2 3 4
% of total time First 64% 19% 16% N/A 160 minSecond 66% 34% N/A N/A 160 min
229Mapping the conceptual design activity of interdisciplinary teams
who were considered to have developed the solution which could be sub-sequently developed to meet the brief most effectively, considered phasesin isolation, and two and three phases in parallel to generate the holisticconcept. After which, the team, having settled on the high level concept,developed the final proposal by undertaking phases singularly, or by con-sidering no more than two phases in parallel. This suggests that team Cconsidered multiple phases to form the concept, which then allowed themto reduce the number of phases being performed in unison to crystallisethe proposal.
4.5 Observations and comparisonConsidering Figs. 8–10 in addition to the analysis undertaken in Section4.4, it is apparent that iterations across the activities and phases of therecorded design processes fit within a higher level of iteration representingthe entire conceptual design phase. In light of these findings the preliminarydesign framework has been developed into a more realistic representationof the conceptual design phase (Fig. 11).
In the DSMs that were produced from the team design activity (Figs. 8–10), interdependencies between the majority of activities within the frame-work were common However, by designating different levels of depen-dency within these iterative blocks, it has been shown that there are alsodependencies within specific clusters of activities (activities clustered byphase within Fig. 11). The arrows designate these connections, with thefrequency of occurrence being indicated by line thickness.
This concept of iteration-within-iteration has been proposed previously by
Figure 11 Reinterpreted
conceptual design frame-
work model
26 Hickling, A ‘Beyond a linearprocess?’ in B Evans, J A Pow-ell and R J Talbot (eds) Chang-ing Design, John Wiley andSons, Chichester, UK (1982)
230 Design Studies Vol 22 No. 3 May 2001
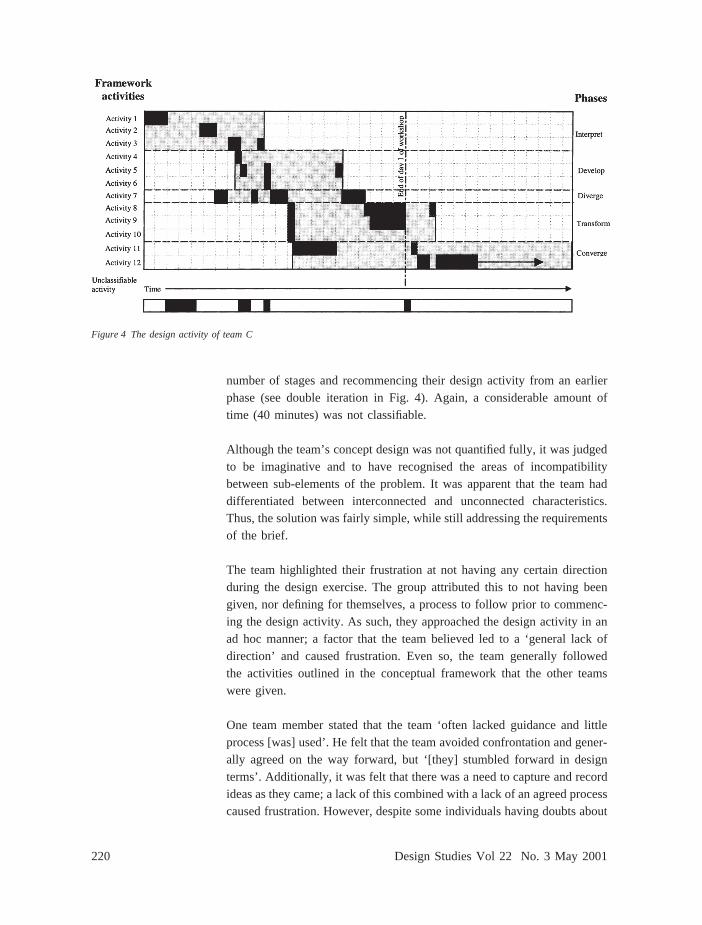
Figure 12 The extended whirling process (From Hickling, A ‘Beyond a linear iterative process?’ in B Evans, J A Powell and
R J Talbot (eds)Changing Design. 1982. John Wiley and Sons Limited. Reproduced with permission.)
Hickling26, who represented the whirling process of decision making indesign in a similar manner (Fig. 12).
Owing to the fact that ‘no foolproof experiment was available with whichto demonstrate these connections’26, Hickling suggested, rather thanasserted, their existence. However, upon comparing the iterative nature ofthe design activity of the workshop teams with the cyclic whirling processprescribed by Hickling, the notion that differing levels of dependency existwithin and across activities appears to be substantiated.
5 Summary and conclusionsThis research involved three interdisciplinary design teams made up of anumber of design professionals from several different organisations. Theinvestigations did not take into account the abilities, expertise or knowl-edge base of the individual designers and as such, no comment can bepassed on the influence that these issues can have on the design process.
27 Steele J, Austin S, Macmil-lan S, Kirby P and Spence R‘An internet-based system tosupport interdisciplinary andinter-organisational collaborativeconceptual design’ CharteredInstitute of Building ServicesEngineers (CIBSE) NationalConference, Dublin, UK(September 2000)
231Mapping the conceptual design activity of interdisciplinary teams
In statistical terms the number of participants in the workshop is very fewand it would be premature to draw general inferences from this limited
evidence. However, within these limitations, the following conclusionswere drawn:
O the majority of design activity undertaken by the teams (between 79
and 90%) could be classified within the activities of the conceptualdesign framework;
O social interaction and team maintenance account for a portion (between
10 and 21%) of design time but neither issue is classified within theconceptual framework model;
O the evidence suggests that designers perceive they have performed bet-ter as a team when they agree on, and subsequently follow, a design pro-
cess;O there is no evidence to suggest that following a design process, be it
in an iterative or systematic manner, will help the team to generate abetter design concept or reduce the time period spent reaching that con-cept;
O the evidence suggests that a team must be led throughout the designactivity. However, the team must agree on who should lead it and how
it should be led if it is to work effectively as a unit and avoid confron-tation; and
O if the team does not agree on a design process to follow, individualteam members tend to make opportunistic forays into particular areas
of the problem in an ad hoc manner. If other team members do notagree on the direction of that foray then this can lead to a lack ofsynchronisation in the team effort and a lack of input from one or a
number of its members.
In light of these conclusions it is apparent that initial validation of the
framework structure has been achieved. Additionally, this initial validationof the preliminary conceptual design framework has enabled an improved
representation of conceptual design activity to be generated which not onlydescribes the activities and phases of conceptual design, but also illustratestheir interconnectedness. Moreover, a critical component of conceptual
design activity, namely the process of social interaction, which was missingfrom the preliminary framework, has now been introduced and embedded
within the revised model. Future development of the conceptual designframework involves turning it into a web-based design tool intended for
use by design teams27. At some point in the future the authors hope toreport on its acceptability and usefulness in practice.
232 Design Studies Vol 22 No. 3 May 2001
AcknowledgementsThis work has been undertaken as part of a project entitled ‘Mapping theDesign Process during the conceptual phase of building projects’. Theresearch is funded under research grant GR/L39292 by the EPSRC andindustry (AMEC Design, BAA Plc., Hotchkiss Ductwork Ltd, Hutter, Jen-nings and Titchmarsh, Matthew Hall, and Pascall & Watson). Loughbor-ough University is also contributing to the project. The final version of thepaper benefited from suggestions made by the referee.