20
MAPPING THE GAP Out-of-School Time Programming in the City of Albuquerque Author Erick Diaz, President Studio 13 April 30, 2021 Client City of Albuquerque
MAPPING THE GAP Out-of-School Time Programming in the City of Albuquerque
AuthorErick Diaz, PresidentStudio 13
April 30, 2021
ClientCity of Albuquerque
ACKNOWLEDGEMENTS
Thank you to the City of Albuquerque and the organizations in Albuquerque who shared their time with our team to complete this report.
ABOUT STUDIO 13
Studio 13 is a consulting firm that leverages data and geospatial analysis with the leading strate-gies and research to help partners have impact in their economic and community development initiatives. Studio 13 was founded by Erick Diaz, who has worked in community development for over 8 years - specifically in affordable housing and educational initiatives. Erick has a Bachelor’s degree from the University of San Diego, and a Master’s in Public Policy and Master’s in Urban Planning from Harvard University.
| 3Out of School Time in ABQ
01. EXECUTIVE SUMMARYOut-of-School Time programs can play a fun-damental role in youth’s development. Whether it is a cooking class, soccer practice, or after- school tutoring, these activities allow youth to have high-quality interactions with their peers and adults, which can help the development of self-management strategies. Academic oriented programs can also support positive academic outcomes.1 However, research suggests that low-income families and families of color often struggle to engage in OST programming due to the cost of these programs or other logistical barriers, like programs being too far away or rigid work schedules that prevent parents from taking their children to these programs. Because of this, it is critical for the City of Albuquerque to understand who is not currently being served and where strategic partnerships may be in order to fill the gap.
This report identifies where Out-of-School-Time programming is offered across the City of Albu-querque, and uses a demographic analysis to identify the areas where these programs may be needed most. Understanding these patterns, both where programming is offered and where it is needed most, can help the City and its partner organizations build or expand existing program-1 McCombs, Jennifer Sloan, Anamarie A. Whitaker, and Paul Youngmin Yoo, The Value of Out-of-School Time Programs. Santa Monica, CA: RAND Corporation, 2017. https://www.rand.org/pubs/perspectives/PE267.html.
ming. Our analysis, which consisted of surveying organizations in the City of Albuquerque and ana-lyzing census-tract level data from the American Community Survey, had the following relevant findings:
§ Approximately 344 organizations are offering OST programming in the City of Albuquerque.
§ Organizations offering religious OST program-ming were prevalent, with over 100 organiza-tions offering these types of services.
§ The average census tract had 3 organizations offering OST programming, while the census tract with the most was in Council District 6 with 11 organizations.
§ Most of the census tracts identified as ‘High Need’ were geographically located below Interstate 40.
§ Most of the census tracts identified as ‘High Need’ were located in District 3 and District 6, as well as the lower halves of District 1 and District 2.
§ The location of Community Centers adminis-tered by the City could serve to fill the gap in many ‘High Need’ census tracts.
4 |
Out-of-School time programs are “supervised programs that young people regularly attend when school is not in session,” which can be after-school hours, weekends, and school vaca-tions.2 These services can be provided by local nonprofit organizations, local businesses, or the city government itself.
Many studies show how OST programming sup-ports children’s academic achievement and can be linked with positive behaviors.3 Additionally, these programs often provide high-quality interac-tions or “developmental experiences” with peers and adults that allow youth to develop self-man-agement strategies, including self-regulation,4 and prevent maladaptive behaviors, like crime and drug abuse, all of which positively shapes youth development.5
2 “Out of School Time.” Centers for Disease Control and Preven-tion. Last modified March 1, 2021. https://www.cdc.gov/healthy-schools/ost.htm. 3 Ibid. 4 McCombs, Jennifer Sloan, Anamarie A. Whitaker, and Paul Youngmin Yoo, The Value of Out-of-School Time Programs. Santa Monica, CA: RAND Corporation, 2017. https://www.rand.org/pubs/perspectives/PE267.html.5 Lauer, Patricia A., Motoko Akiba, Stephanie B. Wilkerson, Helen S. Apthorp, David Snow, and Mya L. Martin-Glenn. “Out-of-School-Time Programs: A Meta-Analysis of Effects for At-Risk Students.” Review of Educational Research 76, no. 2 (June 2006): 275–313. https://doi.org/10.3102/00346543076002275.
Research also indicates that not all children have equal access to OST programs and that those coming from disadvantaged backgrounds find it harder to gain access to these services. For instance, a 2020 study by America After 3pm, the largest survey on afterschool spanning 16 years, found that in New Mexico, “for every child in an afterschool program, 3 are waiting to get in, with 59,758 children alone and unsupervised after school.”6 That same study suggests that “low in-come families, and low income families of color, face the greatest barriers; reporting that after school programs are too expensive.” Specifically, 47% of parents in New Mexico that did not enroll their child in afterschool programs stated that “programs are too expensive” as the reason.7 Ad-ditionally, 56% of New Mexico parents also cited that there was “no safe way for their child to get to and from programs”, suggesting that house-holds are concerned about the financial burden of these programs as well as transportation to and from.8 To fill any OST service gap, the City must first identify programming that is affordable and geographically accessible to households with children.
6 New Mexico After 3PM Fact Sheet. N.P.: America After 3PM, 2020. 7 Ibid. 8 Ibid.
02. INTRODUCTION
| 5Out of School Time in ABQ
The goal of the OST project was twofold:
1) Identify where OST programs are located in the City of Albuquerque; and,
2) Identify where these programs may be needed most based on demographic data.
Finding answers to these two categories would allow us to begin to understand if any groups or geographies are underserved, and where new services, programming, or resources could be located to maximize impact.
The analysis had a two-pronged approach:
1) Conduct a preliminary analysis to identify where there are organizations (both nonprofit organizations and private businesses) that offer OST programming in the City of Albu-querque.
2) Perform a census tract-level data analysis and identify key factors, like household income, single-parent household status, and the num-ber of children in a given geography, to deter-mine where there may be gaps in services.
Ultimately, data from both approaches was ana-lyzed using spatial analysis software. The results are visually represented in the accompanying maps.
03. SCOPE OF WORK 04. OUT-OF-SCHOOL TIME PROGRAMMING SURVEY
Methodology
The first component of the project was gathering information on all of the potential entities that provide OST programming in the City of Albuquer-que. To do this, our team accessed the Internal Revenue Services’ (IRS) database of registered 501(c)3 nonprofit organizations and the City’s database for companies operating within the City of Albuquerque. These two datasets represent-ed all organizations and private businesses that potentially offer OST programming. Additionally, information detailing existing partnerships from the Family and Community Department was also added to the preliminary dataset.
The information received from these three sourc-es resulted in a dataset composed of over 3,400 unique organizations. Our team performed a systematic review of the 3,400 entities to first identify which of these entities offered OST programming and then gathered additional data from those that did.
To do this, our team first performed an online review of each organization - using the organiza-tions’ website, online presence (often Facebook pages), and other online databases (i.e. Guidestar and Charity Navigator) to determine if the organi-zation offered OST programming.
6 |
If the preliminary online search suggested that the organization offered OST programming, that entity was marked for a phone call and email follow-up to confirm their services and get more information. Each organization was called no more than three times, with at least 48 hours in between each phone call, and voicemails were left if the organization did not respond. If the contact did not respond after three phone calls, the organization was marked as ‘unresponsive’ in our spreadsheet.
The additional details gathered in the follow-up phone calls and emails were:
§ Physical address where the services are pro-vided
§ Phone number, email, and website for the organization
§ Age group for services being offered broken up into the three categories
• Elementary Ages: 5-9 years old• Middle School Ages: 10-14 years old• High School Ages: 15-17 years old
§ Category of programs the organization offers. The IRS’ Activity Codes were used as the framework for these categories:
• Arts• Education • Environment and Animals• International Affairs• Public Health and Social Benefit• Health• Human Services• Religious • Athletics• Other
§ The organization’s current capacity compared to their capacity before COVID-19
§ Whether there was a fee for their services
The data described above was compiled into an Excel spreadsheet that has been provided to City staff. The data was also combined with our de-mographic analysis and spatially analyzed in Map 4 on page 13.
| 7Out of School Time in ABQ
Findings
The relevant findings of the point-in-time organi-zation survey are the following:
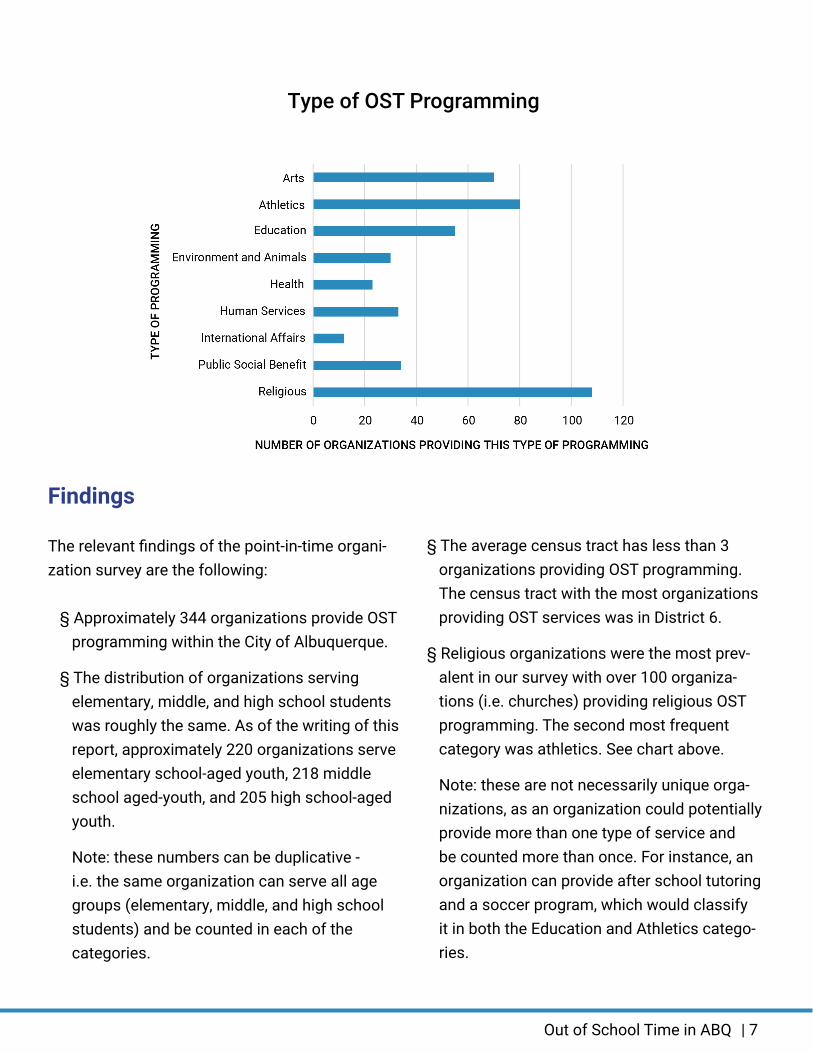
§ Approximately 344 organizations provide OST programming within the City of Albuquerque.
§ The distribution of organizations serving elementary, middle, and high school students was roughly the same. As of the writing of this report, approximately 220 organizations serve elementary school-aged youth, 218 middle school aged-youth, and 205 high school-aged youth.
Note: these numbers can be duplicative - i.e. the same organization can serve all age groups (elementary, middle, and high school students) and be counted in each of the categories.
§ The average census tract has less than 3 organizations providing OST programming. The census tract with the most organizations providing OST services was in District 6.
§ Religious organizations were the most prev-alent in our survey with over 100 organiza-tions (i.e. churches) providing religious OST programming. The second most frequent category was athletics. See chart above.
Note: these are not necessarily unique orga-nizations, as an organization could potentially provide more than one type of service and be counted more than once. For instance, an organization can provide after school tutoring and a soccer program, which would classify it in both the Education and Athletics catego-ries.
Type of OST Programming
8 |
05. Demographic Analysis
Methodology
The second component of this study was a de-mographic analysis to understand what areas of the city may have the largest gap in OST services. For this analysis, we looked at three distinct indi-cators that suggest a need for services, created a blended score using the average of these indica-tors, and visualized the results using geospatial analysis software. The data for these three indi-cators was taken at the census tract level from the 2015-2019 American Community Survey (ACS) 5-Year estimate.
The three indicators analyzed were:
§ The number of children aged 5-17 in a given census tract - This indicator allows us to understand where the school-aged youth in the city reside in order to understand where services may have the most impact.
§ The Median Family Income of families in a given census tract - This indicator allows us to see the differences in ability to pay for services. Research suggests that OST partici-pation is linked to parents’ income, with youth from wealthier families being more likely to participate in these activities.9 Research also suggests that lower-income households often struggle to access OST programs because of financial or logistical hurdles as low-income parents often have limited financial
8. Pew Research Center. “Parenting in America.” Pew Re-search Center : Social & Demographic Trends. Last mod-ified December 2015. https://www.pewresearch.org/so-cial-trends/2015/12/17/5-childrens-extracurricular-activities/.
resources, limited means of transportation10, and/or limited flexibility from their job.11
§ The percent of single-parent households as a proportion of the households with children in a given census tract - This indicator pro-vides insight into the unique financial and/or logistical hurdles single parents face, like having to work longer hours, which can limit parent-child time and highlights the need for accessibility in these geographic regions.
Why use the three factor approach?
These three factors were taken together because any one factor on its own may misrepresent and overestimate the need for OST programming in a given area. For instance, solely basing the analysis on the number of school-aged youth in any given census tract might have us identify a census tract as ‘high need’ because there are a lot of youth in that census tract. However, that census tract may also have high income families with a relatively low percentage of single-parent households - suggesting that while there are a lot of youth in the area, the parents may most likely have the financial resources and time to spend on OST programming. Likewise, a census tract that has a high number of single-parent households as a proportion of all households with children may be identified as ‘high need’ even though there might be relatively few children in that cen-sus tract. Ultimately, taken together, these three factors allow us to mitigate overrepresentation of ‘need’.
10 Federal Highway Administration. National Household Travel Survey Brief. N.p., 2014.11 Chaudry, Ajau, Juan Manuel Pedroza, Heather Sandstrom, Anna Danzinger, Michel Grosz, Molly Scott, and Sarah Ting. Child Care Choices of Low-Income Working Families. N.p.: Urban Insti-tute, 2011.
| 9Out of School Time in ABQ
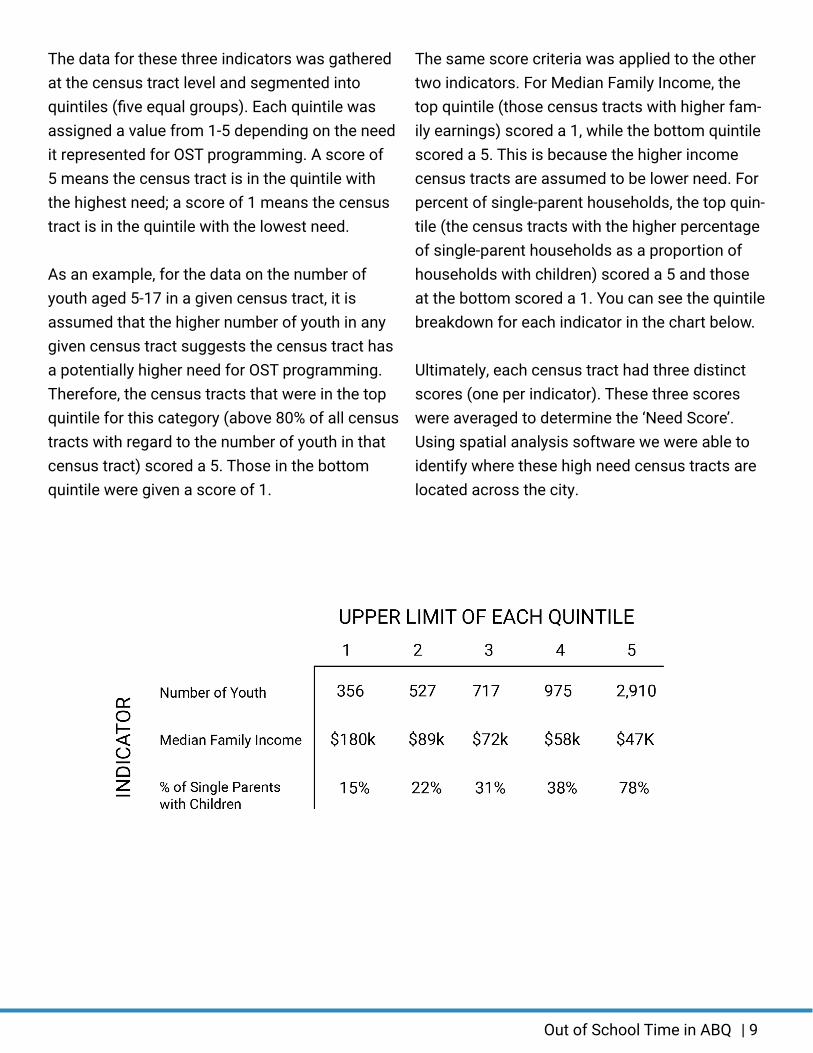
The data for these three indicators was gathered at the census tract level and segmented into quintiles (five equal groups). Each quintile was assigned a value from 1-5 depending on the need it represented for OST programming. A score of 5 means the census tract is in the quintile with the highest need; a score of 1 means the census tract is in the quintile with the lowest need.
As an example, for the data on the number of youth aged 5-17 in a given census tract, it is assumed that the higher number of youth in any given census tract suggests the census tract has a potentially higher need for OST programming. Therefore, the census tracts that were in the top quintile for this category (above 80% of all census tracts with regard to the number of youth in that census tract) scored a 5. Those in the bottom quintile were given a score of 1.
The same score criteria was applied to the other two indicators. For Median Family Income, the top quintile (those census tracts with higher fam-ily earnings) scored a 1, while the bottom quintile scored a 5. This is because the higher income census tracts are assumed to be lower need. For percent of single-parent households, the top quin-tile (the census tracts with the higher percentage of single-parent households as a proportion of households with children) scored a 5 and those at the bottom scored a 1. You can see the quintile breakdown for each indicator in the chart below.
Ultimately, each census tract had three distinct scores (one per indicator). These three scores were averaged to determine the ‘Need Score’. Using spatial analysis software we were able to identify where these high need census tracts are located across the city.
10 |
Findings
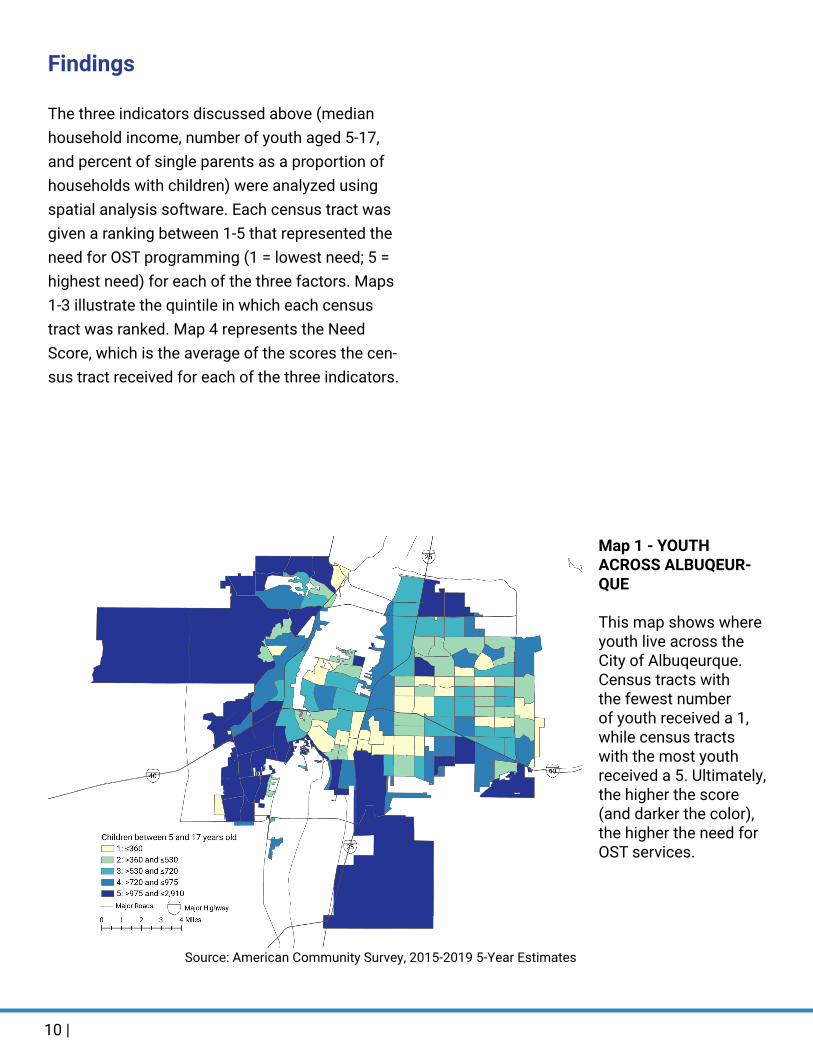
The three indicators discussed above (median household income, number of youth aged 5-17, and percent of single parents as a proportion of households with children) were analyzed using spatial analysis software. Each census tract was given a ranking between 1-5 that represented the need for OST programming (1 = lowest need; 5 = highest need) for each of the three factors. Maps 1-3 illustrate the quintile in which each census tract was ranked. Map 4 represents the Need Score, which is the average of the scores the cen-sus tract received for each of the three indicators.
Map 1 - YOUTH ACROSS ALBUQEUR-QUE
This map shows where youth live across the City of Albuqeurque. Census tracts with the fewest number of youth received a 1, while census tracts with the most youth received a 5. Ultimately, the higher the score (and darker the color), the higher the need for OST services.
Source: American Community Survey, 2015-2019 5-Year Estimates
| 11Out of School Time in ABQ
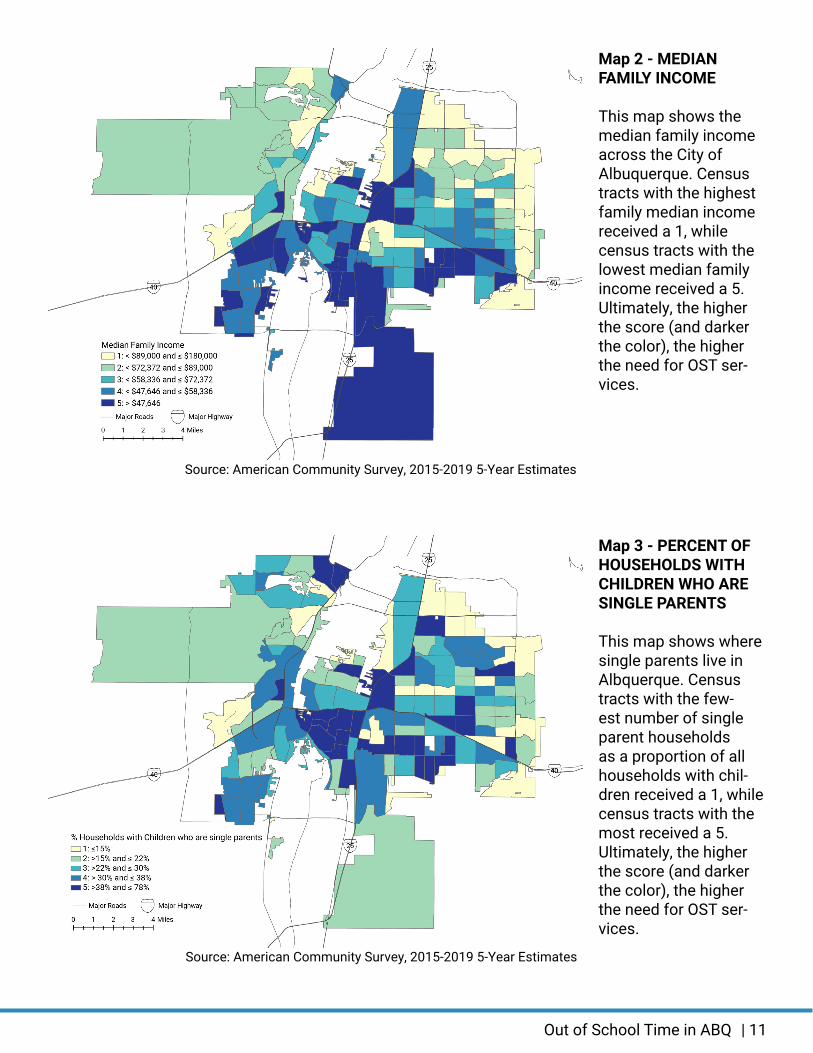
Map 2 - MEDIAN FAMILY INCOME
This map shows the median family income across the City of Albuquerque. Census tracts with the highest family median income received a 1, while census tracts with the lowest median family income received a 5. Ultimately, the higher the score (and darker the color), the higher the need for OST ser-vices.
Map 3 - PERCENT OF HOUSEHOLDS WITH CHILDREN WHO ARE SINGLE PARENTS
This map shows where single parents live in Albquerque. Census tracts with the few-est number of single parent households as a proportion of all households with chil-dren received a 1, while census tracts with the most received a 5. Ultimately, the higher the score (and darker the color), the higher the need for OST ser-vices.
Source: American Community Survey, 2015-2019 5-Year Estimates
Source: American Community Survey, 2015-2019 5-Year Estimates
12 |
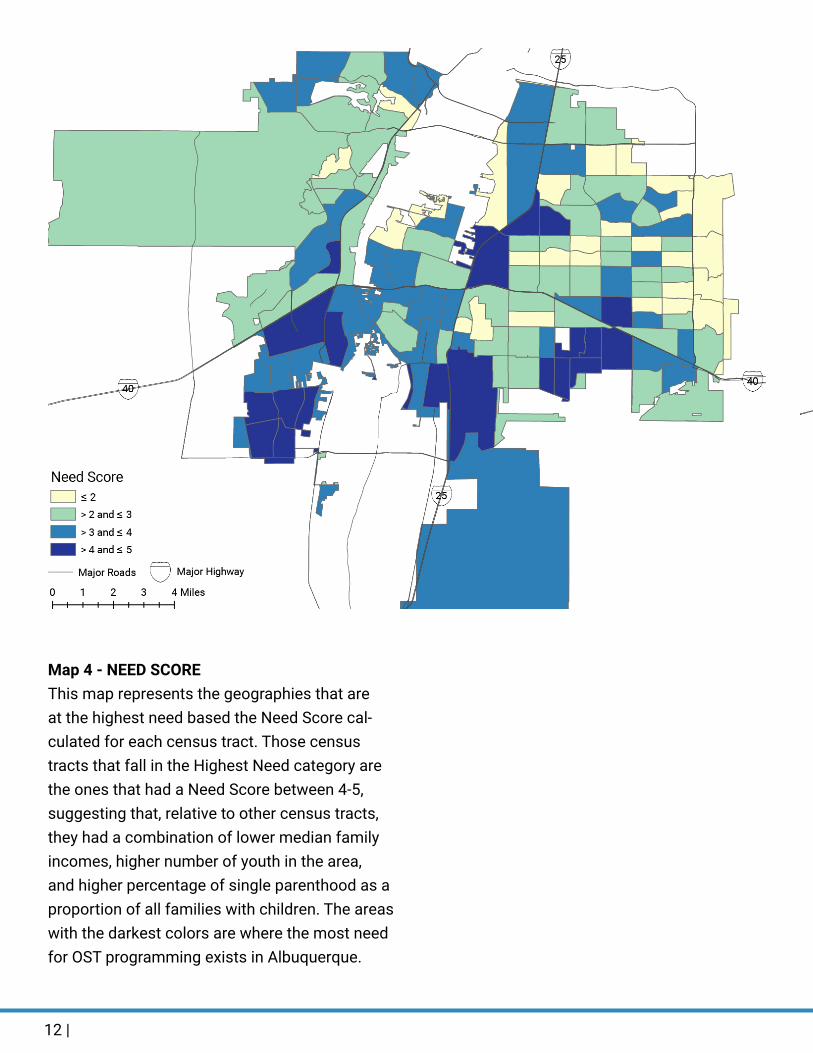
Map 4 - NEED SCOREThis map represents the geographies that are at the highest need based the Need Score cal-culated for each census tract. Those census tracts that fall in the Highest Need category are the ones that had a Need Score between 4-5, suggesting that, relative to other census tracts, they had a combination of lower median family incomes, higher number of youth in the area, and higher percentage of single parenthood as a proportion of all families with children. The areas with the darkest colors are where the most need for OST programming exists in Albuquerque.
| 13Out of School Time in ABQ
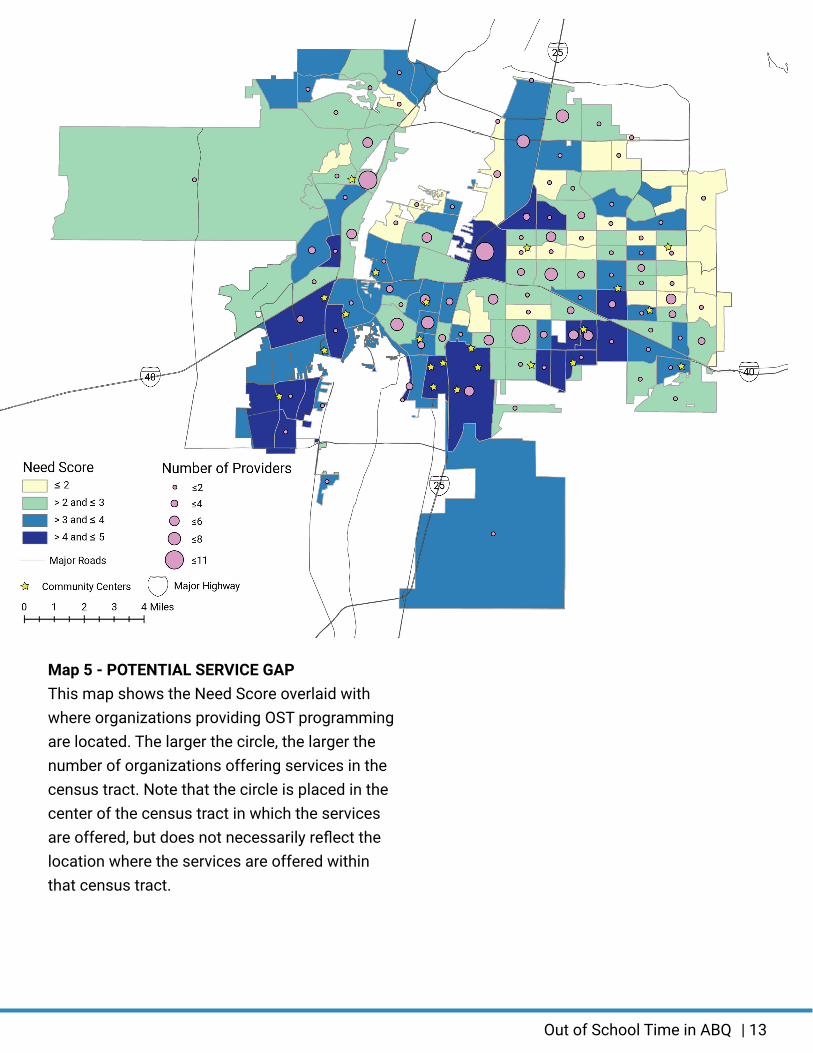
Map 5 - POTENTIAL SERVICE GAPThis map shows the Need Score overlaid with where organizations providing OST programming are located. The larger the circle, the larger the number of organizations offering services in the census tract. Note that the circle is placed in the center of the census tract in which the services are offered, but does not necessarily reflect the location where the services are offered within that census tract.
14 |
These maps allows us to to see a few takeaways:
§ The census tracts that are the Highest Need (those with a Need Score of 4-5) are generally located south of Interstate 40, encompassing Districts 3 and 6, and the southern sections of District 1 and 2.
§ The majority of the South West region of Albuquerque reflects High Need.
§ There are a few High Need census tracts in Districts 4 and 7.
§ Census Tracts with the Lowest Need are generally located on the North East part of the City.
§ High Need Census Tracts appear to have fewer organizations offering OST program-ming than other Census tracts.
§ South West Albuquerque and District 3 appear to have the fewest number of organi-zations from our survey.
§ Many Community Centers appear to be geo-graphically located in Census Tracts with High Need and could serve as locations to reach High Need populations.
07. Limitations
The list below captures the more salient limita-tions to this analysis.
While uncommon, some organizations that are providing OST may not be registered with the IRS. In order for the organization to have been on the IRS’ 501c3 list described above, the organiza-tion must have received 501c3 status. Because it is not uncommon for younger organizations to operate and provide programming for some time (even years) before formally registering with the IRS, some of these organizations may not have been captured by our analysis.
Some organizations were unresponsive by phone or email. While most of the data could be cap-tured through the organization’s online presence (i.e. websites, Facebook, Instagram feeds), not all of the data was captured for organizations that were unresponsive.
Not all data points were captured for every organization providing OST programming. This was most true for the organizations that were unresponsive to our follow up. The main data points that were difficult to capture were where OST programming service occurred (versus the address of the organization itself, as these could be two different locations) and the capacity pre- , during-, and post-COVID. The former was impact-ed because several organizations did not operate from a permanent location, and used a PO Box as their address (note: we did not map the location of the PO box addresses). The latter data point was difficult because many of the respondents did not have data to report on the number of kids served before the pandemic or were not able to
| 15Out of School Time in ABQ
accurately measure their current capacity as it constantly changed.
Organizations are nimble and can change based on current conditions. Therefore, the data cap-tured serves as a point-in-time survey that can change as on-the-ground conditions change. For instance, organizations may be able to increase their capacities once COVID restrictions are lifted. Conversely, some organizations have ceased operations altogether due to COVID-19’s impact on funding.
08. FURTHER ANALYSIS
This analysis focused on identifying the actors (both private and nonprofit) that can provide OST programming for youth. There are, however, other key areas that can be explored to better understand and identify next steps to further OST programming across the City of Albuquerque.
Public Schools as a venue for OST programming. Albuquerque Public Schools could potentially fill in some service gaps. According to New Mexico After 3pm, 83% of after school time programs are located in public schools statewide.12 It is un-clear if the City of Albuquerque data follows the statewide trend, but mapping where the public schools are located, the number of students at each school, and whether or not they offer OST programming can help the City identify if schools themselves can fill-in the gap in services.
Community Centers as a venue for OST pro-gramming. Map 5 shows where the community centers are in Albuquerque. The City could ben-efit from a deeper analysis of the programs that
12 New Mexico After 3PM Fact Sheet. N.p.: America After 3PM, 2020.
are being implemented, the number of youth that are being served, and the number of youth that could be served, as well as the barriers that may prevent youth from going to a local community center. OST programming at the community cen-ter could be operated by the City, or partnerships could be developed where the community centers could be the physical space where those partner organizations provide services.
Commuting patterns and public transportation. It is assumed that youth are accessing services that are close to their homes. However, it would be helpful for the City to know if the children are attending school in their own neighborhood, as this would suggest that services outside of their local neighborhood may be accessible to stu-dents. If children are attending schools outside of their neighborhoods, then services at those other locations may be warranted. A new development that could impact transportation to OST program-ming for youth is Mayor Keller’s announcement that youth under the age of 25 can ride City trans-portation free of charge. This new ability to move about the city could make it easier for older youth to access OST programming outside of their im-mediate neighborhood.
16 |
09. CONCLUSION
Most High Need areas across the City of Albu-querque appear to be located south of Interstate 40. Additionally, census tracts located in the South West quadrant were consistently marked as High Need for all indicators. Furthermore, organizations providing OST programming are dispersed throughout the city boundaries, but do not appear to be located in the regions that are High Need.
Interestingly, community centers operated by the City of Albuquerque, especially in the Southern part of the City, do appear to be located in some of the Highest Need areas and several of the organizations contacted already operate out of these centers. While these centers are located in these geographies, it was outside the scope of the research to understand how many youth they can serve. However, because of their location, Community Centers could serve as the physical location to provide services or to host nonprofit organization partners.
Additionally, the city could invest in building part-nerships with existing organizations within High Need census tracts. Our organization survey Ex-cel document can be used to help identify who is already operating in these tracts. The City could then work with them to expand programming through community center partnerships to better reach youth in the area.
| 17Out of School Time in ABQ
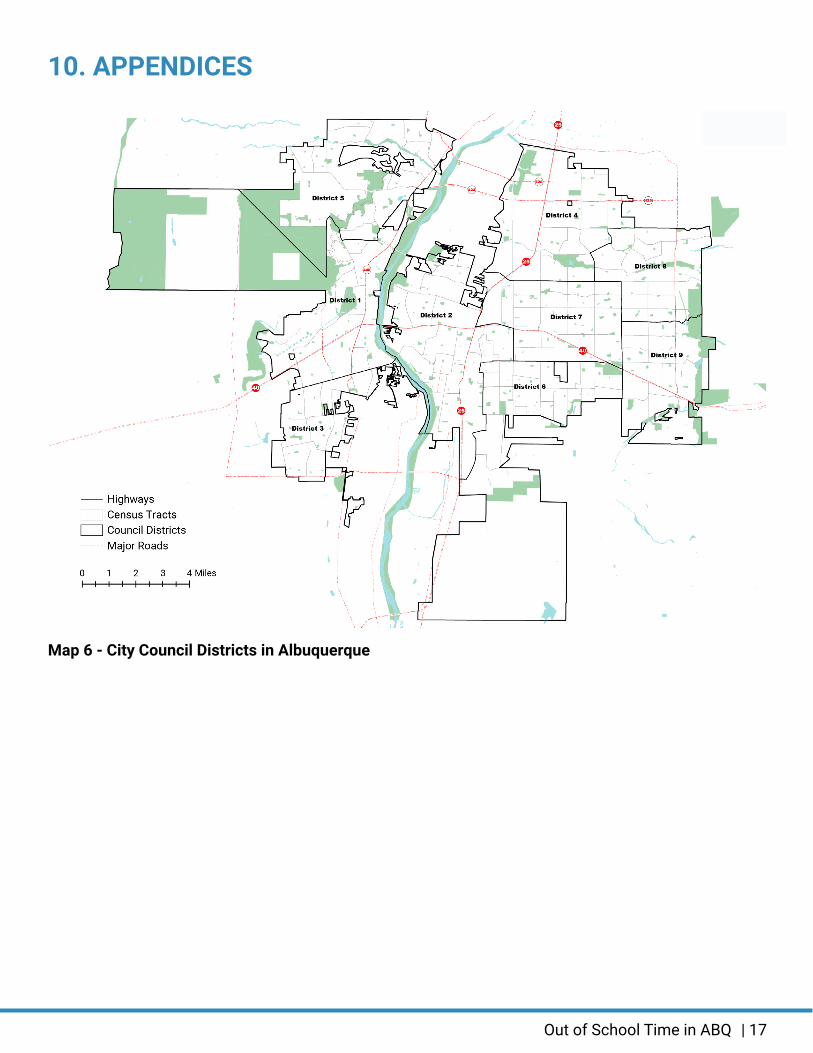
10. APPENDICES
Map 6 - City Council Districts in Albuquerque
18 |
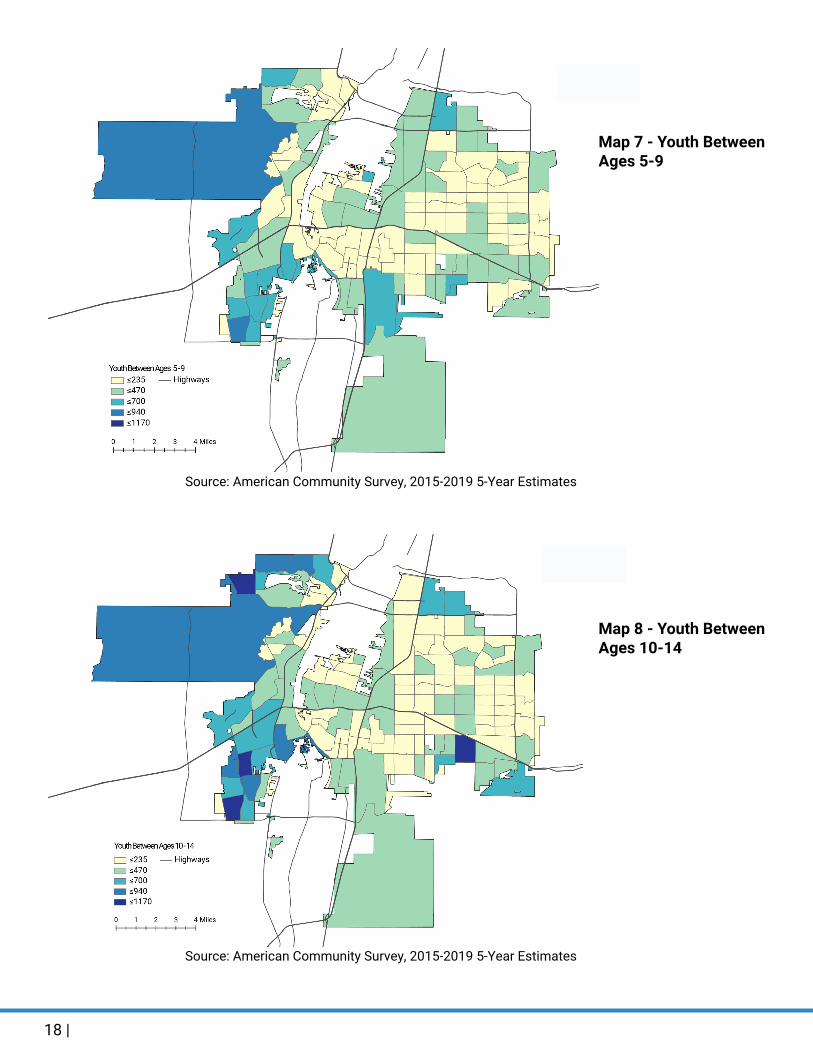
Map 7 - Youth Between Ages 5-9
Map 8 - Youth Between Ages 10-14
Source: American Community Survey, 2015-2019 5-Year Estimates
Source: American Community Survey, 2015-2019 5-Year Estimates
| 19Out of School Time in ABQ
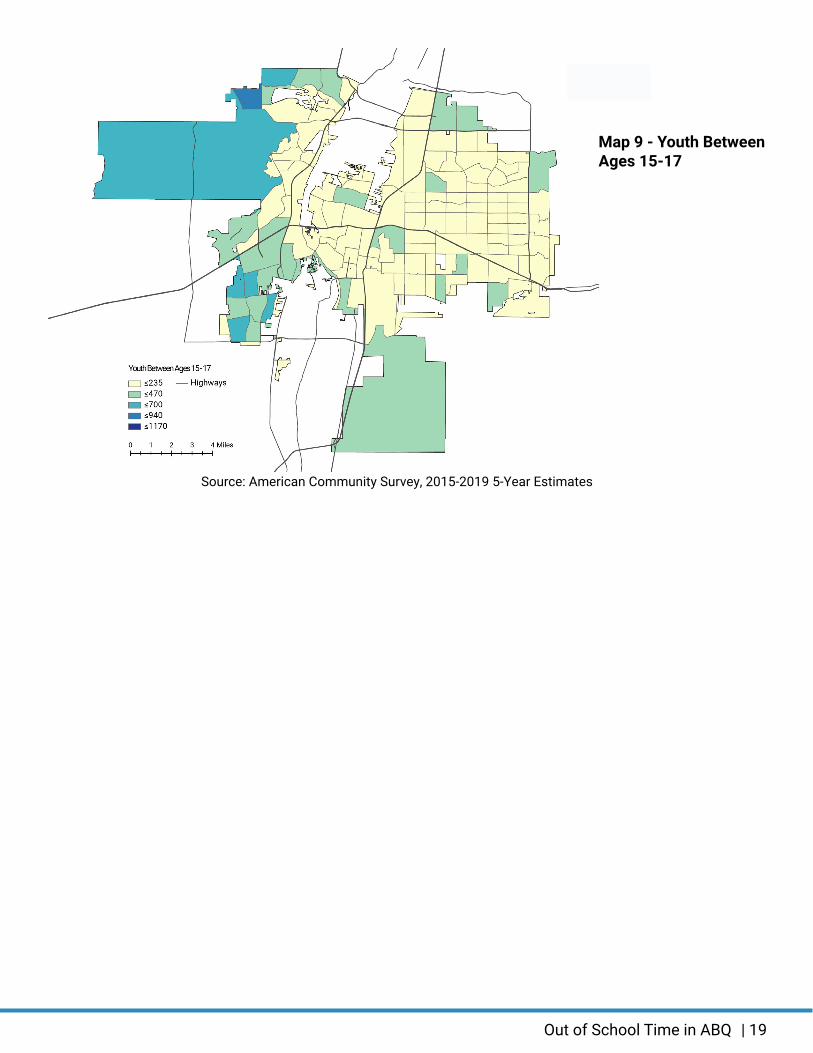
Map 9 - Youth Between Ages 15-17
Source: American Community Survey, 2015-2019 5-Year Estimates

20 |


