1 1
AnnikaStenssonDirector,ResearchCommunica2onsNa2onalRestaurantAssocia2on
[email protected]
RestaurantInnova1onSummitSeptember15,2016|Aus2n,TX
MappingtheRestaurantTechnologyLandscape
@WeRRestaurants
/RestaurantDotOrg
/Na2onalRestaurantAssocia2on
Restaurant.org/Research
2 2
2016 Restaurant Industry Forecast
RESTAURANTINDUSTRYOVERVIEW
3 3
DEFINITION:“RestaurantIndustry”
“FoodAwayfromHome”
Allmeals/snackspreparedawayfromhome,includingalltakeoutmealsandbeverages.
4 4
RestaurantIndustry2016
Source:Na2onalRestaurantAssocia2on
Sales: Employees: Loca2ons:
$783billion
14.4million
1+million
5 5
AnEconomicPowerhouse
ü Annualsalesarelargerthan90%oftheworld’seconomies.
ü Saleswillgrowby$37billionin2016–morethandoubleHollywood’sannualdomes2cboxofficesales.
6 6
WhereDoConsumersSpend?
6Source:BureauofLaborSta2s2cs,2014ConsumerExpenditureSurvey;Na2onalRestaurantAssocia2on
SPENDINGCATEGORY PERCENTOFTOTAL
Housing 33%
Transporta2on 17%
Food 13%
Insurance/pensions 11%
Healthcare 8%
Entertainment 5%
Contribu2ons 3%
Clothing 3%
Other 7%
Total 100%
7 7
RestaurantIndustry’sShareoftheFoodDollar
1955Present
1955:25% Now:47%
Source:Na2onalRestaurantAssocia2on
8 8
INDICATOR 2015 2016
RealGrossDomes2cProduct 2.6% 1.6%
RealDisposablePersonalIncome 3.5% 2.1%
ConsumerPriceIndex 0.1% 1.1%
TotalU.S.Employment 2.1% 1.8%
2016U.SEconomicOutlookGradualimprovementcon1nues
Source:Na2onalRestaurantAssocia2onprojec2ons
2017
2.2%
2.4%
2.3%
1.8%
9 9
TopChallengesFacingOperators
Source:Na2onalRestaurantAssocia2on,RestaurantIndustryTrackingSurvey
JULY2016Laborcosts/minwage27%Government 16%TheEconomy15%Recrui1ngEmployees14%SalesVolume 10%
JULY2014
FoodCosts28%Government 13%SalesVolume 13%TheEconomy 12%Recrui1ngEmployees12%
JULY2015
Government 21%Recrui1ngEmployees18%Laborcosts/minwage16%FoodCosts12%SalesVolume 11%
10 10
RestaurantsareExtremelyLaborIntensiveAveragesalesperemployee,2015
Source:Na2onalRestaurantAssocia2on,basedonBureauofLaborSta2s2csandUSCensusBureaudata
Ea1ng&DrinkingPlaces $56,000
GroceryStores $226,000
GasolineServiceSta1ons $478,000
AutoDealers $769,000
11 11
LaborProduc1vityinRestaurantsRemainedFlatinRecentYears
Averageannualpercentchangeinoutputperlaborhour:2004to2014
Source:BureauofLaborSta2s2cs
12 12
TECHNOLOGYTRENDS-CONSUMER
13 13
Consumerswhofactorintechnologywhenchoosingarestaurant.
TechInfluences
Source:Na2onalRestaurantAssocia2on,2016RestaurantIndustryForecast
14 14
In-StoreTechUsage
Haveused Willingtouse
FreeWi-Fi 49% 67%
Tablesidepayment 32% 63%
Touch-screenorderingkiosk(QSR) 27% 61%
Electronicorderingsta2on(tableservice) 28% 57%
None 35% 20%
Source:Na2onalRestaurantAssocia2on,2016RestaurantIndustryForecast
Consumerswhohaveusedtheseop1onsinthelastyear;consumerswhowouldbewillingtousetheseop1onsinthefuturewhenavailable
15 15
Smartphone/TabletUsage
Alladults 75%
18-34 87%
35-44 87%
45-54 79%
55-64 65%
65+ 49%
Source:Na2onalRestaurantAssocia2on,2016RestaurantIndustryForecast
Consumerswhoownorregularlyuseasmartphoneortablet
16 16
RestaurantSmartphoneTech
Source:Na2onalRestaurantAssocia2on,2016RestaurantIndustryForecast–Baseown/usesmartphone/tablet
Percentofadults
Lookuprestaurantloca1ons,direc1onsandhoursofopera2on
83%
Lookatmenus 75%
ReadreviewsfromappsorsiteslikeYelpandTripAdvisor 55%
Userewardsorspecialdeals 50%
Ordertakeoutordeliverydirectlyfromarestaurant’swebsiteorbrandedapp
51%
Consumerswhousesmartphonesortabletsfortheseac1vi1esoccasionally
17 17
RestaurantSmartphoneTech
Source:Na2onalRestaurantAssocia2on,2016RestaurantIndustryForecast–Baseown/usesmartphone/tablet
Percentofadults
Makereserva1ons 43%
Lookuprestaurantnutri1oninforma1on 42%
Payformeals 32%
OrdertakeoutordeliveryviaanaggregateservicelikeSeamlessorGrubHub
24%
Consumerswhousesmartphonesortabletsfortheseac1vi1esoccasionally
18 18
MobilePaymentGainingAcceptanceConsumerswhowouldpayrestaurantorbartabsviasmartphone
appifoffered*
Source:Na2onalRestaurantAssocia2on,2016RestaurantIndustryForecast–Baseown/usesmartphone/tablet
19 19
It’saBird,It’saPlane,It’s…MyPizza?
Source:Na2onalRestaurantAssocia2on,2016RestaurantIndustryForecast
Consumerswhosaytheywouldbelikelytousedronedeliveryofrestaurantfoodifavailable
20 20
TechnologyIsGrowing
ü 72%ofconsumerssaytechop2onsincreaseconvenience
ü 67%saytechop2onsspeedupserviceü 65%saytechop2onsincreaseorder
accuracyü 42%ofconsumersreporttechnology
makesrestaurantvisitsandorderingmorecomplicated
Source:Na2onalRestaurantAssocia2on,2016RestaurantIndustryForecast
21 21
What’sInItforRestaurateurs?
ü 39%ofconsumerssaytechop2onsmakediningoutmorefun
ü 34%saytechop2onsmakethemchoose
onerestaurantoveranotherü 37%saytechop2onsmakethemdineout
orordertakeout/deliverymoreoken
Source:Na2onalRestaurantAssocia2on,2016RestaurantIndustryForecast
22 22
TECHNOLOGYTRENDS-OPERATOR
23 23
CurrentTechAdop1onIndustrySegment
Total Tableservice Limited-service
POSorelectroniccashregistersystem 81% 78% 83%
Website 81% 79% 83%
Wi-Fiforguests 68% 71% 64%
Touch-screenorderingkiosksorsta2ons 42% N/A 42%
Onlineorderingfortakeoutordelivery 37% 25% 49%
Smartphoneapp 34% 18% 50%
Mobilepayment 32% 15% 49%
Onlinereserva2ons 25% 25% N/A
Electronicordigitalmenuboards 21% N/A 21%
Tabletopordering,orpaymentdeviceorsta2on 20% 20% N/A
Source:Na2onalRestaurantAssocia2on,RestaurantTechnologySurvey2016
24 24
CurrentTechAdop1onOwnershipCategory
Total Independent Franchisee/Chain
POSorelectroniccashregistersystem 81% 69% 94%
Website 81% 73% 89%
Wi-Fiforguests 68% 68% 68%
Touch-screenorderingkiosksorsta2ons 42% 30% 47%
Onlineorderingfortakeoutordelivery 37% 20% 54%
Smartphoneapp 34% 14% 55%
Mobilepayment 32% 17% 47%
Onlinereserva2ons 25% 21% 32%
Electronicordigitalmenuboards 21% 15% 25%
Tabletopordering,orpaymentdeviceorsta2on 20% 17% 28%
Source:Na2onalRestaurantAssocia2on,RestaurantTechnologySurvey2016
25 25
FeaturesofPOSSystems
33%
34%
39%
42%
47%
68%
69%
76%
92%
0% 20% 40% 60% 80% 100%
Customerdemographicsdatacollec2on
Cloud-baseddatastorage
Mobilepayment
Loyaltyprogrammanagement
Tablemanagement
Accoun2ngtools
Inventorymanagement
Labormanagementtools
Creditordebitcardprocessing
Source:Na2onalRestaurantAssocia2on,RestaurantTechnologySurvey2016–BaseusePOSsystem
26 26
ProprietarySystemvs.Service• 2in3tableservicerestaurantsofferingonlinereserva2ons
useaservice;1in3useaproprietarysystem.
• Halfoftableservicerestaurantsofferingonlineorderinguseaproprietarysystem;2in5useaservice.
• 3in5limited-servicerestaurantsofferingonlineorderinguseaproprietarysystem;aquarteruseaservice.
Source:Na2onalRestaurantAssocia2on,RestaurantTechnologySurvey2016
27 27
MobilePaymentType• Morethanhalfoftableservicerestaurantsaccep2ngmobile
paymentuseNFCorBluetooth;aquarterusein-app/fric2onless.
• 3in5limited-servicerestaurantsaccep2ngmobilepayment
useNFCorBluetooth;1in10usein-app/fric2onless.
Source:Na2onalRestaurantAssocia2on,RestaurantTechnologySurvey2016
28 28
SmartphoneAppFeatures
12%
62%
63%
66%
67%
85%
92%
0% 20% 40% 60% 80% 100%
Op2ontomakereserva2ons
Nutri2oninforma2on
Op2ontoplaceorder
Op2ontomakepayment
Loyaltyprograminforma2on
Mapanddirec2ons
Menus
Source:Na2onalRestaurantAssocia2on,RestaurantTechnologySurvey2016–Basehassmartphoneapp
29 29
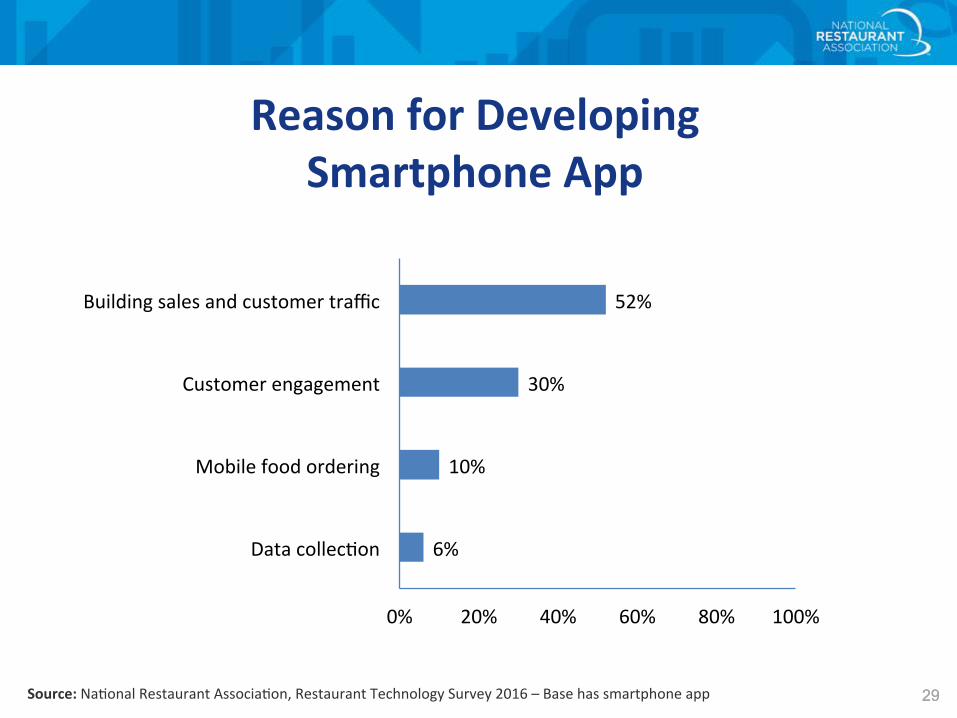
ReasonforDevelopingSmartphoneApp
6%
10%
30%
52%
0% 20% 40% 60% 80% 100%
Datacollec2on
Mobilefoodordering
Customerengagement
Buildingsalesandcustomertraffic
Source:Na2onalRestaurantAssocia2on,RestaurantTechnologySurvey2016–Basehassmartphoneapp
30 30
ReasonforDevelopingSmartphoneApp
42%40%
55%
27%
0%
20%
40%
60%
Buildingsalesandcustomertraffic
Customerengagement
Tableservice Limited-service
IndustrySegment
43%
37%
52%
30%
0%
20%
40%
60%
Buildingsalesandcustomertraffic
Customerengagement
Independent Franchisee/Chain
OwnershipCategory
Source:Na2onalRestaurantAssocia2on,RestaurantTechnologySurvey2016–Basehassmartphoneapp
31 31
TopBenefittoUsingCustomer-FacingTechnology
12%
15%
27%
30%
0% 5% 10% 15% 20% 25% 30% 35% 40% 45% 50%
Enhanceproduc2vity
Controllaborcosts
Improvespeedofservice
Meetconsumerdemand
Source:Na2onalRestaurantAssocia2on,RestaurantTechnologySurvey2016
32 32
Devo1ngMoreResourcestoTech
23%
25%
3%
4%
64%
63%
6%
5%
3%
3%
0% 20% 40% 60% 80% 100%
Sokwareandservices
Hardwareanddevices
More Fewer Same Notapplicable DK
Source:Na2onalRestaurantAssocia2on,RestaurantTechnologySurvey2016
§ 42%ofrestaurantoperatorssaythey’lldevotemoreresourcestotechnologyin2016thanin2015.
33 33
Laggingvs.LeadingEdgeinTechUse
12%
32%
54%
0% 20% 40% 60%
Leadingedge
Lagging
Mainstream
Source:Na2onalRestaurantAssocia2on,RestaurantTechnologySurvey2016
34 34
Laggingvs.LeadingEdgeinTechUse
48%
40%
11%
60%
25%
13%
0%
20%
40%
60%
80%
Mainstream Lagging Leadingedge
Tableservice Limited-service
IndustrySegment
49%
42%
7%
58%
22%17%
0%
20%
40%
60%
80%
Mainstream Lagging Leadingedge
Independent Franchisee/Chain
OwnershipCategory
Source:Na2onalRestaurantAssocia2on,RestaurantTechnologySurvey2016
35 35
MostImportantAreaofTechDevelopmentinNext5Years
8%
25%
25%
37%
0% 20% 40% 60%
Robo2csorautoma2on
Paymentop2ons
Loyaltyprograms
Customerordering
Source:Na2onalRestaurantAssocia2on,RestaurantTechnologySurvey2016
36 36
FutureAdop1on?
53%
36%
16% 13%9%
Predic2veordering,oroffering
suggesteditemsbasedoncustomers'
previouspurchases
Automa2cmenu-priceadjustmentbasedondemandduringpeakandoff-peakhours
Dronefooddeliveryoff-premises
Automa2cfoodprepara2onsystems
Automatedonsitedrinkorfood
delivery
Source:Na2onalRestaurantAssocia2on,RestaurantTechnologySurvey2016
Restaurantoperatorswhosaytheywouldconsideraddingthefollowingtechnologiesiftheywereavailabletothemtoday
37 37
BarrierstoAddingMoreTech
44%
48%
49%
49%
50%
63%
0% 20% 40% 60% 80%
Stafftraining
Customeracceptance
Pertransac2onorusagecosts
Serviceandrepair
Lackofinfrastructure
Costofimplementa2on
Source:Na2onalRestaurantAssocia2on,RestaurantTechnologySurvey2016
38 38
AgreementwithStatementsonTechnology
19%
9%
7%
7%
6%
7%
31%
16%
10%
9%
9%
8%
33%
39%
36%
33%
37%
35%
14%
33%
45%
49%
46%
48%
0% 20% 40% 60% 80% 100%
Technologymakesrestaurantorderingandvisitsmorecomplicatedfor
consumers
Customersfactorintheavailabilityoftechnologywhentheychoosea
restaurant
Useoftechnologyinarestaurantprovidesacompe22veadvantage
Restauranttechnologyspeedsupcustomerservice
Technologymakesyourrestaurantmoreproduc2ve
Technologyhelpsincreasesales
Stronglydisagree Somewhatdisagree Somewhatagree Stronglyagree
Agree
83%
83%
83%
81%
72%
47%
Source:Na2onalRestaurantAssocia2on,RestaurantTechnologySurvey2016
39 39
§ Interestisgrowingamongconsumers.
§ Adop1onisgrowingamongrestaurants.
§ Limited-serviceandfranchisee/chainrestaurantsgenerallyhavehigheradop2onrates.
§ Costremainsabarrier.
§ Operatorsandconsumerslargelyonboardwithtechnology,butsignificantnumbers2llbelievesitcomplicatesinterac2on.
§ MoreatRestaurant.org/TechnologyTrends
Summary
40 40
AnnikaStenssonDirector,ResearchCommunica2onsNa2onalRestaurantAssocia2on
[email protected]
RestaurantInnova1onSummitSeptember15,2016|Aus2n,TX
MappingtheRestaurantTechnologyLandscape
@WeRRestaurants
/RestaurantDotOrg
/Na2onalRestaurantAssocia2on
Restaurant.org/Research


![CentralizedMaintenanceTimePredictionAlgorithmforFreight ... · 6/25/2019 · and Sbrana [21] extend HP filtering to multidimensional conditions, offering an interesting option](https://static.documents.pub/doc/80x56/60df9ce45561c77b39171ad6/centralizedmaintenancetimepredictionalgorithmforfreight-6252019-and-sbrana.jpg)


