JADT 2004 : 7 es Journées internationales d’Analyse statistique des Données Textuelles Mapping the structure of research topics through term variant clustering: the TermWatch system Fidelia Ibekwe-SanJuan 1 , Eric SanJuan 2 1 ERSICOM Université Jean Moulin – 4 cours Albert Thomas – 69008 Lyon. [email protected]2 LITA EA3097 – Université de Metz. Île de Saulcy – 57047 Metz – France. [email protected]Abstract A multi-disciplinary approach integrating computational linguistic techniques is necessary to elaborate indicators of research topic evolution. We describe a system which bases clustering on linguistic relations, instead of the usual co-occurrence paradigm. The interesting features of this approach, embodied in the TermWatch system, lie in the combination of state-of-the-art techniques in computational terminology, mathematics (graph formalism) and visualization techniques. Computational terminology enable us to extract meaningful text chunks and to relate these chunks through linguistic relations. These text chunks are terms and the linguistic relations are syn- tactic variations. We integrated into this system an adapted visualization tool which enhances comprehension of the research topic layout and their trends. Here we focus on the chronological analysis of graphs issued by TermWatch through a graph visualization tool, Aisee which helps the end-user to track the main tendencies of research topics in his/her field. Résumé Nous présentons les dernières avancées apportées au système TermWatch, élaboré à des fins de veille scienti- fique et technologique ou de fouille de textes. La principale originalité de TermWatch réside dans le fait que la classification est fondée sur des relations syntaxiques, et non sur des critères usuels de co-occurrence. Une inter- face de visualisation, Aisee a été récemment intégrée au système pour mieux explorer ses résultats. Cet article met l’accent sur l’analyse des résultats à travers cette interface, notamment l’analyse chronologique permettant de percevoir l’évolution des tendances thématiques dans un corpus de textes spécialisés. Keywords: Morpho-syntactic analysis, terminological variation, clustering, textmining, trend mapping, com- petitive intelligence. 1. Introduction Bibliometric and scientometric studies aim to elaborate indicators of scientific activities through the use of statistical data analysis and mathematical models. The two major methods used in these fields are the co-citation (Small, 1999) and co-word analyses (Callon et al., 1983). While citation analysis has proved its usefulness for highlighting major actors in a field (the “who’s who” of a field), we argue that it is not adequate to portray the publication contents themselves and their evolution. It cannot capture other facets of scientific activities. For instance, how can one know actually what themes or topics are addressed in the different publications, if the research topics are evolving and what their relation to one another is. Still, citation studies have to say something about the contents of the publications in order to inter- pret the major citation trends.
Abstract A multi-disciplinary approach integrating computational linguistic techniques is necessary to elaborate indicators of research topic evolution. We describe a system which bases clustering on linguistic relations, instead of the usual co-occurrence paradigm. The interesting features of this approach, embodied in the TermWatch system, lie in the combination of state-of-the-art techniques in computational terminology, mathematics (graph formalism) and visualization techniques. Computational terminology enable us to extract meaningful text chunks and to relate these chunks through linguistic relations. These text chunks are terms and the linguistic relations are syn-tactic variations. We integrated into this system an adapted visualization tool which enhances comprehension of the research topic layout and their trends. Here we focus on the chronological analysis of graphs issued by TermWatch through a graph visualization tool, Aisee which helps the end-user to track the main tendencies of research topics in his/her field.
Résumé Nous présentons les dernières avancées apportées au système TermWatch, élaboré à des fins de veille scienti-fique et technologique ou de fouille de textes. La principale originalité de TermWatch réside dans le fait que la classification est fondée sur des relations syntaxiques, et non sur des critères usuels de co-occurrence. Une inter-face de visualisation, Aisee a été récemment intégrée au système pour mieux explorer ses résultats. Cet article met l’accent sur l’analyse des résultats à travers cette interface, notamment l’analyse chronologique permettant de percevoir l’évolution des tendances thématiques dans un corpus de textes spécialisés.
1. Introduction Bibliometric and scientometric studies aim to elaborate indicators of scientific activities through the use of statistical data analysis and mathematical models. The two major methods used in these fields are the co-citation (Small, 1999) and co-word analyses (Callon et al., 1983). While citation analysis has proved its usefulness for highlighting major actors in a field (the “who’s who” of a field), we argue that it is not adequate to portray the publication contents themselves and their evolution. It cannot capture other facets of scientific activities. For instance, how can one know actually what themes or topics are addressed in the different publications, if the research topics are evolving and what their relation to one another is. Still, citation studies have to say something about the contents of the publications in order to inter-pret the major citation trends.
Most bibliometric and scientometric methods work mostly at the macro level, i.e., the level of whole disciplines (chemistry, physics, mathematics, linguistics, etc), or whole countries or continents. Consequently, their data are characterized by very highly occurring units where low occurring units or rare phenomena tend to be simply eliminated. A lot of work has been devoted lately to text data analysis (Lebart and Salem, 1994; Reinert, 1993; Lelu, 2001, Fran-çois et al., 2001). While some of these works perform some linguistic processing of the text prior to the clustering, the unique criterion for clustering in these data analysis methods remain the co-occurrence paradigm. We claim that since the information units being clustered come from texts written in natural language, related on other more linguistic dimensions (morphological, lexical, syntactic, semantic), it is necessary to explore which linguistic rela-tions are potentially relevant as clustering criteria. The system we developed, TermWatch is based on this claim. It clusters terms extracted from texts, based on syntactic relations called variations. This system is more adapted to capturing rare occurring local phenomena as well as highly occurring ones since clustering is not based on frequency. Low and highly occurring units are given the same chance by our method. Different stages of this work have been pub-lished elsewhere (SanJuan and Ibekwe-SanJuan, 2002; Ibekwe-SanJuan and SanJuan, 2003). The focus of this paper is on the latest enhancements to TermWatch: the integration of a graph visualization tool, Aisee1, for exploring the results and for performing a chronological analy-sis in order to detect trends.
First, we present the overall architecture of the TermWatch system (§2) and describe it’s dif-ferent levels of processing – term extraction from texts followed by terminological variation identification and finally by clustering. In section §3, we present the Aisee interface and illus-trate how it brings to light the organization of research topics in a field. We will then focus on the chronological analysis of the structure of research topics with the aim to pinpoint their evolution patterns. Finally, section §4 will be dedicated to discussions. The experimental cor-pus used in this study was composed of English scientific abstracts of 70,000 words collected from two scientific databases following a STW request. They covered publication made from 1988 to 1998 on the breadmaking process. The end user wished to know if there existed new natural additives to enhance his bread making process while maintaining it’s “artisanal” qual-ity. The corpus was made available by the French Institute for Scientific and Technical In-formation (INIST).
2. System overview TermWatch comprises of two main modules: a term variant search module and a clustering module. Two other minor modules ensure the integration of two external tools necessary to perform the whole analysis: a term extractor and a graph visualization tool. It’s architecture is shown in figure 1 here below. We recall briefly the different stages of processing involved.
2.1. Term extraction with INTEX Given a corpus of english texts, the first step is to perform morpho-syntactic analysis in order to extract terms from the texts. We used the INTEX linguistic toolbox (Silberztein, 1993) for this task. Terms are choice linguistic units, rich in information content because they are used by experts in a field to name the objects or concepts of that particular field. On the linguistic level, terms appear mostly as noun phrases which can occur either in a compound form
1 More details on this tool can be found at http://www.aisee.com
MAPPING THE STRUCTURE OF RESEARCH TOPICS…: THE TERMWATCH SYSTEM 591
(wheat flour fractionation) or in a syntagmatic structure with a prepositional phrase (frac-tionation of wheat flour). After morphological analysis on the corpus, we defined several morpho-syntactic constraints enabling us to identify sequences that contained potential terms. We will not go into the details of the different grammar rules written to extract noun phrases. This stage has been described in SanJuan and Ibekwe-SanJuan (2002). We will simply say that these constraints are implemented as finite state transducers with decreasing order of complexity, some being embedded in others2. These transducers are applied in an iterative fashion on the corpus and enable us to extract first complex nominal sequences, which are in turn split into simpler noun phrases (NPs) until we reach the desired result. Examples of some candidates extracted are “traditional sour dough starter cultures; development of traditional bread flavour; dough stickiness; intense dough stickiness; wheat dough stickiness; wheat dough surface stickiness”. Some 10 000 term candidates were thus extracted. In order to select likely domain terms, we subjected the list of NPs to manual filtering by a domain specialist (an indexer of the INIST used to indexing papers on this field). 3651 likely terms were retained. As terms are given to much variations in texts - the same term can be written in several ways, two terms will rarely co-occur under the same form. For instance, these variants around the term “dough stickiness” (intense dough stickiness; wheat dough sickiness; wheat dough surface stickiness) may only occur once in the corpus. This drives home the point that clustering methods based on co-occurrence of word sequences cannot work effectively on terms extracted from raw texts without addressing the terminological variation issue. TermWatch does not need any outside terminological resource for this term extraction task. This endogeneous approach is more likely to portray terminological evolution and hence that of domain concepts.
2 A transducer is a graph whose vertices are morpho-syntactic tags. In the simple case, this graph is equi-
valent to a regular expression. It becomes a transducer when, in INTEX, it not only recognizes forms or patterns but also modifies the text.
2.2. Syntactic variant search This module identifies pairs of terms that are related through some linguistic operations, thus making the two terms variants of one another. Variations occur at different linguistic levels making their identification impossible without integrating natural language processing (NLP) techniques. There are spelling variants (specialisation / specialization), morphological vari-ants (online web access / on line web access / on-line web access; WWW interface / web in-terface), syntactic variants (information retrieval / retrieval of information / efficient retrieval of information) and finally semantic variants (information retrieval / data access). We did not address all the possible types of variants that can exist between terms (see Jacquemin, 2001 for an extensive study), rather we chose a restricted subset which can be identified with a rather shallow and selective NLP. These syntactic variants involved two categories of trans-formation: syntactic variants involving the addition of words in an existing term or the sub-stitution of a word in an existing term. Within these two categories, we distinguished variants along the grammatical axis: variants affecting modifier words in a term and those affecting the head word. In the term “traditional sour dough starter cultures”, the first four words are modifiers because they qualify the last noun “cultures” which is the head word. In other words, modifiers play the role of adjectives in a syntagm while the head word corresponds to the noun focus (the object of discourse). When considering terms with prepositional phrases, the head word appears as the last noun before the preposition as in “effective retrieval of information” where “retrieval” is the head word, the rest are its modifiers.
2.2.1. Modifier variations (COMP) They involve the two transformations mentioned above: adjunction of words in an existing term (left expansions, insertions) and the substitution of a modifier word. For instance, “new yeast strain development” is an insertion (Ins) variant of “new strain development” while “gas holding property of dough” (=dough gas holding property) is a left expansion (L-Exp) of “gas holding property”. “commercial baking strain” is a modifier substitution (M-Sub) variant of “commercial yeast strain”. We call this category of variants that affect the modifier elements in a term “COMP”.
2.2.2. Head variations (CLAS)
They equally subdivide into two operations: head expansions and head substitution. For instance, the term “cell wall degrading enzyme” is a head expansion (R-Exp) variant of “cell wall” where “enzyme” has become the new head of this syntagm. “effect of xanthan gum” is a head substitution (H-Sub) of “addition of xanthan gum”. Left and right expansion (LR-Exp) represents a combination of the two elementary expansions as in “bread dough” and “frozen bread dough preparation”. We call this category of relations “CLAS”. The aim of the variant identification module is to identify such variants and establish a relation between each pair according to the type of phenomenon involved. 3019 terms (83%) out of the 3561 retained were thus related, showing the importance of the variation phenomena in written texts. Con-trarily to other works on terminology variations (Daille, 2003; Jacquemin, 2001), we were not looking only for variants which preserved the semantic concept family of a given term, i.e; as in “information retrieval” and “efficient information retrieval”, we would also extract as vari-ants terms that share common elements as in “information retrieval system” and “information retrieval software”, the thrust being on capturing what researchers are saying about a particu-lar topic, in this example “information retrieval”. As of now, the definition of terms and variations have been done only for the english language. However many studies already exist
MAPPING THE STRUCTURE OF RESEARCH TOPICS…: THE TERMWATCH SYSTEM 593
on french term formation and variations. It will not require much effort to adapt these works in order to be able to process French texts.
2.3. Term variant clustering This module is based on the CPCL (Classification Algorithm by Preferential Clustered Link) presented in Ibekwe-SanJuan (1998). Here, we extend its formal presentation. CPCL is a two-step extractor of classes from a graph of term variants implemented in TermWatch. One attribute of this algorithm is that the clustering begins not at the atomic level (term level), but at the component level. Components are obtained by grouping terms sharing COMP varia-tions. The clustering stage then consists in merging iteratively components that share many variations of the type CLAS with regard to the links they share with any other component in the graph. A normalized coefficient is used to indicate the proximity between two components as a function of the number of CLAS relations between them and the proportion of the particular CLAS relation in the graph.
CPCL-phase 1: computing a dissimilarity index between components of terms
The first step of the CPCL algorithm is to compute a set I of components which are subsets of terms linked by variations of type COMP and a dissimilarity index between these components that will be used in the second step of the algorithm, which is a kind of single link clustering process.
The computing of the components is simply done by extracting the connected components of the cover graph of COMP. Thus a subset S of terms is a component if it is a maximal subset such that for any two terms t0 and tk in S there is a sequence of terms t1,…, tn such that (t0,t1), (t1,t2) …(tn-1,tn), (tn,tk) are all linked by a relation in COMP. It follows that two terms in the same component share the same head word, but that two terms with the same head word are not necessarily in the same component if they do not share a COMP relation. Let us denote by I the set of these connected components. Like in most clustering methods, we need to com-pute a dissimilarity index.
By default, in the first release of TermWatch, CLAS is a set of four syntactic variation rela-tions on terms: H-Sub-2 (head substitution on terms of length 2), H-Sub-3 (the same on terms with at least two modifiers), R-Exp (right expansion of terms), LR-Exp (left and right expan-sion). However, the user can chose to remove one of these relations if s/he finds it too noisy.
We denote by nR(i,j) the number of R variations between i and j, for any i,j in I. Clearly we have: nR(i,j) = |{{t,s}: (t,s) in R, t in i, s in j}|
Then for any i,j in I, we define a dissimilarity d that maps I² into [0,1] by setting: d(i,j) = 1 if we have nR(i,j) = 0 for any R in CLAS ; d(i,j) = 0 whenever i = j ; otherwise:
CPCL-phase2: Clustering components The second step of the CPCL algorithm produces an appropriate visual display of complex information in CLAS in order to arrive at a better understanding of the network of term vari-ants. To avoid the main drawback of single link clustering (SLC) called “chain effect”, we have chosen to cluster first vertices that have the lowest dissimilarity by comparison with neighbouring vertices. In other words, we do not consider the values of d as an absolute
ordered set. We consider the relative strength of the link between any given pair of vertices at a given time. Thus, at a given iteration, two edges with different values can be clustered. In practice, this leads to a more fine-grained representation of the network of components related by CLAS links.
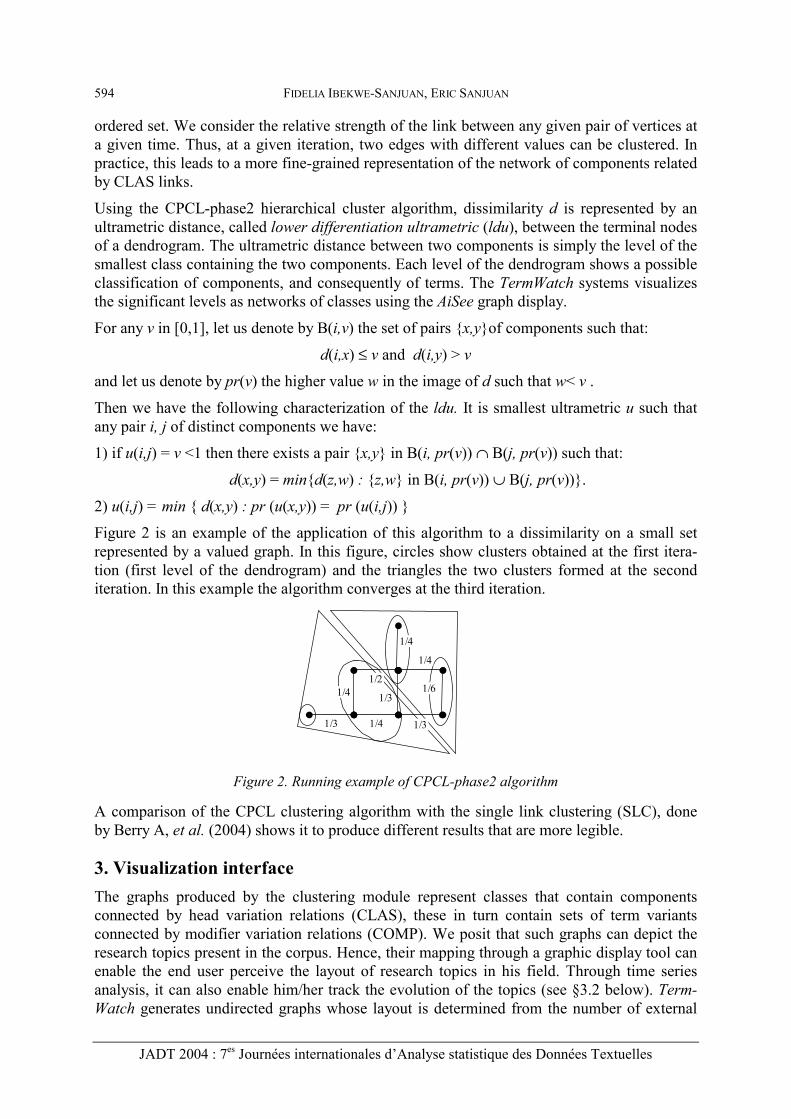
Using the CPCL-phase2 hierarchical cluster algorithm, dissimilarity d is represented by an ultrametric distance, called lower differentiation ultrametric (ldu), between the terminal nodes of a dendrogram. The ultrametric distance between two components is simply the level of the smallest class containing the two components. Each level of the dendrogram shows a possible classification of components, and consequently of terms. The TermWatch systems visualizes the significant levels as networks of classes using the AiSee graph display.
For any v in [0,1], let us denote by B(i,v) the set of pairs {x,y}of components such that:
d(i,x) ≤ v and d(i,y) > v and let us denote by pr(v) the higher value w in the image of d such that w< v .
Then we have the following characterization of the ldu. It is smallest ultrametric u such that any pair i, j of distinct components we have:
1) if u(i,j) = v <1 then there exists a pair {x,y} in B(i, pr(v)) ∩ B(j, pr(v)) such that:
2) u(i,j) = min { d(x,y) : pr (u(x,y)) = pr (u(i,j)) } Figure 2 is an example of the application of this algorithm to a dissimilarity on a small set represented by a valued graph. In this figure, circles show clusters obtained at the first itera-tion (first level of the dendrogram) and the triangles the two clusters formed at the second iteration. In this example the algorithm converges at the third iteration.
Figure 2. Running example of CPCL-phase2 algorithm
A comparison of the CPCL clustering algorithm with the single link clustering (SLC), done by Berry A, et al. (2004) shows it to produce different results that are more legible.
3. Visualization interface The graphs produced by the clustering module represent classes that contain components connected by head variation relations (CLAS), these in turn contain sets of term variants connected by modifier variation relations (COMP). We posit that such graphs can depict the research topics present in the corpus. Hence, their mapping through a graphic display tool can enable the end user perceive the layout of research topics in his field. Through time series analysis, it can also enable him/her track the evolution of the topics (see §3.2 below). Term-Watch generates undirected graphs whose layout is determined from the number of external
1/3
1/41/3
1/6
1/4
1/4
1/3
1/21/4
MAPPING THE STRUCTURE OF RESEARCH TOPICS…: THE TERMWATCH SYSTEM 595
links between classes. Since a class has no coordinates, the space in which it is mapped is not geometric. A major difficulty for the visualization tool is to determine the position of each class such that its relation to other classes is not altered. Thus, it should allow the user to per-ceive the central classes and the peripheral ones. Also, such a tool should portray the notion of proximity even though we did not use any distance measure, i.e, the visualization tool should place classes that share strong variation links close together. Since the clustering method is based on variation relations, it is necessary that the visual tool allows the user to explore class contents up to the term level, in order to see the variants. Thus it should offer unfolding func-tions that ensure a three-level exploration of the classes: class, component and term level. It was also necessary to bring to light peculiar patterns, if any, formed by groups of classes sharing particular types of variation relations. The Aisee graph display package met all these requirements. It simulates the proximity of classes as edges with a spring embedder where close particles repel one another and distant particles attract each other. Integrating Aisee as the front end to TermWatch required specific encoding of TermWatch’s output into the graph description language (GDL) used by Aisee.
The results obtained on the global corpus has been published elsewhere (Ibekwe-SanJuan and SanJuan, 2003), we will refer to this result as the “global classification”. In the following sec-tions, we will summarize the evaluation of this global classification, then focus on the results obtained by periods (through time series analysis) in order to pinpoint the evolution patterns of research topics.
3.1. Evaluation of the global classification Thirty-three classes were obtained in the global classification at the 3rd iteration and were subjected to a scientific and technological watch (STW) analyst3 for validation. The evalua-tion has been reported in Ibekwe-SanJuan and Dubois, (2002). The analyst had to say if a class represented a coherent domain topic, name the topic and also determine if the external links between classes were sound. In essence, the analyst’s evaluation helped us identify three categories of classes: (a) classes that represented known and relevant domain topics, they were twenty-six in number); (b) classes whose topic were partially or not at all identified (five classes were concerned, especially the core class 32); and finally (c) classes whose topic though identifiable were uninteresting for STW, only one class is concerned. Two of the uni-dentified classes were rather big in size (198 and 218 terms respectively). This poses a prob-lem for scientific and technological watch because the class contents were too heterogeneous to be qualified. Currently Berry et al. (2004) are investigating ways of splitting such big graphs in order to reduce them to more manageable and interpretable sub graphs.
Let’s recall that our corpus covered ten years of publications (1988 to 1998) on the topic of bread production process. The initial STW request was to know if there existed new and natu-ral additives that can conserve the “artisanal” quality of bread while enabling the company to expand (become more industrial and competitive). Among the relevant classes, one class labelled “wheat bran” represented an emerging topic at the time of corpus constitution (1998). According to the analyst, its content provide clues to answer the initial STW request. The analyst renamed this class “Natural components or elements”. This name could not have been deduced from the lexical form of the term variants in this class. So this is a pragmatic domain knowledge whose linguistic utterance did not appear on the surface level as terms in our cor-
3 The evaluation was done by the Technology survey unit of the Henri Tudor Research center in Luxembourg
pus. A closer look at the term variants in this class however shows its vocabulary to be rela-tively specific. The variants around “wheat germ, corn bran” and “bran incorporation, raisin incorporation” appeared only in this class. The evaluation was done before the Aisee graphic interface was integrated. With the graphic interface, this type of information is enhanced. The emerging character of this class, at the time of corpus constitution, is supported by its external position. The wheat bran class was not in a central position and is linked to 2 other classes only.
3.2. Tracking the evolution of research topics: a chronological analysis
We will explore here the possibilities of capturing the evolution of research topics via the visual interface. The first problem in a chronological analysis is to determine significant time intervals. Usually in bibliometric studies, finding time periods is done by partitioning the cor-pus in such a way that an approximately equal number of units is obtained per period. Follo-wing this method, we determined three periods covering the ten years of the publications. The first period, P1 spanned publications from 1988-92, the second P2 covered publications from 1993-95 and the third period P3, from 1996-98. All three had approximately the same number of terms (± 1000 terms). We tried clustering term variants in each period but were rapidly confronted with a problem: by partitioning our terms into the time intervals specified above, the clustering yielded enormous classes as early as the 1st iteration, whose contents were too heterogeneous to be meaningful. The reason for the rapid aggregation of classes soon became clear: since we were working on only 1/3 of the terms in each period, the variation links between terms from different periods were lost, so the terms in a particular period tended to aggregate earlier. We then abandoned this classical approach and opted for a different solu-tion: we worked on the whole set of terms but at a particular point, we looked at links appearing in a particular period. We then mark links from each period using colour codes and other graphic symbols. Comparing this with the classes obtained on global classification, we were able to follow progressively the formation of their components in time.
In the graphic interface generated under Aisee, each vertex bears a sequential number given to the class and a label. The label is chosen automatically by TermWatch and is the most active term variant in the class. Vertices either represent connected components or classes. Classes are highlighted by a background colour whereas connected components that were not aggre-gated into a class have a colourless background. Components in the same class appear draped in the same background colour as the class’s colour, ensuring an easy reading. Also, different colours and graphics are used to differentiate the links from different periods: in this example, links from period P1 are in dotted lines, those of P2 in dashed lines and those of P3 in straight lines. For the end user, the visualization tool offers a more interactive and dynamic interface. The user can select the periods whose links s/he wishes to see, the tool automatically reloads the graph accordingly.
The Aisee visualization tool highlighted important and meaningful features of the graph of term variants generated by TermWatch. These features concern the notion of “distance” between two classes and peculiar patterns formed by subgraphs of the network which we will describe below. The length of an edge has a straightforward meaning here. The longer the edge, the weaker the link between two classes and thus the further they are from one another. Thus, we obtain an image where distance between vertices are meaningful whereas our clus-tering algorithm does not use any distance measure.
MAPPING THE STRUCTURE OF RESEARCH TOPICS…: THE TERMWATCH SYSTEM 597
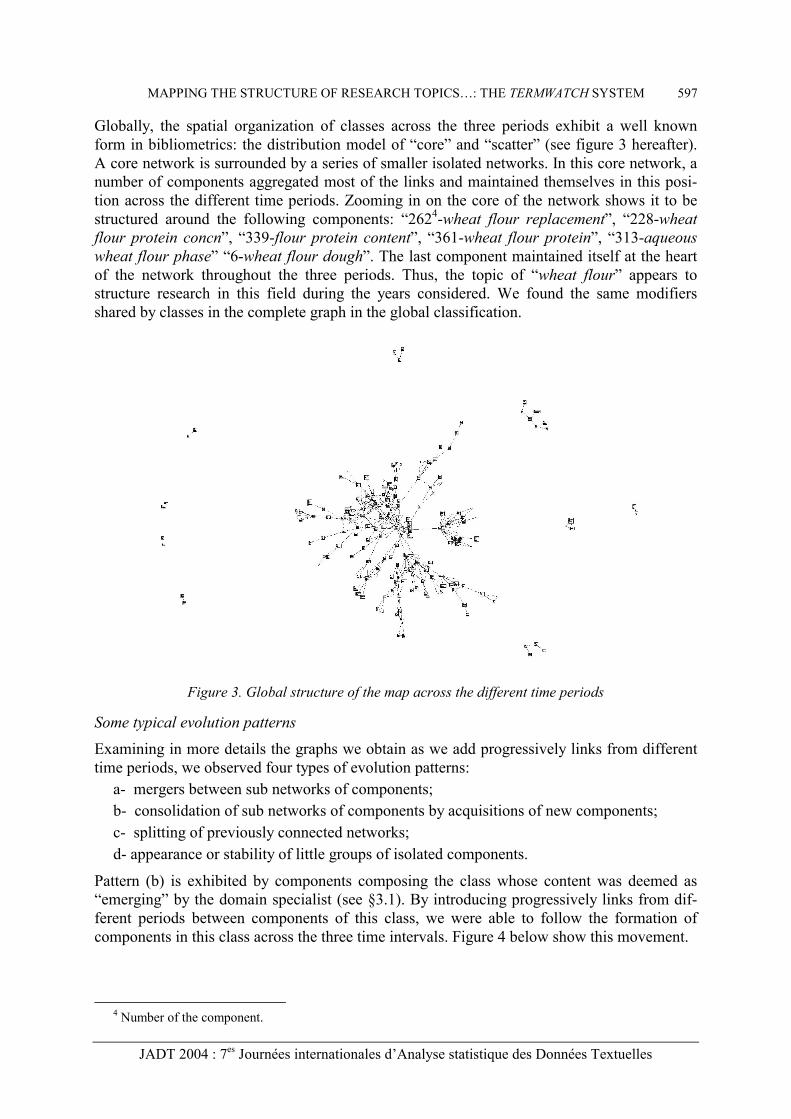
Globally, the spatial organization of classes across the three periods exhibit a well known form in bibliometrics: the distribution model of “core” and “scatter” (see figure 3 hereafter). A core network is surrounded by a series of smaller isolated networks. In this core network, a number of components aggregated most of the links and maintained themselves in this posi-tion across the different time periods. Zooming in on the core of the network shows it to be structured around the following components: “2624-wheat flour replacement”, “228-wheat flour protein concn”, “339-flour protein content”, “361-wheat flour protein”, “313-aqueous wheat flour phase” “6-wheat flour dough”. The last component maintained itself at the heart of the network throughout the three periods. Thus, the topic of “wheat flour” appears to structure research in this field during the years considered. We found the same modifiers shared by classes in the complete graph in the global classification.
Figure 3. Global structure of the map across the different time periods
Some typical evolution patterns Examining in more details the graphs we obtain as we add progressively links from different time periods, we observed four types of evolution patterns:
a- mergers between sub networks of components; b- consolidation of sub networks of components by acquisitions of new components; c- splitting of previously connected networks; d- appearance or stability of little groups of isolated components.
Pattern (b) is exhibited by components composing the class whose content was deemed as “emerging” by the domain specialist (see §3.1). By introducing progressively links from dif-ferent periods between components of this class, we were able to follow the formation of components in this class across the three time intervals. Figure 4 below show this movement.
Figure 4. “Merger � consolidation” pattern exhibited by components of the emerging class in P3
We unfolded the class, so the image here below shows the components composing the class. This class contains seven components numbered by 169, 261, 265, 113, 227, 147 and 328. The first components of this class appeared in period P1 and were represented by a little net-work around components “169-wheat bran” and “265-wheat germ” on the one hand, and components “147-wheat flour supplementation” and “169-wheat bran”, in turn linked to component “328-wheat flour fractionation”.
In period P2, a consolidation of this sub network is observed. Component “169-wheat bran” attaches itself to a central classes in the major network, “2-wheat flour bread”, thus bringing the other components of this class in it’s wake. At the same time, it consolidates its link with “261-wheat germ incorporation” with another link in period P2. New links between the three components 265, 261 and 113 appear, thus forming a complete graph.
In period P3, this consolidation movement is maintained by the acquisition of new links, between “169-wheat bran” and “265-wheat germ”.
Since it is also possible to show links from different periods between components or classes, we are able to see that component “227-wheat flour blend” also belongs to this class owing to its links with components “147-wheat flour supplementation” and “328-wheat flour frac-tionation”. For legibility reasons, links across two periods were not shown in the above figure but are highlighted by a different colour in the graphic interface. While this “appearance �
MAPPING THE STRUCTURE OF RESEARCH TOPICS…: THE TERMWATCH SYSTEM 599
merger � consolidation” pattern brings this sub network in the vicinity of the main network, the components of the emerging class remain at the border of this central network, thus echo-ing the peripheral position of this class in the global classification and confirming it’s poten-tial as a weak but interesting signal for STW.
There are many more sub networks whose position and structure can be explored, but owing to space limitations, we cannot describe all of them in the present paper.
4. Discussion The system we have described is designed for trends survey in a specific research field through the mapping of term variants extracted from a corpus of representative texts. We were not able to subject the chronological analysis to expert validation owing to the absence of a formal framework in which to carry out this evaluation. However, basing on the valida-tion carried out on the global classification, the chronological analysis corroborated the gen-eral tendencies already observed on some of the classes: core vs peripheral, position of the emerging topic’s class. The chronological analysis also brought to light the main evolution patterns of the classes.
We are currently investigating the extraction of semantic relations with which to enrich the clustering relations. This will enable us to establish equivalence relations between synonymic terms, thus ensuring that semantically related terms appear in the same class. As of now, such synonyms can be captured only if they share a common lexical element as in “information retrieval” and “information access” where “information” is the common element. These two will likely end up in the same class as they are considered head substitution variants, but so also would another head variant like “information storage”. Although topically close, the lat-ter is not exactly a synonym of the preceding two. However, its being in the same class with the former two is not necessarily a handicap for STW application. We also have to tackle other important morphological variants like abbreviations and acronyms which would also culminate in synonymy relations. Ways of identifying other semantic variants such as hypernym/hyponyms relations are currently under investigation.
References Berry A., Kaba B., SanJuan E. and Sigayret A. (2004). Classification et désarticulation de graphes
terminologiques. In Actes des JADT 2004. Callon M., Courtial J-P. and Turner W. (1991). La méthode Leximappe: un outil pour l’analyse
stratégique du développement scientifique et technique. In Vinck (Ed.), Gestion de la recherche: nouveaux problèmes, nouveaux outils. Boeck Editions: 207-277.
Daille B. (2003). Complex structuring through term variation. Workshop on Multiword expressions: Analysis, Acquisition and Treatment. In 41st Meeting of the Association for Computational Lin-guistics (ACL, 2003), Sapporo, Japan.
François C., Dubois C. and Royauté J. (2001). Utilisation d’un système d’analyse d’information dans le processus de la veille scientifique et technologique : acceptabilité et pratiques collaboratives induites. In Actes du 3e Congrès du Chapitre français de l’International Society for Knowledge Organisation (ISKO): 79-88.
Ibekwe-SanJuan F. and SanJuan E. (2003). TermWatch : cartographie de réseaux de termes. In Proceedings of the 5th Conference on Terminologie et Intelligence Artificielle (TIA’03): 124-134.
Ibekwe-SanJuan F. and Dubois C. (2002). Can Syntactic variations highlight semantic links between domain topics? In Proceedings of the 6th International Conference on Terminology and Knowledge engineering (TKE’02): 57-63.
Ibekwe-SanJuan F. (1998). A linguistic and mathematical method for mapping thematic trends from texts. In Proceedings of the 13th European Conference on Artificial Intelligence (ECAI’98): 170-174.
Jacquemin C. (2001). Spotting and discovering terms through Natural Language Processing. MIT Press.
Lebart L. and Salem A. (1994). Statistique textuelle. Dunod. Lelu A. (2001). Synthèse d’information en ligne : bilan du prototype NeuroWeb. In Actes du 3e
Congrès du Chapitre français de l’International Society for Knowledge Organisation (ISKO): 187-195.
Reinert M. (1990). ALCESTE : une méthodologie d’analyse des données textuelles et une applica-tion : Aurélia de G. de Nerval. Bulletin Méthodologie sociologique, vol. (26).
SanJuan É. and Ibekwe-SanJuan F. (2002). Terminologie et classification automatique des textes. In Actes des JADT 2002 : 677-688.
Small H. (1999). Visualizing science by citation mapping. Journal of the American society for Infor-mation Science, vol. (50/9): 799-813.