84
Annual Report 2012 maps | traffic | navigation
| Date post: | 12-May-2018 |
| Category: |
Documents |
| Upload: | nguyenlien |
| View: | 222 times |
| Download: | 1 times |

TomTom NV Oosterdoksstraat 1141011 DK AmsterdamThe NetherlandsTel: +31 (0)20 757 5000www.tomtom.com
Annual Report 2012
maps | traffi c | navigation

Forward-looking statements/important noticeThis document contains certain forward-looking statements with respect to the fi nancial condition, results of operations and business of TomTom and certain of the plans and objectives of TomTom with respect to these items. In particular the words ‘expect’, ‘anticipate’, ‘estimate’, ‘may’, ‘should’, ‘believe’ and similar expressions are intended to identify forward-looking statements. By their nature, forward-looking statements involve risk and uncertainty because they relate to events and depend on circumstances that will occur in the future. Actual results may differ materially from those expressed in these forward-looking statements, and you should not place undue reliance on them. We have based these forward-looking statements on our current expectations and projections about future events, including numerous assumptions regarding our present and future business strategies, operations and the environment in which we will operate in the future. There are a number of factors that could cause actual results and develop-ments to differ materially from those expressed or implied by these forward-looking statements. These factors include, but are not limited to, levels of customer spending in major economies, changes in consumer tastes and preferences, changes in law, the performance of the fi nancial markets, the levels of marketing and promotional expenditures by TomTom and its competitors, raw materials and employee costs, changes in exchange and interest rates (in particular changes in the US dollar and GB pound versus the euro can materially affect results), changes in tax rates, future business combinations, acquisitions or disposals, the rate of technological changes, political and military developments in countries where TomTom operates and the risk of a downturn in the market.
Statements regarding market share, including TomTom’s competitive position, contained in this document are based on outside sources such as specialised research institutes, industry and dealer panels in combination with management estimates. Where full-year information regarding 2012 is not yet available to TomTom, those statements may also be based on estimates and projections prepared by outside sources or management. Market shares are based on sales in units unless otherwise stated. The forward-looking statements contained refer only to the date on which they are made, and we do not undertake any obligation to update any forward-looking statement to refl ect events or circumstances after the date of this Annual Report.

1
33 Consolidated Financial Statements 34 Consolidated Statement of Income 35 Consolidated Statement of Comprehensive Income 36 Consolidated Balance Sheet 37 Consolidated Statement of Cash Flows 38 Consolidated Statement of Changes in Equity 39 Notes to the Consolidated Financial Statements
69 Company Financial Statements of TomTom NV 69 Company Statement of Income of TomTom NV 70 Company Balance Sheet of TomTom NV 71 Notes to the Company Financial Statements 74 Other Information
76 Shareholder Information
78 Key Figures Overview
2 CEO Letter
4 Profi le
5 Management Board Report 5 Financial and Business Review 9 Human Resources 11 Corporate Social Responsibility 12 Business Risks 16 In Control Statement and Responsibility
17 Corporate Governance
23 Profi les of the Management Board
24 Profi les of the Supervisory Board
26 Supervisory Board Report
Contents

TomTom Annual Report and Accounts 20122
Technology
—
At the beginning of the year we introduced a new R&D structure consisting of 11 product units. The new structure reduces the interdependencies between our technologies, allowing innovations and products to be brought to the market faster.
Our map, traffi c and navigation product units form the heart of our new R&D structure. We have directed much of our investment to these technologies over the past couple of years. The advancements we are making with innovation in these areas will be fundamental to the long term success of the company.
It is part of our strategy to move towards becoming a content, software and services company. Innovation in our core assets is enabling us to license core technologies as individual components; selling map content, navigation software and HD Traffi c as standalone solutions. In the automotive market as a result we have positioned ourselves as a supplier of content, software and services for connected in-dash navigation. We need to take more steps to realise this strategy, which requires continued investment in our core assets.
Strategy
—
Our strategy is to restore revenue growth. This will be achieved through greater growth from non-PND product sales while limiting revenue decline in the PND category. We have been working on establishing the foundations for our non-PND related business since 2007. During 2012 we reached an important milestone in this regard: over 50% of group revenue was derived from non-PND sales. The new revenue structure does not compensate for the declining demand for PNDs, but we are getting closer to that point. Nonetheless, we believe that PND will remain a meaningful category in its own right for the foreseeable future. Working with Nike, we have made a successful step into the fi tness market and we will build on this positive momentum. Licensing also benefi ts from our strategy to sell modular components of a content, software and services company. Business Solutions operates an underpenetrated market. With its legacy-free, state of art, online fl eet management platform, its aim is to continue to signifi cantly outperform the growth of the market as a whole, helped by alliances in some of its newer markets.
Major business developments
—
Developments in the smartphone industry in recent years have been dominating the consumer electronics market, and location-based services have become a core feature on smartphones today. As one of three global map companies in the world, TomTom is part of the battle for global smartphone platform dominance.
There are rapid technological developments in consumer electronics. These are having major impacts in the consumer space, and the challenge for the automotive industry is to keep up with consumer expectations. The list of features and requirements for in-dash infotainment systems has grown, as have the complexity and costs involved in their manufacture. This makes it more diffi cult for a single supplier to deliver full infotainment solutions. To solve this problem, car manufacturers have been developing their own model-independent platforms, allowing specialists in certain areas to add specifi c applications and features to them. TomTom is positioning itself as the preferred location and navigation services supplier by offering maps, traffi c and navigation software as stand-alone components which are easy and cost effective to integrate by tier 1 suppliers and car manufacturers. Our deal with PSA Peugeot Citroen, who will include our components in its new infotainment solution, is one example of early success with our approach to the automotive market.
Business Solutions is getting increased attention owning to its consistent strong track record of growth and because of increased activity in the industry it operates in. We envisage further growth opportunities beyond fl eet management services and are using our telematics technologies to enter new areas of business, such as car leasing and user based insurance markets.
CEO Letter
During 2012 we focused our investment in our core map, traffi c and navigation assets which underpin our roadmap of products and solutions for the future. Our fi nancial performance was in line with expectations and we generated strong operating cash fl ows.

3
Looking forward
—
2013 will be an exciting year as products based on our new technologies start to reach our customers. An uncertain macro-economic environment will continue to bring us challenges. We will take further steps this year to develop our componentised technologies. These will provide the basis for our future growth.
I would like to thank all our stakeholders: our shareholders for their continuous support in our journey in this dynamic and fast moving industry; our customers, who give us valuable feedback and the drive to improve ourselves every day; and fi nally our employees for their dedication and hard work.
Harold Goddijn | Chief Executive Offi cer, TomTom NV

TomTom Annual Report and Accounts 20124
TomTom maps, traffi c information and navigation technology power automotive in-dash systems, mobile devices, web based applications and government and business solutions.
TomTom has four customer facing business units – Consumer, Automotive, Business Solutions and Licensing. The fi rst three business units provide targeted solutions for customers: consumers, car manufacturers and their suppliers, and fl eet owners. Licensing sells its content and services to multiple customer groups, including PND companies, smartphone companies, governments and enterprises. We have 11 product units, which are embedded within our business units. The product unit focus enables us to bring the highest quality innovative products to market fast.
Profi le
Founded in 1991, TomTom is a leading provider of navigation and location-based products and services.
TomTom designs and manufactures its own location-based products, including portable navigation devices and fl eet management solutions, as well as GPS-enabled sports watches.
Headquartered in Amsterdam, TomTom has 3,500 employees and operates from 57 locations in 35 countries.
TomTomMarkets
Product Units
Consumer Automotive Licensing Business Solutions
Maps Traffi c Navigation PND
Fleet Fitness Mobile Places
Speedcams Custom Systems Location Based Services

5
In 2012 a macro-economic headwind continued to infl uence business conditions in Europe. In particular, weak consumer sentiment negatively impacted demand for consumer electronics and new car sales, aff ecting our sales of PNDs and automotive products. However, we were able to maintain our profi tability at the anticipated level in this challenging environment through strong gross margins and tight control of operating costs.
Financial and Business Review
Overview
—
TomTom generated revenue of €1.1 billion in 2012; this represented a decline of 17% compared to revenue of €1.3 billion in 2011. Our gross margin increased by 2 percentage points to 52%.
During 2012 TomTom made signifi cant progress on costs to align them with the decline in revenue. Excluding the impairment and restructuring charges recorded in 2011, the operating expenses reduced by 10% or €53 million. These savings were ahead of the target to reduce operating expenses to around €500 million. Total operating costs for the group in 2012 were €484 million.
The operating result was €70 million (2011: €102 million excluding impairment and restructuring charges) and the adjusted earnings per share were €0.40 (2011: €0.55)
Net debt decreased from €194 million at the beginning of the year to €86 million as of 31 December 2012.
Business Review
—
ConsumerThe Consumer business unit was confronted early in the year with a malfunctioning component that had been supplied by a third party and integrated in a number of our products. TomTom moved quickly to offer a fi x, but the resultant decline in our North American market share only began to recover later in the year. In North America our market share for the year was 22%, down fi ve percentage points compared to 2011. This was also partly due to the decision not to participate in large promotional activities in the Christmas holiday season. In Europe our market share for the year was 46%, which was one percentage point up compared to 2011.
Consumer revenue decreased year-on-year by €194 million to €639 million mainly due to decline in PND revenue. Revenue from LIVE Services and the SportWatch that we developed in partnership with Nike grew strongly year-on-year. However, growth in these areas did not compensate for the decline in PND sales.
Management Board Report
Key fi gures (in € millions)
2012% of
revenue
2011% of
revenue
2010% of
revenue
Consumer 639 60% 833 66% 1,158 76%Automotive 212 20% 235 18% 179 12%Licensing 133 13% 142 11% 131 9%Business Solutions 73 7% 64 5% 53 3%Hardware 657 62% 867 68% 1,164 77%Content & Services 400 38% 407 32% 357 23%TOTAL REVENUE 1,057 100% 1,273 100% 1,521 100%GROSS RESULT 555 52% 640 50% 744 49%OPERATING EXPENSES1 484 46% 1,064 558 37%OPERATING RESULT 70 7% – 425 186 12%EBITDA 181 17% 206 295 19%NET RESULT 129 12% – 439 108 7%
1 Operating expenses include a €512 million impairment charge in 2011 and restructuring expenses of €15 million in 2011 and €3.3 million in 2010.

6 TomTom Annual Report and Accounts 2012
During the year we refreshed our PND product range; new products included the TomTom Start 60 with an extra-large 6 inch touch screen and a voice controlled TomTom Via 130. Geographically we expanded sales of TomTom PNDs to Indonesia. We also enabled all our 60 million PNDs to receive free daily map changes via the TomTom Map Share community. This was previously available only on a limited number of PNDs.
TomTom’s navigation app for iPhone continued to sell strongly; there were around half a million downloads during the year. For iPhone, we also introduced a new speed camera app. Our navigation app for Android was introduced after the summer. During the year we also launched the TomTom Hands Free Car Kit for smart phones that enables our customers to make optimal use of smart phones in their cars. This product is available for iPhones and micro USB compatible smart phones.
In 2011 we had a positive response to our co-branded Nike+ SportWatch powered by TomTom. To capitalise on this, we introduced a broader range at different price points during 2012.
Automotive Automotive generated revenue of €212 million in 2012, a 10% decrease year-on-year (2011: €235 million). The lower revenue mainly refl ects lower hardware sales due to reduced new car sales in the European markets.
Our relationships with Renault, Mazda and Fiat were extended during the year. TomTom will be Renault’s partner for a new integrated, connected infotainment system, R-Link, which will enter the market in 2013. Mazda has selected TomTom to provide connected navigation for the new Mazda6, in addition to the models TomTom is already supplying for. Abarth is the latest brand in Fiat Group Automobiles to offer TomTom navigation systems to its customers. Lexus became the fi rst high-end car brand to offer TomTom navigation.
During the year the Automotive business unit achieved some of its fi rst concrete successes resulting from our new modular approach. The aim of the modular approach is to offer our core assets – maps, traffi c and navigation – individual components independently of the hardware or platform used by customers. This will provide a broader set of opportunities to increase our presence in automotive markets.
We signed a deal with PSA Peugeot Citroën, which will offer its customers an infotainment system with TomTom’s location and navigation content and services from early 2015. In addition, we also signed deals with Chinese car manufacturer Qoros Auto and electric vehicle manufacturer Fisker to supply content, software or services.
Management Board Report | continued
Revenue 2012
by business unit
Revenue 2012
by category
Revenue 2012
by geography
Revenue 2011
by business unit
Revenue 2011
by category
Revenue 2011
by geography
7%
13% 60%
20%
5%
18%
66%11%
Consumer €639 million
Automotive €212 million
Licensing €133 million
Business Solutions €73 million
Consumer €833 million
Automotive €235 million
Licensing €142 million
Business Solutions €64 million
62%38% 68%32%
Hardware €657 million
Content & Services €400 million
Hardware €867 million
Content & Services €407 million
73%
7%
20% 74%20%
6%
Europe €773 million
North America €215 million
Rest of world €69 million
Europe €937 million
North America €257 million
Rest of world €79 million

7
Licensing
In the Licensing segment our revenue declined from €142 million in 2011 to €133 million in 2012, as a result of weaker sales to our third party PND and internet and mobile customers. We grew our sales to the GIS (geographical information system) market during the year. We demonstrated our commitment to the GIS markets by making our map database available in Esri’s fi le geodatabase format and by being the fi rst to come to the market with fully map-integrated 2010 US Census boundary data. We provide GIS professionals with seamless access to rich Census information for a variety of purposes, including geocoding, geo-marketing, site selection, and comprehensive demographic studies.
We continued to expand our maps coverage to more than 200 countries and territories globally, achieving navigable coverage in 112 countries and of 36.5 million kilometres of roads.
We had several announcements in the highly dynamic smartphone arena – a deal with Apple, who will license our maps and related content. Samsung decided to use our maps on its Wave3 smart phone, and RIM selected our real-time traffi c service for BlackBerry applications.
In the year we won a good number of deals for our real-time and historical traffi c information. These included the Automobile Association in the UK and the cities of Berlin and Rome. Working with our local partner Autonavi, we began offering real-time traffi c information services to the Chinese market.
We also launched a new Location Based Services (LBS) Platform and Developer Portal. This enables cloud-based LBS Platform developers to access TomTom’s location and navigation services – including map display, routing, traffi c and geocoding – in order to create location-enabled applications for a variety of commercial and consumer markets.
Business SolutionsBusiness Solutions showed double digit growth during the year and generated revenue of €73 million. At the end of the year Business Solutions had 19,000 customers, the largest managed fl eet management systems customer base in the world, and an installed base of 239,000 subscribers. This compares to 15,000 customers and an installed base of 180,000 subscribers at the end of 2011.
A new generation of WEBFLEET was introduced in the year. WEBFLEET customers were offered new reporting tools and a dispatching feature that helps businesses to respond more rapidly to customers. Some 87% of consumers experience late arrivals or deliveries from tradesmen and delivery fi rms. WEBFLEET services can now offer a signifi cant competitive advantage to service and delivery companies.
During the year, Business Solutions began to leverage its technological capabilities further by moving into the insurance and car leasing markets. The unit supplies the technology to support a new insurance product that bases premiums on driving behaviour.
Content & Services revenue reduced slightly from €407 million in 2011 to €400 million in 2012, or 38% of group revenue (2011: 32%). Licensing and Automotive map revenue decreased but we saw strong growth in Consumer’s LIVE Services subscriptions revenue and also higher WEBFLEET revenue in Business Solutions.
Revenue generated in EMEA accounted for 73% (2011:74%) of group revenue, while North America and the rest of the world contributed 20% (2011: 20%) and 7% (2011: 6%) respectively.
Gross result
—
The gross result decreased by 13% from €640 million in 2011 to €555 million in 2012 because of the decline in revenue. The gross margin increased by 2 percentage points to 52% year-on-year (2011: 50%), due to the higher proportion of Content & Services revenue in the overall revenue mix. The costs associated with rectifying a product issue and one-off releases in our provision balanced each other out, and together did not impact the gross margin.
Operating expenses
—
Total operating expenses for the year amounted to €484 million, a decrease of €580 million compared to 2011. Excluding the impact of a €512 million impairment charge and €15 million of restructuring charges recorded in 2011, the decrease was€53 million. This refl ected the success of cost reduction programmes across the company.
R&D expenses declined by 4% from €173 million to €166 million (2011: €167 million excluding restructuring charges). We maintained our investment in R&D despite the overall reduction in operating costs. We focused our investments on our core technology assets and projects that support our modular product offering strategy.
Marketing expenses decreased by 27% year-on-year from €78 million to €57 million (2011: €77 million excluding restructuring charges). While we scaled down our marketing spend this year in line with Consumer revenue development, we focused on campaigns on increasing awareness of the quality of our maps and traffi c information.

TomTom Annual Report and Accounts 20128
Through our cost saving initiatives we decreased our selling, general and administrative expenses from €209 million in 2011 to €170 million in 2012, a decrease of 19% (2011: €202 million excluding restructuring charges). We continued to simplify our legal and operating structure and increased operational effi ciency.
The table below presents developments in our operating expenses during 2010, 2011 and 2012.
Financial income and expenses
—
Net fi nancial expense for 2012 was €9.7 million (2011: €16 million). This consisted mainly of net interest expense of €12 million (2011: €22 million) and other fi nancial gains of €1.6 million (2011: €6.1 million). The decline in the net interest expense is mainly due to lower debt in 2012 as the result of repayments at the end of 2011 and throughout 2012. Other fi nancial gains consisted mainly of positive foreign currency revaluation results on our balance sheet items.
Taxation
—
In 2012 we had an income tax gain of €69 million compared to a charge of €13 million in 2011 (excluding the tax effect of the impairment and restructuring charges). The income tax gain results from a €80 million settlement we agreed upon with the Dutch tax authority on prior years’ tax discussions. Excluding the impact of this settlement, our effective tax rate in 2012 would have been 18.8%.
Net result
—
The net result for the year was €129 million, compared to a loss of €439 million in 2011. Excluding the impact of impairment, restructuring charges and the one-off tax gain the net result decreased by €24 million.
Liquidity and capital resources
—
Cash fl ow from operations amounted to €187 million in 2012, a decrease of 4% compared to €195 million in 2011. As a percentage of revenue, cash fl ow from operations increased from 15% in 2011 to 18% in 2012.
Capital expenditures amounted to €52 million in 2012. These consisted mainly of €43 million in investments in intangible assets and €9 million on property, plant and equipment.
On the fi nancing side, during 2012 we made a net repayment on our borrowings of €138 million.
Our cash position was €164 million as at 31 December 2012.
Debt fi nancing
—
On 31 December 2012 we made the fi nal repayment on the outstanding amount of the loan we entered into in 2008. At the same time we drew down on the new €250 million term loan.
Management Board Report | continued
600
500
400
300
200
100
2012201120100
Research & development expenses
Amortisation of technology and databases
Marketing expenses
Selling, general and administrative expenses
Stock compensation
13 8 7
197 202170
105 7757
162 167166
78 8584
0
100
150
200
250
350
400
Cash position31 December
2011
Operatingresult
Depreciation&
Amortisation
Workingcapital
Othernon-cashitems
Interest,taxes and
other
Investments Financing Cash position31 December
2012
194
70
111 10– 4 – 20– 51
– 146
164
Operating expenses1
(€ in millions)
Cash fl ow development
(€ in millions)
1 Excluding restructuring and impairment charges.

9
The new term loan is part of the forward-start facility arrangement we signed in April 2011. It includes a €150 million revolving credit facility, which remained unutilised on 31 December 2012. Netted with the transaction costs, the carrying amount of this €250 million loan at year end was €247 million.
Our net debt position on 31 December 2012 was €86 million, down from €194 million at the end of 2011. Our leverage ratio reduced from 0.9 at the end of 2011 to 0.5 in 2012.
Outlook
—
We expect the macro-economic situation to remain challenging. In this environment Consumer will focus on broadening its revenue base consistent with its brand while limiting the revenue decline from PNDs. We expect our core PND markets to decline by 15–20% in volume year over year. Automotive revenue development will largely depend on the new car sales and take rates of our current partners. For Licensing we expect revenue to be broadly stable. Business Solutions is expected to continue to grow strongly.
We will continue to maintain our efforts on and investments in technologies and projects that support our strategy and on further increasing our operational effi ciencies across all areas of our business.
The number of employees in 2013 is expected to be broadly fl at compared with 2012.
Human Resources
The goal of TomTom’s HR Strategy is to ensure that we employ highly talented people who are fully engaged in our business and who deliver high levels of personal performance at work. Our strategy is designed to enable all TomTom employees to work effectively and to enjoy their work. The strategy takes into account the fact that we operate in an ever changing, fast moving marketplace. It is therefore essential that we employ self-motivated people who have the skills and capabilities to deliver on challenging targets.
Our HR department develops and manages the careers of approximately 3,500 employees in 57 locations across 35 countries. It is also responsible for the development and delivery of all initiatives to attract and recruit new talent to the company.
TomTom believes in fairness. Our employment policies provide equal opportunities for all, regardless of age, gender, ethnicity, social background, religion, disability or sexuality.
Employee engagement programme
—
TomTom is currently operating several key HR initiatives as part of the company global employee engagement programme. The aim of these initiatives is to ensure that we are in a position to motivate and manage our employees proactively. They are:– Career Development– Communication– Management & Leadership– Organisation– Workplace Process and Policies – Compensation & Benefi ts
Career development The aim of our career development initiative is to motivate and retain employees by providing them with career opportunities and challenging work. Our policy is to assist in the development of our employees’ careers by promoting from within the company rather than hiring outside, wherever possible.
TomTom is committed to enabling our employees to develop their talents and realise their ambitions within the company. As part of this, we have a company-wide Talent Board in place which consists of senior executives. Its purpose is to assist in the development of succession plans and make key investment decisions relating to the career planning and talent development of the people who work for us. Our Succession Planning approach will enable us to identify and support a ready pipeline of talent that is capable of taking on challenging roles and management positions within the company in the future.
CommunicationDuring 2012 we completed the implementation of our enterprise social media platform. The platform enables employees to communicate with each other and to share knowledge across the company in a direct and interactive manner. It allows employees to connect with experts inside the company, collaborate with remote colleagues and brainstorm new ideas and concepts. To address site needs and concerns, we have established a community of site leaders within the company. The community consists of employees who are responsible for the coordination of activities at each of our 57 sites. The community enables senior management to ensure that headquarters is able to manage communications consistently. It also gives site leaders the opportunity to provide feedback on global processes and policies that may need adapting for local conditions.

TomTom Annual Report and Accounts 201210
Management & leadershipTomTom continues to place signifi cant emphasis on enabling our managers to manage people effectively. We fi rst introduced a consistent approach to training our managers in 2010. During 2012 we conducted workshops in America, Europe and Asia. To date, we have trained over 200 managers. As part of this initiative, we provide online access to a curriculum of training resources and seminars.
During the year we also developed and ran a leadership development programme for executives from across the business. The programme was developed in close cooperation with a global training provider, as well as a number of academics from a leading European business school. We received considerable positive feedback on this, and intend to run another leadership programme in 2013.
Organisation2012 saw the introduction of an effective new way of working for our engineering teams. In January, we reorganised our three large functional units into 11 smaller product units. Each product unit is tasked with engineering a specifi c product and also has full responsibility for bringing that product to market. The new model has brought signifi cant improvements in accountability and transparency to our engineering teams.
The leaders of the product units are assisted in their tasks by a product offi ce, which is led by TomTom’s Chief Technology Offi cer. The product offi ce supplies them with advice on high-level strategic product planning, covering such areas as the competitive environment and roadmaps. The product offi ce also assists in identifying dependencies and challenges between product units, as well as sharing best practices between product units.
During 2012, we continued to move a number of engineering and business support roles from the Netherlands to offi ces in Central Europe & India. As at the end of 2012, approximately 35% of our employees are based in the Netherlands. Overall, some 68% of our employees are based in EMEA, 21% in APAC and around 11% in the Americas.
Workplace process and policiesAs a company, we believe that our work processes and employment policies should enable employees to work as effectively as possible.
During 2012 we reviewed our employment policies and work processes. Where necessary, we realigned them with the company’s strategic objectives. We established cross-business task teams to improve processes and policies that were not fully optimal. We improved reporting tools for line managers which enable them to interact with headquarters more effectively and signifi cantly improve senior management’s ability to control the
strategic direction of our business worldwide. These improved processes are managed through a new automated system that makes use of state-of-the-art human resources management software.
This year we completed the implementation of our online recruitment portal. This ensures that all employees have access to information about vacancies within the company. The opportunities are also made more widely public through links to key social media websites – Facebook and LinkedIn. The portal can be accessed at tomtom.jobs.com.
Compensation and benefi tsWe believe that our remuneration strategy is a key element in our ability as a company to attract and retain talent. We therefore aim to provide fair, competitive and responsible pay for each of our employees. We achieve this on the basis of a framework for compensation and benefi ts that ensures that packages are consistent worldwide, while taking into account local differences.
Compensation
Compensation at TomTom is determined by a framework of job ranks and salary structures that applies across the company worldwide. The framework and salary structure harmonises the compensation and benefi ts of all TomTom employees and ensures consistency and equity for each individual employee. The job-ranking framework applies to all TomTom employees, while the salary framework is customised by country.
Our job grades framework enables us to compare our compensation and benefi ts packages with the markets within which TomTom competes for talent. Salaries are determined objectively in relation to market practice in each country. Our benchmarking analysis on the basis of job grades and content ensures that our employee’s compensation packages are competitive as compared to the other companies in our industry.
Bonus programmes
Our performance-related bonus plan was introduced in 2009. It links company performance to individual performance. Annual company fi nancial targets are set, and a bonus pool relating to these targets is determined. A bonus pool is determined on the basis of the annual fi nancial targets. If the company’s fi nancial targets are met, eligible employees are allocated an amount from the bonus pool in proportion to their performance. The performance-related bonus plan is a signifi cant part of every employee’s total cash compensation.
The bonuses paid vary according to the job grade to and refl ect the level of infl uence of each role in the execution of TomTom’s strategy. Our performance-related bonus plan is in line with TomTom’s vision, which is that success for our business should also mean success for the individual employee.
Management Board Report | continued

11
Our benchmark analysis of the salary and bonus potential of each employee results in a new set of bonus targets each year. These are differentiated by region and fairly refl ect pay practice in each region, as well as matching our global remuneration policy.
Long-term incentive programme
Long-term incentives are part of our remuneration policy, both for the Management Board as well as for our employees. They are intended to attract and retain key talent to the company while aligning their interests with those of our shareholders. In 2011 we added two new long-term incentives plans to our existing share option plan. The performance share plan and restricted stock plan have enabled us to continue offering share incentives to eligible employees at a reduced risk of dilution. All long-term incentive plans have a vesting period of three years.
Benefi ts
TomTom’s new benchmark analysis and job-grading framework have enabled us to harmonise the benefi ts packages enjoyed by our employees. The majority of our employees are now paid according to the same framework and principles. This assures them of equal opportunities within the company, as well as transparency as regards their own remuneration.
TomTom is committed to offering all employees a secure pension, and health and disability cover. Accordingly, our benefi t programmes focus primarily on these aspects and their application worldwide. We are committed to ensuring that our employees have access to quality pension, health and disability products, and we offer a product discount programme worldwide as part of our benefi ts package.
Corporate Social Responsibility (CSR)
Our global strategy for CSR was set in 2011, and focuses on three key areas:– Environmental impact. We aim to increase the positive
impact of our products on carbon dioxide emissions as well as to manage our own carbon emissions as a company.
– Supply chain. We aim to ensure that we behave in a socially responsible way towards our consumers, business customers and suppliers. This includes setting targets to meet current industry standards for the electronics manufacturing industry. The areas we cover are: supply chain management, labour conditions, human rights, health, safety and environment.
– Community giving. We aim to focus on donating our navigation products to selected charitable organisations in order to enable and enhance their work.
In 2012, we have taken signifi cant steps towards executing our strategy.
Environmental impact
—
We believe that the overall impact of TomTom on society is positive. TomTom products enable customers to drive more safely, save fuel and use time more effi ciently. All of these elements together help our customers to reduce carbon dioxide emissions, which contributes to improving the environment.
During 2012 we began quantifying the environmental impact of our products on the reduction of carbon dioxide emissions in 2012. The results were obtained using our own data and various public sources of information.
We have an installed base of approximately 44 million PNDs and over 200,000 subscribers to Business Solutions’ technology. We estimate that in 2012 these products may have prevented more than 2.3 million metric tons of carbon dioxide from being emitted into the environment. This compares to an estimated 200,000 metric tons of expected average emissions that resulted from all of the company’s activities that related to making and shipping these PNDs during the same period. The net saving in emission was therefore approximately 2.1 million metric tons of carbon dioxide.
To arrive at a clear view of the net environmental impact of using TomTom products, we used the greenhouse gas accounting and reporting standards established by the World Business Council for Sustainable Development. TomTom has now developed a complete corporate greenhouse gas emission inventory covering all the company’s activities.
The activities included in our calculations include running our offi ces as well as employee travel. Also included are product lifecycle related emissions such as the manufacturing, transportation, the use of energy resources when charging a device and end-of-life recycling of TomTom products and their packaging. On this basis, we have established that the total emissions of greenhouse gas that result from our day-to-day operations amounted to over 120,000 metric tons in 2012.
This comprehensive analysis has enabled us to quantify the positive impact of using TomTom products for the fi rst time. We believe that it demonstrates that the positive impact of our products is signifi cantly greater than our own organisational emissions.
TomTom Annual Report and Accounts 201212
Supply chain
—
TomTom outsources the manufacturing of all its PND and in-dash navigation systems, as well of its accessories and sportwatches. It also outsources its logistics and reverse logistics. Customer care and content production are partly outsourced. Our top 20 tier 1 suppliers operate in 13 countries. Up to 4,000 workers are involved in producing TomTom products.
As a company, we are committed to continuous improvement in our supply chain management practices. We believe that it is important that we meet relevant industry standards for the electronics manufacturing supply chain. In 2012, we completed a review of international standards for the ethical management of supply chains. We concluded that membership of the Electronics Industry Citizenship Coalition (EICC) would be effective in enabling us to meet our strategic objectives. At the end of the year, our membership of EICC was approved.
TomTom’s membership of the EICC demonstrates that we are committed to fully supporting the mission, vision, goals, bylaws and membership requirements of that organisation, as well as its Code of Conduct. Membership of the EICC gives us access to up-to-date research and methodologies with regard to international benchmarks on sustainability practices in the electronics industry. It will help us to progressively align our management of our supply chain with the most relevant standards for our industry. It will enable us to track our policies, targets and performance in relation to those standards and to calibrate them as they evolve. And fi nally, it will also allow us to participate with industry peers in key developments with regard to supply chain practices. Wherever possible, TomTom will seek to adopt the EICC approach and tools in practical ways and in the spirit of the industry’s common goals.
We note that the past four years have seen a dramatic growth in the adoption of new environmentally related product legislation. Compliance is crucial for our brand and business and we ensure that we always take suffi cient steps to achieve compliance. In 2012 we invested in a legislative tracking and management tool that comprehensively supports our internal processes for ensuring compliance with relevant environmental product legislation.
Community giving
—
In 2012, we piloted a programme focused on donating our products to charitable organisations that rely on vehicles to reach the communities they serve. All of the PNDs and/or map updates that were donated in 2012 were provided to charitable organisations that operate in areas that are related to our own business focus in some way: disaster emergency relief, the charitable care community, road safety and disadvantaged youth.
Management Board Report | continued
As a result of our donations, TomTom products have enabled recipient charities to achieve their missions.
TomTom PNDs are being used to enhance the response times of voluntary ambulance or community based nursing care services in a range of locations around the world including the UK, the United States and Switzerland. Using our navigation tools enables these organisations to administer critical care quickly and effi ciently. Though we initiated these donations relatively recently, they are already demonstrating the value and benefi t that TomTom products can have in assisting charitable organisations to save and enhance the lives. At the same time, our navigation tools also help them to be more effi cient, saving fuel and money. In 2011 we said that we were at the start of the next phase of our journey in CSR. This year we have established a solid foundation on which to build our CSR programmes. We will continue to drive the development and continuous improvement of these activities in line with our overall strategy.
For more details on our CSR programme please refer to http://corporate.tomtom.com/ethics.cfm.
Business Risks
Our group can be adversely affected by a variety of business risks and economic developments. A structured risk management process helps management to better understand how risks might impact the company and to take risks in a controlled manner. We update our business risk profi le every year in order to manage our most important risks.
We do not quantify these risks or specify a list of the top fi ve risks as we believe that the careful management of all these risks is important and that singling out particular risks could be misleading to investors. The sequence of risks below in no way refl ects an order of importance, vulnerability or materiality.
Approach to risk management
—
Our Executive Committee determines the risk management priorities for the group. Lead ownership for each risk is taken on by an Executive Committee member, which helps to achieve clear accountability for the mitigating actions. The Business Assurance department facilitates the annual assessment of business risks, which ensures an appropriate level of objectivity in our assessment of risks. The business risk profi le is taken into account when establishing our annual business plans and budgets.

13
Group risk profi le
—
Below is an overview of the business risks that we believe are most relevant to the achievement of our long-term goals and strategy. This overview is not exhaustive and should be considered in connection with forward-looking statements. There may be risks not yet known to us or which are currently not deemed to be material, which could later turn out to have a signifi cant impact on our business or have a material adverse effect on TomTom’s fi nancial condition, results of operations and liquidity.
Strategic risks
—
Changing competitive landscapeWe operate in a highly dynamic and competitive industry. Failure to adapt our organisation to industry trends or otherwise remain competitive could have a material adverse effect on our business and TomTom’s fi nancial condition, results of operations and liquidity.
Many of our current competitors are large, well-known organisations with greater fi nancial, technical and human resources than our group. They may have greater ability to fund product research and development and capitalise on potential market opportunities. New competitors interested in the same markets and products may also emerge.
We have entered into a number of strategic partnerships and joint ventures to bring competitive product and service offerings to market. If any of our strategic partners fail to perform as planned or if we fail to fi nd suitable partners for our business activities, we may be unable to bring our products and services to the market and maintain a competitive market position.
Global economicsThe majority of our sales are generated in Europe which makes us vulnerable to the economic challenges and fi scal austerity currently being experienced across the European Union in the wake of the global fi nancial crisis. The US is also an important market for us and any further deterioration in consumer demand as a result of the global economic climate would also have a negative impact on our fi nancial results.
The majority of our purchases are made in USD. Any devaluation of the euro against the USD would therefore have a negative impact on our profi tability. Although we use foreign exchange contracts to hedge activities, these are short term in nature.
The impact of global economic conditions on consumer demand could impair our ability to generate suffi cient cash fl ow to support our investment plans. These or other unforeseen macro-economic conditions may render us unable to implement
our strategic agenda as planned and consequently could have a material adverse effect on TomTom’s fi nancial condition, results of operations and liquidity.
Geographical sustainabilityCurrently the North American market offers substantial business opportunities to us, especially as regards sales of navigation solutions. We view maintaining and preferably growing market share as a vital element of being successful in the US market. However, macro-economic conditions and competitive effects may render us unable to maintain sales volume and profi ts in North America and retailer support for our products and services could decline, impacting our ability to maintain market share and average selling prices in the region.
Our aspiration to grow in high growth markets such as India, China and Brazil will expose us to additional political, social and economic risks. We cannot be certain that our products and services will meet consumer acceptance in these markets and we may be unable to realise our growth objectives in these emerging markets. If we are unable to maintain our market share in North America or realise our growth plans in emerging markets our anticipated revenues and profi ts could be adversely affected.
AutomotiveThe automotive market is continuously evolving with respect to navigation. Although the navigation experience for our end-users is similar, whether the navigation system is built in the dash or provided on a PND, the dynamics of supplying to the automotive industry are very different from those for delivering mass-market consumer electronics.
There are additional operational and technical challenges in growing our automotive business and maintaining profi tability over the longer term in such a rapidly evolving environment. Furthermore, new map providers may choose to enter the automotive market which could signifi cantly increase the level of competition we face. If we are unsuccessful in maintaining and growing a profi table automotive business, our fi nancial condition, results of operations and liquidity may be materially adversely affected.
Brand All our products and services are brought to market under one brand. This leads to brand concentration risk. Brand value can be severely damaged even by isolated incidents affecting the reputation of our business or our products and services. Some of these incidents may be beyond our ability to control and can erode consumer confi dence in our products or services.
Factors that negatively affect our reputation or brand image, such as adverse consumer publicity, inferior product quality or poor service, could have a material adverse effect on our fi nancial condition and results of operations.

TomTom Annual Report and Accounts 201214
We aim to bring the highest calibre people into our organisation. We have a rigorous recruitment process so that we can have high levels of confi dence in the people we hire. To retain talent within our organisation we monitor the organisational health of the company and have programmes in place to retain key employees. However, if we are unable to attract and retain the high calibre people we require, our ability to operate our business successfully could be signifi cantly impaired.
Supply chain We depend on a limited number of third parties and, in certain instances, on sole suppliers for component supply and manufacturing. Any disruption to or termination of our relationships with third party manufacturers, suppliers or distributors, or any reduction in their ability to supply our needs would adversely affect our business.
Our highest volume products rely on a system of dual-sourced production from two different manufacturing partners. However, our capacity to deliver innovative products to the market means that we will continue to be dependent to some extent on components that are only available from specifi c leading technology organisations. Single-source component risk will remain a part of our business model for the foreseeable future. If we are unable to source any critical components, particularly critical single-source components, our business could be signifi cantly impaired and our fi nancial condition, results of operations and liquidity could be materially adversely affected.
Product qualityOur industry is characterised by frequent technological advances. In order to remain competitive, we need to continuously innovate to introduce new and upgraded products and services. Diffi culties may be experienced that delay the development, introduction or market acceptance of our new or enhanced products.
Furthermore, we develop complex hardware and software products which may experience material defects, errors or failure. We have internal quality control standards and procedures to mitigate these risks that require our contract manufacturers to conduct additional quality control testing according to our standards and guidelines. However, should any of our products fail to operate as intended or otherwise experience quality problems our reputation and brand value may suffer and we may be exposed to increased operating costs and the possibility of signifi cant consumer product liability which could adversely affect our fi nancial condition, results of operations and liquidity.
Performance of real time services As part of our service to our customers, we provide real-time services such as WEBFLEET and HD Traffi c. To provide these services to our customers we rely on our own, as well as outsourced, information technology, telecommunications and other infrastructure systems.
InnovationOur markets are characterised by rapid technological change, which challenges us to deliver highly competitive products. We will continue to focus on producing high quality navigation solutions, but there can be no guarantee that our products will compete successfully against current or new market entrants or competing technologies.
Our success depends on our ability to rapidly develop, market and commercialise new and upgraded products and services. The timing of our new product and service releases, our ability to accurately forecast market demand, our product mix relative to that of our competitors and our ability to understand and meet changing consumer preferences are vital to this effort. Not meeting these challenges could have a material adverse effect on our fi nancial condition and results of operations.
Digital mappingThe competitive environment requires continuous investment in new technology for creating and updating map databases. Maps need to be continuously updated for changes in the environment and we are continuously adding new geographies to our map database to be able to meet the needs of existing customers, bring out new products and expand into new markets.
If we are unable to invest suffi ciently to compete in terms of both quality and coverage with other global map providers our business, our fi nancial condition, results of operations and liquidity may be materially adversely affected.
Dependency on GPS satellitesOur navigation products and services depend on GPS satellite transmissions that provide position data to our customers. GPSsatellites are funded and maintained by the US government. We have no control over their maintenance, support or repair. The availability and free use of GPS signals to the level of accuracy required for commercial use remains at the sole discretion of the US government. GPS signals are carried on radio frequency bands. Any reallocation of, or interference with these bands could impair the functionality of our products. Alternate systems are in various stages of development, but again these systems remain under the control of sponsoring governments and we cannot be certain that our products and services will be compatible with these new systems.
Operational risks
—
Human resourcesIn order to be a market leader in our industry you need to have the most talented people working effectively together. The success of our business depends on attracting, integrating and retaining highly skilled personnel in all business units and development centres.
Management Board Report | continued

15
A signifi cant disruption to the availability of these systems could cause interruptions in our service to customers, loss of, or delays in, our research and development work and/or product shipments. Any such service interruptions may occasion signifi cant reputational damage amongst customers and distributors and could have a material adverse effect on our fi nancial condition and results of operations.
NavigationThe navigation industry is shifting towards the provision of off-the-shelf map-based navigation components that require the minimum of integration effort and allow for differentiation by enabling these components to be combined and pre-integrated into proprietary ‘Connected Navigation Systems’.
Consumers and automotive manufacturers will increasingly expect cars and in particular car infotainment systems to be connected to the cloud and to provide a seamless user experience across different devices (car, smartphone, web) and relevant content and services such as real-time traffi c and routing, remote car diagnostics and an application store. If we are unable to develop products that allow us to compete successfully in the emerging world of the ‘connected car’, our future growth potential, our fi nancial position and results of operations could be materially adversely affected.
Disaster recovery planning We provide fl eet management services, live traffi c data and sales via our web store on a 24-hour basis. Unforeseen business disruptions could severely affect our business activities and the services we offer to our customers. Any permanent or temporary loss of these systems would result in reputational damage, loss of revenue and liabilities to our clients. In the case of a catastrophic disaster our company’s success rests on our ability to restore our critical data and rebuild our IT business systems.
We have business continuity and disaster recovery planning in place for certain systems and various eventualities. However, we are unable to plan for every possible disaster or incident. A major failure of a business critical system from which we are not able to quickly recover could have a material adverse effect on our fi nancial condition, results of operations and liquidity.
Legal and compliance risks
—
Intellectual property We rely on a combination of trademarks, trade names, patents, confi dentiality and non-disclosure clauses and agreements, copyrights and design rights to defend and protect our trade secrets and rights to the intellectual property in our products.
We may be faced with claims that we have infringed the intellectual property rights or patents of others, which if successfully asserted against us may result in us being ordered to pay substantial damages or forced to stop or delay the development, manufacture or sale of infringing products. Any such outcome could have a material adverse effect on our fi nancial condition, results of operations and liquidity. Furthermore, even if we were to prevail, any litigation could be costly and time-consuming.
Privacy of customer data The focus of our business providing location-based products and services to individual customers, growing public awareness and increased scrutiny by regulatory authorities, particularly in the EU, means that compliance with privacy regulations and customer expectations is increasingly important in maintaining our competitive position. While we anonymise the trace data we collect from our individual customers, and while our privacy programme is intended to ensure TomTom’s Privacy Principles are adhered to throughout our operations and in the design of our products and services, our reputation and brand may suffer if we fail to comply with privacy regulations or otherwise fail to meet our customers’ expectations in relation to privacy matters.
Information security The integrity of our intellectual property and the continuity of our business operations are substantially dependent on our ability to maintain security over confi dential information regarding our customers, employees, suppliers, proprietary technologies and business processes. Our information security programme requires that we deploy controls, processes and tools in our operations and products to maintain the confi dentiality, availability and integrity of such confi dential information. However, the volume and sophistication of information security threats continues to grow. Leaks of confi dential information, unauthorised use of our systems and networks or defective products could adversely affect our business and could have a material adverse effect on our fi nancial conditions, results of operations and liquidity.
Financial risks
—
Financial risks are presented in the 2012 Financial Statements on pages 45 to 47.
Corporate Governance
For the description of our corporate governance structure reference is made to the separate section on page 17.

TomTom Annual Report and Accounts 201216
Management Board Report | continued
In Control Statement and Responsibility Statement
The Management Board is responsible for TomTom’s risk management and internal control systems. The Management Board believes that the company maintains an adequate and effective system of risk management and internal control that complies with the Dutch Corporate Governance Code (the Code).
The internal control systems are designed to manage, rather than eliminate, the risk of failure to achieve business objectives and can provide reasonable, but not absolute, assurance against fi nancial loss or material misstatements in the fi nancial statements.
TomTom views the management of risk as a management activity. The Management Board reviews the effectiveness of TomTom’s systems of internal control relative to strategic, fi nancial, operational and compliance risks and discusses risk management and internal controls with the Audit Committee on at least a quarterly basis.
TomTom embeds risk management in its strategic business planning. A top-down approach is followed in which management identifi es the major risks that could affect the company’s business objectives – and assesses the effectiveness of the processes and internal controls in place to manage and mitigate these risks. For an overview of our most important business risks, please refer to the Business Risks section on pages 12 – 15. Assurance on the effectiveness of controls is obtained through management reviews, control self-assessments, internal audits and testing of certain aspects of the internal fi nancial control systems by the external auditors during their annual audit.
This, however, does not imply that TomTom can provide certainty as to the realisation of business and fi nancial objectives, nor can the approach taken by the company to internal control over fi nancial reporting be expected to prevent or detect all misstatements, errors, fraud or violation of law or regulations.
The key features of the systems of internal control are as follows:– Clearly defi ned lines of accountability and delegation of
authority are in place, together with comprehensive reporting and analysis against approved budgets.
– Operating risk is minimised by ensuring that the appropriate infrastructure, controls, systems and people are in place throughout the business.
– An organisational design is in place that supports business objectives and enables staff to be successful in their roles.
– Treasury operations manage cash balances and exposure to currency transaction risks through treasury policies, risk limits and monitoring procedures.
– A Code of Ethics is embedded in the TomTom culture and is accessible to all staff via the intranet.
The key controls over fi nancial reporting policies and procedures include controls to ensure that:– commitments and expenditures are appropriately authorised
by the Management Board– records are maintained which accurately and fairly refl ect
transactions– any unauthorised acquisition, use or disposal of TomTom’s
assets that could have a material effect on the Financial Statements are detected on a timely basis
– transactions are recorded as required to permit the preparation of fi nancial statements, and
– TomTom is able to report its fi nancial statements in compliance with IFRS.
The Management Board believes, based on the activities performed in 2012 and in accordance with best practice provision II.1.5 of the Code, that the risk management and control systems with regard to the fi nancial reporting risks have functioned effectively in 2012, and that the risk management and control systems provide reasonable assurance that the 2012 fi nancial statements do not contain any errors of material importance.
With reference to the statement within the meaning of article 5:25 (2c) of the Financial Supervision Act, the Management Board states that, to the best of its knowledge:– the annual fi nancial statements give a true and fair view of
the assets, liabilities, fi nancial position and profi t or loss of the company and the undertakings included in the consolidation taken as a whole; and that
– the Management Board Report includes a fair review of the development and performance of the business and the position of the company and the undertakings included in the consolidation taken as a whole, together with a description of the principal risks and uncertainties that the company faces.
Amsterdam, 12 February 2013
The Management Board– Harold Goddijn | CEO – Marina Wyatt | CFO – Alain De Taeye

17
TomTom takes its commitments to all stakeholders seriously. These include consumers, shareholders, employees and business partners. We aim to be as transparent and accountable as possible in our way of doing business. For this reason, TomTom has a corporate governance structure in place, which we monitor closely.
As a listed company, TomTom is subject to the Dutch Corporate Governance Code (the Code). Our Management Board and Supervisory Board have striven to comply with the guidelines laid down in the Code and will continue their efforts to do so. Any substantial change in TomTom’s corporate governance structure will be explained to the shareholders at an Annual General Meeting.
The Corporate Governance Code
—
We apply all of the relevant provisions of the Code. There are two exceptions, which we explain below.
– Options granted to members of the Management Board under the 2005 Share Option Plan prior to 31 December 2005 vest unconditionally and can be exercised after a three-year period following the grant date. No predetermined performance criteria were established for these share options, as the industry of portable navigation was at a relatively nascent stage and we believed that setting credible, pre-determined performance criteria would not be practicable at that time. This is not in line with best practice provision II.2.4, which provides that the number of options granted shall be dependent on the achievement of challenging targets specifi ed beforehand.
Options granted to the Management Board members in 2009 and 2010 under the TomTom Management Board Stock Option Plan 2009 vest as follows: one third of the options granted vest after one year, another one third vest after two years and the fi nal one third vests after three years following the grant date. This vesting timeline is not in line with best practice provision II.2.4. At the time the plan was introduced, we were operating in a rapidly changing environment that was highly competitive. The plan was designed to attract people of the highest calibre and retain key talent in the company. We also wanted to align TomTom’s long-term incentives with common practice amongst international companies operating in the technology sector. To ensure that the plan fulfi lled this aim, in 2009 and 2010 the company opted for the vesting timeline outlined above. The vesting timeline of the plan was amended at the Annual General Meeting in 2011 (the Management Board Stock Option Plan) to emphasise the long-term retention element of the plan and align it with the Code.
As a result, all options granted under the Management Board Stock Option Plan vest three years after the grant date. This is in line with the requirements of the Code. The number of options that vest is subject to the achievement of pre-determined performance criteria. Options vested under this plan can be exercised during a period of seven years following the grant date.
– Best practice provision IV.1.1 provides that a company’s General Meeting may pass a resolution to set aside the binding nature of a nomination for the appointment of a member of the Management Board or the Supervisory Board and/or a resolution to dismiss a member of the Management Board or of the Supervisory Board by an absolute majority of the votes cast. It may be provided that this majority should represent a given proportion of the issued capital, which proportion may not exceed one third of the issued share capital.
TomTom’s Articles of Association provide that a binding nomination for the appointment of members of the Management Board or of the Supervisory Board may only be set aside by a resolution of the General Meeting passed with a two-thirds majority representing more than 50% of its issued share capital. The same provision applies to any resolution to dismiss a member of the Management Board or of the Supervisory Board. The company deviates from the best practice provision outlined in the preceding paragraph because it believes that maintaining continuity in its Management Board and Supervisory Board is critical for delivering long-term shareholder value. The company would like to protect its stakeholders against a sudden change in management by maintaining the qualifi ed majority and voting quorum requirement, which is consistent with Dutch law.
Management Board
—
General The Management Board is responsible for the day-to-day management of the operations of the company. Its responsibilities involve setting and achieving the company’s strategic objectives, managing the company’s strategic risks, legal compliance and corporate social responsibility matters insofar as these are relevant to the company’s business. In these areas the Management Board is accountable to the Supervisory Board and to the General Meeting. In performing its duties, the Management Board is guided by the interests of the company, taking into consideration the interests of the company’s stakeholders as a whole. The Management Board must provide the Supervisory Board with all information necessary for the exercise of the duties of the Supervisory Board in a timely manner. Furthermore, the Management Board must consult with the Supervisory Board on important matters and submit important decisions to the Supervisory Board for its prior approval.
Corporate Governance

TomTom Annual Report and Accounts 201218
Corporate Governance | continued
Composition and appointment
The Articles of Association provide that the Management Board must consist of at least two members. Each member of the Management Board is appointed for a maximum period of four years and may be re-appointed for another period of not more than four years.
The General Meeting appoints the members of the Management Board, subject to the right of the Supervisory Board to make a binding nomination. The General Meeting may at all times, by a resolution passed with a majority of at least two-thirds of the votes cast, and representing more than 50% of the issued share capital, resolve that the nomination submitted by the Supervisory Board is not binding. In such a case, the General Meeting may appoint a member of the Management Board in contravention of the Supervisory Board’s nomination by a resolution passed with a majority of at least two-thirds of the votes cast, representing more than 50% of the issued share capital. If the Supervisory Board fails to use its right to submit a binding nomination, the General Meeting may appoint members of the Management Board with a majority of at least two-thirds of the votes cast, representing more than 50% of the issued share capital.
A resolution of the General Meeting to suspend or dismiss members of the Management Board requires a majority of at least two-thirds of the votes cast, representing more than 50% of the company’s issued share capital.
Members of the Management BoardBiographies of the members of the Management Board, as well as other details relating to their careers can be found in the Profi les of the Management Board section on page 23.
RemunerationUpon a proposal by the Remuneration Committee, the Supervisory Board determines the remuneration of the individual members of the Management Board in accordance with the Remuneration Policy for the Management Board. This policy was adopted in 2009 and amended by the Annual General Meeting in 2011.The Supervisory Board must present any plan providing for the remuneration of the members of the Management Board in the form of shares and options to the General Meeting for approval. For further information about the remuneration of the members of the Management Board, see the Remuneration Report included in the Supervisory Board Report, as well as note 7 to the consolidated fi nancial statements.
Confl icts of interestsMembers of the Management Board must report any (potential) confl ict of interests to the Chairman of the Supervisory Board, and provide all relevant information. The Supervisory Board shall decide whether a confl ict of interests exists. The member of the Management Board who has the (potential) confl ict of interests
may not be present at such meetings. During 2012, no such confl icts of interests were reported.
Supervisory Board
—
GeneralThe main task of the Supervisory Board is to supervise the activities of the Management Board and the company’s general course of affairs and its business. The Supervisory Board may on its own initiative provide advice to the Management Board. The Management Board can also request the Supervisory Board’s advice. The Supervisory Board acts in the interest of our company as well as that of its stakeholders as a whole in performing its duties.
The Articles of Association require that certain decisions of the Management Board be subject to the approval of the Supervisory Board. Resolutions of the Management Board to issue shares, grant rights to acquire shares or to restrict or exclude pre-emptive rights require prior approval of the Supervisory Board. Other resolutions requiring such approval include amongst others (i) proposals to amend the Articles of Association; (ii) proposals to conclude a legal merger or a legal demerger; and (iii) proposals to reduce the issued share capital.
Composition and appointment The Articles of Association provide that the Supervisory Board should consist of three or more members. Each member of the Supervisory Board is appointed for a maximum of four years. This appointment can be renewed for two additional periods of not more than four years. The General Meeting appoints the members of the Supervisory Board, subject to the right of the Supervisory Board to make a binding nomination.
The General Meeting may at all times, by a resolution passed with a majority of at least two-thirds of the votes cast, and representing more than 50% of the issued share capital, resolve that the nomination submitted by the Supervisory Board is not binding. In such cases, the appointment of a member of the Supervisory Board in contravention of the nomination requires a resolution of the General Meeting adopted with a majority of at least two thirds of the votes cast, representing more than 50% of the issued share capital. The Supervisory Board appoints a Chairman and a Deputy Chairman from amongst its members. The members of the Supervisory Board retire periodically in accordance with a rotation plan. A resolution of the General Meeting to suspend or dismiss members of the Supervisory Board requires a majority of at least two-thirds of the votes cast, representing more than 50% of the issued share capital.
The Supervisory Board has determined a profi le regarding its size and composition taking into account the nature of TomTom’s

19
business, its activities and the desired expertise. The Supervisory Board aims for a diverse composition and will strive for a fair balance between experience, expertise, gender, age and background. When nominating a candidate for (re-)appointment, however, the qualifi cations of the candidate and the specifi c requirements of the positions to be fi lled will prevail.
The Supervisory Board profi le and other rules and regulations covering its decision-making process are posted on TomTom’s corporate website.
Members of the Supervisory BoardBiographies of the members of the Supervisory Board, as well as other details relating to their careers can be found in the Profi les of the Supervisory Board section on page 24.
Shareholders Cyrte Investments BV and Janivo Holding BV together have the right to nominate a candidate for an additional seat on the Supervisory Board. This right was not exercised in 2012.
The Supervisory Board confi rms that its current composition has the necessary experience, expertise and independence to ensure that its members are able to properly execute their duties. All appointments were made in accordance with the Supervisory Board profi le resulting in the current composition of the board. The Supervisory Board is of the opinion that the addition of a female Supervisory Board member would be greatly benefi cial to its functioning and would mirror the profi le of the company’s Management Board and senior management. Therefore the Supervisory Board commits to doing its utmost to identify and nominate a female candidate on the company’s Supervisory Board.
The committeesThe Supervisory Board has established an Audit Committee, a Remuneration Committee and a Selection and Appointment Committee. Each of these committees is staffed by members of the Supervisory Board.
The Audit Committee oversees all activities of the Management Board that relate to the company’s internal risk management and control systems. These include the operation of codes of conduct, the provision of fi nancial information by the company, the performance of our external auditor and internal audit function, the policy of the company on tax planning, the fi nancing of the company and the use of information and communication technology.
The Remuneration Committee formulates proposals for the Remuneration Policy for the Management Board, which it submits to the Supervisory Board. The Remuneration Committee also formulates proposals for the remuneration of the individual
members of the Management Board and prepares the remuneration report that is included in the annual report.
The Selection and Appointment Committee oversees the drawing up of selection criteria and appointment procedures for Supervisory Board members and Management Board members. It assesses the size and composition of the Supervisory Board and the Management Board, formulates proposals concerning the profi le and composition of the Supervisory Board and makes proposals for appointments and re-appointments. Succession planning for senior management in general, and related topics, are another focus of the Selection and Appointment Committee.
The terms of reference of each committee can be found on our corporate website.
RemunerationThe remuneration of the Supervisory Board members and the additional remuneration for the Chairman and the members of its committees is determined by the General Meeting. Members of the Supervisory Board are not authorised to receive any payments under the company’s pension or bonus schemes or under the option or share plans.
The annual remuneration of the Supervisory Board and sub-committees membership remained unchanged during 2012. The annual remuneration of the Chairman of the Supervisory Board is €50,000; the other Supervisory Board members receive €40,000. The annual remuneration for the Chairman of the Audit Committee is €10,000, while the other members of the committee receive €7,000. The annual remuneration of the Chairman of theRemuneration Committee and of the Chairman of the Selection and Appointment Committee is €7,000, while the other membersof these committees receive €4,000. The remuneration of Supervisory Board members and committee members is proportional to the number of months served. The aggregateremuneration of the Supervisory Board members in 2012 amounted to €304,000.
For more detailed information about the remuneration of individual members of the Supervisory Board see note 7 to the consolidated fi nancial statements.
Confl icts of interestsMembers of the Supervisory Board (excluding the Chairman) must report any (potential) confl ict of interests to the Chairman of the Supervisory Board, and provide all relevant information. Where the (potential) confl ict of interests involves the Chairman of the Supervisory Board it must be reported to the Deputy Chairman of the Supervisory Board. The Supervisory Board shall decide whether a confl ict of interests exists. The member of the Supervisory Board who has a (potential) confl ict of interest may not be present at such meetings. No member of the Supervisory Board may take

TomTom Annual Report and Accounts 201220
Corporate Governance | continued
part in any discussions or decision-making relating to a subject or a transaction in which he has a (potential) confl ict of interest with the company. Such transactions are disclosed in the annual report. No such confl icts of interest were reported during 2012.
ShareholdingsRob van den Bergh owns 5,000 shares in the company. These shares are held as a long-term investment within the meaning of best practice provision III.7.2 of the Code and were not granted as part of his remuneration.
General Meeting
—
Functioning of the General MeetingThe Annual General Meeting must be held within six months of the end of each fi nancial year. The compilation of the annual report is a recurring agenda item, as are the adoption of the annual accounts and the release from liability of the members of the Management Board and Supervisory Board. When the company’s interests so require, an Extraordinary General Meeting may be convened by resolution of the Management Board or the Supervisory Board.
Shareholders may appoint a proxy who is then empowered to vote on their behalf in the General Meeting.
The minutes and the resolutions of the General Meeting are recorded in writing. The minutes will be made available to the shareholders on our corporate website no later than three months after the meeting.
Voting rightsEach of our ordinary shares and preferred shares is entitled to one vote. Shareholders may vote by proxy. The voting rights attached to any company shares held by the company are suspended as long as they are held in treasury.
Resolutions of the General Meeting are adopted by an absolute majority of votes cast except where Dutch law or our Articles of Association provide for a special majority.
According to our Articles of Association, the following decisions of the General Meeting require a majority of at least two thirds of the votes cast, representing more than 50% of our issued share capital:– resolution to cancel a binding nomination for the appointment
of a member of our Management Board or Supervisory Board;– resolution to appoint a member of the Management Board
or Supervisory Board in contravention of the list of nominees submitted by the Supervisory Board; and
– a resolution to dismiss or suspend a member of the Management Board or Supervisory Board.
In addition, in accordance with Dutch law, our Articles of Association provide that, if less than 50% of our issued share capital is represented at the meeting, certain decisions of the General Meeting require a majority of at least two-thirds of the issued capital represented. This includes decisions of our General Meeting regarding:– the restriction and exclusion of pre-emptive rights, or the
designation of the Management Board as the authorised body to exclude or restrict such rights;
– the reduction of our issued share capital; and – a legal merger or demerger of the company.
Amendment of the Articles of AssociationThe General Meeting may resolve to amend the Articles of Association of the company if it acts on a proposal by the Management Board that has also been approved by the Supervisory Board.
A resolution of the General Meeting to amend the Articles of Association requires an absolute majority of votes cast irrespective of the share capital represented at the General Meeting.
The capital structure
The company’s authorised share capital amounts to €180,000,000 and is divided in 600,000,000 ordinary shares with a nominal value of €0.20 each and 300,000,000 preferred shares, with a nominal value of €0.20 each. On 31 December 2012, a total of 221,895,012 ordinary shares were in issue.
Issue of sharesThe Management Board has the power to issue shares or grant rights to acquire shares if so designated by the General Meeting or our Articles of Association. This Management Board resolution is subject to the prior approval of the Supervisory Board. No resolution of the General Meeting or the Management Board is required for an issue of shares pursuant to the exercise of a previously granted right to subscribe for shares.
The Management Board continues to believe it is in the company’s best interests that it should be in a position to react promptly when business opportunities arise that require the issue of ordinary shares. When such occasions arise, the Management Board therefore wishes to be authorised to issue ordinary shares and to grant rights to subscribe for such shares without the need to obtain prior approval from company shareholders at an Extraordinary General Meeting. Such meetings would take time to convene. They could also generate disruptive market speculation.
In April 2012 the Annual General Meeting passed a resolution extending the Management Board’s authorisation to resolve to issue ordinary shares or grant rights to subscribe for such shares until 26 October 2013. This authority is limited to 10% of the number of issued ordinary shares for general purposes (or limited

21
to 20% in case of a merger or acquisition) and to restrict or exclude the pre-emption rights for existing shareholders for such issue or grant of rights. Separately, the Management Board has been authorised to grant rights to subscribe for ordinary shares and to restrict or exclude the pre-emption rights for existing shareholders for those rights, up to 4,620,000 ordinary shares for the purpose of executing the TomTom Employee Stock Option Plan and the Management Board Stock Option Plan. The authorisation was subject to the prior approval of the Supervisory Board. It was granted for a period starting from the 2012 Annual General Meeting and ending with the Annual General Meeting to be held in 2013.
In addition to the authorisations referred to above, the Management Board has been granted authority to issue preferred shares or to grant rights to subscribe for preferred shares and to restrict or exclude existing shareholders’ pre-emption rights for those rights. The authorisation was subject to the prior approval of the Supervisory Board and applies until 26 October 2013.
For further information on this authority of the Management Board, see the protection mechanism section below.
Repurchase by the company of its own sharesDuring the 2012 Annual General Meeting, the Management Board was authorised to acquire shares in the capital of the company up to 10% of the issued share capital. The authorisation was granted for a period of 18 months, and will be in effect until 26 October 2013.
Protection mechanismFoundation Continuity TomTom
A foundation, the Stichting Continuïteit TomTom (the Foundation) was established on 26 May 2005 to act as an instrument that protects the company against hostile takeovers and to protect the company’s interests in a variety of other situations. The purpose of the Foundation is to safeguard the company’s interests and those of its subsidiaries, as well as the interests of all stakeholders of the organisation. It does so by ensuring that the company is in a position to resist infl uences which could affect its independence, continuity and/or corporate identity in any manner that would be in contravention of the interests of the company or its stakeholders.
The company has granted the Foundation a call option (the Call Option) entitling it to subscribe for preferred shares. The authority is limited to 50% of the aggregate outstanding share capital (excluding issued and outstanding preferred shares) of the company at the time of issue. An issue of preferred shares in the manner described would cause substantial dilution to the voting power of any shareholder whose objective was to gain control of the company.
We believe that such an issuance of preferred shares or the granting of rights to subscribe for preferred shares to the Foundation may help to prevent, discourage or otherwise delay unsolicited attempts to obtain (de facto) control of the company. We also believe that these measures will strengthen our position in relation to potential bidders, and allow us to seek alternatives. Currently there are no preferred shares outstanding.
The Management Board of the company and the Board of the Foundation declare that the Foundation is independent vis à vis the company.
Management Board authority to issue additional preferred shares
As mentioned above, during the Annual General Meeting held in April 2012, a resolution was passed to extend the authority of the Management Board to issue preferred shares, to grant rights to subscribe for such shares and to restrict or exclude the pre-emption rights for existing shareholders for those rights until 26 October 2013. The aforementioned authority is limited to 50% of the aggregate outstanding share capital (excluding issued and outstanding preferred shares) of the company at the time of issue.
The members of the Management Board believe that there may be circumstances in which they and the Supervisory Board feel that the interests of the company and its stakeholders require the issue of additional preferred shares. They may believe, for example, that the Foundation is not able to acquire a suffi cient number of preferred shares to be effective in its function. Also a situation could occur whereby the Foundation has already exercised its Call Option and subsequently the preferred shares have been cancelled. As with the instrument in place for the Foundation, any possible issuances of preferred shares will be temporary and subject to the company’s Articles of Association and the legislation on takeovers.
Pursuant to the Articles of Association, a resolution of our Management Board to issue preferred shares or to grant rights to subscribe for preferred shares, as a result of which the aggregate nominal value of the issued preferred shares will exceed 50% of the issued capital of ordinary shares at the time of issue, will at all times require the prior approval of the General Meeting.
Upon the issue of preferred shares, subscribers for preferred shares must pay at least 25% of the nominal value of the preferred shares. Each transfer of preferred shares requires the approval of the Management Board and Supervisory Board. No resolution of the General Meeting or the Management Board is required for an issue of preferred shares pursuant to the exercise of a previously granted right to subscribe for preferred shares (including the right of the Foundation to acquire preferred shares pursuant to the Call Option).

TomTom Annual Report and Accounts 201222
Mandatory statement within the meaning of the
Governmental Decree of 20 March 2009 on Corporate
Governance
—
The Management Board states that all the information required under the Dutch Governmental Decree of 20 March 2009 on Corporate Governance is disclosed in the Corporate Governance section of this annual report to the extent that it is applicable to TomTom.
The main characteristics of the company’s internal risk management measures and control systems connected to its fi nancial reporting process are described in the Internal Control section of this annual report.
Corporate Governance | continued
The issuance of preferred shares is intended as a temporary measure. Unless the preferred shares have been issued by a vote of the General Meeting, our Articles of Association require that a General Meeting be held within six months after the issue of preferred shares to consider their purchase or withdrawal. If no resolution on the purchase or withdrawal of the preferred shares is adopted at such a General Meeting, a General Meeting will be held every six months thereafter for as long as preferred shares remain outstanding.
Obligations of shareholders to disclose holdings
—
Under the Financial Supervision Act, any person who acquires or disposes of certain threshold interests in the capital and/or the voting rights of the company, must give written notice of such acquisition or disposal. This applies where the percentage of capital interest and/or voting rights held by such a person as a result of such acquisition or disposal meets, exceeds or falls below 5%, 10%, 15%, 20%, 25%, 30%, 40%, 50%, 60%, 75% and 95% of the company’s issued and outstanding share capital.
To the best of our knowledge, as of 31 December 2012 no person or legal entity held an interest in our ordinary share capital and/or voting rights of more than 5% other than:– Harold Goddijn 12% – Corinne Goddijn-Vigreux 12% – Pieter Geelen/Stichting Beheer Moerbei 12% – Peter-Frans Pauwels/Stichting Beheer Pillar Arc 12% – Flevo Deelnemingen IV BV (Cyrte/Janivo) 10% – BNP Paribas Investment Partners SA 5%
These fi gures are derived from the AFM register of substantial holdings.
Decree Article 10 of the EU Takeover Directive
—
The Management Board states that all the information required under Article 10 of the EU Takeover Directive Decree is disclosed in the Corporate Governance section of this annual report to the extent that it is applicable to TomTom.

23
Profi les of the Management Board
HAROLD GODDIJN (52) | Chief Executive Offi cer
Nationality | Dutch Year of fi rst appointment | 2001
Current term of offi ce | AGM 2009 – AGM 2013
Education and former positions | Having studied Economics at the University of Amsterdam, Harold started his career with a
venture capital fi rm. He then founded Psion Netherlands BV in 1989 as a joint venture with Psion plc. He co-founded TomTom with
Peter-Frans Pauwels and Pieter Geelen in 1991. In 1998 he was appointed Managing Director of Psion Computers and served on the
Board of Psion plc from 1998 to 1999.
MARINA WYATT (49) | Chief Financial Offi cer
Nationality | British Year of fi rst appointment | 2005
Current term of offi ce | AGM 2009 – AGM 2013
Education and former positions | Marina is a Cambridge University graduate, a Chartered Accountant and a Fellow of the Institute
of Chartered Accountants in England and Wales. Having spent nine years with Arthur Andersen in the UK and US, Marina joined Psion
Plc as Group Controller in 1994 and became Chief Financial Offi cer in 1996. She was also a Non-Executive Director of Symbian and of the
publishing company Blackwell Science. In 2002 Marina was appointed Chief Financial Offi cer of Colt Telecom plc.
ALAIN DE TAEYE (55)
Nationality | Belgian Year of fi rst appointment | 2008
Current term of offi ce | AGM 2012 – AGM 2016
Education and former positions | Alain graduated from the University of Ghent as an engineer-architect. He founded Informatics
& Management Consultants (I&M) where he continued his research work on digital map databases and routing, while continuing
his IT consultancy work. I&M was integrated into the Dutch Tele Atlas group in 1989. From 1990 Alain headed the Tele Atlas group,
successfully introducing the company on the Frankfurt and the Amsterdam Stock Exchanges. In 2008, TomTom acquired Tele Atlas.

TomTom Annual Report and Accounts 201224
Profi les of the Supervisory Board
KAREL VUURSTEEN (71) | Chairman
Nationality | Dutch Date of fi rst appointment | 25 April 2007
Current term of offi ce | AGM 2010 – AGM 2014
Former positions | Member, Vice Chairman and Chairman of the Executive Board of Heineken NV
Current positions | Member of the Board of Directors of Heineken Holding NV, Chairman of the Supervisory Board of Akzo Nobel NV
and member of the Shareholders’ Committee of Henkel AG & Co. KGaA
Committees | Remuneration Committee, Selection and Appointment Committee (Chairman)
DOUG DUNN (68) | Deputy Chairman
Nationality | British Date of fi rst appointment | 13 May 2005
Current term of offi ce | AGM 2011 – AGM 2015
Former positions | Chief Executive Offi cer and President of ASML Holding NV
Current positions | Non-Executive Director of Soitec SA and Vice Chairman of the Supervisory Board of BE Semiconductor Industries NV
Committees | Audit Committee
GUY DEMUYNCK (61)
Nationality | Belgian Date of fi rst appointment | 13 May 2005
Current term of offi ce | AGM 2012 – AGM 2016
Former positions | Member of the Board of Management of Koninklijke KPN NV, Chief Executive Offi cer of Kroymans Corporation BV
and Chief Executive Director of Liquavista BV
Current positions | Non-Executive Director of Belgacom NV, member of the Supervisory Board of Apollo Vredestein BV, Xsens Holding
BV, Teleplan International NV and Divitel BV and Chairman of the Supervisory Board of Aito BV
Committees | Remuneration Committee (Chairman), Selection and Appointment Committee

25
ROB VAN DEN BERGH (62)
Nationality | Dutch Date of fi rst appointment | 25 April 2007
Current term of offi ce | AGM 2011 – AGM 2015
Former positions | Member, Vice Chairman and Chairman of the Executive Board of VNU NV (currently Nielsen Media Research BV)
Current positions | Chairman of the Supervisory Board of NVDU Acquisition BV and Stichting Holding Isala Klinieken and member of
the Supervisory Board of Koninklijke Ahold NV, Holding Nationale Goede Doelen Loterijen NV (Postcode Loterij) and Pon Holdings BV
Committees | Audit Committee
BEN VAN DER VEER (61)
Nationality | Dutch Date of fi rst appointment | 1 October 2008
Current term of offi ce | AGM 2012 – AGM 2016
Former positions | Member and Chairman of the Board of Management KPMG
Current positions | Non-Executive Director of Reed Elsevier Group plc and Reed Elsevier plc and member of the Supervisory Board
of Reed Elsevier NV, AEGON NV, Siemens Nederland NV and Koninklijke FrieslandCampina NV
Committees | Audit Committee (Chairman)
PETER WAKKIE (64)
Nationality | Dutch Date of fi rst appointment | 28 April 2009
Current term of offi ce | AGM 2009 – AGM 2013
Former positions | Member of the Executive Board of Koninklijke Ahold NV
Current positions | Founding partner at SPINATH+WAKKIE, Deputy Chairman of the Supervisory Board of Wolters Kluwer NV
and member of the Supervisory Board of ABN AMRO Group NV, ABN AMRO Bank NV and BCD Holdings NV
Committees | Remuneration Committee, Selection and Appointment Committee

TomTom Annual Report and Accounts 201226
Supervisory Board Report
General
—
The Supervisory Board consists of the following six members: Karel Vuursteen (the Chairman), Doug Dunn, Guy Demuynck, Rob van den Bergh, Ben van der Veer and Peter Wakkie. The information as prescribed by art. III.1.3 of the Code can be found in the Profi les of the Supervisory Board section on page 24 and are as such part of this Supervisory Board Report.
The Supervisory Board is responsible for supervising the activities and decisions of the Management Board. The Supervisory Board is also responsible for the supervision of the general conduct of the company’s business. It may provide advice to the Management Board at the request of its members and on its own initiative. In performing its duties, the Supervisory Board is guided by the interests of the company and its businesses, taking into account the interests of TomTom’s stakeholders as a whole and at the same time applying the principles of good entrepreneurship. The key elements of the role and responsibilities of the Supervisory Board are set out in the Supervisory Board rules and can be found on the TomTom website.
In addition, the Audit Committee, the Remuneration Committee and the Selection and Appointment Committee prepare and assist in the decision-making process of the Supervisory Board. Each of these committees is composed of members of the Supervisory Board. The chairs of these committees work closely with senior management of the company and conduct regular face-to-face meetings to set the agendas and prepare all relevant information for the committee meetings. Meetings of the Supervisory Board are preceded by committee meetings. A summary of the deliberations and proposed resolutions of the committees is discussed at the beginning of every Supervisory Board meeting. The minutes of the committee meetings are distributed to all Supervisory Board members. A full description of the tasks of the committees can be found in the Corporate Governance section.
The Supervisory Board confi rms that all its members are independent within the terms of best practice provision III.2.2 of the Dutch Corporate Governance Code (the Code).
The requirements for the size and composition of the Supervisory Board are refl ected in the Supervisory Board profi le, which can be found on the TomTom website.
Biographies of the members of the Supervisory Board, as well as other details relating to their careers can be found in the Profi les of the Supervisory Board section on page 24. The section also provides details on the committees of the Supervisory Board.
Activities 2012
—
Meetings and meeting structureDuring 2012 the Supervisory Board held ten meetings. One meeting was focused on the company’s governance and strategy. Nine meetings were attended by the Management Board. Four meetings were held by conference call. The conference calls were scheduled to discuss fi nancial updates and recent developments within the company in the months when there was no physical Supervisory Board meeting.
The agenda for the meetings was prepared through consultation between the Chairman, the Management Board and the Company Secretary. The company’s strategy features on the agenda of each of these meetings, as well as fi nancial reviews, (annual) budgets, press releases, operational updates and the R&D programme.
To facilitate open and productive discussion, senior management provides the Supervisory Board with comprehensive quarterly reports that outline the developments, achievements, challenges and opportunities in each business unit of the company before each physical meeting.
During the year senior management was frequently invited to make presentations on a range of topics to the Supervisory Board. Members of the Supervisory Board, the Management Board and senior management held several meetings that were not part of the formally scheduled meetings and calls. These informal consultations ensured that the Supervisory Board was well informed about the running of the business.
The Supervisory Board held several discussions without the presence of members of the Management Board. These included meetings to review the composition and functioning of the Management Board and the performance and remuneration package of its individual members. Also discussed was the succession planning of the Management Board and the Supervisory Board.
The meetings of the Supervisory Board achieved an overall average attendance rate of 85%. It was confi rmed by the Supervisory Board that the members were able to devote suffi cient attention to the company. No member was frequently absent from meetings of the Supervisory Board. Absences from meetings did not impact the functioning of the Supervisory Board.
The Works Council met with two members of the Supervisory Board in April and October. The April meeting focused on the R&D structure, which was introduced to optimise the company’s focus on its products. The focal point of the October meeting was the introduction of newly elected Works Council members and progress in realising the company’s objectives. Feedback received from the Works Council during these meetings adds signifi cant value to the Supervisory Board’s functioning.

27
The assessment included reviews of the composition and expertise of the Supervisory Board, its time management, how they were supported by the company, the dynamics within the board and its succession planning. The Supervisory Board’s oversight on the company’s strategy, risk management and internal controls were also reviewed.
On the basis of these reviews anonymous reports were compiled which were evaluated and discussed in a separate meeting of the complete Supervisory Board. No member of the Management Board was present at this meeting. Recommendations for improvement and suggestions for their implementation were recorded; amongst others gaining more in-depth market insight to keep up with the rapid technological developments. The evaluation of the Chairman was discussed by the entire Supervisory Board, without the Chairman present. The Supervisory Board intends to bring a third party in to assess its functioning every three years.
At its quarterly meetings the Supervisory Board also discussed corporate governance matters, reviewed foreseeable and new legislation and their possible impact on the company.
Remuneration report
—
The Remuneration Committee met four times in the course of 2012, with an overall attendance rate of 92%. Each meeting was also attended by Alain De Taeye and the VP Compensation and Benefi ts. Preparation meetings attended by the Chairman of the committee, VP Compensation and Benefi ts and the Company Secretary were held prior to each committee meeting.
ActivitiesThe committee monitored the effectiveness and relevance of TomTom’s Management Board Remuneration Policy throughout the year. It also considered the extent to which the individual remuneration packages of the Management Board members were in line with the company’s policy. A scenario analysis was carried out within the terms of the best practice provision II.2.1 of the Code to evaluate the variable remuneration components of these remuneration packages.
The August meeting focused on comparing the remuneration packages with industry peers. The committee compiled and discussed a benchmarking in preparation of this annual report to further improve the transparency of the company’s remuneration policy, as well as its reporting on it. The committee also consulted various surveys from experienced and knowledgeable independent remuneration experts to evaluate the remuneration package of the Management Board. It concluded that the materials supported their committee’s view that the company’s remuneration policy is appropriate.
2012 topics2012 was an important transformational year for TomTom. The company embarked on a journey towards becoming a content, software and services supplier. This strategy aims at better monetising the company’s core technology assets both on its own hardware and as individual components independently of the hardware or platform used by customers.
Throughout this year, the Supervisory Board meetings provided feedback and input on the company’s progress towards achieving a number of key objectives that will make this transformation possible. During discussions with the Management Board the company’s technology strategy, the foundation for its future growth was a recurring theme. Specifi c attention was given to the focus of the various R&D projects, which were discussed and monitored at each quarterly meeting. The move towards a modular approach to the company’s product offering opened many opportunities but also meant a substantial shift in focus was needed. The Supervisory Board played an active role in ensuring that the Management Board’s ideas were challenged and tested in order to reach decisions that would underpin the company’s long-term strategy.
How to counteract the continuing decline in the volatile, consumer market and the associated decrease in revenue from the Consumer business unit was a topic of frequent and in-depth discussions with the Management Board. The company’s strategic decision to aim to achieve ever greater growth from the non-PND category meant that the directions of the other business units, such as Automotive and Licensing, and their positions in the respective markets featured regularly in the topics for discussion during the Supervisory Board meetings.
Of strategic importance both for the business units but also for the company as a whole were a number of major new customer wins. The Supervisory Board feels these demonstrate that the company’s shift in direction is starting to bear fruit.
In the October meeting the company’s legal compliance and its corporate social responsibility programmes were presented. The Supervisory Board was pleased to see substantial progress had been made on embedding a culture of Compliance and Social Responsibility in the organisation.
In 2012 the Supervisory Board commissioned a third party to carry out an assessment of its functioning as well as that of its members, its committees and the Chairman. All Supervisory Board members completed online self-assessment questionnaires and the Management Board was also requested to provide feedback.

TomTom Annual Report and Accounts 201228
Supervisory Board Report | continued
The committee periodically reviewed the progress on the achievement of the key performance indicators (the KPIs) that had been set for the variable remuneration components.
An independent third party carried out an assessment of the functioning of the committee. It was concluded that the continuous assessment and alignment of the KPIs to be included in the long-term incentive plan, with the company strategy is of utmost importance to ensure the effective execution of the Remuneration Policy. The committee agreed to continue its focus on this aspect moving forward.
The base salary and short term incentive scheme of the Management Board were benchmarked in October against a peer group consisting of 105 Dutch companies. The majority of these were AEX and AMX listed. Among these companies were Aegon, AkzoNobel, ASML, Heineken, Ziggo and Nutreco (for further details see below).
Remuneration PolicyThe company’s Articles of Association state that the Supervisory Board must propose the Remuneration Policy for the members of the Management Board and that the Remuneration Policy must be adopted by the General Meeting. The Supervisory Board determines the remuneration of individual members of the Management Board on the basis of criteria established by the Remuneration Policy. It reviews this policy regularly in the light of internal and/or external developments. The full text of the policy can be found on the TomTom website.
The company’s Remuneration Policy must ensure that the company is able to attract and retain highly qualifi ed and expert executives to its Management Board. It must also ensure that the Management Board members’ remuneration is consistent with the company’s strategy, its operational and fi nancial results and delivery of value to shareholders.
Another aim of the policy is to apply a responsible and sustainable remuneration framework in line with the general result-driven remuneration principles and practices throughout the company. Our Remuneration Policy establishes that remuneration for the Management Board must consist of four components: base salary, short-term incentive, long-term incentive and pension.
Application in 2012The details of the individual remuneration of all members of the Management Board and its costs to the company are presented in note 7 to the consolidated fi nancial statements. The information described in best practice provision II.2.13 (d) of the Code is also provided there.
1. Base salary at median market level
Fixed remuneration consists of base salary plus holiday allowance, where applicable and in accordance with market practice. The objective of this element of the policy is to align the base salary levels of TomTom Management Board members with median market practice in a measured way. The base salary levels are reviewed annually, taking into account developments in the pay market and the level of position as graded within the company.
Using the outcome of the annual performed benchmarking as a base, the Supervisory Board concluded that Marina Wyatt’s and Alain De Taeye’s base salaries were in line with the median market level and did not need adjustment for 2012. Harold Goddijn’s base salary is still under median market level but was not adjusted in the course of 2012 to bring it closer to the median level. The base salaries of all Management Board members comply with the Remuneration Policy.
2. Short-term incentive
The intention of the percentage-of-salary bonus scheme is to ensure a uniform bonus structure throughout the organisation. It aligns the management bonus scheme with the bonus structure that applies to other staff within the company and with Dutch market practice. This component of Management Board remuneration was benchmarked against the same peer group as was used for the base salary comparison.
The level of cash payment is determined according to pre-determined criteria and objectives. TomTom’s ‘on-target’ bonus percentages are determined by the difference between the total cash payment at the third quartile minus the median base salary of our peer group companies. The on-target bonus percentage for the CEO position is calculated as 80% of his base salary. It is 64% of the base salary for the other members of the Management Board.
The maximum bonus amount may be increased to 1.5 times the ‘on-target bonus’ amounts. For example, in cases of excellent performance the CEO may receive 120% of his base salary, and the other members of the Management Board 96% of their base salaries. In addition to the incentive scheme based on pre-determined performance criteria the Supervisory Board may at its own discretion also decide to reward bonuses for exceptional individual performance.
For 2012 it was decided to apply the same KPIs for the short-term incentive plan as in the previous year: revenue, EBIT and cash fl ow. The Supervisory Board still believes that these fi nancial KPIs are the most effi cient way to foster revenue growth, control operating costs and maintain the company’s ability to invest. In particular, it believes that in economically challenging times it is of the utmost importance to continue

29
to generate suffi cient cash and that costs remain fi rmly under control. The Supervisory Board therefore decided to increase the weighting for cash fl ow to 40% (2011: 20%) while reducing the weighting for revenue growth to 20% (2011: 40%). TheEBIT KPI remains at the same weighting level of 40%.
Applying the pre-determined performance criteria to the 2012 results of the company, the Supervisory Board has awarded an overall pay-out ratio of 69% of the target bonus under the short-term incentive scheme.
The Supervisory Board is of the opinion that the continuous challenging economic environment and competitive market warranted strong fi nancial control and that therefore the strictly fi nancial nature of the KPIs set for 2012 were appropriate.
3. Long-term incentive
The long-term incentive component is laid down in the TomTom Management Board Stock Option Plan 2009, as amended in 2011 (the Management Board Stock Option Plan). The Management Board Stock Option Plan is aimed at attracting and retaining key talent in order to ensure the company’s continued high performance. It therefore aligns the company’s long-term incentives with common practices within international companies operating in the technology sector.
With regard to the Management Board Stock Option Plan, the number of options that vest is subject to the achievement of pre-determined performance criteria. The performance criteria are measured over a three year period that runs from January 1st of the calendar year in which the options are granted. The options will vest three years after the grant date if the performance conditions have been fulfi lled.
With regard to the Management Board’s long-term incentive scheme, the Supervisory Board decided to refl ect the company’s vision and the corresponding strategic considerations for 2012 to 2014 as related to the performance criteria for the Management Board’s long-term incentive scheme, by continuing to use the performance criteria established in the previous year. These criteria focus on the broadening of the group’s revenue base and TomTom’s position as a preferred employer applying more weighting to the fi nancial measures. A large part of the KPIs are related to achieving the company’s objectives to grow as a solutions and services company and to maintain its position in the PND market throughout the world. No scaled achievement ranges for the long term KPIs were set. The specifi c targets are deemed commercially sensitive information and will not be disclosed.
The Remuneration Committee reviewed and discussed whether the performance criteria for 2012 were validly set. It concluded that the relationship between the performance criteria and the strategic objectives was appropriate.
As in previous years, the conditional grant of stock options to the Management Board members was based on a fi xed pay versus pay-at-risk ratio for 2012. To be consistent with general market practice, as well as the granting policy applicable to the other key company employees, this ratio was set at 1:2. Accordingly, each Management Board member was given a conditional grant of 175,000 stock options.
4. Pension plan contributions
Members of the Management Board are eligible for and can opt to participate in the company’s pension plans. The company’s contribution to the pension of each member of the Management Board is capped at 10% of the annual base salary.
Harold Goddijn has opted to waive his rights to take part in the company’s pension plan and does not receive any contribution from the company. Marina Wyatt and Alain De Taeye do not participate in the company’s pension plan and receive 10% of their respective gross annual base salary as a contribution to their respective pension plans. In addition to the above-mentioned remuneration components, the Management Board members are entitled to remuneration for items such as medical insurance, death and disability insurance. They also benefi t from directors’ and offi cers’ liability insurance coverage. These benefi ts are in line with market practice. The company does not provide loans to members of the Management Board.
Outlook 2013The Supervisory Board does not intend to change the Remuneration Policy in the foreseeable future.
Following the outcome of the 2012 benchmarking exercise, the Remuneration Committee concluded that the base salaries of all Management Board members comply with the Remuneration Policy. The base salaries of Marina Wyatt and Alain De Taeye are at the median level of Dutch market pay and therefore do not need to be adjusted in 2013.
The base salary of Harold Goddijn is currently under median market level. The aim of the Supervisory Board is to bring the CEO base salary closer to the median. Therefore the Supervisory Board decided to increase the base salary of the CEO for 2013 by 20% to €450,000.

TomTom Annual Report and Accounts 201230
Supervisory Board Report | continued
Selection and Appointment Committee report
—
The Selection and Appointment Committee met four times during the course of 2012, with an overall attendance rate of 92%.
The committee considered the composition and succession planning of the Supervisory Board and Management Board members. The nomination for re-appointment of two members of the Supervisory Board (Guy Demuynck and Ben van der Veer) and one member of the Management Board (Alain De Taeye) was discussed. Also the rotation plan was reviewed.
The Act on Management and Supervision was adopted by the Dutch parliament in 2012 and the committee deliberated on the consequences of this new legislation for the company. In this respect the members of the committee confi rmed their various positions in Dutch and foreign companies. Further the committee supports the commitment of the Supervisory Board in doing its utmost to identify and nominate a female candidate on the company’s Supervisory Board.
An independent third party carried out an assessment of the functioning of the committee. It was concluded to gain better insight in the selection criteria for senior management.
Audit Committee report
—
The Audit Committee met four times during the course of 2012, with an overall attendance rate of 83%. The meetings were held prior to the publication of the quarterly fi nancial results. All meetings were attended by Marina Wyatt and the VP of Business Assurance in full or part during the year. Harold Goddijn and Alain De Taeye attended the meetings as required (for instance, where the most important group risks and internal controls were discussed). The external auditor attended all agenda items relevant to the publication of the quarterly fi nancial results. During the year the Audit Committee also invited senior management responsible for IT, Tax, Treasury, TechOps, the Product Offi ce, Corporate Security and Corporate Social Responsibility to provide updates on their businesses.
The Audit Committee considers that it has suffi cient breadth, depth, industry-relevant knowledge, experience and expertise available to enable it to discharge its duties appropriately. In particular, it considers that the fi nancial skills and experience that can reasonably be expected of an Audit Committee in the discharge of its duties were available during the year.
The Supervisory Board has decided to apply the same performance criteria and weighting for the short-term incentive scheme as in 2012. The focused nature of the KPIs refl ects the Supervisory Board’s opinion that the current economic climate requires strong fi nancial guidance.
The Supervisory Board has confi rmed that the long-term performance criteria for 2013 refl ect the company’s strategy considerations. A set of KPIs will enable the Supervisory Board to measure the progress made in the execution of the company’s strategy to restore revenue growth. This growth should be achieved by greater increase from non-PND product sales while limiting the decline of PND sales. TomTom’s position as a preferred supplier will also be measured. It was decided to set scaled achievement ranges for these long term KPIs with a maximum combined achievement level of 100%. The related targets are deemed commercially sensitive information and will therefore not be disclosed.
Employee arrangements and severance agreements
—
All members of the Management Board have an employment contract with the company. The employment contracts are entered into for an indefi nite period, but the term of offi ce of members of the Management Board is four years. After this period, they may be re-appointed for another term of not more than four years at a time.
A notice period of 12 months is applicable for all members of the Management Board. In the event that the employment of a member of the Management Board is terminated by the company, or on its initiative, he or she shall be entitled to a fi xed amount of 50% of one year’s base salary, including holiday allowance. The severance compensation due will be paid to members of the Management Board during the agreed notice period of 12 months in addition to the salary.
These terms will not apply if the employment of a member of the Management Board is terminated for any reason as set out in articles 7:677 (1) and 7:678 of the Dutch Civil Code. In such situations the Management Board member will not be entitled to any severance compensation. A member of the Management Board will not be entitled to severance compensation if the employment is terminated by him or her or on his or her initiative.
Members of the Supervisory Board are not entitled to any benefi ts upon the termination of their appointment.

31
Audit Committee and administratively to Marina Wyatt. During 2012 the VP of Business Assurance reported each quarter to the Audit Committee. He also ensured open communication between himself and the chairman of the Audit Committee.
The audit programme covers key business processes, subsidiary offi ce reviews, the auditing of major ICT projects before go live and special requests. Working with management, Internal Audit selects the areas of the business to be audited during the year. Their selection has been presented to the Audit Committee and approved by them.
Members of the Audit Committee and Management Board may at any time request Internal Audit to carry out an internal audit or special consulting service. During 2012 approximately thirty two per cent of the Internal Audit workload involved such special requests. We believe that this approach helps to keep the Internal Audit work schedule closely aligned with the dynamic nature of our business, as well as demonstrating Internal Audit’s healthy working relationship with the rest of the business.
IndependenceThe Business Assurance department maintains a high-level of independence and objectivity within its team. This is based on the following principles:– the Audit Committee Charter describes the purpose, authority
and responsibilities of Internal Audit– the VP of Business Assurance has unrestricted access to the
Supervisory Board and Audit Committee and reports regularly to the Audit Committee, as well as maintaining a direct relationship with the Audit Committee Chairman
– all individual members of the Internal Audit department are qualifi ed professionals who uphold the ethical guidelines covering independence laid down by the professional bodies governing registered accountants and internal auditors
– the internal auditor’s role is to provide assurance and advice to management, who are ultimately accountable for the effectiveness of the internal control and risk systems.
External auditor The Audit Committee agrees the compensation of the external auditor and recommends the appointment of an external auditor to the Supervisory Board. Each new appointment is subject to the approval of the company’s shareholders at the Annual General Meeting.
Deloitte Accountants BV has acted as external auditor for the company since 2004. The Audit Committee has reviewed Deloitte’s performance and independence during 2012. The Audit Committee recommends that the Supervisory Board re-appoint Deloitte for the 2013 fi nancial year-end audit, subject to the approval of shareholders at the Annual General Meeting. Deloitte have expressed their willingness to continue to provide this
ActivitiesThe Audit Committee assisted the Supervisory Board in overseeing the following areas of the business:– the integrity of the company’s quarterly fi nancial results and
related press releases– the integrity of the annual report, including the company’s
accounting and fi nancial reporting policies and processes– the integrity of the company’s disclosure controls and
procedures– relations with the external auditor, including the scope of their
plans, assessment of their independence, approval of their remuneration, and their annual re-appointment
– the role and functioning of the Internal Audit department (part of the Business Assurance team that coordinates oversight of the company’s business risk management)
– the maintenance of an effective system of risk management and internal control relating to strategic, fi nancial, operational and compliance risks
– compliance with the recommendations and observations of the internal and external auditors
– the company’s approach to fi nancing, cash and foreign exchange management
– the fi nancing of the company– the application of information and communication technology
(ICT)– the company’s policy on tax planning– the company’s code of business conduct and ethics, as well as
its approach to protecting and securing key company assets.
In October 2012 the Audit Committee reviewed the Audit Committee Charter and resolved that no changes were necessary. The Audit Committee Charter is available on the TomTom website.
An independent third party carried out an assessment of the functioning of the Audit Committee. It was concluded that it will continue to place emphasis on fi nancial reporting and risk assessment.
Financial reporting
The Supervisory Board and Audit Committee reviewed the quarterly fi nancial results and full year fi nancial statements prior to their release. Attention was paid to critical accounting policies, the valuation of goodwill and assets and the clarity of the rules for disclosure, as well as the company’s compliance with accounting standards, the requirements of NYSE Euronext Amsterdam and other corporate governance, legal and regulatory bodies.
Business assuranceThe company monitors its internal controls through a systematic approach to risk assessment and internal audit. The Business Assurance team assists in the independent review of the company’s risk management controls. The VP of Business Assurance leads the department, reporting functionally to the

TomTom Annual Report and Accounts 201232
Supervisory Board Report | continued
Financial Statements
—
The consolidated annual Financial Statements of the company for 2012, as prepared by the Management Board, have been audited by Deloitte Accountants BV. The Supervisory Board has approved these Financial Statements for 2012 and all individual members of the Supervisory Board, together with the members of the Management Board, have signed the Financial Statements for 2012. The Supervisory Board recommends to the Annual General Meeting to adopt the Annual Accounts for 2012. The Annual Report for 2012 is available at the company’s offi ces on request and on the company’s website. Upon adoption of the Annual Accounts for 2012, and in accordance with article 2:394 of the Dutch Civil Code and article 5:25o of the Financial Supervision Act, the Management Board will fi le the Annual Accounts for 2012 with the AFM. The members of the Supervisory Board have signed the annual Financial Statements pursuant to the statutory obligation under article 2:101 (2) Dutch Civil Code. The Supervisory Board would like to thank the Management Board members and all employees for their dedication and hard work in 2012.
Amsterdam, 12 February 2013
Supervisory BoardKarel VuursteenDoug DunnGuy DemuynckRob van den BerghBen van der VeerPeter Wakkie
service to the company during 2013. Resolutions proposing their re-appointment will be submitted to the forthcoming Annual General Meeting.
During 2012 the external auditor attended each of the four Audit Committee meetings to address agenda items relating to the external fi nancial reporting and related press releases. The Audit Committee and the external auditor also met separately, without the Management Board present, in order to facilitate free and open discussions. The Audit Committee reviewed the independence of the external auditor, taking into account qualitative and quantitative factors. The committee concluded that the external auditor has suffi cient objectivity and independence to perform the external audit function. Below a summary is provided of services performed by Deloitte Accountants BV, its network affi liates and the fees earned.
Type of service
€ in thousands 2012% of total 2011
% of total
Audit – group 440 41% 436 31%Audit – statutory 191 18% 236 17%Audit related services1 60 6% 131 9%Tax compliance2 380 35% 626 43%Total 1,071 100% 1,429 100%
1 During 2012 audit related services consisted of quarterly analytical
procedures.2 Tax compliance comprises local tax compliance services including local tax
fi lings and HR related compliance services.

33
Index to the 2012 Financial Statements
Consolidated Financial Statements 34 Consolidated Statement of Income 35 Consolidated Statement of Comprehensive Income 36 Consolidated Balance Sheet 37 Consolidated Statement of Cash Flows 38 Consolidated Statement of Changes in Equity 39 Notes to the Consolidated Financial Statements
Company Financial Statements of TomTom NV 69 Company Statement of Income of TomTom NV 70 Company Balance Sheet of TomTom NV 71 Notes to the Company Financial Statements 74 Other Information

TomTom Annual Report and Accounts 201234
Consolidated Statement of Incomefor the year ended 31 December
(€ in thousands) Notes 2012 2011
REVENUE 5 1,057,134 1,273,217 Cost of sales 6 502,398 633,545 GROSS RESULT 554,736 639,672
OPERATING EXPENSES
Research and development expenses 166,315 172,822Amortisation of technology and databases 84,011 84,619Marketing expenses 57,305 78,062Selling, general and administrative expenses 169,716 208,917Impairment charge 13 0 511,936Stock compensation expense 7,140 7,985TOTAL OPERATING EXPENSES1 8 484,487 1,064,341 OPERATING RESULT 70,249 – 424,669
Interest result 9 – 12,084 – 21,862Other fi nancial result 9 1,642 6,093Result of associates 15 726 – 432RESULT BEFORE TAX 60,533 – 440,870
Income tax 10 68,660 1,919 NET RESULT 129,193 – 438,951Attributable to:– Equity holders of the parent 128,724 – 437,844– Non-controlling interests 23 469 – 1,107NET RESULT 129,193 – 438,951
EARNINGS PER SHARE ( in €) 12Basic 0.58 – 1.97Diluted 0.58 – 1.97
1 Our operating expenses in 2011 include restructuring expenses of €14.8 million.
The notes on pages 39 to 68 are an integral part of these consolidated fi nancial statements.

35
(€ in thousands) 2012 2011
NET RESULT 129,193 – 438,951OTHER COMPREHENSIVE INCOME:
Currency translation differences – 1,298 – 381Actuarial losses on defi ned benefi t obligations – 1,352 0Cash fl ow hedge 0 2,545OTHER COMPREHENSIVE INCOME FOR THE YEAR – 2,650 2,164TOTAL COMPREHENSIVE INCOME FOR THE YEAR 126,543 – 436,787
Attributable to: – Equity holders of the parent 126,035 – 435,324– Non-controlling interests 508 – 1,463TOTAL COMPREHENSIVE INCOME FOR THE YEAR 126,543 – 436,787
The items in the statement above are presented net of tax.
Consolidated Statement of Comprehensive Incomefor the year ended 31 December
The notes on pages 39 to 68 are an integral part of these consolidated fi nancial statements.

TomTom Annual Report and Accounts 201236
Consolidated Balance Sheetas at 31 December
(€ in thousands) Notes 2012 2011
ASSETS
NON-CURRENT ASSETS
Goodwill 13 381,569 381,569 Other intangible assets 13 821,233 871,528 Property, plant and equipment 14 26,770 32,555 Investments in associates 15 3,880 4,450Deferred tax assets 25 13,610 10,493TOTAL NON-CURRENT ASSETS 1,247,062 1,300,595
CURRENT ASSETS
Inventories 16 44,383 65,502 Trade receivables 17 149,834 184,939 Other receivables and prepayments 18 35,294 51,242Income taxes 10 82,968 0Other fi nancial assets 19 444 2,784 Cash and cash equivalents 20 164,459 193,579 TOTAL CURRENT ASSETS 477,382 498,046
TOTAL ASSETS 1,724,444 1,798,641
EQUITY AND LIABILITIES
EQUITY
Share capital 21 44,379 44,379 Share premium 975,260 975,260 Other reserves 159,011 131,213Accumulated defi cit – 342,875 – 444,852EQUITY ATTRIBUTABLE TO EQUITY HOLDERS OF THE PARENT 835,775 706,000Non-controlling interests 23 2,642 2,451 TOTAL EQUITY 838,417 708,451
NON-CURRENT LIABILITIES
Borrowings 24 173,437 0Deferred tax liability 25 170,909 182,273Provisions 26 48,268 50,114Other long term liabilities1 28 18,130 12,720TOTAL NON-CURRENT LIABILITIES 410,744 245,107
CURRENT LIABILITIES
Trade payables 27 84,162 116,616Income taxes 10 23,933 11,814Other taxes and social security 9,330 9,128Borrowings 24 73,703 383,810Provisions 26 33,192 51,213Accruals and other liabilities 28 250,963 272,502TOTAL CURRENT LIABILITIES 475,283 845,083
TOTAL EQUITY AND LIABILITIES 1,724,444 1,798,641
1 In 2012, the non-current portion of deferred revenue is presented under Other long term liabilities. The 2011 comparative fi gures have been reclassifi ed to conform to
the current year’s presentation.
The notes on pages 39 to 68 are an integral part of these consolidated fi nancial statements.

37
Consolidated Statement of Cash Flowsfor the year ended 31 December
(€ in thousands) Notes 2012 2011
CASH FLOWS FROM OPERATING ACTIVITIES
Operating result 70,249 – 424,669
Financial (losses) gains – 784 4,554Amortisation of intangible assets 13 95,999 98,590Depreciation of property, plant and equipment 14 14,671 20,507Impairment charge 13 0 511,936Equity-settled stock compensation expense 22 5,700 7,996Change in provisions – 9,428 – 10,224Changes in working capital:Change in inventories 13,819 27,915Change in receivables and prepayments 47,660 113,384Change in current liabilities (excluding provisions)1 – 51,210 – 154,770CASH GENERATED FROM OPERATIONS 186,676 195,219
Interest received 9 1,197 2,871Interest paid 9 – 9,908 – 18,459Corporate income taxes paid – 11,025 – 5,456NET CASH GENERATED FROM OPERATING ACTIVITIES 166,940 174,175
CASH FLOWS USED IN INVESTING ACTIVITIES
Investments in intangible assets 13 – 42,990 – 57,918Investments in property, plant and equipment 14 – 9,311 – 16,502Dividend received 15 1,487 1,628NET CASH USED IN INVESTING ACTIVITIES – 50,814 – 72,792
CASH FLOWS USED IN FINANCING ACTIVITIES
Repayment of borrowings 24 – 388,000 – 210,000Proceeds of new term loan 24 247,140 0Dividends paid – 317 0Proceeds on issue of ordinary shares 21 0 724Redemption of equity instruments – 4,605 0Acquisition of non-controlling interests 0 – 4,243NET CASH USED IN FINANCING ACTIVITIES – 145,782 – 213,519
NET DECREASE IN CASH AND CASH EQUIVALENTS – 29,656 – 112,136Cash and cash equivalents at the beginning of period 193,579 305,600Effect of exchange rate changes on cash balances held in foreign currencies 536 115CASH AND CASH EQUIVALENTS AT THE END OF PERIOD 164,459 193,579
1 Includes movements in the non-current portion of deferred revenue presented under Other long term liabilities.
The notes on pages 39 to 68 are an integral part of these consolidated fi nancial statements.

TomTom Annual Report and Accounts 201238
Consolidated Statement of Changes in Equity
(€ in thousands) NotesShare
capitalShare
premiumOther
reserves Accumu-
lated defi cit Total
Non-controlling
interestsTotal
equity
BALANCE AS AT 31 DECEMBER 2010 44,362 974,554 117,419 – 222 1,136,113 5,416 1,141,529
COMPREHENSIVE INCOME
Result for the year 0 0 0 – 437,844 – 437,844 – 1,107 – 438,951OTHER COMPREHENSIVE INCOME
Currency translation differences 0 0 – 25 0 – 25 – 356 – 381Transfer to legal reserves 0 0 21,846 – 21,846 0 0 0Cash fl ow hedge 0 0 2,545 0 2,545 0 2,545TOTAL OTHER COMPREHENSIVE
INCOME 0 0 24,366 – 21,846 2,520 – 356 2,164TOTAL COMPREHENSIVE INCOME 0 0 24,366 – 459,690 – 435,324 – 1,463 – 436,787TRANSACTIONS WITH OWNERS
Dividend paid 0 0 0 0 0 – 542 – 542Change in non-controlling interests 23 0 0 0 – 3,283 – 3,283 – 960 – 4,243Stock compensation related charges 22 0 0 – 10,347 18,343 7,996 0 7,996Issue of share capital 21 17 706 – 225 0 498 0 498BALANCE AS AT 31 DECEMBER 2011 44,379 975,260 131,213 – 444,852 706,000 2,451 708,451COMPREHENSIVE INCOME
Result for the year 0 0 0 128,724 128,724 469 129,193OTHER COMPREHENSIVE INCOME
Currency translation differences 0 0 – 1,337 0 – 1,337 39 – 1,298Transfer to legal reserves 0 0 41,222 – 41,222 0 0 0Actuarial losses on defi ned benefi t obligations 0 0 0 – 1,352 – 1,352 0 – 1,352TOTAL OTHER COMPREHENSIVE
INCOME 0 0 39,885 -42,574 – 2,689 39 – 2,650TOTAL COMPREHENSIVE INCOME 0 0 39,885 86,150 126,035 508 126,543TRANSACTIONS WITH OWNERS
Dividend paid 0 0 0 0 0 – 317 – 317Stock compensation related charges 22 0 0 – 12,087 15,827 3,740 0 3,740BALANCE AS AT 31 DECEMBER 2012 44,379 975,260 159,011 – 342,875 835,775 2,642 838,417
1 Other reserves include Legal reserves and the Stock compensation reserve.
1
The notes on pages 39 to 68 are an integral part of these consolidated fi nancial statements.

39
1. GENERAL
TomTom NV (the company) has its statutory seat and headquarters in Amsterdam, the Netherlands. The activities of the company include the development and sale of location and navigation solutions.
The consolidated fi nancial statements comprise the company and its subsidiaries (together referred to as the group). A condensed income statement is presented in the company fi nancial statements in accordance with section 402 of Part 9 of Book 2 of the Netherlands Civil Code.
The fi nancial statements have been prepared by the Management Board and authorised for issue on 12 February 2013. The fi nancial statements will be submitted for approval to the Annual General Meeting on 23 April 2013.
2. SUMMARY OF SIGNIFICANT ACCOUNTING POLICIES
The principal accounting policies applied in the preparation of these consolidated fi nancial statements are set out below. These policies have been consistently applied to all the years presented, unless otherwise stated.
Basis of preparation
The consolidated fi nancial statements have been prepared in accordance with International Financial Reporting Standards (IFRS) and IFRIC interpretations as adopted by the European Union.
The fi nancial statements have been prepared on the historical cost basis, except for fi nancial instruments (including derivatives) classifi ed at fair value through profi t or loss and derivatives used for hedging, which are stated at fair value.
Income and expenses are accounted for on an accrual basis.
New accounting standards and developments
Effective from 1 January 2012, the group adopted IAS 19 Employee Benefi ts (as revised in June 2011) for our defi ned benefi t plans. This resulted in the recognition of the actuarial gains / losses of our defi ned benefi t plans directly in Other comprehensive income. As the impact of the actuarial gains / losses on the 2011 numbers is not material, the related comparative fi gures from 2011 were not adjusted.
Other standards and interpretations that are issued and are effective from 1 January 2012 did not have a material impact on the group.
All other standards and interpretations that were in issue but not yet effective for reporting periods beginning on 1 January 2012 have not yet been adopted and are not expected to have material impact on the group.
Use of estimates
The preparation of these fi nancial statements requires management to make certain assumptions, estimates and judgements that affect the reported amounts of assets, liabilities and disclosure of contingent assets and liabilities as of the date of the consolidated fi nancial statements and the reported amounts of revenues and expenses during the reporting period. Actual results may differ from those estimates. The areas involving higher degree of judgement or areas where assumptions and estimates are signifi cant to the fi nancial statements are disclosed in note 4.
Foreign currencies
The company’s primary activities are denominated in euros. Accordingly, the euro is the company’s functional currency, which is also the group’s presentation currency. Items included in the fi nancial information of individual entities in the group are measured using the individual entity’s functional currency, which is the currency of the primary economic environment in which the entity operates.
Transactions and balances
Foreign currency transactions are translated into the functional currency using the exchange rates prevailing on the dates of the transactions. At each balance sheet date, monetary items denominated in foreign currencies are retranslated at the rates prevailing at the balance sheet date. Non-monetary items that are measured in terms of historical cost in a foreign currency are not retranslated.
Foreign exchange gains and losses resulting from the settlement of such transactions and from the translation at year-end exchange rates of monetary assets and liabilities denominated in foreign currencies are recognised in the income statement, except when deferred in equity as qualifying cash fl ow hedges. Foreign exchange gains and losses are presented under ‘Other fi nancial result’ in the income statement.
Notes to the Consolidated Financial Statements

TomTom Annual Report and Accounts 201240
Notes to the Consolidated Financial Statements | continued
2. SUMMARY OF SIGNIFICANT ACCOUNTING POLICIES (CONTINUED)
Group companies
For consolidation purposes, the assets and liabilities of entities that have a functional currency other than the group’s presentation currency are translated at the closing rate at the date of the balance sheet, whereas the income statement is translated at the average exchange rate for the period. Translation differences arising thereon are recognised in Other comprehensive income.
Cash fl ow statements
Cash fl ow statements are prepared using the indirect method. Cash fl ows from derivative instruments are classifi ed consistently with the nature of the instrument.
Basis of consolidation
The consolidated fi nancial statements incorporate the fi nancial statements of the company and entities controlled by the company (its subsidiaries). Control is achieved where the company has the power to govern the fi nancial and operating policies of an entity so as to obtain benefi ts from its activities.
Where necessary, adjustments are made to the fi nancial statements of subsidiaries to bring their accounting policies in line with the group.
All inter-company transactions, balances and unrealised gains and losses on transactions between group companies are eliminated.
Transactions with non-controlling interests
Transactions with non-controlling interests that do not result in loss of control are accounted for as equity transactions – that is, as transactions with the owners. The difference between fair value of any consideration paid and the relevant share acquired or the carrying value of the net assets of the subsidiary is recorded in equity.
Associates
Associates are all entities over which the group has signifi cant infl uence but not control, generally accompanying a shareholding of between 20% and 50% of the voting rights, or other evidence of signifi cant infl uence. Investments in associates are accounted for using the equity method of accounting, and are initially recognised at cost. The group’s investment in associates includes goodwill identifi ed on acquisition, net of any accumulated impairment loss.
The group’s share of its associates’ post-acquisition profi ts or losses is recognised in the income statement, and its share of post-acquisition movements in Other comprehensive income is recognised in Other comprehensive income. The cumulative post-acquisition movements are adjusted against the carrying amount of the investment. When the group’s share of losses in an associate equals or exceeds its interest in the associate, including any other unsecured receivables, the group does not recognise further losses, unless it has incurred obligations or made payments on behalf of the associate. Unrealised gains on transactions between the group and its associates are eliminated to the extent of the group’s interest in the associates. Unrealised losses are also eliminated, unless the transaction provides evidence of an impairment of the asset transferred. Accounting policies of associates have been changed where necessary to ensure consistency with the policies adopted by the group.
Revenue recognition
Revenue is measured as the fair value of the consideration received or receivable and represents amounts receivable for products and / or services delivered in the normal course of business. Revenue is reduced for estimated customer returns, rebates and other similar allowances whenever applicable based on historical data and expectations of future sales. For further details, refer to note 4, Critical accounting estimates and judgements.
Sale of goods
Revenue on the sale of goods is only recognised when the risks and rewards of ownership of goods are transferred to the customers, which include distributors, retailers, end-users and Original Equipment Manufacturers (OEMs). The risks and rewards of ownership are generally transferred at the time the product is shipped and delivered to the customer and, depending on the delivery conditions, title and risk have passed to the customer and acceptance of the product, when contractually required, has been obtained. In cases where contractual acceptance is not required, revenue is recognised when management has established that all aforementioned conditions for revenue recognition have been met.

41
2. SUMMARY OF SIGNIFICANT ACCOUNTING POLICIES (CONTINUED)
Royalty revenue
Royalty revenue is generated through licensing of geographic and/or other traffi c-/location-based content to customers. Revenue is recognised on an accrual basis based on the contractual terms and substance of the relevant arrangements with the customers.
Sale of services
Services revenue is generated from the selling of traffi c- and map update services, content sales and connected navigation and fl eet management services for commercial fl eets. The revenue relating to the service element is recognised over the agreed or estimated service period on a straight-line basis.
Multiple-element arrangements
The group’s product and services offerings include arrangements that require the group to deliver equipment (e.g. navigation hardware) and/or a number of services (e.g. traffi c information services) under one agreement, or under a series of agreements that are commercially linked (referred to as ‘multiple-element arrangements’). In such multiple-element arrangements, the consideration received is allocated to each separately identifi able element, based on the relative fair values of each identifi able element. In the absence of a stand-alone selling price the fair value of each element is estimated using other methods allowed under IFRS such as cost plus reasonable margin- or residual method.
The amount of revenues allocated to the hardware element is recognised in line with the accounting policy for the sale of goods as described above. The revenue relating to the service element is recognised over the agreed or estimated service period on a straight-line basis. To the extent that there is a discount on the arrangement, such discount is allocated between the elements of the contract in such a manner as to refl ect the fair value of the elements.
Interest income and expense
Interest income and expense are recognised using the effective interest method.
Leasing
The group leases certain property, plant and equipment. Leases are classifi ed as fi nance leases whenever the terms of the lease transfer substantially all the risks and rewards of ownership to the group. All other leases are classifi ed as operating leases. Rentals payable under operating leases are charged to income on a straight-line basis over the term of the relevant lease. Benefi ts received and receivable as an incentive to enter into an operating lease are also spread on a straight-line basis over the lease term.
Derivative fi nancial instruments and hedging activities
All derivative fi nancial instruments are classifi ed as current or non-current assets or liabilities based on their maturity dates and are accounted for at their trade date. Derivatives are initially and subsequently measured at fair value. The group measures all derivative fi nancial instruments using quoted prices for similar instruments or using valuation techniques with maximum use of market inputs. Gains or losses arising from changes in fair value of derivatives are recognised in the income statement, except for derivatives designated as hedging instruments, in a highly effective hedge relationship, for which cash fl ow hedge accounting is applied. Transaction costs are expensed in the income statement.
Government grants
The group receives government grants related to the research and development activities performed by the group. Government grants are recognised at their fair value when there is a reasonable assurance that the group will comply with the conditions attached to them, and that the grants will be received. Government grants that are receivable as compensation for expenses or losses already incurred, are recognised as a deduction of the related expense in the period in which they become receivable.
Pension obligations and costs
The group operates various defi ned contribution plans and a defi ned benefi t plan for a German subsidiary. This defi ned benefi t plan is unfunded and has no plan asset. For defi ned contribution plans, the group pays contributions to publicly or privately administered pension insurance plans on a mandatory, contractual or voluntary basis. The group has no further payment obligations once the contributions have been paid. The contributions are recognised as employee benefi t expenses when service has been rendered to the group. Prepaid contributions are recognised as an asset to the extent that a cash refund or reduction of future payments is available.

TomTom Annual Report and Accounts 201242
Notes to the Consolidated Financial Statements | continued
2. SUMMARY OF SIGNIFICANT ACCOUNTING POLICIES (CONTINUED)
In relation to the defi ned benefi t plan, the group recognised a liability on the balance sheet based on the present value of the defi ned benefi t obligation at the end of the reporting period. The defi ned benefi t obligation is calculated annually using the projected unit credit method. The present value of the defi ned benefi t obligation is determined by discounting the estimated future cash outfl ows using interest rates of high-quality corporate bonds that are denominated in the currency in which the benefi ts will be paid, and that have terms to maturity approximating to the terms of the related pension obligation.
Service costs and interest costs are charged to the pension expenses while actuarial gains and losses are charged or credited to equity in Other comprehensive income in the period in which they arise.
In Italy, employees are paid a staff leaving indemnity on termination of employment. This is a statutory payment based on Italian civil law. An amount is accrued each year based on the employee’s remuneration and previously revalued accruals. The indemnity has the characteristics of a defi ned contribution obligation and is an unfunded, but fully provided liability. The costs of providing benefi ts under the plans are determined separately for each plan
Stock compensation expense
The group operates a number of equity-settled plans, as well as a cash-settled performance share plan
Equity-settled plans
Equity-settled share-based payments are measured at fair value at the date of grant. The fair value determined at the grant date of the equity-settled share-based payments is expensed on a straight-line basis over the vesting period. The costs are determined based on the fair value of the granted instruments and the number expected to vest. At each balance sheet date, the entity revises its estimates of the number of instruments expected to vest.
Performance share plan
Cash-settled share-based payments are initially recognised at the fair value of the liability and are expensed over the vesting period. The liability is remeasured at each balance sheet date to its fair value, with all changes recognised immediately as either a profi t or a loss.
Taxation
Income tax expense represents the sum of the tax currently payable and deferred tax. The group’s income tax expense is calculated using tax rates that have been enacted or substantively enacted at the balance sheet date.
Deferred taxes are calculated using the liability method. Deferred income taxes refl ect the net tax effects of temporary differences between the carrying amounts of assets and liabilities for fi nancial reporting purposes and the amounts used for income tax purposes. Deferred tax assets and liabilities are measured using the tax rates expected to apply to taxable income in the years in which those temporary differences are expected to be recovered or settled, using tax rates (and laws) that have been enacted or substantially enacted by the balance sheet date. The measurement of deferred tax liabilities and deferred tax assets refl ects the tax consequences that would follow from the manner in which the group expects, at the balance sheet date, to recover or settle the carrying amount of its assets and liabilities.
Deferred tax assets are recognised when it is probable that suffi cient taxable profi ts will be available against which the deferred tax assets can be utilised. The carrying amounts of deferred tax assets are reviewed at each balance sheet date and reduced to the extent that it is no longer probable that suffi cient taxable profi ts will be available to allow all or part of the asset to be recovered.
Current and deferred taxes are recognised as an expense or income in the profi t and loss account, except when they relate to items credited or debited directly to equity. In this case, the tax is also recognised directly in equity.
Goodwill
Goodwill represents the excess of the cost of an acquisition over the fair value of the group’s share of the net identifi able assets of the acquired subsidiary/associate at the date of acquisition. Goodwill on acquisitions is tested at least annually for impairment and carried at cost less accumulated impairment losses. Goodwill is allocated to operating segments for the purpose of impairment testing. The allocation is made to those operating segments that are expected to benefi t from the business combination in which the goodwill arose.

43
2. SUMMARY OF SIGNIFICANT ACCOUNTING POLICIES (CONTINUED)
Intangible assets other than goodwill
Internally generated intangible assets
Internal software development costs relating to core technology are recognised as an intangible asset if, and only if, all of the following have been demonstrated:– the technical feasibility to complete the project; – the intention to complete the intangible asset, and use or sell it;– the ability to use or sell the intangible asset;– how the intangible asset will generate probable future economic benefi ts;– the availability of adequate resources to complete the project; and– the cost of developing the asset can be measured reliably.
Internally generated databases are capitalised until a level of completion is reached and ongoing activities focus on maintenance, at this point capitalisation is discontinued.
The amount initially recognised for internally generated intangible assets is the sum of the expenditure incurred from the date when the intangible asset fi rst meets the recognition criteria listed above.
All expenditures on research activities are expensed in the income statement as incurred. Internal software costs relating to development of non-core software with an estimated average useful life of less than one year and engineering costs relating to the detailed manufacturing design of new products are expensed in the period in which they are incurred.
Acquired intangible assets
Defi nite-lived intangible assets acquired separately are initially recognised at cost. The cost of assets acquired separately includes directly attributable costs to bring the asset to its intended use. Intangible assets acquired in a business combination are identifi ed and recognised separately from goodwill where they satisfy the defi nition of an intangible asset and their fair values can be measured reliably. The cost of such intangible assets is their fair value at the acquisition date. Subsequent to initial recognition, all intangible assets other than goodwill are carried at cost less accumulated amortisation and accumulated impairment losses.
The amortisation is recorded on a straight-line basis over the following estimated useful livesInternally generated core technology 3-5 yearsDatabases and tools 5-20 yearsCustomer relationships 20-27 yearsComputer software 2-5 yearsAcquired technology 4-5 years
Customer relationships include customers for maps; there is a high cost to changing map providers and historically there is high customer retention.
The group is required to use estimates, assumptions and judgements to determine the expected useful lives and future economic benefi ts of these assets. Such estimates are made on a regular basis, as they can be signifi cantly affected by changes in technology and other factors.
Property, plant and equipment
Property, plant and equipment are stated at historical cost less accumulated depreciation and impairment charges. Depreciation is recorded on a straight-line basis over the estimated useful lives of the assets as follows:Furniture and fi xtures 4-10 yearsComputer equipment and hardware 2-4 yearsVehicles 4 yearsTools and moulds 1-2 yearsLeasehold improvements 4-10 years
The estimated useful lives, residual values and depreciation methods are reviewed at each year-end, with the effect that any changes in estimate are accounted for on a prospective basis.

TomTom Annual Report and Accounts 201244
Notes to the Consolidated Financial Statements | continued
2. SUMMARY OF SIGNIFICANT ACCOUNTING POLICIES (CONTINUED)
The gain or loss arising on disposal or retirement of an item of property, plant and equipment is determined as the difference between the sales proceeds and the carrying amount of the asset and is recognised in profi t or loss.
Impairment of tangible and intangible assets
Assets, such as goodwill, that have an indefi nite useful life which are not subject to amortisation and intangible assets not yet ready to use are tested annually for impairment. Assets that are subject to amortisation/depreciation are tested for impairment whenever events or changes in circumstances indicate that the carrying amount may not be recoverable. An impairment loss is recognised for the amount by which the asset’s carrying amount exceeds its recoverable amount.
The recoverable amount is the higher of an asset’s fair value, less costs to sell and value in use. In estimating the fair value less costs to sell, the estimated future cash fl ows are discounted to their present value, using a post-tax discount rate that refl ects current market assessments of the time-value of money and the risks specifi c to the asset for which the estimates of future cash fl ows have not been adjusted.
For the purposes of assessing impairment, assets are grouped at the lowest levels for which there are separately identifi able cash fl ows (cash-generating units). Goodwill is tested at the operating segment level.
An impairment loss is recognised immediately in the income statement.
Non-fi nancial assets, other than goodwill that suffered an impairment, are reviewed for possible reversal of the impairment at each reporting date.
Financial assets
The group classifi es its fi nancial assets in the following categories: at fair value through profi t or loss and loans and receivables. The classifi cation depends on the purpose for which the fi nancial assets were acquired. Management determines the classifi cation of its fi nancial assets at initial recognition. The classifi cation of the fi nancial instruments used by the group as well as the method to determine the fair value of instruments carried at fair value are disclosed in note 32.
Financial assets at fair value through profi t or loss
Derivatives are categorised at fair value through profi t or loss unless they are designated as hedges. Derivatives are recorded as fi nancial assets when their fair value is a positive number; otherwise the derivative is classifi ed as a fi nancial liability.
Financial assets are derecognised when the rights to receive cash fl ows from the investments have expired or have been transferred and the group has transferred substantially all risks and rewards of ownership.
Loans and receivables
Loans and receivables are non-derivative fi nancial assets with fi xed or determinable payments that are not quoted in an active market. They are included in current assets, except for those with maturities greater than twelve months after the balance sheet date, which are classifi ed as non-current assets. Loans and receivables are initially recognised at fair value and subsequently measured at amortised cost (if the effect of time value is material) using the effective interest method, less any impairment. The group’s fi nancial assets classifi ed in the category ‘loans and receivables’ comprise ‘trade receivables’ and ‘cash and cash equivalents’ in the balance sheet (notes 17 and 20).
Trade receivables
Trade receivables are initially recognised at fair value, and subsequently measured at amortised cost (if the time value is material), using the effective interest method, less provision for impairment. A provision for impairment of trade receivables is established when there is objective evidence that the group will not be able to collect all amounts due, according to the original terms of the receivables. The amount of the provision is the difference between the asset’s carrying amount and the present value of estimated future cash fl ows, discounted at the original effective interest rate. The carrying amount of the asset is reduced through the use of an allowance account and the amount of the loss is recognised in the income statement within ‘cost of sales’. When a trade receivable is uncollectible, it is written off against the allowance account for trade receivables. Subsequent recoveries of amounts previously written off are credited against ‘cost of sales’ in the income statement.

45
2. SUMMARY OF SIGNIFICANT ACCOUNTING POLICIES (CONTINUED)
Cash and cash equivalents
Cash and cash equivalents are stated at face value and comprise cash on hand, deposits held on call with banks, and other short-term highly liquid investments that are readily convertible to a known amount of cash and are subject to an insignifi cant risk of changes in value.
Inventories
Inventories are stated at the lower of cost and net realisable value. The cost of inventories comprises costs of purchase, assembly and conversion to fi nished products. The cost of inventories is determined using the fi rst-in, fi rst-out (FIFO) method, net of reserves for obsolescence and any excess stock. Net realisable value represents the estimated selling price less an estimate of the costs of completion and direct selling costs.
Financial liabilities and equity instruments
Financial liabilities and equity instruments issued by the group are classifi ed according to the substance of the contractual arrangements entered into, and the defi nitions of a fi nancial liability and an equity instrument. An equity instrument is any contract that evidences a residual interest in the assets of the group after deducting all of its liabilities. Equity instruments are recorded at the proceeds received, net of direct issue costs.
Share capital
Ordinary shares are classifi ed as equity.
Share premium
The share premium represents the amount by which the fair value of the consideration received exceeds the nominal value of shares issued. Incremental costs directly attributable to the issue of new shares or options are shown in equity as a deduction, net of tax, from the proceeds.
Provisions
Provisions are recognised when: the group has a present obligation as a result of a past event; it is probable that the group will be required to settle that obligation and the amount can be reliably estimated. Provisions are measured at management’s best estimate of the expenditure required to settle the obligation at the balance sheet date, and are discounted to present value where the effect is material.
Provisions for warranty costs are recognised at the date of sale of the relevant products, at management’s best estimate of the expenditure required to settle the group’s obligation. Warranty costs are recorded within cost of sales.
Other provisions include legal claims, pension liabilities and tax risks for which it is probable that an outfl ow of resources will be required to settle the obligation.
Borrowings
Borrowings are recognised initially at fair value, net of transaction costs incurred. Subsequently, amounts are stated at amortised cost with the difference being recognised in the income statement over the period of the borrowings using the effective interest rate method.
3. FINANCIAL RISK MANAGEMENT
Financial risk factors
The group’s activities result in exposure to a variety of fi nancial risks: including credit, foreign currencies, liquidity and interest rate risk. Management policies have been established to identify, analyse and monitor these risks, and to set appropriate risk limits and controls. Financial risk management is carried out in accordance with the Treasury Policy. The written principles and policies are reviewed periodically to refl ect changes in market conditions, the activities of the business and laws and regulations affecting our business.
Credit
Credit risk arises primarily from cash and cash equivalents held at fi nancial institutions, and, to a certain extent, from trade receivables relating to our wholesale customers.
Cash balances are only held with counterparties that have a credit risk rating of at least A – as rated by an acknowledged rating agency and a satisfactory credit default swap (CDS) pricing of our fi nancial counterparts. Moreover, to avoid signifi cant concentration of our exposure to particular fi nancial institutions, we ensure that transactions and businesses are properly spread among different counterparties.

TomTom Annual Report and Accounts 201246
Notes to the Consolidated Financial Statements | continued
3. FINANCIAL RISK MANAGEMENT (CONTINUED)
Our exposure to wholesale customers is managed through establishing proper credit limits, continuous credit risk assessments for each individual customer and the purchase of credit insurance to cover a large part of our exposure within our Consumer business.
Our procedures include aligning our credit and trading terms and conditions with our assessment of the individual characteristics and risk profi le of each customer. This assessment is made based on our past experiences and independent ratings from external rating agencies whenever available.
As of 31 December 2012, our total bad debt provision represented approximately 0.2% of our group revenue (2011: 0.1%).
Foreign currencies
We operate internationally and conduct our business in multiple currencies. Revenues are earned in euro, pound sterling, the US dollar and other currencies, and do not necessarily match our cost of sales and other costs which are largely in euro and the US dollar and to a certain extent in other currencies. Foreign currency exposures on our commercial transactions relate mainly to our estimated purchases and sales transactions that are denominated in currencies other than our reporting currency – the euro (€).
We manage our foreign currency transaction risk through the buying and selling of options to cover forecasted net exposures and by entering into forward contracts for near term forecasts and commitments. We aim to cover our exposure for both purchases and sales for the relevant term based on our business characteristics. All such transactions are carried out within the guidelines set by the Treasury Policy.
A 2.5% strengthening/weakening of the euro as of 31 December against the currencies listed below would have increased (decreased) profi t or loss by the amount shown below. This analysis assumes that all other variables remain constant. The analysis was performed on the same basis for 2011.
Table with effect of strengthening/weakening of USD and GBP (€) 2012 2011
Strengthen Weaken Strengthen Weaken
GBP – 545,362 522,534 – 294,344 279,986USD 326,060 – 312,405 499,013 – 474,068 Liquidity and loan covenant
Our approach to managing liquidity is to ensure that we have suffi cient funds to meet our fi nancial obligations when they fall due under both normal and stressed conditions, without incurring unacceptable losses or risking damage to our reputation.
To ensure we have suffi cient cash to meet expected operational expenses, including the servicing of fi nancial obligations we regularly monitor our actual and future cash fl ow requirements taking into account the maturity profi les of fi nancial assets and liabilities and the rolling forecast of the group’s liquidity reserve, which comprises cash and cash equivalents and an undrawn credit facility of €150 million.
This revolving credit facility together with a term loan of €250 million became effective as from 31 December 2012 and will mature on 31 March 2016. Under this facility agreement we are required to meet certain performance indicators relating to interest cover and leverage. In case of breach of our loan covenants, the banks are contractually entitled to request early repayment of the outstanding amount.
We closely monitor the contractual performance indicators and based on the group’s plan for 2013, management expects to be able to comply with the loan covenants during 2013.
The contractual maturity of the principal and interest of our borrowings as of 31 December 2012 is presented below:
(€ in thousands) < 1 year 1-3 years > 3 years
Loan principal 75,000 75,000 100,000Interest1 2,900 3,190 290TOTAL 77,900 78,190 100,290
1 Interest on our variable rate borrowing is estimated assuming that the market interest and the required performance indicators remain constant based on the situation as
at 31 December 2012.

47
3. FINANCIAL RISK MANAGEMENT (CONTINUED)
Interest rates
Our interest rate risk arises primarily from the existing long-term borrowings. These borrowings have a fl oating interest coupon based on Euribor plus a spread which depends on leverage levels. Interest rate risk is hedged with appropriate hedging instruments whenever deemed necessary in accordance with the Treasury Policy. Based on our expectation of interest rate movements in the coming period and the acceptability of our potential exposure our current strategy is not to hedge the interest rate of our current borrowings. Accordingly changes in Euribor may have an impact on the group’s results for the coming year. Market-related interest income is received on the cash balances. It is our intention to prioritise capital preservation to yield and earn a reasonable interest income using vanilla investment instruments like bank deposits and money market fund investments. All transactions and counterparty risk limits are governed by the Treasury Policy.
Capital risk management
The group’s fi nancing policy aims to maintain a capital structure that enables the group to achieve its strategic objectives and daily operational needs, and to safeguard the group’s ability to continue as a going concern.
In order to maintain or adjust the capital structure, the group may issue new shares, adjust its dividend policy, return capital to shareholders or sell assets to reduce debt taking into account relevant interest cover and leverage covenants of our external borrowings as disclosed in note 24.
As of 31 December 2012 our net debt amounted to €86 million (31 December 2011: €194 million).
Further quantitative disclosures are included throughout these consolidated fi nancial statements.
4. CRITICAL ACCOUNTING ESTIMATES AND JUDGEMENTS
The group makes estimates and assumptions concerning the future. The resulting accounting estimates will, by defi nition, seldom equal the related actual results. The estimates and assumptions that have a signifi cant risk of causing a material adjustment to the carrying amounts of assets and liabilities within the next fi nancial year are discussed below.
A – Revenue recognition
When returns are probable, an estimate is made of the expected fi nancial impact of these returns. The estimate is based upon historical data on the return rates and information on the inventory levels in the distribution channel.
The group reduces revenue for estimates of sales incentives. We offer sales incentives, including channel rebates and end-user rebates for our products. The estimate is based on our historical experience taking into account future expectations on rebate payments.
If there is excess stock at retailers when a price reduction becomes effective, the group will compensate its customers on the price difference for their existing stock. Customers are eligible for compensation if certain criteria are met. To refl ect the costs related to known price reductions in the income statement, an accrual is created against revenue based on estimate of inventory levels in the channel and future price reductions.
Multiple element arrangements require TomTom to deliver hardware and/or a number of services under one agreement and/or a number of services under one agreement which is commercially linked. Revenue recognition must be determined separately for each of the deliverables identifi ed, and for that purpose TomTom must estimate a reliable fair value to each deliverable. The fair value is estimated based on the relative stand-alone selling price or using of a combination of estimation and allocation methods allowed by IFRS such as cost plus reasonable margin or residual method if that combination best refl ects a transaction’s substance. Total deferred revenue balance relating to the elements deferred under such multiple element arrangement as at 31 December 2012 amounted to €41 million (31 December 2011: €43 million).

TomTom Annual Report and Accounts 201248
Notes to the Consolidated Financial Statements | continued
4. CRITICAL ACCOUNTING ESTIMATES AND JUDGEMENTS (CONTINUED)
B – Impairment of intangible assets
The group reviews impairment of intangible assets at least on an annual basis. This requires an estimation of the fair value of the cash-generating units to which the intangible assets are allocated. Estimating the fair value amount requires management to make an estimate of the expected future cash fl ows from the cash-generating unit and also to determine a suitable discount rate in order to calculate the present value of those cash fl ows. For additional information on the impairment test reference is made to note 13.
C – Income taxes
The group is subject to income taxes in numerous jurisdictions. The determination of the group’s provision for income tax as well as deferred tax assets and liabilities involve signifi cant judgement and estimates on certain matters and transactions, for which the ultimate outcome may be uncertain. When the fi nal outcome differs from the group’s estimates, such differences will impact the current and deferred income tax assets and liabilities in the period in which such determination is made.
D – Provisions
For our critical accounting estimates and judgements on provisions, refer to note 26.
E – Internally generated technology, databases and tools
Internally generated technology, databases and tools are capitalised in accordance with IAS 38. Assumptions and judgements are made with regard to assessing the expected future economic benefi ts, the economic useful life and the level of completion of the databases. At the point where activities no longer relate to development but to maintenance, capitalisation is discontinued. For additional information refer to note 13.
5. SEGMENT REPORTING
The operating segments are identifi ed and reported on the basis of internal reports about components of the group that are regularly reviewed by the Management Board to assess the performance of the segments.
The group’s internal management reporting is structured based primarily upon the market segments in which the four operating segments – Consumer, Automotive, Business Solutions and Licensing – operate. Consumer generates revenue mainly from the sale of PNDs, maps and related navigation services to end customers. Automotive sells in-dash navigation solutions, as well as automotive grade map and other content and services to customers in the automotive segment. Business Solutions provides fl eet management services and related solutions to fl eet owners and Licensing generates revenue by licensing digital map- and other related content to customers in various different segments.
Management assesses the performance of segments based on the measures of revenue and earnings before interest and taxes (EBIT), whereby the EBIT measure includes allocations of expenses from supporting functions within the group. Such allocations have been determined based on relevant measures that refl ect the level of benefi ts of these functions to each of the operating segments. As the four operating segments serve only external customers, there is no inter-segment revenue. The effects of non-recurring items such as impairment are excluded from management’s measurement basis. Interest income and expenses and tax are not allocated to the segments. There is no measure of segment (non-current) assets and/or liabilities provided to chief operating decision-maker.
Following the change in organisation structure as part of our reorganisation programme, the allocation keys used to allocate the operating expenses of shared functions to the four operating segments have been changed in 2012. Accordingly the comparative information of 2011 has been adjusted to refl ect this change and is, therefore, not necessarily comparable with the previously reported segment information.
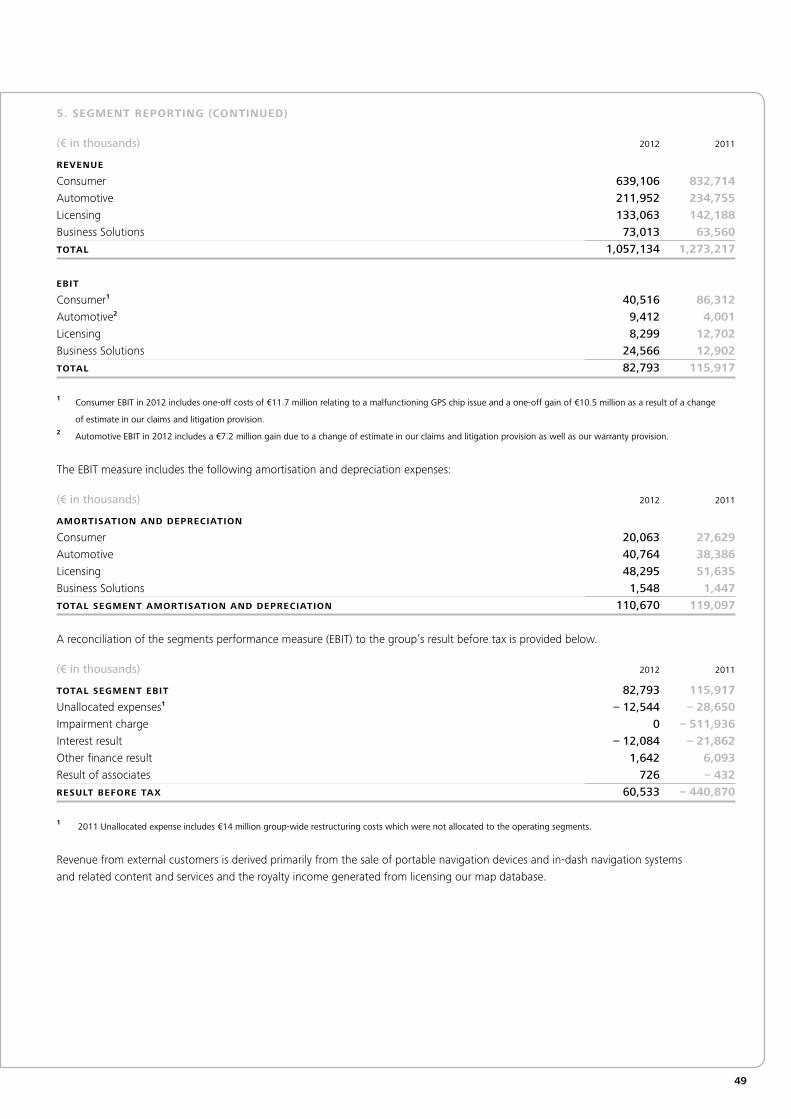
49
5. SEGMENT REPORTING (CONTINUED)
(€ in thousands) 2012 2011
REVENUE
Consumer 639,106 832,714Automotive 211,952 234,755 Licensing 133,063 142,188 Business Solutions 73,013 63,560 TOTAL 1,057,134 1,273,217
EBIT
Consumer1 40,516 86,312Automotive2 9,412 4,001Licensing 8,299 12,702Business Solutions 24,566 12,902TOTAL 82,793 115,917
1 Consumer EBIT in 2012 includes one-off costs of €11.7 million relating to a malfunctioning GPS chip issue and a one-off gain of €10.5 million as a result of a change
of estimate in our claims and litigation provision.2 Automotive EBIT in 2012 includes a €7.2 million gain due to a change of estimate in our claims and litigation provision as well as our warranty provision.
The EBIT measure includes the following amortisation and depreciation expenses:
(€ in thousands) 2012 2011
AMORTISATION AND DEPRECIATION
Consumer 20,063 27,629Automotive 40,764 38,386Licensing 48,295 51,635Business Solutions 1,548 1,447TOTAL SEGMENT AMORTISATION AND DEPRECIATION 110,670 119,097
A reconciliation of the segments performance measure (EBIT) to the group’s result before tax is provided below.
(€ in thousands) 2012 2011
TOTAL SEGMENT EBIT 82,793 115,917Unallocated expenses1 – 12,544 – 28,650Impairment charge 0 – 511,936Interest result – 12,084 – 21,862Other fi nance result 1,642 6,093Result of associates 726 – 432RESULT BEFORE TAX 60,533 – 440,870
1 2011 Unallocated expense includes €14 million group-wide restructuring costs which were not allocated to the operating segments.
Revenue from external customers is derived primarily from the sale of portable navigation devices and in-dash navigation systems and related content and services and the royalty income generated from licensing our map database.

TomTom Annual Report and Accounts 201250
Notes to the Consolidated Financial Statements | continued
5. SEGMENT REPORTING (CONTINUED)
A breakdown of the external revenue to types of products and services and to geographical areas is as follows:
External revenue – products and services
(€ in thousands) 2012 2011
Sale of goods 656,706 866,703Rendering of services 199,440 191,541Royalty revenue 200,988 214,973 1,057,134 1,273,217
External revenue – by geographical areas
(€ in thousands) 2012 2011
Europe 772,818 937,483North America 215,408 256,592Rest of the world 68,908 79,142 1,057,134 1,273,217
The geographical split of our revenue from the sale of goods and services is based on the location of the customers while the split for royalty revenue is based on the coverage of our geographical map data and other content.
Total revenue generated in the Netherlands during 2012 amounted to €77 million (2011: €79 million).
The group has no signifi cant concentration of sales from a particular individual external customer.
The non-current assets within TomTom include a signifi cant portion of the carrying value of the step up resulting from Tele Atlas acquisition in 2008. As this step up is not geographically allocated to the respective regions for internal management reporting, we believe that disclosure of geographic allocation would be highly judgmental and will not give a true representation of geographical spread of our assets.
6. COST OF SALES
The group’s cost of sales consists of material costs for goods sold to customers, royalty and license expenses and fulfi lment costs incurred on inventory sold during the year.
7. REMUNERATION FOR MEMBERS OF THE MANAGEMENT BOARD AND THE SUPERVISORY BOARD
The Remuneration Policy for members of the Management Board is drawn up by the Supervisory Board and approved by the Annual General Meeting.
In accordance with the Dutch Corporate Governance Code, the remuneration of Supervisory Board members does not depend on the results of the company. The company does not grant either stock options or shares to its Supervisory Board members and the company does not provide loans to them.
The on-target bonus percentage is set at 64% of the base salary for members of the Management Board and 80% of the salary for the CEO, and the maximum annual incentive achievable is 96% of the annual base salary for members of the Management Board and for the CEO it is 120% of the annual base salary. The actual bonus pay-out depends on certain challenging fi nancial targets (revenue, EBIT and cash fl ow). The total direct remuneration to or on behalf of members of the Management Board for the year ended 31 December 2012, amounted to approximately €1.8 million (2011: €1.2 million), of which 31% represented bonus payments (2011: 0%). In 2012, the bonus achievement was 69% of the target bonus (2011: 0%).
Overview of salaries, performance related bonuses and other emoluments of the Management Board
The remuneration of the Management Board members comprises of the direct remuneration paid out or payable in relation to their employment in the year and other remuneration related expenses which comprises social security contributions and share based awards. The expenses recognised for share-based awards are determined in accordance with IFRS 2 and do not represent the amounts paid or payable to Management Board members. The expenses for the direct remuneration and other remuneration related expenses are presented on the next page.

51
7. REMUNERATION FOR MEMBERS OF THE MANAGEMENT BOARD AND THE SUPERVISORY BOARD (CONTINUED)
Direct remuneration
(in €) Short-term benefi tsPost employment
benefi tsTotal Direct
remuneration
2012 Salary BonusOther
emoluments
Harold Goddijn 375,000 207,000 0 0 582,000Marina Wyatt 400,000 176,640 0 40,000 616,640Alain De Taeye 375,000 165,600 21,000 37,500 599,100 1,150,000 549,240 21,000 77,500 1,797,740
2011
Harold Goddijn 375,000 0 0 0 375,000Marina Wyatt 400,000 0 0 40,000 440,000Alain De Taeye 375,000 0 21.000 26,491 422,491 1,150,000 0 21.000 66,491 1,237,491
Other remuneration related expenses
(in €)Share-based
expenses
Othershort-term
expenses1
Total includingOther and Direct
remuneration
2012 Harold Goddijn 278,744 45,239 905,983Marina Wyatt 278,744 36,244 931,628Alain De Taeye 278,744 66,599 944,443 836,232 148,082 2,782,054
2011
Harold Goddijn 308,871 7,790 691,661Marina Wyatt 310,589 65,145 815,734Alain De Taeye 308,743 7,790 739,024 928,203 80,725 2,246,419
1 Other short-term expenses in 2012 include the expenses incurred for Mr. Goddijn (€37 thousand) and Mr. De Taeye (€58 thousand) in relation to the crisis levy imposed
by the Dutch government. Although these expenses do not represent actual benefi ts paid to Management Board, they have been included in the table above as the
expenses were incurred in relation to the employment of the Management Board.
The following tables summarise information about stock options granted to members of the Management Board.
Stock option plan Outstanding01-01-2012
Granted in 2012
Exercisedin 2012
Expiredin 2012
Outstanding 31-12-20121
Exerciseprice
Expirydate
Harold Goddijn 181,500 0 0 0 181,500 5.71 16-06-2016Harold Goddijn 150,000 0 0 0 150,000 5.32 12-05-2017Harold Goddijn 150,000 0 0 0 150,000 6.10 09-05-2018Harold Goddijn 0 175,000 0 0 175,000 3.51 09-05-2019Marina Wyatt 605,000 0 0 605,000 0 21.85 10-08-2012Marina Wyatt 542,685 0 0 0 542,685 28.07 09-11-2013Marina Wyatt 181,500 0 0 0 181,500 5.71 16-06-2016Marina Wyatt 150,000 0 0 0 150,000 5.32 12-05-2017Marina Wyatt 150,000 0 0 0 150,000 6.10 09-05-2018Marina Wyatt 0 175,000 0 0 175,000 3.51 09-05-2019Alain De Taeye 181,500 0 0 0 181,500 5.71 16-06-2016Alain De Taeye 150,000 0 0 0 150,000 5.32 12-05-2017Alain De Taeye 150,000 0 150,000 6.10 09-05-2018Alain De Taeye 0 175,000 0 0 175,000 3.51 09-05-2019 2,592,185 525,000 0 605,000 2,512,185 1 The options with expiry date 12 May 2017, 9 May 2018 and 9 May 2019 have not yet vested and contain certain performance conditions.

TomTom Annual Report and Accounts 201252
Notes to the Consolidated Financial Statements | continued
7. REMUNERATION FOR MEMBERS OF THE MANAGEMENT BOARD AND THE SUPERVISORY BOARD (CONTINUED)
For a description of the stock option plans reference is made to note 22: Share-based compensation.
Overview of remuneration of members of the Supervisory Board(€) 2012 2011
Karel Vuursteen (Chairman) 61,000 61,000 Doug Dunn 47,000 47,000 Guy Demuynck 51,000 51,000 Rob van den Bergh 47,000 47,000 Ben van der Veer 50,000 50,000 Peter Wakkie 48,000 48,000 304,000 304,000
8. ADDITIONAL INFORMATION REGARDING OPERATING EXPENSES
Included in the operating expenses are, amongst others, the following items:
(€ in thousands) 2012 2011
Salaries1 150,781 176,060Social security costs 25,493 23,646Pensions 7,068 8,474Share-based compensation 7,140 7,985Other2 36,248 23,634PERSONNEL EXPENSES 226,730 239,799
1 Salaries in 2011 include an amount of €10.1 million related to restructuring expenses.2 Other personnel expenses include costs of secondary benefi ts such as health insurance, vehicle lease payments, sales commissions and bonuses.
Pension costs include the costs of the defi ned contribution plans amounting to €6.8 million (2011: €8.2 million) and the cost of the German defi ned benefi t plan of € 0.3 million (2011: loss of € 0.2 million). The 2011 defi ned benefi t costs included actuarial gains of € 0.5 million. The group’s pension plans primarily comprise of defi ned contribution plans, limiting the employer’s legal obligation to the amount it agrees to contribute during the period of employment.
Employees in the United States are offered the opportunity to participate in the 401K pension plan, which involves no contribution or obligation from the group besides withholding and paying the employee contribution.
Average number of employees
The average number of employees in 2012 was 3,477 (2011: 3,698) spread across the following functional areas:2012 2011
Research and development 2,226 2,286Marketing 109 112Sales, general and administrative 1,142 1,300 3,477 3,698
At 31 December 2012, the group had 3,490 (2011: 3,677) employees. During 2012, 2,208 of TomTom’s employees worked outside The Netherlands (2011: 2,226).
Operating expenses include an amount of €111 million for depreciation and amortisation expenses (2011: €119 million).
(€ in thousands) 2012 2011
Amortisation 95,999 98,590Depreciation 14,671 20,507TOTAL AMORTISATION AND DEPRECIATION 110,670 119,097
The costs for operating leases in 2012 amounted to € 13.7 million (2011: €18.5 million).

53
9. FINANCIAL INCOME AND EXPENSES
Financial income and expenses include the following items:
(€ in thousands) 2012 2011
Interest income 1,197 2,871Interest expense – 13,281 – 24,733INTEREST RESULT – 12,084 – 21,862
Other fi nancial result 216 1,497Exchange rate result 1,426 4,596OTHER FINANCIAL RESULT 1,642 6,093
The foreign exchange result includes results related to hedging contracts and balance sheet item revaluations. Hedging contracts are entered to protect the group from adverse exchange rate fl uctuations that may result from USD and GBP exposures.
The interest expense relates mainly to interest paid on our borrowings and amortised transaction costs (see note 24).
10. INCOME TAX
The activities of the group are subject to corporate income tax in several countries, depending on presence and activity. The applicable statutory tax rates vary between 12.5% and 41.0%. The different tax jurisdictions in which we operate can cause the effective tax rate to differ from the Dutch corporate tax rate.
(€ in thousands) 2012 2011
Current tax – 54,956 9,876Deferred tax – 13,704 – 11,795INCOME TAX EXPENSE – 68,660 – 1,919
The effective tax rate was – 113.4% compared to 12.9% last year (excluding the effects of the 2011 impairment). The reconciliation between the tax charge on the basis of the Dutch tax rate and the effective tax rate is as follows:
2012 2011
DUTCH TAX RATE 25.0% 25.0%Higher weighted average statutory rate on group activities 3.1% 8.2%Income exempted from tax – 14.0% – 8.8%Non tax deductible share options 1.1% 1.7%Utilisation of losses not previously capitalised – 8.1% – 5.9%Effect of prior years’ settlements and/or adjustments – 122.3% – 3.7%Other 1.8% – 3.6%EFFECTIVE TAX RATE – 113.4% 12.9%
2012 2011
Effective tax rate including impairment – 113.4% – 0.4%Tax effect of impairment charge 0% 13.3%Effective tax rate excluding impairment – 113.4% 12.9%
Due to a €80 million one-off tax gain as a result of a settlement of prior years’ tax issues with the Dutch tax authority, the tax result was a gain of €68.7 million (2011: gain of €1.9 million). Excluding the impact of this settlement, the effective tax rate in 2012 would have been 18.8%.
The income tax credited directly in equity in 2012 amounted to €0.5 million (2011: nil) which is related to the deferred tax effect on the actuarial gain recognised in Other comprehensive income as the result of applying IAS 19 Revised.

TomTom Annual Report and Accounts 201254
Notes to the Consolidated Financial Statements | continued
11. GOVERNMENT GRANTS
The group recognised income related to government grants of €7.0 million (2011: €9.9 million) in respect of research and development activities performed by the group. The group is not obliged to refund these amounts. Government grants are reported as deductions of the respective operating expenses.
12. EARNINGS PER SHARE
The calculation of basic and diluted earnings per share is based on the following data:
(€ in thousands) 2012 2011
EARNINGS Net result attributed to equity holders 128,724 – 437,844
ADJUSTED EARNINGS
Net result attributed to equity holders 128,724 – 437,844Impairment charge 0 511,936Amortisation of acquired intangibles 52,171 63,529Restructuring expenses 0 14,798Tax effect of adjustments – 13,043 – 30,699Tax gain from settlement of prior years’ tax issues – 80,000 0ADJUSTED EARNINGS 87,852 121,720
2012 2011
NUMBER OF SHARES Weighted average number of ordinary shares for basic earnings per share 221,895,012 221,874,248 EFFECT OF DILUTIVE POTENTIAL ORDINARY SHARES Share options and restricted stock 128,508 29,686WEIGHTED AVERAGE NUMBER OF ORDINARY SHARES FOR DILUTED EARNINGS PER SHARE 222,023,520 221,903,934
EARNINGS PER SHARE ( IN €) Basic 0.58 – 1.97Diluted1 0.58 – 1.97
ADJUSTED EARNINGS PER SHARE2 ( IN €) Basic 0.40 0.55Diluted 0.40 0.55
1 In 2011, 29,686 potential diluted shares from assumed conversion were not taken into account as the effect would be anti-dilutive.2 Adjusted earnings per share is not an IFRS performance measure and hence is not comparable across companies.
Basic earnings per share
Basic earnings per share is calculated by dividing the profi t attributable to equity holders of the company by the weighted average number of ordinary shares outstanding during the year.
Diluted earnings per share
Diluted earnings per share is calculated by adjusting the weighted average number of ordinary shares outstanding to assume conversion of all potential dilutive ordinary shares arising from share options and other equity-settled share-based plans. For the share options, a calculation is performed to determine the number of shares that could have been acquired at fair value (determined as the average annual market share price of the company’s shares), based on the monetary value of the subscription rights attached to outstanding share options. The number of shares calculated as above is compared with the number of shares that would have been issued, assuming the exercise of the share options. When the effect of the options and other equity-settled share based plans is anti-dilutive, the number is excluded from the calculation of diluted earnings.
Adjusted earnings per share
Adjusted earnings per share is calculated by dividing the adjusted earnings by the weighted average number of ordinary and diluted shares outstanding during the year.

55
13. INTANGIBLE ASSETS
(€ in thousands) 2012 2011
Goodwill 381,569 381,569Other intangible assets 821,233 871,528TOTAL INTANGIBLE ASSETS 1,202,802 1,253,097
(€ in thousands) GoodwillDatabaseand tools
Internallygenerated
technology Other1 Total
Balance as at 31 December 2010 Investment cost 1,902,489 918,102 76,229 218,785 3,115,605Accumulated amortisation and impairment – 1,047,776 – 124,864 – 37,571 – 104,418 – 1,314,629 854,713 793,238 38,658 114,367 1,800,976MOVEMENTS Investments 0 25,116 29,274 4,022 58,412Impairment charges – 473,144 0 0 – 38,792 – 511,936Transfers between categories 0 0 9,759 – 8,148 1,611Amortisation charges 0 – 49,509 – 25,161 – 23,920 – 98,590Currency translation differences 0 2,788 – 110 – 54 2,624 – 473,144 – 21,605 13,762 – 66,892 – 547,879Balance as at 31 December 2011 Investment cost 1,902,489 945,711 115,064 214,605 3,177,869Accumulated amortisation and impairment – 1,520,920 – 174,078 – 62,644 – 167,130 – 1,924,772 381,569 771,633 52,420 47,475 1,253,097MOVEMENTS Investments 0 22,741 16,478 7,169 46,388Amortisation charges 0 – 62,179 – 20,362 – 13,458 – 95,999Currency translation differences 0 – 605 83 – 162 – 684 0 – 40,043 – 3,801 – 6,451 – 50,295Balance as at 31 December 2012Investment cost 1,902,489 967,729 131,527 221,612 3,223,357Accumulated amortisation and impairment – 1,520,920 – 236,139 – 82,908 – 180,588 – 2,020,555 381,569 731,590 48,619 41,024 1,202,802
1 Other intangible assets include technology, customer relationships, brand name and software.
All intangible assets besides goodwill have fi nite useful lives. Goodwill has an indefi nite useful life. The database as acquired at acquisition date represents all stored routing data used for our digital maps and has a remaining useful life of 14 years and 5 months.
The amortisation charges totalling to €96,0 million (2011: €98.6 million) are included in the following line items in the Income Statement: amortisation of technology and databases: €84.0 million (2011: €84.6 million); R&D expenses: €5.8 million (2011: €9.0 million); marketing expenses: €0.0 million (2011: €1.3 million) and selling, general and administrative expenses: €6.2 million (2011: €3.7 million). During 2012 the group reduced the estimated economic useful life of map production tools from 10 to 5 years to better refl ect faster technological change. This change resulted in an additional amortisation charge in the current year of approximately €7.5 million. The same level of impact is expected in the coming two years and will decline after that period as a major portion of these tools will be fully amortised in 2014.
In 2011 we impaired €38.8 million of other intangibles mainly comprising of the customer relationships and the brand name of our Licensing segment. The impairment was recorded following the discontinuation of business relationships with certain customers and the decision to discontinue using the Tele Atlas brand name. The impairment amount recorded was based on the respective carrying amount of the assets.
Impairment test for goodwill
Goodwill is allocated to the group’s operating segments identifi ed according to the core business activities as monitored by management. An impairment test on goodwill is performed at least on an annual basis or whenever management identifi es conditions that may trigger a risk of impairment.

TomTom Annual Report and Accounts 201256
Notes to the Consolidated Financial Statements | continued
13. INTANGIBLE ASSETS (CONTINUED)
A segment-level summary of the goodwill allocation for our segments in 2012 and 2011 is presented below:
(€ in thousands) 2012 2011
Consumer 168,687 168,687Automotive 83,389 83,389 Licensing 85,217 85,217 Business Solutions 44,276 44,276 TOTAL 381,569 381,569
The recoverable amount of a segment is determined based on the higher of the value in use or fair value less cost to sell calculations. The fair value less cost to sell resulted in a higher recoverable amount.
The calculations of fair value less cost to sell use post-tax cash fl ow projections based on fi nancial forecasts approved by management covering a six year period (‘forecasted period’). Management’s cash fl ow projections for each of the segments in the forecasted period are based on management’s assumptions on the expected revenue growth rate, gross margin and operating margin after allocation of operating expenses from shared units, taking into account management’s expectation of market size and market share development. The expected revenue growth rate incorporates the high level of decline in the PND revenue but also the growth potential of other revenue streams within Consumer and other segments. Gross margin and operating margin projections were aligned with the expected revenue developments.
The growth rates after the forecasted period as well as the discount rate used for each of the segments are presented below.
2012
Consumer Automotive LicensingBusiness
Solutions
Revenue – perpetual growth1 – 1.0% 1.0% 0% 1.0%Operating expenses – perpetual growth1 – 1.0% 1.0% 0% 1.0%Discount rate2 10.0% 10.0% 10.0% 9.5%
2011
Consumer Automotive LicensingBusiness
Solutions
Revenue – perpetual growth1 – 1.0% 1.0% 0% 1.0%Operating expenses – perpetual growth1 – 1.0% 1.0% 0% 1.0%Discount rate2 10.0% 10.0% 10.0% 9.5%
1 Weighted average growth rate used to extrapolate cash fl ows beyond the forecasted and extrapolated period.2 Post-tax discount rate applied to the cash fl ow projections.
Discount rates used are post-tax and refl ect specifi c risks relating to the relevant operating segments. Management considered the effects of applying a pre-tax approach and concluded that this will not materially change the outcome of the impairment test.
Our expectations and input to the impairment calculation as well as the overall outcome have been compared with the available external information from various analysts.
The impairment test performed resulted in no goodwill impairment for 2012 (2011: €473 million). The impairment charge recorded in 2011 was triggered by a faster than expected decline in the PND market size.
Management performed a sensitivity analysis on the relevant key assumptions in our 2012 year-end annual impairment testing. A reasonably possible change in any of the above-mentioned key assumptions as well as assumptions in the forecasted period would not cause the fair value less costs to sell of each segment to fall below the level of their respective carrying value.
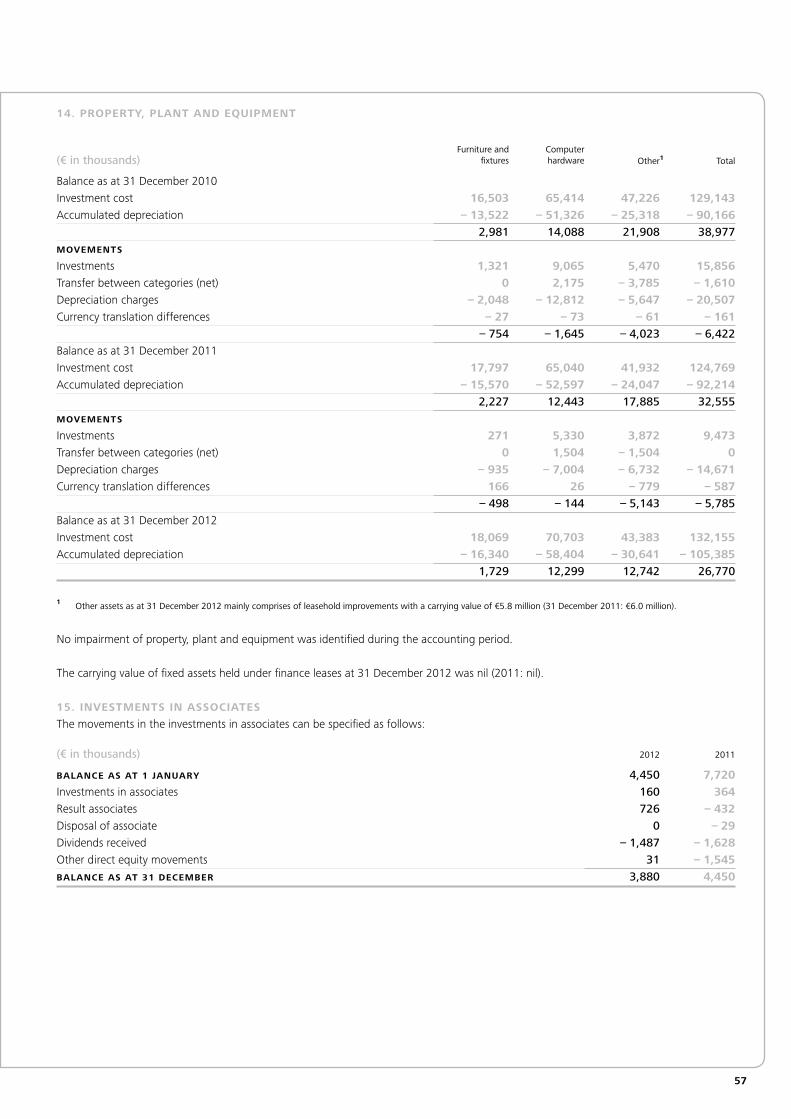
57
14. PROPERTY, PLANT AND EQUIPMENT
(€ in thousands)Furniture and
fi xturesComputer hardware Other Total
Balance as at 31 December 2010Investment cost 16,503 65,414 47,226 129,143Accumulated depreciation – 13,522 – 51,326 – 25,318 – 90,166 2,981 14,088 21,908 38,977MOVEMENTS
Investments 1,321 9,065 5,470 15,856Transfer between categories (net) 0 2,175 – 3,785 – 1,610Depreciation charges – 2,048 – 12,812 – 5,647 – 20,507Currency translation differences – 27 – 73 – 61 – 161 – 754 – 1,645 – 4,023 – 6,422Balance as at 31 December 2011Investment cost 17,797 65,040 41,932 124,769Accumulated depreciation – 15,570 – 52,597 – 24,047 – 92,214 2,227 12,443 17,885 32,555MOVEMENTS
Investments 271 5,330 3,872 9,473 Transfer between categories (net) 0 1,504 – 1,504 0Depreciation charges – 935 – 7,004 – 6,732 – 14,671Currency translation differences 166 26 – 779 – 587 – 498 – 144 – 5,143 – 5,785Balance as at 31 December 2012Investment cost 18,069 70,703 43,383 132,155Accumulated depreciation – 16,340 – 58,404 – 30,641 – 105,385 1,729 12,299 12,742 26,770
1 Other assets as at 31 December 2012 mainly comprises of leasehold improvements with a carrying value of €5.8 million (31 December 2011: €6.0 million).
No impairment of property, plant and equipment was identifi ed during the accounting period.
The carrying value of fi xed assets held under fi nance leases at 31 December 2012 was nil (2011: nil).
15. INVESTMENTS IN ASSOCIATES
The movements in the investments in associates can be specifi ed as follows:
(€ in thousands) 2012 2011
BALANCE AS AT 1 JANUARY 4,450 7,720Investments in associates 160 364 Result associates 726 – 432Disposal of associate 0 – 29Dividends received – 1,487 – 1,628Other direct equity movements 31 – 1,545BALANCE AS AT 31 DECEMBER 3,880 4,450
1

TomTom Annual Report and Accounts 201258
Notes to the Consolidated Financial Statements | continued
15. INVESTMENTS IN ASSOCIATES (CONTINUED)
The estimated full year revenues and net profi ts of the associates and their aggregated assets (excluding goodwill) and liabilities are as follows:
2012
Name of associatePlace of
incorporation Assets LiabilitiesRevenues
full yearNet result
full yearInterest
held
(€ in thousands)
Infotech enterprises1, 2, 3 India 193,408 33,919 216,442 22,236 1.35%MapIT1 South Africa 4,664 306 3,374 972 49.00%Beijing GoldenTom China 5,547 5,531 2,288 – 364 49.00%WayTag4 South Africa 192 767 0 – 435 16.00%
2011
Name of associatePlace of
incorporation Assets LiabilitiesRevenues
full yearNet result
full yearInterest
held
(€ in thousands)
Infotech enterprises1, 2, 3 India 115,316 34,780 171,411 40,438 1.35%MapIT1 South Africa 7,546 272 4,552 2,102 49.00%Beijing GoldenTom China 1,234 1,229 813 – 391 49.00%
1 These associates have a 31 March year-end. Data for calculating the result associate, based on the equity method, is obtained from January through to December.
The summarised fi nancial information presented above is based on fi nancial statements for the year ending 31 March 2012 and 31 March 2011.2 Infotech is regarded as an associate as TomTom is represented in the Supervisory Board.3 The fair value of the investment in Infotech is € 3.7 million (2011 € 2.4 million).4 Waytag is regarded as an associate as TomTom is represented in the Board of Directors.
16. INVENTORIES
(€ in thousands) 2012 2011
Finished goods 26,036 33,969 Components and sub-assemblies 18,347 31,533INVENTORIES 44,383 65,502
The amount of inventories recognised as an expense when the inventories are sold and included in cost of sales amounted to €355 million (2011: €432 million).
As a result of the write-down of inventories to their net realisable value, the group recognised a cost of €10.8 million (2011: €11.2 million). The costs are included in cost of sales.
17. TRADE RECEIVABLES
(€ in thousands) 2012 2011
Gross trade receivables 151,697 186,753 Allowance for doubtful receivables – 1,863 – 1,814TRADE RECEIVABLES (NET) 149,834 184,939
We expect to recover all receivables within a year. An allowance has been made for estimated unrecoverable amounts from the sale of goods. The carrying amount of trade receivables approximates their fair value. The group does not hold any collateral over these balances.

59
17. TRADE RECEIVABLES (CONTINUED)
The group’s exposure to credit risk is infl uenced mainly by the individual characteristics of each customer. There is some concentration of credit risk with certain of our large customers’ accounts. Management actively monitors the credit risk related to these customers and takes pro-active action to reduce credit limits if required. In our Consumer business, credit risk is to some extent further mitigated by the purchase of insurance, however it is not possible to insure all open credit exposures. Automotive, Licensing and Business Solutions customers are not insured for credit risk. The following summarises the movement in the allowance for doubtful trade receivables account:
(€ in thousands) 2012 2011
Balance as at 1 January – 1,814 – 3,360Additional receivables impairment – 1,856 – 2,597Receivables written-off during the year as uncollectible 1,163 2,166Unused amounts reversed 635 2,025Currency translation differences 9 – 48BALANCE AS AT 31 DECEMBER – 1,863 – 1,814
The following table sets out details of the age of trade accounts receivable that are not overdue, as the payment terms specifi ed in the terms and conditions established with our customers have not been exceeded, and an analysis of overdue amounts and related provisions for doubtful trade accounts receivable:
(€ in thousands) 2012 2011
Of which: Not overdue 117,574 168,060Overdue < 3 months 32,583 17,6173 to 6 months 299 999Over 6 months 1,241 77Less provision – 1,863 – 1,814TRADE RECEIVABLES (NET) 149,834 184,939
The provisions recorded in 2012 and 2011 are mainly related to the overdue amounts.
Trade accounts receivable include amounts denominated in the following major currencies:
(€ in thousands) 2012 2011
EUR 60,464 81,228GBP 19,490 16,618USD 53,772 70,072Other 16,108 17,021TRADE RECEIVABLES (NET) 149,834 184,939
18. OTHER RECEIVABLES AND PREPAYMENTS
(€ in thousands) 2012 2011
Prepayments 6,102 7,545VAT and other taxes 7,599 6,410Unbilled revenue 7,758 19,689Deferred cost of sales 9,495 3,175Other receivables 4,340 14,423 35,294 51,242
The carrying amount of the other receivables and prepayments approximates their fair value.

TomTom Annual Report and Accounts 201260
Notes to the Consolidated Financial Statements | continued
19. OTHER FINANCIAL ASSETS
Other fi nancial assets include derivative fi nancial instruments carried at fair value through profi t or loss.
(€ in thousands) 2012 2011
Assets Liabilities Assets Liabilities
Derivatives at fair value through profi t or loss 444 – 85 2,784 – 116
Derivatives at fair value through profi t or loss
The notional principal amounts of the outstanding forward foreign exchange and option contracts at 31 December 2012 were €62 million (2011: €64 million).
All our outstanding options and forwards have a contractual maturity of less than one year.
20. CASH AND CASH EQUIVALENTS
(€ in thousands) 2012 2011
Cash at banks 140,205 192,861Deposits 24,254 718 164,459 193,579
Cash and cash equivalents consist of cash held by the group partly invested in short-term bank deposits with an original maturity of three months or less. The carrying amount of cash and cash equivalents approximates its fair value. All cash and cash equivalents are available for immediate use by the group.
21. SHAREHOLDERS’ EQUITY
2012 2011
Number (€ in thousands) Number (€ in thousands)
AUTHORISED Ordinary shares 600,000,000 120,000 600,000,000 120,000Preferred shares 300,000,000 60,000 300,000,000 60,000 900,000,000 180,000 900,000,000 180,000ISSUED AND FULLY PAID Ordinary shares 221,895,012 44,379 221,895,012 44,379
All shares have a par value of €0.20 per share (2011: €0.20 per share). Further information on the rights, restrictions and other conditions attached to ordinary and preferred shares is provided in the Corporate Governance section in the Annual Report.
In 2012, no shares were issued following the exercise of stock options by employees (2011: 86,927).
Our reserves are freely distributable except for €110.0 million of legal reserves (2011: €70.1 million) Note 6 in our company fi nancial statements provides an overview of our non-distributable reserves.
Protection mechanism
The Corporate Governance section of this Annual Report provides a detailed description regarding the use of Stichting Continuiteit TomTom as a protection measure against hostile takeovers.
Management is of the opinion that the call option does not represent a signifi cant value as meant in IAS 1, paragraph 31 due to the fact that the likelihood that the call option will be exercised is remote. In the remote event that the call option is exercised, the B preferred shares which are issued are intended to be cancelled shortly after issuance. The option is therefore not accounted for in the annual accounts nor is any additional information as meant in IAS 32 and 39 provided.
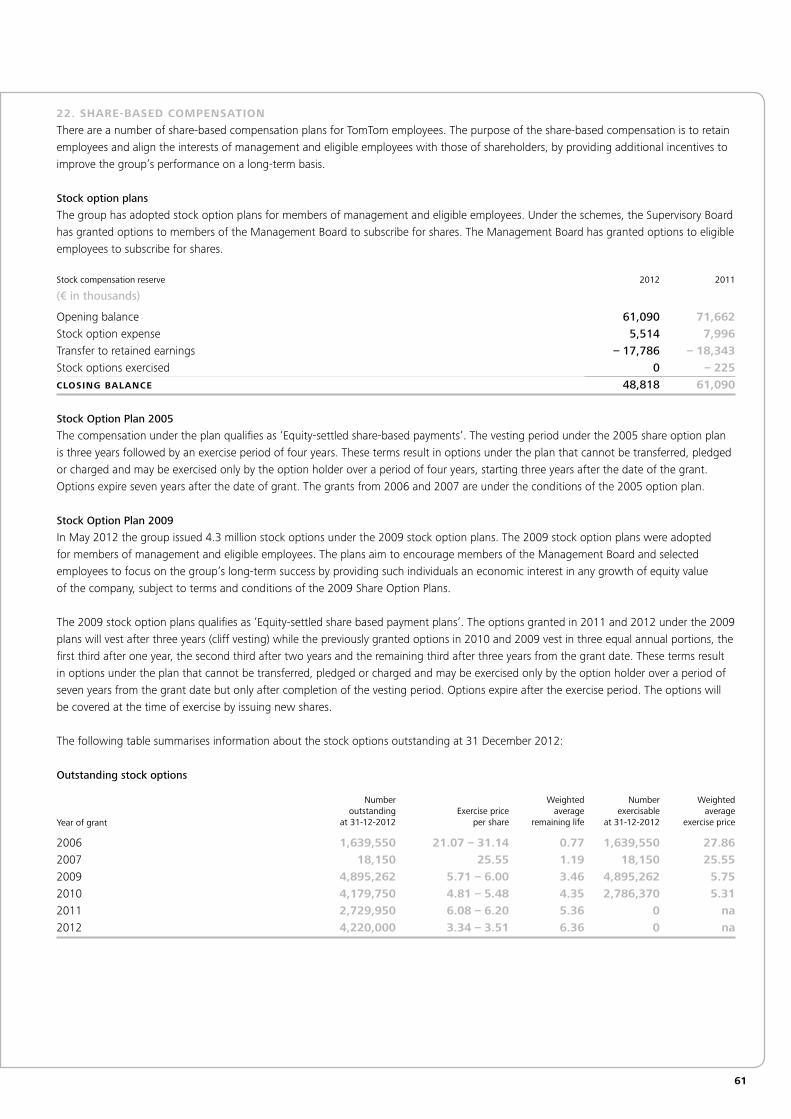
61
22. SHARE-BASED COMPENSATION
There are a number of share-based compensation plans for TomTom employees. The purpose of the share-based compensation is to retain employees and align the interests of management and eligible employees with those of shareholders, by providing additional incentives to improve the group’s performance on a long-term basis.
Stock option plans
The group has adopted stock option plans for members of management and eligible employees. Under the schemes, the Supervisory Board has granted options to members of the Management Board to subscribe for shares. The Management Board has granted options to eligible employees to subscribe for shares.
Stock compensation reserve 2012 2011
(€ in thousands)
Opening balance 61,090 71,662Stock option expense 5,514 7,996Transfer to retained earnings – 17,786 – 18,343Stock options exercised 0 – 225CLOSING BALANCE 48,818 61,090
Stock Option Plan 2005
The compensation under the plan qualifi es as ‘Equity-settled share-based payments’. The vesting period under the 2005 share option plan is three years followed by an exercise period of four years. These terms result in options under the plan that cannot be transferred, pledged or charged and may be exercised only by the option holder over a period of four years, starting three years after the date of the grant. Options expire seven years after the date of grant. The grants from 2006 and 2007 are under the conditions of the 2005 option plan.
Stock Option Plan 2009
In May 2012 the group issued 4.3 million stock options under the 2009 stock option plans. The 2009 stock option plans were adopted for members of management and eligible employees. The plans aim to encourage members of the Management Board and selected employees to focus on the group’s long-term success by providing such individuals an economic interest in any growth of equity value of the company, subject to terms and conditions of the 2009 Share Option Plans.
The 2009 stock option plans qualifi es as ‘Equity-settled share based payment plans’. The options granted in 2011 and 2012 under the 2009 plans will vest after three years (cliff vesting) while the previously granted options in 2010 and 2009 vest in three equal annual portions, the fi rst third after one year, the second third after two years and the remaining third after three years from the grant date. These terms result in options under the plan that cannot be transferred, pledged or charged and may be exercised only by the option holder over a period of seven years from the grant date but only after completion of the vesting period. Options expire after the exercise period. The options will be covered at the time of exercise by issuing new shares.
The following table summarises information about the stock options outstanding at 31 December 2012:
Outstanding stock options
Year of grant
Number outstanding
at 31-12-2012Exercise price
per share
Weighted average
remaining life
Number exercisable
at 31-12-2012
Weighted average
exercise price
2006 1,639,550 21.07 – 31.14 0.77 1,639,550 27.862007 18,150 25.55 1.19 18,150 25.552009 4,895,262 5.71 – 6.00 3.46 4,895,262 5.752010 4,179,750 4.81 – 5.48 4.35 2,786,370 5.312011 2,729,950 6.08 – 6.20 5.36 0 na2012 4,220,000 3.34 – 3.51 6.36 0 na

TomTom Annual Report and Accounts 201262
Notes to the Consolidated Financial Statements | continued
22. SHARE-BASED COMPENSATION (CONTINUED)
A summary of the group’s stock option plans and the movements during the years 2012 and 2011 are presented below:
Option plans 2012
Weighted average exercise
price 2011
Weighted average exercise
price
Outstanding at the beginning of the year 16,724,749 9.25 17,188,562 11.06Granted 4,335,000 3.50 3,164,950 6.11 Exercised 0 na – 84,428 5.72 Expired – 1,969,560 16.10 0 naForfeited – 1,407,527 7.53 – 3,544,335 15.31 OUTSTANDING AT THE END OF THE YEAR 17,682,662 7.21 16,724,749 9.25
Performance share plan
The cash settled performance shares are conditional on the employee completing three years of service (the vesting period). On 31 December 2012 the liability with regard to the performance share plan was €1.8 million (2011: €0.3 million).
The following table provides the movement in the number of performance shares.
Performance share plans 2012 2011
Outstanding at the beginning of the year 534,667 363,000Exercised – 4,967 – 280,390Granted 1,054,150 571,800Cancelled 0 – 24,833Forfeited – 176,100 – 94,910OUTSTANDING AT THE END OF THE YEAR 1,407,750 534,667
Restricted stock plan
In 2011 the group introduced a restricted stock plan to retain a selected group of young talented employees. Each restricted-stock unit gives the right to receive one TomTom share after a three-year vesting period and qualifi es as an equity-settled plan. In 2012 an additional grant with the same conditions was made. The costs that arise from this plan are spread over the vesting period and have been determined based on TomTom’s share price on the grant date. Total 2012 stock compensation expenses charged to the stock compensation reserve for this plan amounted to €133 thousand (2011: €60 thousand). As this plan is not material, no further disclosures are provided.
Valuation assumptions
The fair value of the performance shares was determined using the applicable share price at the grant date and subsequent reporting date. The fair value of the share options granted in May 2012 and May 2011 was determined by the binomial tree model. This model contains the input variables, including the risk-free interest rate, volatility of the underlying share price, exercise price, and share price at the date of grant. The fair value calculated is allocated on a straight-line basis over the vesting period, based on the group’s estimate of equity instruments that will eventually vest.
The input into the stock option valuation model is as follows:2012 2011
Share price at grant date (€) 3.49 6.04Weighted average exercise price (€) 3.34 – 3.51 6.08 – 6.20Weighted average expected volatility 52% 50%Expected average option life 5.3 5.3Weighted average risk free rate 0.99% 2.82%Expected dividends Zero Zero
The option valuation models require the input of highly subjective assumptions, including the expected stock price volatility. Volatility is determined using industry benchmarking for listed peer group companies, as well as the historic volatility of the TomTom NV stock. The group’s employee stock options have characteristics signifi cantly different from those of traded options, and changes in the subjective input assumptions can affect the fair value estimate.

63
23. NON-CONTROLLING INTERESTS (MINORITY INTERESTS)
The movements in the non-controlling interests were as follows:
(€ in thousands) 2012 2011
Opening balance at 1 January 2,451 5,416Non-controlling interest in the net result of subsidiaries 469 – 1,107Dividends paid – 317 – 542Change in share of non-controlling interests 0 – 960Currency translation differences 39 – 356CLOSING BALANCE AT 31 DECEMBER 2,642 2,451
24. BORROWINGS
(€ in thousands) 2012 2011
Non-current 173,437 0Current 73,703 383,810TOTAL BORROWINGS 247,140 383,810
On 31 December 2012 our borrowings amounted to €250 million. This is made up of a term loan which was drawn down under the forward start facility entered into in April 2011. This replaced our previous loan facility which was fully repaid in December 2012. In addition to the €250 million term loan, the new facility also includes a revolving credit facility of €150 million which was unutilised at the end of 2012. The total amount repaid in 2012 amounted to €388 million.
The carrying amount of the borrowings is denominated in euro and includes transaction costs of €2.9 million which will be amortised over the term of the loan. The interest is in line with market conditions and is based on Euribor plus a spread that depends on certain leverage covenants.
The average interest percentage paid on the borrowings in 2012 was 1.9% (2011: 3.1%).
Under the covenants of the new facility the group is required to meet certain performance indicators with regard to its interest cover (4.0) and leverage ratio (3.0) which are tested twice a year. Interest cover is defi ned as the ratio of the last twelve months (‘LTM’) EBITDA to LTM interest expense for the relevant test period. The leverage ratio is defi ned as the ratio of total consolidated net debt as at the testing date to the consolidated LTM EBITDA in respect of the relevant period ending on that date. In case of a breach of these covenants the banks are contractually entitled to request early repayment of the outstanding amount.
The new term loan has a notional amount of €250 million with a contractual repayment schedule of €75 million on each of 31 December 2013 and 2014 and the remaining €100 million on 31 March 2016. Based on this maturity profi le, the €75 million due on 31 December 2012 is presented as a current liability and the remaining €175 million as a non-current liability.
As the proceeds of the borrowings were received on 31 December 2012 and because the contractual interest rate is based on market interest rates plus a certain margin, we estimate the fair value of the borrowings to approximate their carrying value.
The fair value of the outstanding borrowings in 2011 were estimated to approximate their notional amount.

TomTom Annual Report and Accounts 201264
Notes to the Consolidated Financial Statements | continued
25. DEFERRED INCOME TAX
As at 31 December 2012, the group had a deferred tax liability of €171 million (2011: €182 million) and a deferred tax asset of €14 million (2011: €10 million). The deferred tax asset and liability result from timing differences between the tax and accounting treatment of the amortisation of intangible assets, tax-loss carry-forwards and certain provisions.
(€ in thousands) 2012 2011
DEFERRED TAX
To be realised after more than 12 months – 157,043 – 168,621To be realised within 12 months – 256 – 3,159 – 157,299 – 171,780
The movement of deferred tax is as follows:
(€ in thousands)
Stock compensation
expense OtherIntangible
assets ProvisionsAssessed
losses Total
BALANCE AS AT 31 DECEMBER 2010 2,701 476 – 258,462 4,988 61,548 – 188,749Charged / (released) to income – 2,619 – 277 26,122 – 968 – 10,463 11,795Currency translation differences 0 138 7,251 130 – 2,345 5,174BALANCE AS AT 31 DECEMBER 2011 82 337 – 225,089 4,150 48,740 – 171,780Charged / (released) to income 882 – 606 16,100 4,596 – 7,268 13,704Charged / (released) to equity 0 0 0 503 0 503Currency translation differences 0 – 61 1,860 – 134 – 1,391 274BALANCE AS AT 31 DECEMBER 2012 964 – 330 – 207,129 9,115 40,081 – 157,299
Deferred tax balances are presented in the balance sheet as follows:
(€ in thousands) 2012 2011
DEFERRED TAX
Deferred tax assets 13,610 10,493Deferred tax liabilities – 170,909 – 182,273 – 157,299 – 171,780
The group has in some jurisdictions tax losses carried forward for which no deferred tax asset has been recognised. The amounts as well as the possible future utilisations of such losses may be subject to the outcome of certain discussions with the tax authorities and hence the estimated amounts are not included in these annual accounts.
26. PROVISIONS
(€ in thousands) 2012 2011
Non-current 48,268 50,114Current 33,192 51,213 81,460 101,327
The movements in each category of provision are as follows:
(€ in thousands) WarrantyClaims & litigation Other Total
BALANCE AT 1 JANUARY 2011 46,123 53,895 9,270 109,288Increases in provisions 27,312 33,824 198 61,334Utilised – 27,861 – 4,805 – 1,062 – 33,728Released – 2,401 – 32,485 – 681 – 35,567BALANCE AS AT 1 JANUARY 2012 43,173 50,429 7,725 101,327Increases in provisions 25,138 10,435 2,462 38,035Utilised – 23,750 – 5,895 – 877 – 30,522Released – 8,770 – 18,530 – 80 – 27,380BALANCE AS AT 31 DECEMBER 2012 35,791 36,439 9,230 81,460

65
26. PROVISIONS (CONTINUED)
Warranty provision
The group generally offers warranties for its navigation products. Management estimates the related provision for future warranty claims based on historical warranty claim information, as well as evaluating recent trends that might suggest that past cost information may differ from future claims. As recent trends show that the average return rate for our automotive products is declining, we have changed the assumption used to estimate the warranty provision. This resulted in a release of €5.7 million.
Out of the total warranty provision of €35.8 million, we estimate that an amount of €22.1 million will be utilised within 12 months and the remaining amount is expected to be utilised within the 24 months thereafter.
Claims and litigation
The group made a provision for potential legal risks, potential tax penalties that may arise from various tax audits and other risks in various jurisdictions. The legal matters mainly consist of intellectual property infringement issues. In the normal course of business, the group receives claims relating to allegations that we have infringed intellectual property assets. In such cases the companies making the claims seek payments that may take the form of licences and/or damages. While these claims will be resisted, some are likely to be settled by negotiation and others are expected to result in litigation.
The cases and claims against the group often raise diffi cult and complex factual and legal issues which are subject to many uncertainties and complexities, including but not limited to the facts and circumstances of each particular case and claim, the jurisdiction in which each suit is brought, and the differences in applicable law. In the normal course of business, management consults with legal counsel and certain other experts on matters related to such claims and litigation. The group accrues a liability when it is determined that an adverse outcome is more likely than not, and the amount of the loss can be reasonably estimated. If the likelihood of an adverse outcome is reasonably possible or an estimate is not determinable, the matter is disclosed, provided it is material. Management is of the opinion that the provision is adequate to resolve these claims.
The methodology used to determine the amount of the liability requires signifi cant judgments and estimates regarding the costs of settling asserted claims. Due to the fact that there is limited historical data available, the estimated liability cannot be based upon recent settlement experience for similar types of claims. Developments in negotiations in some of our pending issues during 2012 resulted in a change in estimates which led to a €12 million release in our provision.Based on our best estimate, the portion of the claims & litigation provision expected to be settled in the coming twelve months amounted to approximately €8.9 million the remainder is expected to be settled between one and fi ve years.
Other provision
Other provisions include an amount of €6.6 million (2011: €4.6 million) related to the defi ned benefi t pension plan in Germany and the remainder relates mainly to a provision for onerous building leases. The amount of Other provision expected to be settled/utilised within the coming twelve months amounted to €2.2 million.
This German defi ned benefi t plan was frozen in 2007 and is an unfunded plan. In the extraordinary event that the group is unable to meet its obligations, the participants will receive (partial) payments from a state-owned pension protection fund.
The movement of the German defi ned benefi t obligation is presented below:
(€ in thousands) 2012 2011
PRESENT VALUE OF OBLIGATION AS AT 1 JANUARY 4,603 4,845Current service cost 5 6Interest cost 251 242
4,859 5,093Remeasurements:– Experience (gains)/losses due to change in demographical assumptions – 25 – 118– (Gain)/loss from change in fi nancial assumptions 1,825 – 356
1,800 – 474Benefi ts paid – 87 – 16PRESENT VALUE OF OBLIGATION AS AT 31 DECEMBER 6,572 4,603
The service cost and the interest cost are recognised as pension costs while the actuarial (gains) losses are charged / credited to Other comprehensive income.

TomTom Annual Report and Accounts 201166
Notes to the Consolidated Financial Statements | continued
26. PROVISIONS (CONTINUED)
The signifi cant actuarial assumptions were as follows:2012 2011
Discount rate 3.40% 5.50%Average life expectancy1 20.7 20.6
1 The above average life expectancy is the average actual value for males and females retiring at age 65 set in accordance with the common German mortality tables
‘Heubeck 2005 G’.
A 0.1% increase or decrease in discount rate would result in approximately a €0.1 million decrease or increase in the defi ned benefi t obligation and a 1 year increase or decrease in average life expectancy would result in €0.1 million increase or decrease in the defi ned benefi t obligation.
27. TRADE PAYABLES
All trade payable balances have a contractual maturity of less than six months.
28. ACCRUALS AND OTHER LIABILITIES
Accruals and other liabilities comprise of the following:
(€ in thousands) 2012 2011
Deferred revenue1 95,256 82,826Margin related accruals 99,305 123,656Operating expenses accruals 74,532 78,740 269,093 285,222
1 Deferred revenue includes the non-current portion amounting to €18.1 million (2011: €12.7 million) presented under Other long term liabilities on the balance sheet.
29. COMMITMENTS AND CONTINGENT LIABILITIES
The group has a number of long-term fi nancial commitments, which are not shown in the group’s balance sheet as at 31 December 2012.
Operating leases
These are operating leases for buildings, cars and offi ce equipment, which consist of:
(€ in thousands) 2012 2011
Commitments less than 1 year 13,902 16,833Commitments between 1 – 5 years 34,918 31,966Commitments longer than 5 years 732 5,214 49,552 54,013
No discount factor is used in determining the operating lease commitments.
Purchase commitments
Our contract manufacturers order the requisite component parts from their suppliers on the basis of our forecasts of the number of units we will require. Our manufacturers have commitments on these components. In certain circumstances, we have a contractual obligation to purchase these components from our manufacturers.
Other commitments
The group has contracts with third party suppliers or other business partners that include minimum royalty or revenue share payments over the duration of the contracts that range from 1 to 5 years. The total commitments under these contracts are presented below.
(€ in thousands) 2012 2011
Commitments less than 1 year 11,583 14,372Commitments between 1 – 5 years 12,287 19,290 23,870 33,662

67
29. COMMITMENTS AND CONTINGENT LIABILITIES (CONTINUED)
Within the group a guarantee as described in article 479C of the UK Companies Act is given by TomTom NV for TomTom Software Ltd. Accordingly TomTom Software Ltd is exempted from the requirements of the Companies Act 2006 relating to audit by virtue of section 479A.
Contingencies
Please refer to note 26 for disclosures on tax and legal contingencies.
Based on legal advice, there were no other contingencies that management expects to have a material adverse effect on the group’s fi nancial position as at 31 December 2012.
30. RELATED PARTY TRANSACTIONS
The expenses relating to remuneration of key management personnel are presented in the following table:
(€)Salary
and bonus1Other short term
benefi ts2Post employment
benefi tsTermination
benefi tsShare-based
paymentsTotal
Remuneration
2012 Management Board and senior management 3 3,416,122 324,583 97,737 0 1,637,012 5,475,454 Supervisory Board 304,000 0 0 0 0 304,000
2011
Management Board and senior management 3,473,530 202,648 244,577 221,542 2,758,405 6,900,702Supervisory Board 304,000 0 0 0 0 304,000
1 In 2012, the total bonus payment amounted to €1.0 million versus €0.3 million in 2011.2 In 2012 Other short term benefi ts of the Management Board and senior management include the employer’s portion of social securities (€105 thousand) and the crisis
levy (€198 thousand) as imposed by the Dutch government. Although the expenses relating to the crisis levy do not represent actual benefi ts paid to the Management
Board and to senior management, they have been included in the above table as these expenses were incurred in relation to their employment. For consistent
comparison, the 2011 numbers have been adjusted to include the social security contributions which amounted to €182 thousand.3 The composition of our senior management changed from 9 to 4 members following our reorganisation announcement in December 2011.
Certain key management personnel also hold ownership interests in TomTom NV as disclosed under the Corporate Governance section on page 22.
In the normal course of business, the group receives map development and support services from its associate Infotech Enterprises Ltd. (Infotech). Such transactions take place at normal market conditions and the total payments made for these services in 2012 amounted to €13.4 million (2011: €12.9 million). The outstanding payable due to Infotech as at 31 December 2012 was €1.2 million (31 December 2011: €1.1 million).
31. AUDITORS’ REMUNERATION
The total remuneration to Deloitte Accountants BV for the statutory audit of 2012 for the group amounted to €440,000 (2011: €436,000). The total service fees paid to the Deloitte network amounted to €1,071,000 (2011: €1,429,000). Included in the total remuneration is an amount of €587,000 (2011: €712,000) invoiced by Deloitte Accountants BV, which includes an amount of €87,000 (2011: €154,000) for other statutory audits and €60,000 (2011: €122,000) for audit related services. Details of the audit, audit related and non audit fees paid to Deloitte can also be found in the Supervisory Board report.

TomTom Annual Report and Accounts 201268
32. FINANCIAL INSTRUMENTS BY CATEGORY
The following table presents the group’s fi nancial instruments according to the categories as defi ned in IAS 39:
(€ in thousands)Loans and
receivables
Assets/liabilities at fair value through
profi t or loss
Other fi nancial assets/liabilities
at amortised cost Total
31 DECEMBER 2012
ASSETS
Other fi nancial assets – derivatives 0 444 0 444Trade receivables 149,834 0 0 149,834Cash and cash equivalents 164,459 0 0 164,459TOTAL 314,293 444 0 314,737
LIABILITIES
Trade payables 0 0 84,162 84,162Other fi nancial liabilities – derivatives 0 85 0 85Borrowings 0 0 247,140 247,140TOTAL 0 85 331,302 331,387
(€ in thousands)Loans and
receivables
Assets/liabilities at fair value through
profi t or loss
Other fi nancial assets/liabilities
at amortised cost Total
31 DECEMBER 2011
ASSETS
Other fi nancial assets – derivatives 0 2,784 0 2,784Trade receivables 184,939 0 0 184,939Cash and cash equivalents 193,579 0 0 193,579TOTAL 378,518 2,784 0 381,302
LIABILITIES
Trade payables 0 0 116,616 116,616Other fi nancial liabilities – derivatives 0 116 0 116Borrowings 0 0 383,810 383,810TOTAL 0 116 500,426 500,542
Fair value estimation
The group classifi es fair value measurements using a fair value hierarchy that refl ects the signifi cance of the inputs used in making the measurements. The fair value hierarchy should have the following levels: A – Level 1: quoted prices (unadjusted) in active markets for identical assets and liabilities; B – Level 2: inputs other than quoted prices that are observable for the asset or liability, either directly (for example, as prices)
or indirectly (for example, derived from prices) and C – Level 3: inputs for the asset or liability that are not based on observable market data.
The fair value of fi nancial assets/liabilities carried at fair value through profi t or loss is the estimated amount that a bank would receive or pay to settle the contracts at the reporting date, taking into account current observable market inputs such as interest rates, current exchange rates and volatility. In accordance with the fair value hierarchy established by IFRS 7, these types of inputs classify as Level 2 inputs.
Notes to the Consolidated Financial Statements | continued

69
(€ in thousands) Notes 2012 2011
Result of subsidiaries after taxation 2 64,444 – 403,665Other income and expenses after tax 3 64,280 – 34,179NET RESULT 128,724 – 437,844
The notes on pages 71 to 73 are an integral part of these Company Financial Statements.
Company Statement of Income of TomTom NV for the year ended 31 December

TomTom Annual Report and Accounts 201270
(€ in thousands) Notes 2012 2011
ASSETS
NON-CURRENT ASSETS
Investments in subsidiaries 2 2,842,149 2,773,263 Deferred tax asset 4 149 82 Other fi nancial assets 0 0TOTAL NON-CURRENT ASSETS 2,842,298 2,773,345
CURRENT ASSETS
Receivables 89,143 55,418 Cash and cash equivalents 272 1,653 TOTAL CURRENT ASSETS 89,415 57,701
TOTAL ASSETS 2,931,713 2,830,416
EQUITY AND LIABILITIES
SHAREHOLDERS’ EQUITY 5Share capital 44,379 44,379 Share premium 975,260 975,260 Other reserves 6 159,011 131,213Accumulated defi cit – 471,599 – 7,008Result for the year 128,724 – 437,844TOTAL SHAREHOLDERS’ EQUITY 835,775 706,000
Borrowings 7 173,437 0Inter-company payable 8 1,846,031 1,715,937 Provisions 66 3,915 Deferred tax liability 4 715 1,048 TOTAL NON-CURRENT LIABILITIES 2,020,249 1,720,900
Borrowings 7 73,703 402,003Other liabilities 1,986 1,513 TOTAL CURRENT LIABILITIES 75,689 403,516
TOTAL EQUITY AND LIABILITIES 2,931,713 2,830,416
The notes on pages 71 to 73 are an integral part of these Company Financial Statements.
Company Balance Sheet of TomTom NV as at 31 December(before proposed appropriation of result)

71
1. PRESENTATION OF FINANCIAL STATEMENTS AND RECOGNITION AND MEASUREMENT PRINCIPLES
The description of the activities of TomTom NV (the company) and the company structure, as included in the notes to the consolidated fi nancial statements, also applies to the company fi nancial statements.
The company has prepared its company fi nancial statements in accordance with Part 9 of Book 2 of the Netherlands Civil Code, and specifi cally, in accordance with section 362 (8) of the Netherlands Civil Code. In doing so it has applied the principles of recognition and measurement as adopted in the consolidated fi nancial statements (IFRS). Investments in subsidiaries are accounted for using the equity method. For more information on the accounting policies applied, and on the notes to the consolidated fi nancial statements, please refer to page 39 to 68.
2. INVESTMENTS IN SUBSIDIARIES
The movements in the Investments in subsidiaries were as follows:
(€ in thousands)Investments in
subsidiaries
BALANCE AS AT 31 DECEMBER 2010 3,173,829MOVEMENTS 2011
Currency translation difference – 25Transfer to stock compensation reserve 7,562Other direct equity movements – 4,438Result of subsidiaries – 403,665BALANCE AS AT 31 DECEMBER 2011 2,773,263
MOVEMENTS 2012
Currency translation difference – 1,337Transfer to stock compensation reserve 6,300Other direct equity movements – 521Result of subsidiaries 64,444BALANCE AS AT 31 DECEMBER 2012 2,842,149
A list of subsidiaries and affi liated companies prepared in accordance with the relevant legal requirements (the Netherlands Civil Code Book 2, Part 9, sections 379 and 414) is deposited at the offi ce of the Chamber of Commerce in Amsterdam, the Netherlands.
3. OTHER INCOME AND EXPENSES AFTER TAX
The employees of the company comprise only of the members of the Management Board. Other income and expense consists of the remuneration of the Management Board and the Supervisory Board, the interest expense on the borrowings and the interest income on the company’s outstanding cash balances. For the remuneration of the Management Board and Supervisory Board, please refer to note 7 of the consolidated fi nancial statements.
4. DEFERRED TAXATION
As at 31 December 2012, the company has a deferred tax asset of €0.1 million (2011: €0.1 million) and a deferred tax liability of €0.7 million (2011: €1.0 million). The deferred tax asset and deferred tax liability result from temporary differences between the tax and accounting treatment of the stock compensation expenses and the borrowing cost respectively. The movement of the deferred tax positions during the year was the result of changes/reversals of temporary differences and has been charged/released to the income statement.
5. SHAREHOLDERS’ EQUITY
For the statement of changes in consolidated equity for the year ended 31 December 2012, please refer to page 38 in the consolidated fi nancial statements. Additional information on the shareholders’ equity is disclosed in note 21 in the consolidated fi nancial statements.
Notes to the Company Financial Statements

TomTom Annual Report and Accounts 201272
Notes to the Company Financial Statements | continued
6. OTHER RESERVES
(€ in thousands) Legal reserve participations
Cumulative translation adjustment
Total legal reserves
Stock compensation
reserve Total
BALANCE AS AT 31 DECEMBER 2010 38,766 6,991 45,757 71,662 117,419Currency translation differences 0 – 25 – 25 0 – 25Transfer from retained earnings 21,846 0 21,846 0 21,846Stock compensation expense 0 0 0 7,996 7,996Issue of share capital 0 0 0 – 225 – 225Release to retained earnings 0 0 0 – 18,343 – 18,343Cash fl ow hedges 2,545 0 2,545 0 2,545BALANCE AS AT 31 DECEMBER 2011 63,157 6,966 70,123 61,090 131,213 Currency translation differences 0 – 1,337 – 1,337 0 – 1,337Transfer from retained earnings 41,222 0 41,222 0 41,222Stock compensation expense 0 0 0 5,699 5,699Release to retained earnings 0 0 0 – 17,786 – 17,786BALANCE AS AT 31 DECEMBER 2012 104,379 5,629 110,008 49,003 159,011
Legal reserves
Legal reserves are the non-distributable reserves that are recorded for an amount equal to the restricted reserves of the company’s subsidiaries and the cumulative translation adjustment reserve.
Stock compensation reserve
The stock compensation reserve represents the cumulative expense of issued share options that have been granted but not exercised.
7. BORROWINGS
Please refer to note 24 in the consolidated fi nancial statements.
Included in our borrowings in 2011 are amounts due to group companies of €17 million with similar conditions as the external borrowings (2012: nil).
8. INTERCOMPANY PAYABLE
The intercompany payable comprises of loans provided by subsidiaries. The interest rate on the loan during 2012 is based upon LIBOR plus a margin of 0.7%. Although no repayment period has been agreed the loan has a long-term nature.

73
9. OFF-BALANCE SHEET COMMITMENTS
The company has issued several declarations of joint and several liabilities for various group companies, in compliance with section 403 of Part 9 of Book 2 of the Netherlands Civil Code. Besides these declarations TomTom NV has given a guarantee as described in article 479C of the UK Companies Act for an UK subsidiary TomTom Software Ltd.
Furthermore the company forms part of a fi scal unity for corporate income tax and transaction tax purposes with several of its Dutch subsidiaries. Each company within the fi scal unity is jointly and severally liable for the fi scal liability of the fi scal unity.
Amsterdam, 12 February 2013 Amsterdam, 12 February 2013
Management Board Supervisory BoardHarold Goddijn Karel Vuursteen
Marina Wyatt Doug Dunn
Alain De Taeye Guy Demuynck
Rob van den Bergh
Ben van der Veer
Peter Wakkie
TomTom NV
Amsterdam

TomTom Annual Report and Accounts 201274
STATUTORY PROVISION WITH RESPECT TO APPROPRIATION OF RESULTS
According to the company’s Articles of Association, the company’s result is freely at the disposal of the shareholders, provided that total shareholders’ equity exceeds the called-up and paid-up capital of the company, increased by legal and statutory reserves.
PROPOSED APPROPRIATION OF RESULT
The Management Board proposes to add the net result in full to the Accumulated defi cit.
STICHTING CONTINUITEIT TOMTOM
For a description of the Stichting Continuiteit TomTom, refer to the Corporate Governance section in the Annual Report.
AUDITOR’S REPORT
Reference is made to the auditor’s report on page 75.
Other Information

75
REPORT ON THE FINANCIAL STATEMENTS
We have audited the accompanying fi nancial statements 2012 of TomTom NV, Amsterdam. The fi nancial statements include the consolidated fi nancial statements and the company fi nancial statements. The consolidated fi nancial statements comprise the consolidated balance sheet as at 31 December 2012, consolidated statement of income, consolidated statement of comprehensive income, consolidated statement of changes in equity and consolidated statement of cash fl ows for the year then ended, and notes, comprising a summary of the signifi cant accounting policies and other explanatory information. The company fi nancial statements comprise the company balance sheet as at 31 December 2012, the company statement of income for the year then ended and the notes, comprising a summary of the accounting policies and other explanatory information.
Management’s responsibility
Management is responsible for the preparation and fair presentation of these fi nancial statements in accordance with International Financial Reporting Standards as adopted by the European Union and with Part 9 of Book 2 of the Dutch Civil Code, and for the preparation of the management board report in accordance with Part 9 of Book 2 of the Dutch Civil Code. Furthermore management is responsible for such internal control as it determines is necessary to enable the preparation of the fi nancial statements that are free from material misstatement, whether due to fraud or error.
Auditor’s responsibility
Our responsibility is to express an opinion on these fi nancial statements based on our audit. We conducted our audit in accordance with Dutch law, including the Dutch Standards on Auditing. This requires that we comply with ethical requirements and plan and perform the audit to obtain reasonable assurance about whether the fi nancial statements are free from material misstatement.
An audit involves performing procedures to obtain audit evidence about the amounts and disclosures in the fi nancial statements. The procedures selected depend on the auditor’s judgment, including the assessment of the risks of material misstatement of the fi nancial statements, whether due to fraud or error.
In making those risk assessments, the auditor considers internal control relevant to the entity’s preparation and fair presentation of the fi nancial statements in order to design audit procedures that are appropriate in the circumstances, but not for the purpose of expressing an opinion on the effectiveness of the entity’s internal control. An audit also includes evaluating the appropriateness of accounting policies used and the reasonableness of accounting estimates made by management, as well as evaluating the overall presentation of the fi nancial statements.
We believe that the audit evidence we have obtained is suffi cient and appropriate to provide a basis for our audit opinion.
Opinion with respect to the consolidated fi nancial statements
In our opinion, the consolidated fi nancial statements give a true and fair view of the fi nancial position of TomTom NV as at 31 December 2012, its result and its cash fl ows for the year then ended in accordance with International Financial Reporting Standards as adopted by the European Union and with Part 9 of Book 2 of the Dutch Civil Code.
Opinion with respect to the company fi nancial statements
In our opinion, the company fi nancial statements give a true and fair view of the fi nancial position of TomTom NV as at 31 December 2012 and of its result for the year then ended in accordance with Part 9 of Book 2 of the Dutch Civil Code.
REPORT ON OTHER LEGAL AND REGULATORY REQUIREMENTS
Pursuant to the legal requirement under Section 2:393 sub 5 at e and f of the Dutch Civil Code, we have no defi ciencies to report as a result of our examination whether the management board report, to the extent we can assess, has been prepared in accordance with Part 9 of Book 2 of this Code, and whether the information as required under Section 2:392 sub 1 at b-h has been annexed. Further we report that the management board report, to the extent we can assess, is consistent with the fi nancial statements as required by Section 2:391 sub 4 of the Dutch Civil Code.
Amsterdam, 12 February 2013
Deloitte Accountants BV
Signed by: B. E. Savert
Independent Auditor’s ReportTo the Shareholders and Supervisory Board of TomTom NV

TomTom Annual Report and Accounts 201276
Shareholder Information
TomTom is committed to providing a high degree of transparency in its reporting and engages in open dialogues with investors. TomTom has an extensive communication programme with investors and sell side analysts, which includes the Annual General Meeting, roadshows, investor conferences and in-house meetings.
TomTom strictly adheres to applicable rules and legislation on fair disclosure. It is our goal to inform investors as well as possible about the company and its management, our strategy, goals and expectations. Investors and analysts are invited to contact us with any information requests they have. We do not hold roadshows, attend conference or meet with investors or analysts shortly before the publication of our quarterly results.
Listing
TomTom NV (TOM2 / ISIN: NL0000387058) has been listed on NYSE Euronext Amsterdam in the Netherlands since 27 May 2005. TomTom is included in Euronext’s Amsterdam Mid-Cap Index (AMX). Share options of TomTom are traded on the Euronext Amsterdam Derivative Market.
Financial calendar
23 April 2013 Publication Q1 2013 results and Annual General Meeting25 July 2013 Publication Q2 2013 results30 October 2013 Publication Q3 2013 results
Shares outstanding
At the end of the year TomTom NV had 221,895,012 shares outstanding. The number of options outstanding was 17,682,662. The number of diluted shares outstanding was 222,235,303.
Major shareholders
At the end of 2012 the following shareholders with a holding (voting rights) of 5% or more were known to us:
# shares% of shares outstanding
Harold Goddijn 26,137,831 12%Corinne Vigreux 26,137,831 12%Pieter Geelen 26,137,831 12%Peter-Frans Pauwels 26,137,831 12%Flevo Deelnemingen IV BV 22,633,290 10%BNP Paribas Investment Partners SA 11,187,435 5%
Protection mechanism
In 2005 the Stichting Continuïteit TomTom (the Foundation) was established as an instrument of protection against hostile takeovers and to protect our interests in other situations. We have granted the Foundation a call option, entitling it to acquire from us preferred shares, up to a maximum of 50% of our total issued and outstanding share capital (excluding issued and outstanding preferred shares). The issue of preferred shares or the grant of rights to subscribe for preferred shares, may have the effect of preventing, discouraging or delaying an unsolicited attempt to obtain control and may help us to determine our position in relation to a bidder and its plans, and to seek alternatives.
In addition to the call option, the Management Board has the right to issue preferred shares. The authority is limited to 50% of the aggregate issued and outstanding share capital (excluding issued and outstanding preferred shares) of the company at the time of issue. As with the instrument in place for the Foundation, any possible issuances of preferred shares will be temporary and subject to the company’s Articles of Association and the legislation on takeovers.
There are currently no preferred shares outstanding. More information on the protection mechanism can be found in the corporate governance section on pages 17 to 22.

77
Share information
(In €, unless stated otherwise) 2012 2011
Share price at the start of the year 3.05 7.89Share price at the end of the year 3.80 3.05Highest share price 4.51 7.93Lowest share price 2.85 2.49 Average daily volume shares traded (in thousands) 1,923 1,989 Diluted earnings per share (reported) 0.58 – 1.97Diluted earnings per share (adjusted) 0.40 0.55Diluted free cash fl ow per share 0.52 0.45 Earnings per share 0.58 – 1.97Free cash fl ow per share 0.52 0.45 Weighted average number of shares outstanding (in millions) 221.9 221.9Weighted average number of shares fully diluted (in millions) 222.0 221.9
Information about our current share price is available on our website: (http://corporate.tomtom.com/investor.cfm).
Dividend policy
TomTom has no current plans to distribute dividends.
More information
Our website contains a vast amount of up-to-date information: http://corporate.tomtom.com/investor.cfm. Investors can contact us via [email protected].
Our visiting address is: De Ruyterkade 1541011 AC AmsterdamThe Netherlands

TomTom Annual Report and Accounts 201278
Key Figures Overview
(in € millions, unless stated otherwise) 2012 2011 2010 2009 2008
INCOME AND EXPENSES
Revenue 1,057 1,273 1,521 1,480 1,674 Gross result 555 640 744 731 781 Operating result1 70 102 190 231 264 Net result2 129 74 110 94 188
DATA PER SHARE
Earnings per share (in €) – diluted3 0.58 – 1.97 0.49 0.47 1.17Adjusted earnings per share (in €) – basic3, 4 0.40 0.55 0.70 0.78 1.50
SHARES OUTSTANDING
Average # basic shares outstanding (in millions)3 222 222 222 184 148 Average # diluted shares outstanding (in millions)3 222 222 222 185 149
REGIONAL REVENUE SPLIT
Europe 773 937 1,070 1,007 1,182 North America 215 257 380 411 434 ROW 69 79 70 62 59
CASH FLOW
Cash generated from operations 187 195 265 430 463 Net cash fl ow from operating activities 167 174 210 340 354 Cash fl ow from investing activities – 51 – 73 – 65 – 90 – 1,903Cash fl ow from fi nancing activities – 146 – 214 – 209 – 206 1,408 Net increase in cash and cash equivalents – 30 – 112 – 64 45 – 142
BALANCE SHEET
Goodwill 382 382 855 855 855 Intangible assets 821 872 946 986 1,011 Inventories 44 66 94 67 145 Trade receivables 150 185 306 294 290 Cash and cash equivalents 164 194 306 368 321 Provisions 81 101 109 114 113 Borrowings 247 384 588 790 1,388 Trade payables 84 117 218 201 152 Total equity and liabilities 1,724 1,799 2,623 2,686 2,767
KEY RATIOS5
Days sales of inventory (DSI) 29 31 31 21 47 Days sales outstanding (DSO) 47 48 55 51 51 Creditor days 54 56 72 64 49
SHARE PRICE
At end of period 3.80 3.05 7.89 6.25 4.30 Volume (million) 491 715 552 811 480
NUMBER OF EMPLOYEES
At end of period (FTE) 3,490 3,677 3,487 3,089 3,498

79
1 Operating results excludes the impairment charges (2011: €512 million; 2008: €1,047 million)
and restructuring charges (2011: €14.8 million; 2010: €3.3 million; 2009: €10.3 million;
2008: €16.5 million).2 Net result excludes the above mentioned impairment and restructuring charges and the related
tax effects.3 The earnings per share number and the weighted average number of shares outstanding for all
years before 2009 have been adjusted to refl ect the impact of the right offering that took place
in July 2009.4 Earnings per share adjusted for acquisition related amortisation, goodwill impairment and
restructuring charges on a post tax basis, and a €80 million one-off tax gain in 2012.5 Calculated based on the sales / cost of sales and the number of days in the last three months
of the year.
2007 2006 2005
1,737 1,364 720 764 579 311 428 340 195 317 222 143
2.20 1.57 1.042.28 1.63 1.13
138 133 126 144 142 138
1,396 1,226 670 271 106 42 70 31 7
535 392 102 441 292 43
– 867 – 29 – 21453 1 117 28 264 138
0 0 0 56 39 16
131 123 103 403 266 151 463 438 178 96 44 21 0 0 0
152 67 55 1,970 903 464
33 57 92 58 71 77 38 31 49
42.56 27.04 23.97313 232 100
1,337 809 435


Forward-looking statements/important noticeThis document contains certain forward-looking statements with respect to the fi nancial condition, results of operations and business of TomTom and certain of the plans and objectives of TomTom with respect to these items. In particular the words ‘expect’, ‘anticipate’, ‘estimate’, ‘may’, ‘should’, ‘believe’ and similar expressions are intended to identify forward-looking statements. By their nature, forward-looking statements involve risk and uncertainty because they relate to events and depend on circumstances that will occur in the future. Actual results may differ materially from those expressed in these forward-looking statements, and you should not place undue reliance on them. We have based these forward-looking statements on our current expectations and projections about future events, including numerous assumptions regarding our present and future business strategies, operations and the environment in which we will operate in the future. There are a number of factors that could cause actual results and develop-ments to differ materially from those expressed or implied by these forward-looking statements. These factors include, but are not limited to, levels of customer spending in major economies, changes in consumer tastes and preferences, changes in law, the performance of the fi nancial markets, the levels of marketing and promotional expenditures by TomTom and its competitors, raw materials and employee costs, changes in exchange and interest rates (in particular changes in the US dollar and GB pound versus the euro can materially affect results), changes in tax rates, future business combinations, acquisitions or disposals, the rate of technological changes, political and military developments in countries where TomTom operates and the risk of a downturn in the market.
Statements regarding market share, including TomTom’s competitive position, contained in this document are based on outside sources such as specialised research institutes, industry and dealer panels in combination with management estimates. Where full-year information regarding 2012 is not yet available to TomTom, those statements may also be based on estimates and projections prepared by outside sources or management. Market shares are based on sales in units unless otherwise stated. The forward-looking statements contained refer only to the date on which they are made, and we do not undertake any obligation to update any forward-looking statement to refl ect events or circumstances after the date of this Annual Report.

TomTom NV Oosterdoksstraat 1141011 DK AmsterdamThe NetherlandsTel: +31 (0)20 757 5000www.tomtom.com
Annual Report 2012
maps | traffi c | navigation


