A Free Technical Analysis E – Magazine for Traders of Financial Markets www.EducatedAnalyst.com Volume 2, Issue 2 MAR / APR 2010 THE IMPORTANCE OF HAVING A CORRECT MARKET EXIT STRATEGY Learning the lessons of exiting from the professionals and the unexpected. Gann’s timing calculation When to expect a change in market direction Real-Estate Cycles How do they affect the Stock Market? Buyers vs Sellers The Balance of Power
Transcript
A Free Technical Analysis E – Magazine for Traders of Financial Markets
www.EducatedAnalyst.com
Volume 2, Issue 2 MAR / APR 2010
THE IMPORTANCE OF HAVING A CORRECT MARKET EXIT STRATEGY Learning the lessons of exiting from the professionals and the unexpected.
Gann’s timing calculation When to expect a change in
market direction
Real-Estate Cycles How do they affect the Stock
Market?
Buyers vs Sellers The Balance of Power
The Educated Analyst | MAR/APR 2010
5 THE RELEVANCE OF GANN’S
TIME THEORY Alan Oliver shows us how to implement one of W D Gann’s basic time calculation principles by examining and measuring previous highs and lows, and revealss how easy it can be to determine when to expect the market to change direction from these points.
8 THE COKE BOTTLE TRADER Veteran trader Chuck LeBeau teaches us one of the most important lessons in trading through the humorous true story of an old trader, who traded the markets by taking advice from intergalactic aliens that he communicated with through an old emptied Coke bottle.
11 ON THE COUCH WITH CHRIS
SHEA Renowned Market Coach Chris Shea examines how small changes in our Stop Loss philosophy can result in a large difference to our profitability.
14 NATURAL SQUARES
CALCULATOR DATES Ken Gerber from Lambert Gann Educators shows his fascinating insights into the Natural Squares Calculator, and unfolds how this can be implemented into a real trading environment.
17 18 YEAR PROPERTY CYCLE Phil Anderson, Managing Director of Economic Indicator Services, provides us with a detailed examination of the 18 year US property cycle, and explains how this affects share market investors and traders.
20 TRADING PATTERNS - PART
FOUR Peter Varcoe gives us part four on his series on Trading Patterns. In this issue Peter continues to look at continuation patterns and explains the difference between a trading pause and a retracement in a bid to help us better identify correct continuation patterns.
27 THE BALANCE OF POWER
Michael Parsons explains the psychology and the background behind the balance of power between the buyers and sellers, causing steady bullish and bearish trends.
32 TRADING WITH THE
SINGLE IN/SCALE OUT METHOD Ross Beck does away with the short-term / long-term trader labels and displays how a dynamic set of exit rules over multiple contracts can maximise profit and give you the best of both worlds.
36 PLANETARY CYCLES
Well known Italian trader Mariano La Rosa explains some of the many important planetary cycles in trading, and unveils how they correlate directly to the common cycles that we already watch
i and welcome to another edition of the Educated Analyst.
Once more we have a variety of articles available to help you with your analysis and trading. We are hearing so many mixed messages at the moment, from recovery being well established to sovereign debt which is about to unravel the markets. I think there is merit in both arguments. Many economies are doing well, Australia has just increased cash rates to 4% - the fourth rise in 5 months. However, the debt issues in Europe create a lot of uncertainty. The member states of the EU, while financially linked, are not fully politically linked and individual governments would face populous revolt if they bailed out their neighbours. Unlike the US and UK, these EU countries cannot print more money to make their debts "disappear", so this is going to be the most volatile issue that we will face in the first half of this year. Another issue that is currently flying under the radar is that of Dubai. It's generous neighbour (Abu Dhabi) has only covered around 18% of Dubai's debts until the end of April to allow Dubai to restructure its loans. So far no details have been produced to show how this has been done, and the five year credit default swaps are at their highest level (651) in ten years. Higher than what they were at the height of the November crisis. So where is the market going? With all the mixed news reports, it is difficult to say. What we do know is that there are a lot of "itchy fingers" out there and when the market moves (in either direction) there are a lot of people who jump on board increasing the volatility. The best thing to do is to come back to the basics, look for your signals, set your stops and work out before hand where you are going to exit. This month there is a real bias towards money management and strategies that you can use to help you exit the market. I know from personal experience the anguish of holding a trade too long, or jumping out too early because I think the market has turned. There are two things that can help with this: The first is a good strategy for getting out of the market, that's what you'll find in this month’s Educated Analyst. Secondly, being satisfied that you made your target and you walk away with a win. Again, I trust that the Educated Analyst is of benefit to you and ask that if you know someone that could benefit from reading the articles, send it on to them. Also remember that all the back issues are available free on our web site. All the best, Mathew Verdouw Editor The Educated Analyst
EDITORIAL
MAR/ APR 2010 - VOLUME 2 Issue 2
Disclaimer:
The Educated Analyst, its staff, officers and contributing authors cannot be held liable for trading decisions that you make as a consequence of education that you receive from the articles.
Trading and Investing involves risk and has the potential for large financial losses. The content provided in The Educated Analyst is of a general nature and does not take your personal situation or financial objectives into consideration.
You should consult with your broker or financial advisor before acting on any of the content in The Educated Analyst.
ADVANCED TOOLS FOR ADVANCED TRADERS
Version 6 is now available visit www.Market-Analyst.com/tea
INTERNATIONAL: (all countries) +61 7 3118 9580
CALL NOW TOLL FREE:
Australia 1300 655 262
USA 1800 557 2702
United Kingdom 0 800 680 0428
Ireland 1800 550 420
Singapore 800 130 1604
Invest in the innovations of the next generation of Technical Analysis!
The Educated Analyst | 5 The Relevance of Gann’s Time Theory MAR/APR 2010
t still amazes me whenever I talk to sceptics of the
great works of W. D. Gann. I have used his timing
theories and cycle analysis to make profitable
trading decisions, yet others will dismiss the theories
without a second
thought. I suspect that
these sceptics haven’t
put in the essential
effort to really apply
themselves to
understand it, or it
simply hasn’t been
explained well enough.
There is a third reason,
and I know that many
people expect trading
to be easy, lucrative
and the playground of
billionaires, because it
is very easy to buy or
sell either online or by
picking up the phone
to your broker.
Still, I know the Gann
theory works, just as
well today as it did 100 years ago, and we will look at an
example of this on an Australian stock Aquarius Platinum
Ltd. This stock came to my attention as an article I read
pointed out that the ever increasing demand of platinum
is likely to make prices skyrocket due to diminishing
supplies. Supply and demand, after all, is a key to
successful trading…
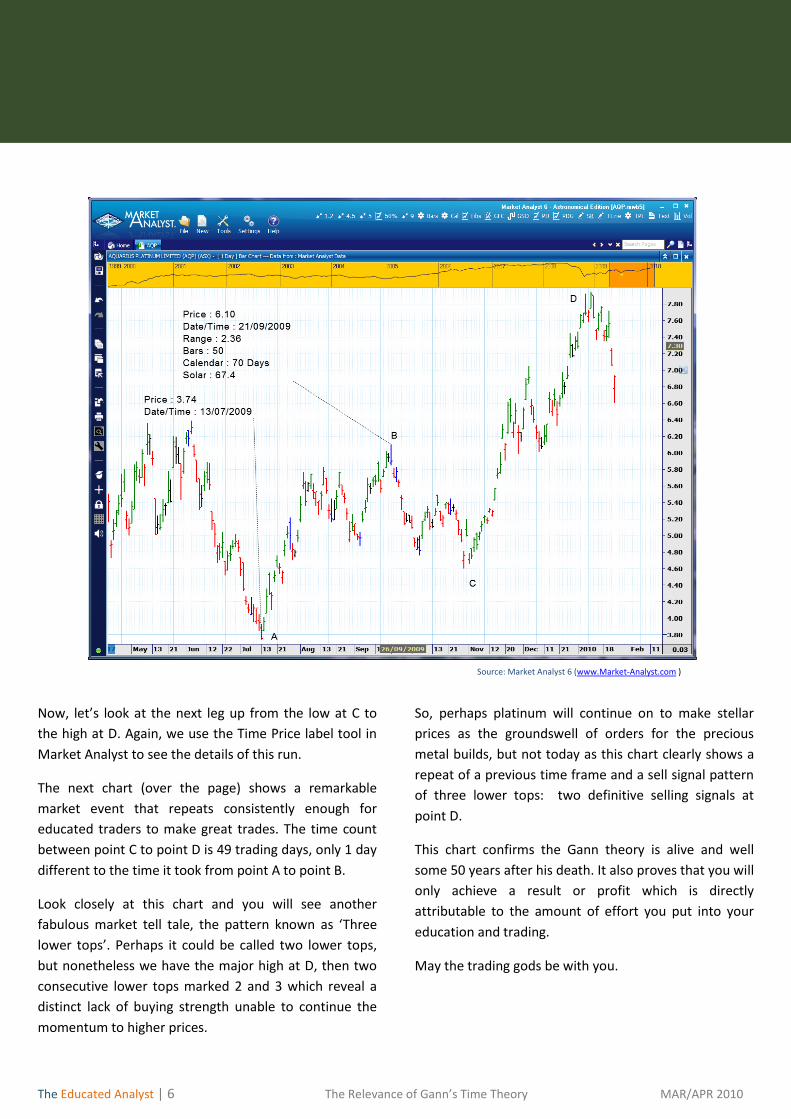
If we look at the chart, we can see a major low formed
July 13, 2009 at a price $3.74. This point I marked as ‘A’
on the chart. The next major top occurred September 21
at $6.10 marked B, followed by another major low
October 29 marked C, and finally the most recent top
January 11, 2010 marked D.
Gann told us many things, but one that is of relevance
here is that highs and lows are not spasmodic or
random; they form as a direct result of mathematical
relationships to previous highs and lows.
By now adding the Time Price label tool to the chart, we
can see some important information that gives us vital
clues to the next campaign or movement in the stock.
From the low at A, we see that it took 50 trading days to
reach the high at B. Nothing spectacular or unusual
about that, but it does give us a reference range in time
and price to record for future use.
Gann told us Time was more important than price, so we
The Educated Analyst |8 The Coke Bottle Trader March /April 2010
ack in the late 1960s, I was a young commodity
broker at E. F. Hutton and Co. Our office was a
brand-new high-tech office (for its time) that was
considered the "flagship office" for E.F. Hutton.
In this office about 30 brokers and as many clients shared one very large boardroom, and there were no private offices. The brokers had elegant and expensive desks, and the clients had a comfortable seating area in the front of the office where they could hang out and watch the tapes and monitor our state of the art commodity "clacker board."
Sitting at my desk near the front of the boardroom, I could read my Wall Street Journal and keep track of the commodity markets without looking at the board. By just listening to the rhythm and tempo of the mechanical clicks as the prices changed, I could easily tell when anything important was going on, because the tempo of the clicks would increase noticeably.
Just in front of my desk were half a dozen comfortable sofas facing a high mahogany-panelled wall with the tapes and the "clacker board." A gallery of traders, mostly retired "old-timers" who were trading real commodities like grains and pork bellies, lounged around on the sofas plotting their charts and talking about life and the markets. They typically arrived early to get a good seat in their usual spot and then spent the day trading, exchanging commentaries and offering unsolicited advice to one another on any subject.
For the most part, they were a very sociable group who would take coffee breaks together and greeted each other on a first-name basis. These traders enjoyed the elegant atmosphere and treated our well-appointed boardroom as their private men's club. (Were you aware that women were not allowed to trade commodities back in those days? My, how times have changed!)
One of these "old-timers" kept to himself and was not interested in becoming a member of the friendly and often boisterous social circle. He usually sat quietly by himself, intently watching the price changes on the commodity board and holding an old glass Coke bottle up near his ear.
The vintage-shaped Coke bottle had been emptied many years before and now contained only a 12-inch tube of bent and broken radio antennae, which extended awkwardly out of the top of the bottle.
Keep in mind that in the 1960s no one had yet heard of cell phones, so the purpose of this Coke bottle was a real mystery to everyone. When the trader would talk to the bottle from time to time, all the heads would turn, and the traders nearby would try to listen to the conversation. But the trader spoke very softly, and no one was able to eavesdrop on his conversations with the bottle.
The traders knew that the fellow with the Coke bottle was a client of mine, and eventually a representative of the group came to me and said they were extremely puzzled about this guy and his Coke bottle and asked me if I knew what was going on. I didn't know the purpose or meaning of the Coke bottle, but I was as curious as anyone was, and I promised I would find out. The next time the client came back to my desk, I promptly placed his order and then politely asked him about the Coke bottle.
With a serious expression and no embarrassment, he explained to me that the Coke bottle was an inter-planetary communication device that had been given to him by aliens. He said the aliens were very interested in our commodity markets and they often gave him trading advice from their various observation points on other planets. He said he had just had a message from Mars and they were buying soybeans, so he had also purchased soybeans. After revealing his unique trading methodology, he
THE Coke BOTTLE TRADER
With Chuck Lebeau
The Educated Analyst |9 The Coke Bottle Trader March /April 2010
returned to his seat and resumed his whispered conversations with the Coke bottle.
As soon as I revealed my discovery of the meaning of the Coke bottle to the other traders, all attention was immediately focused on the Coke bottle trader and the soybean market. The soybean market proceeded to go the wrong way, and the trade from Mars was eventually closed out at a loss. The other traders had no sympathy and were quick to begin ridiculing the trader and to poke fun at his beliefs.
The next trade, however, turned out to be a big winner, and the Coke bottle trader went from sofa to sofa telling his story and pointing to the clacker board while waiving his Coke bottle and bragging about the profitability of his most recent message from outer space. Because he was making money now, his previous critics had to endure his bragging about his success on the current winning trade.
After a few winning and losing trades later, a clear pattern of behaviour began to emerge. The Coke bottle trader was ridiculed unmercifully on his losing trades but was able to get his revenge and the last laugh during the winning trades. This trader might have been a little bit crazy, but he wasn't stupid. He soon learned that his only defense against ridicule was to hold on to winning trades as long as possible and to quickly get out of his losses.
As long as he was sitting on his sofa with a winning trade, no one could tell him he was crazy and make cruel jokes about his messages from Mars. In fact, while he was winning he was quick to wander around the room and ridicule the methods of the other traders who were not making as much money as he was. He displayed the profits in his trading account as hard evidence of the validity of his methods and offered copies of his statements as irrefutable proof that he was getting valuable advice from his alien contacts. Who could argue when his advice from other planets was obviously working?
For a young broker, this experience and the firsthand observation of the Coke bottle trader who suddenly became profitable gave me my first important lesson about the importance of exits. I knew the entry signals had nothing at all to do with his success. His batting average was not any better than that of any other trader. However, this crazy old trader seemed to be able to make money consistently, while other traders with more "sanity" and more valid entry methods were losing.
Before long I was able to recognize that this man had become a successful trader simply by his efforts to avoid ridicule. He knew he was vulnerable during his losing trades, so he closed them out very promptly. His winning trades became his shield against the ridicule of the other traders, and he kept his winners much longer than before his unorthodox methods were revealed.
In the many years since this experience, I have encountered many claims of success for entry methods that probably have even less validity than the Coke bottle messages. I have learned to look only briefly at the entries of winning traders and to examine their exit strategies very carefully. I am very fortunate that more than 30 years ago I learned from the Coke bottle trader that success in trading depends on our exits and not our entries.
About the Chuck Lebeau
Charles "Chuck” LeBeau began trading his first commodity
system in 1963 and has been an active systematic trader in
stocks and futures for more than forty years. He is the co-
author of Computer Analysis of the Futures Market (McGraw-
Hill, 1991) which is considered to be a classic work in technical
analysis that is now published worldwide in seven languages.
In addition to his bestselling book Chuck has also authored
many magazine articles about trading and is considered a
foremost authority on technical indicators, particularly the
Average Directional Index (ADX), Average True Range (ATR)
and various exit strategies.
The Educated Analyst | 11 On the Couch with Chris Shea MAR /APR 2010
Reflections on the Stop Loss
The subject of this article is the “Stop Loss”. By this we
mean the exit point for a trade if it goes wrong after it is
initiated. Without a stop loss as part of your trading
routine you are in danger of a huge capital, and worse,
psychological loss. Even if you have a very high hit rate
of successful entries it only takes one unprotected trade
to wipe you out.
Exercising a stop loss should be like brushing your teeth:
good trading hygiene. Exercising a stop however has
deeper psychological implications. It means the initial
entry was incorrect. If you are trading for ego rather
than profit, this can be a blow. So much so that
amateurs and beginners will be tempted to ignore the
stop “in case the market comes back”. It usually doesn’t,
so the one who lets the stop go is essentially in denial:
he or she would prefer his or her view to prevail; even if
the market reality presented to them is that the trade is
not working and should be discontinued.
Now let’s delve deeper into the stop loss.
A vast improvement in outcomes occurs when the trader
consistently uses the stop loss, but unfortunately this
will not lead to superior profits. Relying on a rigid stop
loss alone probably means the trader will break even or
slightly better. Why is this so?
A stop loss is like house insurance. You pay the premium
but you never want to use it. If you saw a small fire on
the kitchen bench, you wouldn’t just say it doesn’t
matter if the whole house burns down because I have
insurance and I can just cash it in. No, you would put the
fire out immediately if you could. (The amateur without
a stop loss trades without house insurance and hopes
the fire in the kitchen will go out of its own accord).
What I am saying here is that relying on a fixed stop loss
is a passive approach to the market. It’s creating a worst
case scenario defensive situation. The stop might be 2
ATR or 1% of capital away, but watching as your stop is
about to become hit means you are not prepared to take
responsibility or act by putting the small fire out while
you can.
I’m not saying that when you enter a trade you do not
need a stop loss. It’s a must, just like insurance is for the
home owner. But you shouldn’t just rely on the worst
case scenario as the trade plays out.
The market pays you for your agreeing with it. It doesn’t
have to agree with your view or position. It doesn’t have
to go up just because you buy.
When you enter a trade it must be for a reason. If the
market confirms your entry, then you would hold the
position with a view to working it as long as your trade
was in accord with the market.
But what would happen if just after your entry the
market contradicts rather than confirms the entry?
Rather than let your insurance stop come into play,
wouldn’t you be better off to exit the position
immediately? (Put out the fire when it is small!) This is
what professional traders call a “Scratch” trade. Not only
would you save some capital, but also you save yourself
psychologically for a new entry as soon as it is indicated.
This way you are aligned with the market with very small
losses.
Let me give you an example using real data from my
files.
A client came to me after a very bad experience in day
trading the Australian SPI. He performed 312
consecutive trades in a 3 month period. His hit rate
(Wins out of the total entries) was 37% and he lost 384
points. At $25 a point this is a sizeable sum of money to
lose. He was aggressive but not prepared to take control
of his outcomes.
On the Couch With Chris Shea
The Educated Analyst | 12 On the Couch with Chris Shea MAR /APR 2010
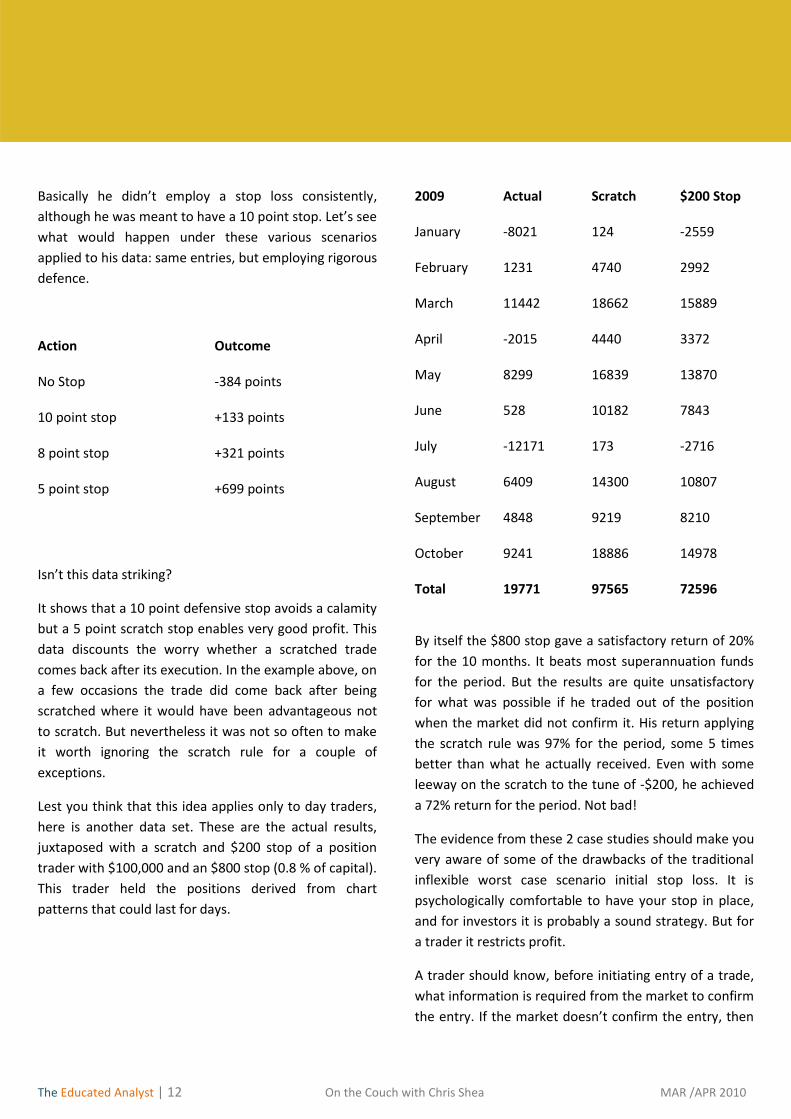
Basically he didn’t employ a stop loss consistently,
although he was meant to have a 10 point stop. Let’s see
what would happen under these various scenarios
applied to his data: same entries, but employing rigorous
defence.
Action Outcome No Stop
-384 points
10 point stop
+133 points
8 point stop
+321 points
5 point stop +699 points
Isn’t this data striking?
It shows that a 10 point defensive stop avoids a calamity
but a 5 point scratch stop enables very good profit. This
data discounts the worry whether a scratched trade
comes back after its execution. In the example above, on
a few occasions the trade did come back after being
scratched where it would have been advantageous not
to scratch. But nevertheless it was not so often to make
it worth ignoring the scratch rule for a couple of
exceptions.
Lest you think that this idea applies only to day traders,
here is another data set. These are the actual results,
juxtaposed with a scratch and $200 stop of a position
trader with $100,000 and an $800 stop (0.8 % of capital).
This trader held the positions derived from chart
patterns that could last for days.
2009 Actual Scratch $200 Stop January
-8021 124 -2559
February
1231 4740 2992
March
11442 18662 15889
April
-2015 4440 3372
May
8299 16839 13870
June
528 10182 7843
July
-12171 173 -2716
August
6409 14300 10807
September
4848 9219 8210
October 9241 18886 14978 Total 19771 97565 72596
By itself the $800 stop gave a satisfactory return of 20%
for the 10 months. It beats most superannuation funds
for the period. But the results are quite unsatisfactory
for what was possible if he traded out of the position
when the market did not confirm it. His return applying
the scratch rule was 97% for the period, some 5 times
better than what he actually received. Even with some
leeway on the scratch to the tune of -$200, he achieved
a 72% return for the period. Not bad!
The evidence from these 2 case studies should make you
very aware of some of the drawbacks of the traditional
inflexible worst case scenario initial stop loss. It is
psychologically comfortable to have your stop in place,
and for investors it is probably a sound strategy. But for
a trader it restricts profit.
A trader should know, before initiating entry of a trade,
what information is required from the market to confirm
the entry. If the market doesn’t confirm the entry, then
The Educated Analyst | 13 On the Couch with Chris Shea MAR /APR 2010
watching, waiting and hoping is not a strategy. There is
only one thing a trader should do in this case, and that is
to terminate the trade and go on to the next opportunity
to get into agreement with the market.
Psychologically the scratch trade means that the trader
is detached, objective and market aware, able to take
decisive action if the market requires it. A trade is not
scratched through fear or timidity. It is scratched
because the trader has the courage to take responsibility
for an action that is appropriate to the market
conditions that prevail at the time.
Scratching is a dynamic, flexible and market focused stop
loss strategy that really works as the data in this article
shows. It is a new skill that every trader needs to learn.
Through discipline and practice you can learn the skill
and benefit from its application. When you ace it, you
are on your way to becoming a trading professional.
About Chris Shea
Chris Shea is an investor, trader, educator and psychotherapist who specialises in coaching those who want to become and stay successful in financial markets.
Through his in depth Best Professional Practice Program Chris has an established a track record in coaching clients to develop the skills and drive to become independent, disciplined and very profitable full time traders.
Chris is author of “Licensed to Profit by Trading in Financial Markets”.
Chris holds a Bachelor of Education, Master of Science as well as a Diploma of Professional Counselling. While based in Brisbane, Australia, Chris has private and institutional clients in Australia, New Zealand, Ireland, USA and Singapore.
www.themarketcoach.com
Do you have a question that you would like to ask Chris Shea? Email your question to [email protected]
The Educated Analyst |14 Natural Squares Calculator Dates MAR /APR 2010
One of the advantages of studying the charts and papers
of W.D.Gann has been the ability to study the many
different ways that Mr. Gann used the Square of Nine
and the movable date rings he attached to it.
When Nikki Jones and I created the Natural Squares
Calculator, we tried to incorporate many of the different
styles of date rings that Mr. Gann used. In combining the
clockwise and counter-clockwise date rings, we
uncovered another of the exciting mysteries that make
Gann research so richly rewarding.
Since Mr. Gann used both date rings in his applications,
we created both on the same ring. March 21 on the
clockwise date ring aligns with September 23 on the
counter-clockwise ring. This aligns the 2 equinox dates
180 degrees apart in the calendar year with each other.
The chart below is a continuous daily July Soybean chart
put together, or concatenated, as Mr. Gann did on all of
his commodity charts. It consists of the July 2008
contract of soybeans until its expiration, immediately
followed by July 2009 soybeans until its expiration, then
July 2010 soybeans.
The first high shown in the chart occurred on July 3,
2008. That is now the all-time high for July soybeans
with a price of 1663.
If one locates the date of July 3 on either date ring of
the Natural Squares Calculator, the corresponding date
or inverse date on the other ring (progressing in the
opposite direction), is June 11 (see Fig. 1 below). What
we have discovered is that the probability of another
change in trend on the inverse date is extremely high. In
addition, the odds are very good that it will be the same
trend change (significant high or low). Notice then on
the chart that the high of the 2009 year comes on June
11 – exactly on the inverse date to July 3.
Figure 1
The next significant change in trend is the low on Dec 5, 2008. Using the same procedure as before, locate the Dec 5 on either date ring of the Natural Squares Calculator. The date next to it or inverse date (progressing in the opposite direction) is Jan 7 (see Fig. 2). Looking at the chart again shows that the next significant high is on Jan 12, just 3 trading days off. This example is the only one on the chart that switched from a low to a high.
The Educated Analyst |15 Natural Squares Calculator Dates MAR /APR 2010
Figure 2
The first higher bottom after the Jan 12 high is on Mar 3. Locating Mar 3 on the Natural Squares Calculator date ring gives us a corresponding or inverse date of Oct 11 on the date ring which moves in the opposite direction (see Fig.3). Referring again to the July soybean chart finds the next significant low on Oct 6, just 5 days from the projected date.
Figure 3 Using the Jan 12 high as a date to project another high from, we find that the date next to Jan 12 on the Natural Squares Calculator date ring is Nov 30 (see Fig. 4 below). Looking at the July soybean chart above, we can see that the last significant high on that chart occurred on Dec 1, just 1 day from our projected turning point.
Figure 4 Finally, we would use the next significant change in trend to project into the future the next turning points. The low of Oct 6 would project a significant low to occur on or about Mar 8. I have just briefly touched on this subject in this article and would invite anyone interested in pursuing this analysis as well as forecasting future direction and trend to contact W.D.Gann Inc. of Pomeroy, WA (see advertisement in this publication). They hold periodic seminars where I fully explain how to use this methodology in many markets as well as detailed forecasting lessons. About Ken Gerber
Ken Gerber is an active professional commodity trader and teacher of technical trading. After reading about W. D. Gann in 1981, Ken began to study Mr. Gann's writings to learn more about 'cause and effect' relationships. In 1985, Ken started a brokerage office with the purpose of spending more time on study of the Gann material. That study has led to a career as a private trader and teacher. Ken has conducted professional trading seminars on all levels in major cities in Australia as well as in the United States. He has addressed meetings of the Market Technician's Association (MTA) in the United States and the Australian Technical Analysts' Association (ATAA). Ken brings to The W. D. Gann Experience a wealth of experience as both a broker and a trader.
Mastering the Art of GannMastering the Art of GannMastering the Art of Gann
“Empowering Independence”
Workshop
May 3 - 7, 2010
Presenter : Ken Gerber
Produced by WD Gann Inc.
The only, original source for W.D. Gann’s material. Seats will go fast. Register now!
• Learn valuable information less than 50 people in the
world possess, related to the soybean market!
• Master amazing trading techniques designed to enhance
your trading profits.
• Examine the vast collection of W.D. Gann's own material
preserved by WD Gann Inc.
• We have developed two unique seminars engineered
to educate novice and advanced students alike.
Attendance is limited.
When: May 3rd - 7th, 2010
Where: The New Northern Quest Resort Spokane, Washington, USA
Be one of the privileged few to attend this
W.D. Gann Workshop!
For more information contact us at : Phone : 1 (509) 843 - 1094 Email : [email protected] Web : www.wdgann.com
1803 1822K 1840 1859 K 1877 1896 K 1914 1933 K 1951 1970 K 1988 2007 K
1804 K 1823 1841 K 1860 1878 K 1897 1915 K 1934 1952 K 1971 1989 K 2008
1842
LEGEND
A. Extreme low stock prices, strikes, repression, despair and beginning of new business generation for 18-3/5 years. 4 years of rising stock prices and improving business, markets bare of goods, young men becoming prominent.
B. High stock prices
C. Panic
D. Low stock prices
E. High stock prices
F. Panic
G. Low stock prices
H. Very high stock prices, most prosperous year waste over extravagance, most money in circulation, much speculation
J. Major panic, CRASH. 4 years of falling prices, business stagnated, breadlines, soup kitchens, despair, unemployment
K. Same as A, plus strikes, unemployment, many prominent deaths
With Phil Anderson
The Educated Analyst |18 18 Year Property Cycle MAR /APR 2010
Gann suggested it was his “most important ever
discovery”, though he went on to say that about several
other things as well. Nevertheless, the discovery
involved “time”, the first time Gann ever mentioned the
fact, and since cycles are time based, perhaps it is worth
a look. Study in particular the years as marked with a ‘k’.
It was my study of US real estate collapses that first
drew me to this Gann Financial table many years ago.
1914, 1933, 1952 and 1970: all subsequent major stock
market lows. Remember, Gann published that in 1909!
W.D. Gann also observed what he came to call “the
decade cycle”. In his many commodity and stock market
courses, he described the decade cycle this way:
“By studying the yearly high and low chart and
going back over a long period of time, you will see
the years in which bull markets culminate and the
years in which bear markets begin and end. Each
decade, or 10-year cycle, which is one-tenth of 100
years, marks an important campaign... In referring
to these numbers and these years, we mean the
calendar years. To understand this, study 1891 to
1900, 1901 to 1910, 1911 to 1920, 1921 to 1930
and 1931 to 1939. The ten year cycle continues to
repeat over and over, but the greatest advances
and declines occur at the end of the 20-year and 30-
year cycles, and again at the end of the 50-year and
60-year cycles, which are stronger than the others...
Year:
1. A year in which a bear market ends and a
bull market begins. 1901, 1911, 1921.
2. The second year is a year of a minor bull
market, or a rally in a bear market will start
at some time. 1902, 1912, 1922, 1932.
3. Starts a bear year, but the rally from the
second year may run to March or April
before culmination, or a decline from the 2nd
year may run down and make bottom in
February or March, like 1933. 1903, 1913,
1923.
4. The fourth year is a bear year, but ends the
bear cycle and lays the foundation for a bull
market. Compare 1904, 1914.
5. The fifth year is the year of Ascension, and a
very strong year for a bull market. See 1905,
1915, 1925, 1935.
6. The sixth year is a bull year, in which a bull
campaign which started in the fourth year
ends in the Fall of the year and a fast decline
starts. See 1896, 1906, 1916, 1926.
7. Seven is a bear number and the seventh
year is a bear year because 84 months or
840 degrees is 7/8ths of 90. See 1897, 1907,
1917, but note 1927 was the end of a 60
year cycle, so not much of a decline.
8. The eighth year is a bull year. Prices start
advancing in the 7th year and reach the 90th
month in the 8th year. This is very strong
and a big advance usually takes place.
Review 1898, 1908, 1918, 1928. (2008 did
not follow this pattern, which is where a little
real estate cycle knowledge was helpful in this
instance.)
9. Nine is the highest digit and the ninth year is
the strongest of all for the bull markets.
Final bull campaigns culminate in this year
after extreme advances and prices start to
The Educated Analyst |19 18 Year Property Cycle MAR /APR 2010
decline. Bear markets usually start in
September to November at the end of the
9th year and a sharp decline takes place. See
1869, 1879, 1889, 1899, 1909, 1919 and
1929, the year of the greatest advances,
culminating in the fall of that year, followed
by a sharp decline.
10. Ten is a bear year. A rally often runs until
March and April; then a severe decline runs
to November and December, when a new
cycle begins and another rally starts. See
1910, 1920, 1930.
Putting all that together, we can expect US stock
markets to have a year with a downward bias, for 2010,
with probable lows later in the year, around October /
November, then a decent rally into 2011, into the
Northern Hemisphere summer, with then further
(higher) lows in 2012. By then, the recent GFC will be
but a distant memory and the US will be well into its
next – inevitable – real estate cycle: inevitable because
the underlying structure of the economy has not been
altered. Indeed, the current President has done all he
can to preserve it, laying the basis for the non-
interruption of these cycles and patterns.
Gann’s Financial Timetable is a fraction out now, as
originally published by Gann, but, for reasons I will not
go into here, if you replace ‘1989’, with 1991, and count
forward, this will give you something VERY interesting to
follow over coming years.
About Phil Anderson
Phil Anderson is Managing Director of Economic Indicator
Service Ltd, an economic forecasting service based in London.
Phil uses Market Analyst to help with forecasting and trading
decisions. His book ‘The Secret Life of Real Estate’ was
published in the UK in 2008. The web site can be found at
The Educated Analyst |22 Trading Patterns – Part Four MAR /APR 2010
the developers of these patterns apply a great deal of
credence to them, such as V-Top, V-Bottom, Cup &
Saucer, and many others.
Many of these, I have not been able to make work to the
same degree of probability that I have with the patterns
I am covering in this series of articles. This is not to say
that the patterns do not work, it may be as simple as
myself not being able to correctly identify them, may not
have devoted enough time to testing, or not being able
to develop a set of acceptable risk parameters to apply
which could give them the same level of reliability as the
ones I use.
Hence my use of the term for the purpose of trading, as
opposed to the term, for the purpose of study.
Again I urge you to do your own testing and
development. Don’t take what I, or indeed any other
author, have to say and blindly follow it. Please have a
healthy measure of scepticism and be prepared to try to
prove it wrong.
Challenger Financial Group
With Challenger, we can clearly see that directional change occurred in August 2006 and a strong drive up resulted in this change. We then clearly see that price seemed to change direction in September of 2006, we have a Low Turning Point late in September, followed by a rise in price, then a fall again beginning mid October.
The question we need to ask here is: “Is this formation a
consolidation, or a retracement? Therefore will it
possibly form a pattern which I can reliably identify and
trade?”.
There is no doubt that there is strong support at around
$3.30, there have been 1 Low Turning Point and 2 lows
at that level, during which time, price formed a new high
turning point. So we can assume that price action is
compressing, is it forming a consolidation?
It could be argued that the ROM (Range Of Movement)
has reduced, but if we look at volume during this period,
it has sustained or possibly increased.
Remembering that most retracements seem to be
volume driven with sustained or
increased volume during the
formation, is this more likely to
be a retracement or a
consolidation, when looked at in
conjunction with the fact that
ROM has not reduced a great
deal?
A price compression does not
necessarily equal a consolidation,
therefore, every compression we
identify needs to be looked at in
the context that is can be a
precursor, but is not always an
identifiable consolidation or
pattern.
The Educated Analyst |23 Trading Patterns – Part Four MAR /APR 2010
The Educated Analyst |26 Trading Patterns – Part Four MAR /APR 2010
hope that we have progressed the learning of some of
the subscribers in this highly profitable trading area.
I look forward to working with you further in subsequent
publications, and look forward to any feedback from
subscribers.
Have a great start to the year, and may the markets go
with you.
Peter
About Peter Varcoe
Peter started learning about trading with Wallstreet Group from Melbourne in 1999. He then joined the company to head up the Queensland Branch in March 2000. He left Wallstreet Group during 2002 and Joined Stock Market Investors Group to help with their program of educating Primary Producers, and for the next 2 ½ years was educating Primary Producers in Victoria, Queensland and Western Australia. Peter joined Australian College of Financial Education as Senior Lecturer in 2005 and contracted to them for education, a position which he still holds today. Peter’s experience is mainly in shares and CFD’s but Forex is filtering its way into his trading for future incorporation. He has done many thousands of hours work with patterns, in particular, flags, pennants, triangles and has developed some very specific, reliable techniques around these continuation entries. Peter heads up Aztec Trading & Training which is a subsidiary of WIN Financial Group incorporating WIN Financial Network and WIN Investors Club.
The Educated Analyst |27 The Balance of Power MAR/APR 2010
Every buyer needs a seller and every seller needs a buyer. If you have more buyers than sellers, then the price will rise. More sellers than buyers, then the price will fall. This is simply known as supply and demand and it is a basic tenet of market value. Whichever way the buyer/seller balance happens to bias, then you can bet that the market will follow. Traders spend fortunes betting on which way they think the bias is leaning. Many will simply use reports and gut feelings to make that decision, but the balance of power is already revealed in a subtle way by price action. Learn to see the subtleties that reveal it, and you have the edge that everyone is looking for.
Price will typically develop a channel where a trend line parallels itself between the upper extreme of price and lower extreme of price, maintaining a similar distance and angle during most of the trend. This is referred to as a balanced trend. But when it comes to the battle between buyers and sellers, the balance is never permanent. Frequently price will distort a channel and it is these distortions that reveal subtle changes in the bias within the balance of power. Anytime you see the upper price extreme not in agreement with the lower price extreme then an imbalance exists.
If you have studied basic technical analysis then you may already be familiar with a host of patterns that have non-parallel upper and lower trend-lines or channel lines. One such example would be that of the triangle pattern which has both lines angled toward one another. Depending on how the triangle forms, standard technical analysis tells you what bias to expect from the market based on the pattern’s shape or angle of lines. An ascending triangle has an upward bias, while a descending triangle has a downward bias. A symmetrical triangle has no indicated bias until price makes a commitment one way or the other. The view of each of these patterns and their bias is based on past experience alone, but the reality is that
their very shape and angle of lines already establish both their bias and what to expect. When you understand how to read the bias of channel lines, then the patterns themselves start to make a great deal more sense. Further, you are then able to apply these same principles to a much greater portion of price activity, far beyond that of just mere patterns.
When the balance of power is extreme as you find during a strong trend, then it is easy to determine what that bias is. But when it is subtle as it is during consolidation patterns, then it is much more difficult of a task to determine. Yet, it’s during the subtle times that knowing the bias often is of the most benefit. So what is the secret to determining the bias in the balance of power?
Two Factors That Determine Balance of Power
There are two factors to consider when reading market bias; the overall direction of the channel and any distortion between the angles that form the two lines.
The first factor is easy to understand; the overall direction of the channel indicates market bias. This means that if both channel lines are moving higher, then the market bias is upward, following the direction of the channel. It is as simple as up is up and down is down. When you have a trading range with two horizontal
THE BALANCE OF POWER
With Michael Parsons
The Educated Analyst |28 The Balance of Power MAR/APR 2010
channel lines, then the bias is neutral. So whatever direction the channel is facing indicates the bias of the market. Despite moving higher or lower, parallel movement between the two lines indicates that both buyers and sellers are in unison about the bias of a market. Any battle between the two is minimal.
The second factor requires a little more effort to understand. Any distortion from a parallel angle between the two channel lines indicates bias in the balance of power. This means that if the two lines are drawing closer to one another then there is a bias indicated. If they are drifting further away from each other then there is a bias indicated. In addition, how the altered lines are in relation to one another further dictates how this bias would be interpreted. What this means is that both the angle and direction are important in determining market bias. Image 1 and image 2 show several series of configurations that depict what can appear and their meaning.
Some of the configurations and their indicated bias may seem at first contradictory. For example, if the upper line rises slower than the lower line it indicates a bearish bias rather than a bullish bias. Now compare this to the pattern where a horizontal line stops price from advancing any higher while the lower line continues to
ascend, which indicates a bullish bias. Both of these examples fit descriptions to patterns known as a wedge and an ascending triangle of which you may already be familiar with. But the real question here is why do they indicate the bias that they do? Understanding the why and how will give you the opportunity to apply these
same principles to many more situations beyond either of these patterns.
The answer to why and how is inseparably connected to crowd psychology. There is a battle going on between buyers and sellers. The upper line represents the battle line of the buyers, while the lower line represents the battle line of the sellers. Remember, a buyer is looking to purchase at the very best possible price and may have previously sold short. So it is not in his best interest to have prices rise
higher, that is at least not until he has actually bought. On the other hand, a seller is looking to sell at the very best price that he can obtain whether he has already bought and looking to liquidate his position or simply looking to sell short. Either way, he does not want price to drop further, not at least until he has actually sold. It is those who accept the bids and offers that change the value of a market. So it is the traders that are actually looking to buy or sell that matter here, not those that already hold positions, unless they are looking to exit their trades. When actual trading activity occurs there is a bid price and an ask price where buyers and sellers make offers to the other side. The bid price is what the buyers are offering and is naturally lower than the ask price, which just happens to be what sellers are offering. Each is offering what they think they can get from the other side.
The battle between buyers and sellers through the bid/ask spread is nothing more than the balance of power at work, and the principles of this struggle extend to a greater level far beyond this momentary spread.
The Educated Analyst |29 The Balance of Power MAR/APR 2010
The bid/ask action may give us our first glimpse as to who has the upper hand, but unless you happen to be a floor trader with the ability to exploit this momentary spread, then it really is of little value in determining which way a market is leaning. The spread is just too narrow and short lived for most trading. So our view of this battle has to move to higher ground; the battle lines of channel lines.
In any advancement, whether up or down, it is the line that is pushing the market that controls the trend’s design and survival. In an uptrend this would be the lower channel line, and during a down trend this would be the upper channel line. In either case this line is referred to as an inside channel line because it faces future trading activity. If this line is broken, then typically it is the wise course to exit from any trade that may be profiting from a trend.
When there is a distortion in the parallel of the two lines, the culprit is usually the other channel line, referred to as an outside channel line since it faces past trading activity. This particular channel line is typically the variable in the equation or the troublemaker, although the inside channel line can provide its own fair share of deviant behavior as well. If the outside channel line advances too fast for the inside channel line to keep up, then the market will exhaust itself because it needs the help of the inside channel line to sustain any move. Such an advance in an uptrend would demonstrate that the sellers are over-inflating the value by demanding more with fewer buyers willing to give in to those demands. Some are still willing, but many are refusing to do so demonstrated by the fact that the inside channel line refuses to accelerate as fast as the outside channel line. Buyers who give in so willingly are usually just desperate and eventually these desperate buyers will dry up, ending the over-inflated run. When price begins to snap back from the outside channel line, the gap between the two lines alone will be enough to create a sellers panic and cause prices to tumble down in haste.
As it is true with the bid/ask spread, the alignment of these two lines define who has the upper hand in a market; the buyers or the sellers. In fact, it is actually an extension of the bid/ask spread itself because it contains the extremes of what each believes they can get from the other. The advantage of channel lines is that they show with greater depth the battle between both sides,
and are not limited to just a few minutes sampling of trading. So a history of the battle develops and the battle plan becomes obvious. The key element of this battle is that of the inside channel line because it is the foundation of which everything else depends upon. When the outside line begins to accelerate the important factor will be in how the inside line chooses to respond. If it fails to accelerate as fast as the outside line then the move has a serious problem and an imbalance between the buyers and sellers exists. The common theme throughout all the configurations illustrated is that if both are not in unison then a battle is raging between buyers and sellers over market bias.
To get a better idea of how this battle is revealed by the action of channel lines, consider a few chart patterns that you are probably already familiar with; triangles. There are three basic types of triangles; symmetrical, ascending and descending. The lines that are drawn to outline a triangle are in fact nothing more than channel lines, although they are non-parallel. As the lines draw closer to one another, pressure builds up to a point where it is finally forced to break, usually resulting in a substantial move. But even before this happens the bias or balance of power is already indicated by the way the lines have formed.
In an ascending triangle the outside channel line comes to a complete stop and appears as a horizontal line, all the while the inside channel line continues to advance toward it. The very fact that an inside channel line is rising tells you that the bias is toward higher prices and that the power belongs to the sellers. What makes this pattern different from that of a wedge pattern is that the buyers have entrenched themselves and are refusing to budge at all, yet they are still losing ground. So few buyers are liquidating their position and many are waiting for lower prices before buying, which means that if prices do move higher then they will be caught off-guard and will face a point of desperation as they either panic to get out of their trades or try to profit from the rapidly moving trend. The buyers may be attempting to hold a battle line, but they just can’t stop the progression entirely and eventually that battle line collapses as it gives way to higher prices.
The Educated Analyst |30 The Balance of Power MAR/APR 2010
Because triangles are so well documented in technical analysis you may already have a good handle on how to trade them. But there are times when they will not follow their expected bias or are subject to false breakouts. Using channel lines to make an analysis of a pattern can offer a critical insight as to which way the balance of power is leaning and the direction that the pattern is likely to break. Sometimes the balance of power will be indicated by the entire pattern, but other times you may have to look at individual pieces of the pattern as it develops. Either way, the bias is usually somewhere to be found in the pattern itself.
Obviously, a large cross-section of a pattern will provide you with the strongest bias, but even strong bias can change its leaning rather quickly. Small cross-sections offer you the advantage of providing the earliest indication of bias or changes in its leaning. The earliest warning can at times be the most critical when entering and exiting, so there is great value in being able to interpret this with just the most subtle of variations within channel lines. The more subtle the configurations you can read and interpret, the quicker you can respond. This in turn allows you to enter or exit at better prices, generating greater profit.
Often, the initial indication of bias rests
in a single bar that doesn’t quite reach as far as prior highs or lows within a pattern. The signal may be subtle, but it is the first warning to where the balance of power is leaning and of course where price is likely to be headed in the near future. Since price frequently moves rapidly after leaving any consolidation pattern, understanding these subtle signals can make the difference between making a quick profit and taking a quick loss. Image 3 and image 4 show a series of bar configurations and their subtle indications.
The Educated Analyst |31 The Balance of Power MAR/APR 2010
Some actual chart examples of the subtle changes in bias can be seen in image 5 and image 6. Can you identify who is winning the battle over the balance of power?
So it is to your advantage to look beyond patterns and see what is actually happening within the price action itself. It is fine to understand triangles, flags, wedges and so on, but the real signals are contained within the channels that actually form them. Besides, it is much easier to memorize the few channel patterns than all the hundreds of patterns that can develop on a chart. Channels can reveal much more about the balance of
power and is much easier to learn, interpret, and implement.
Especially when you see non-parallel channel lines will there be subtle indications of a bias in the balance of power. While momentary bias doesn’t guarantee that a market is headed in any specific direction, it does provide you with an early warning and will usually be the precursor to the market’s direction when it finally commits to one. Any early indication in the balance of power can provide you with an edge that allows you to have more success with your trading. Understand how to read the balance of power and you will tip the scale in your favor.
About Michael J Parsons
Michael J Parsons is a professional
futures trader and published author of
several trading books and courses. He
is a pioneer of several new and unique
methods of trading that are
revolutionising how markets are analysed and traded. His
astounding market insight and ability enabled him to publicly
predict in advance the exact week that the 2008 decline of the
S&P market would begin, and to even forecast just how low it
The Educated Analyst |36 Planetary Cycles Methodology MAR / APR 2010
“I have proved to myself, and I proved to other people
that the law of vibration explains every possible phase
and condition of the market.” W.D.Gann
All the big cycles and the trend of the financial markets
activities are related to the planetary cycles trends.
Gann realized that there are always the same laws acting
in the universe, and the difference was only into the
different fields treated and not in the cyclical events. It
was just this basis defining the “Universal law of
Vibration” that leads to the “Theory of the Planetary
Cycles” allowing to Gann to become the greatest trader
up to date.
Through this theory, Gann combines the movement of a
security or an index coming on future regular bases. He
drew them up on a calendar containing the most
important days (or periods) of the year, in regard of the
Solar System Planets Motion.
Recalling the Biblical quotation “There Is Nothing New
Under The Sun”, Gann said that the future was just a
repetition of the past, and it was possible to glean all
possible future events through the cyclical planetary
movement that in the past was in perfect harmony with
a hypothetical financial market.
On an intuitive level we could imagine the Universe as a
big orchestra which generates infinite cosmic melodies
coming out from the planet motion movement around
the Sun. This movement producing a vibration, that is a
sound itself, and according to the Law of Resonance, its
frequency is inaudible to humans and such vibration
could vibrate other bodies on the Earth, like persons and
things.
Sympathetic Resonance is the scientific term used for a
natural phenomenon so that a body, subject to an
external source of vibration and having a frequency
equal to the natural frequency of the body itself, begins
to vibrate.
When two strings of a violin are at the unison and one of
the two is played, the other one will oscillate at the
frequency of the played chord. This will happen even
though the second chord won’t be touched by the violin
bow.
Nature tends to synchronize all the elements initially
appearing to be discordant. Sometimes, achieving this
sync state requires the maximum entropy until a
common denominator is obtained… after that stability
comes out.
We have thousand of these examples in nature.
Sync happens even with physical appearance, because,
year after year, persons living together tend to resemble
each other. Older couples not only achieve similar
habits, but seem to be more similar than they were
when they met.
In the case of financial markets, survey work consists of
searching for the item in nature with which a particular
market is synchronized, and then applying to it
mathematical-geometric solutions for its prediction.
The duration of different planetary cycles, intended as
the period of time to make a full revolution about the
Sun, in many cases, appear to be in harmony, respecting
the musical diatonic system. We can see an example
hereby:
Uranus cycle Fundamental tone= 84 years Octave (180°)= 42 years - similar to sinodic Saturn-Uranus cycle Double Octave (90°)= 21 years - similar to sinodic Jupiter-Saturn cycle Fundamental /12= 7 years - similalar to: sinodic ½ Jupiter-Uranus
1/3 Jupiter-Saturn ¼ Saturn cycle
Sinodic Saturn-Uranus cycle: Fundamental tone= 45 years - similar to Octave of Uranus Octave (180°)= 22 ½ years - similar to Double Octave of Uranus Fundamental /12 3.75 years - similar to Two Mars Cycles
PLANETARY CYCLES METHODOLOGY
With Mariano La Rosa
The Educated Analyst |37 Planetary Cycles Methodology MAR / APR 2010
Since each cycle, either Synodic or Sidereal, moves over
an angle going from 0° (degrees) up to 360° (degrees),
using the SIN trigonometric functions we can easily turn
circular movement into a sinusoidal movement.
Through appropriate weights weighting, the
combination of multiple cycles with different harmonics
allows one to obtain a composite cycle that, once
synchronized with the past motion of a market,
extrapolate future developments with a measured
approximation.
It is important to keep in mind that the composite cycle
resulting does not provide indications about price, but
only about time. That’s the reason why carrying out
surveys about the past will be necessary to deduct the
trend from that movement through common price
oscillators, as in the following example.
As we can see in the chart, the oscillator allows us to
find underlying cycles regardless of the price, because
the indicator oscillates around zero.
This is the only way to conduct the survey on those
planetary cycles which can interpolate better the
oscillator, so that they can extrapolate the future trend.
With regard to the long term trends, it appears that we
will have to use very slow cycles; in fact very interesting
tips come from Jupiter, Saturn and Uranus cycles.
However, with regard to the short term trends, it will be
important to use shorter cycles, before all the Solar
cycles.
With regard to a short term analysis about the Italian
market, we used the octave of the fundamental tone of
the Solar cycle (to recall the diatonic system we mean
180°, as discussed above) combined together with a
smaller harmonic of the same cycle. Once added and put
in phase with the two waves, we got a composite cycle.
It is very useful to extrapolate the mid-term trends
within the calendar year, as shown in the following
chart.
The only input of the above
application is the coordinates of
longitude of Earth revolving
around the Sun, expressed in
degrees. This gave us a
satisfactory result with some
approximation within two weeks.
Obviously this cycle will be
inserted into the longer planetary
cycles, in order to extrapolate
future trends for periods
exceeding one year.
The Educated Analyst |38 Planetary Cycles Methodology MAR / APR 2010
About Mariano La Rosa
Mariano La Rosa graduated in Economics and has twenty
years experience trading in advanced technical analysis and
cyclical analysis of the financial markets. He is a student and
has a keen interest in the well known W. D. Gann Theory.
Mariano forecasted, with great accuracy, the exact week and
day of the end of the markets downtrend, which took place
between the 6th and the 9th of March 2009. All this happened
during a live show on ClassCNBC Television, on February 2009.
Mariano is one of the best traders in the world in managed
portfolio demonstrable returns and has a wide experience in
futures and options, and is widely recognized by the
specialized press and ClassCNBC financial television.


![arXiv:1904.08208v1 [cs.CV] 17 Apr 2019 · 2019-04-18 · arXiv:1904.08208v1 [cs.CV] 17 Apr 2019. labels due to having been generated automatically. ... proposed by Perona and Malik](https://static.documents.pub/doc/80x56/5eca24e730d47d5e2306f6c8/arxiv190408208v1-cscv-17-apr-2019-2019-04-18-arxiv190408208v1-cscv-17.jpg)


