Page 1
GREENVILLE, SC BIRMINGHAM, AL CHARLOTTE, NC LEXINGTON, KY PIKEVILLE, KY
March 10, 2020
Mr. John Aultman, P.E.
Vulcan Materials Company
201 Brown Road
Piedmont, SC 29673
Subject: Fairfield Mine Permit — Storm Water Runoff Design Summary
This letter and accompanying attachments provide guidelines for the design of sediment ponds
and additional sediment and erosion control measures at the Vulcan property located in
Winnsboro, Fairfield County, South Carolina. The described measures are necessary to control
sediment and storm water runoff related to overburden and stockpile area construction.
The overburden areas will be located on the north end of the project site. The overburden areas
are labeled as overburden areas 1 and 2, with Overburden Area 1 being the easternmost
overburden area and Overburden Area 2 being the westernmost overburden area. Four
sediment ponds, three for Overburden Area 1 and one for Overburden Area 2, will be needed
due to the topography and size of the area. The four sediment ponds are labeled as Pond 1,
Pond 2, Pond 3, and Pond 4. Pond 1 will be located on the east side of Overburden Area 1.
Pond 2 will be located on the northwest side of Overburden Area 1. Pond 3 will be located on
the southwest side of Overburden Area 1. Pond 4 will be located on the southwest side of
Overburden Area 2. Storm water will be routed to the ponds via ditches, terraces, and down
drains.
The sediment ponds will treat the storm water from the overburden area and the treated storm
water will be discharged downstream. The locations of the overburden area and ponds can be
found in the site construction plans.
SEDCAD hydrologic software was used to determine existing and future storm water runoff
volumes and flow rates. The rainfall input data used to estimate storm flows in SEDCAD was
provided by the SC DHEC Storm Water Management BMP Handbook. The ponds will meet
the criteria of not overtopping during a 100-year storm event and will maintain a minimum of 6
vertical inches between the pond surface elevation and the emergency spillway during a 10-
year storm event. The ponds have been designed to manage storm water flows from the
overburden area designated on the grading plans. The ditch systems shown on the grading
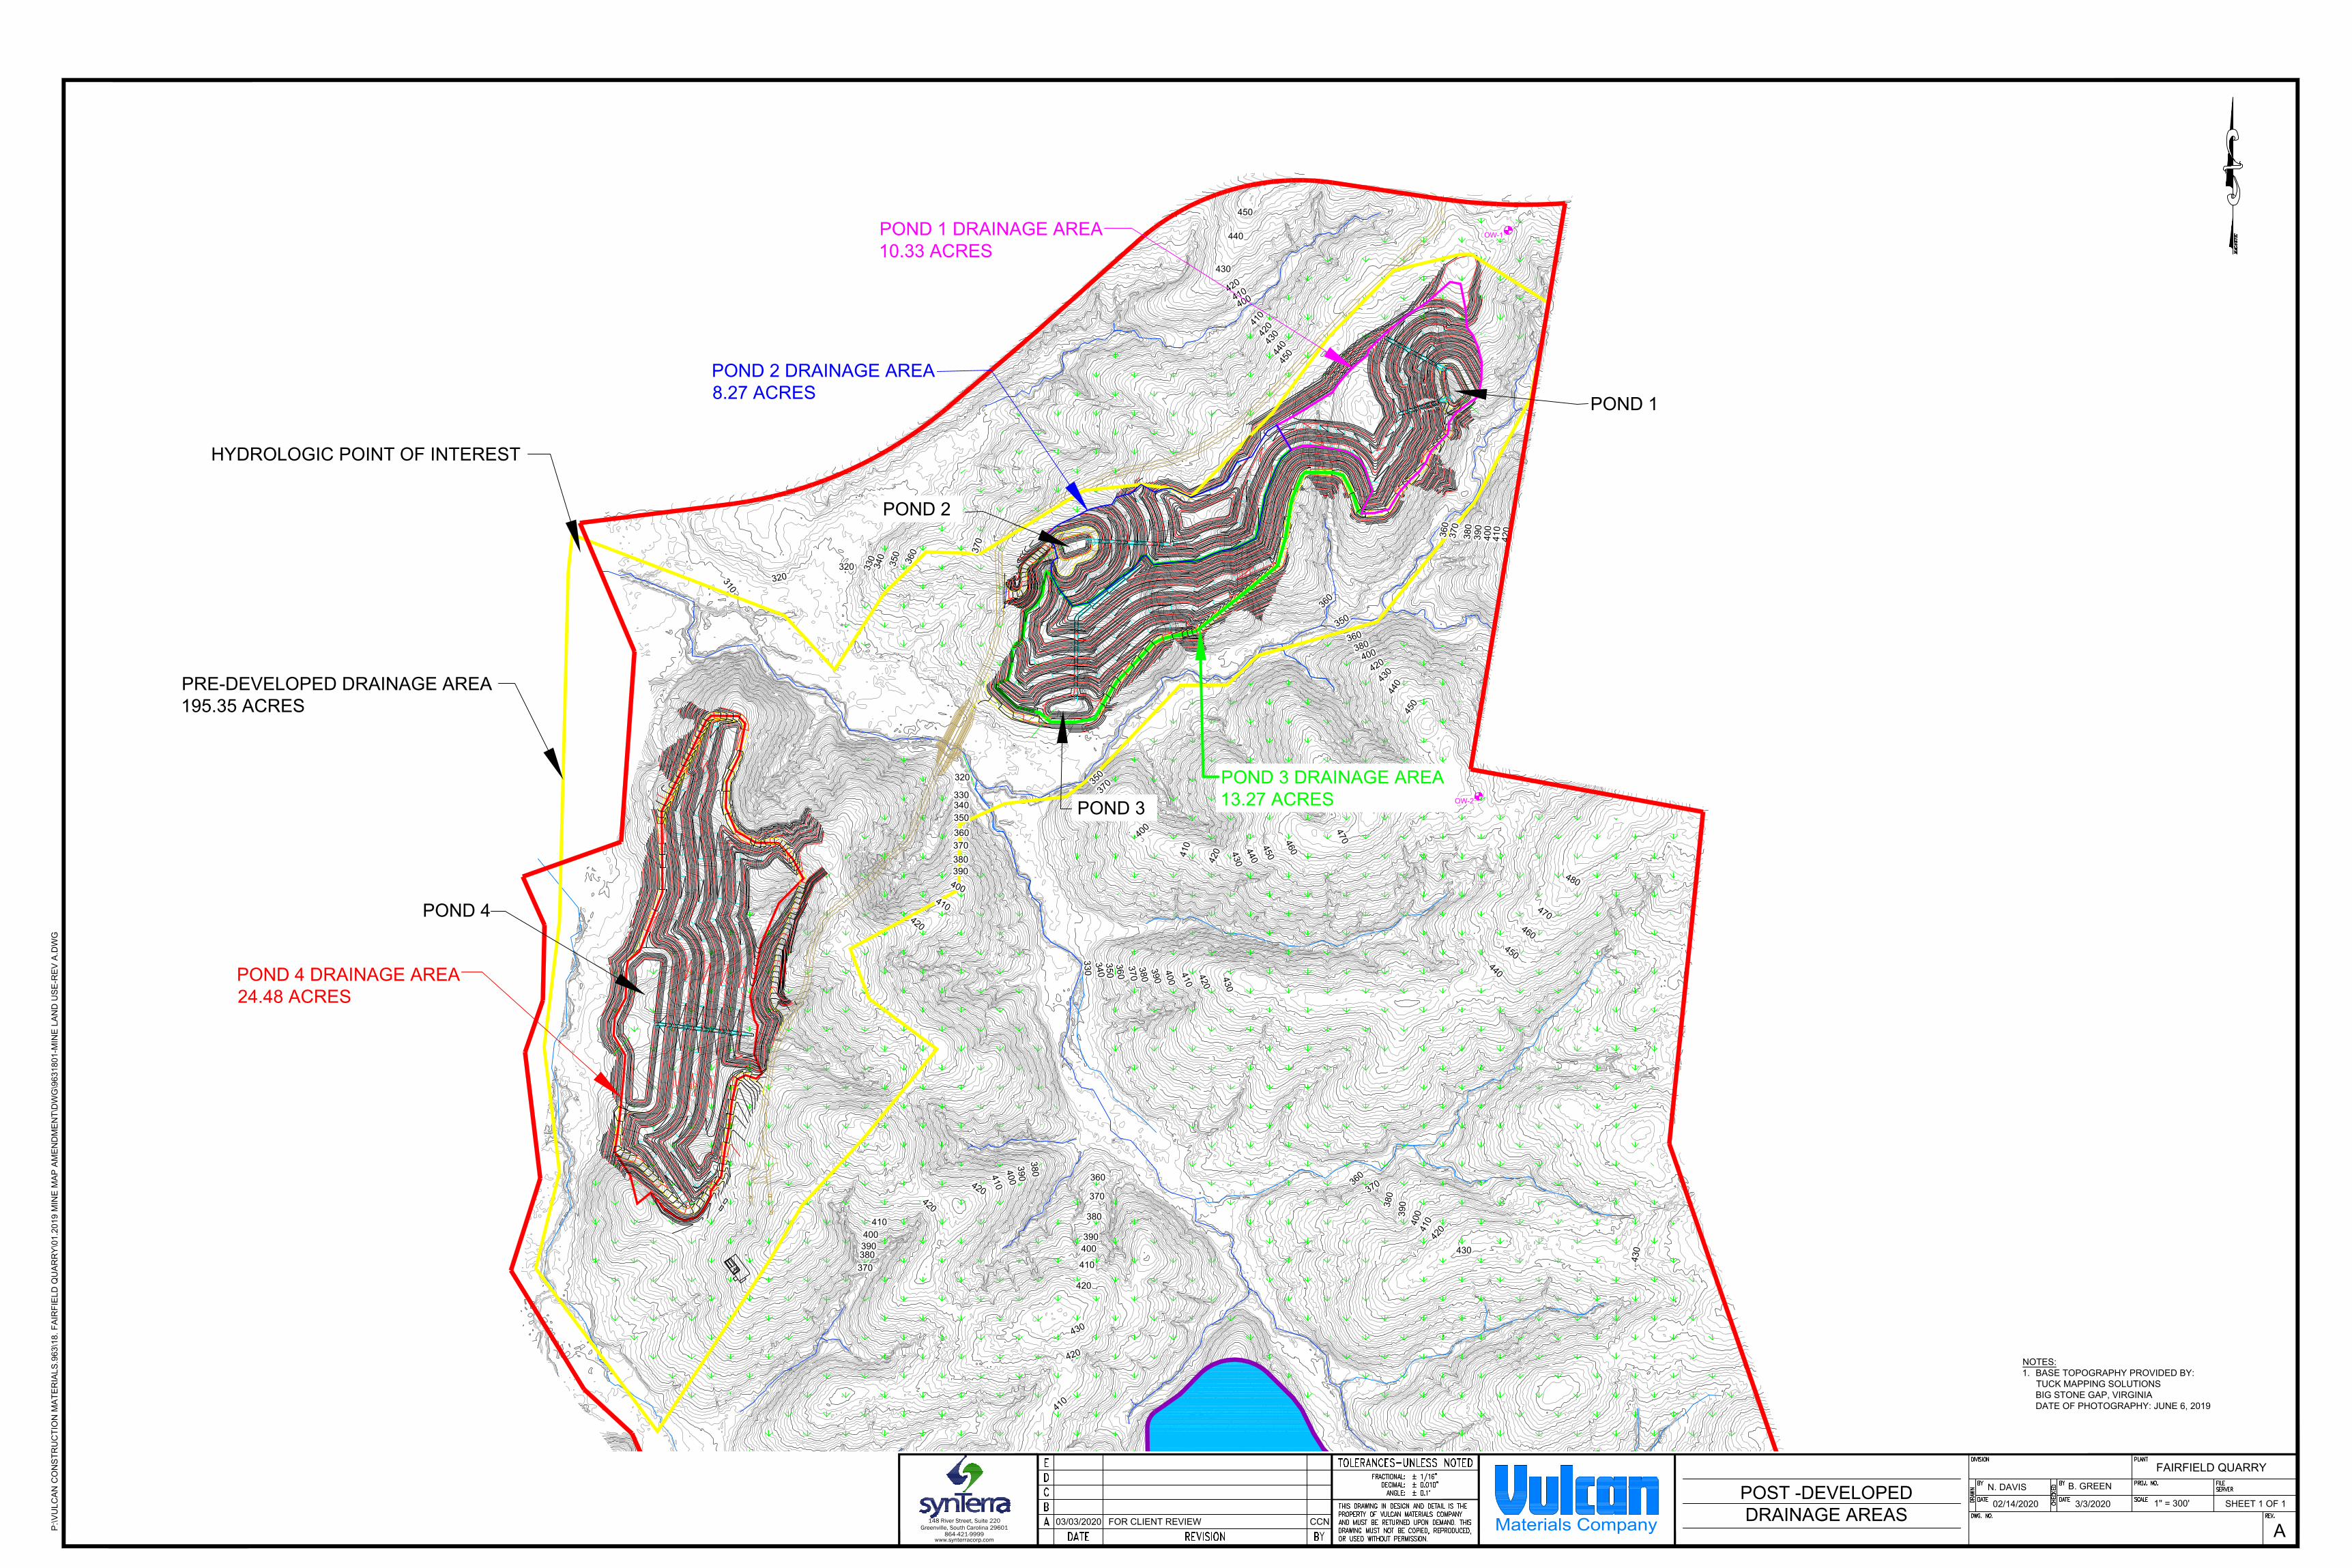
plans will allow for proper drainage to the ponds. The drainage areas for each pond are shown
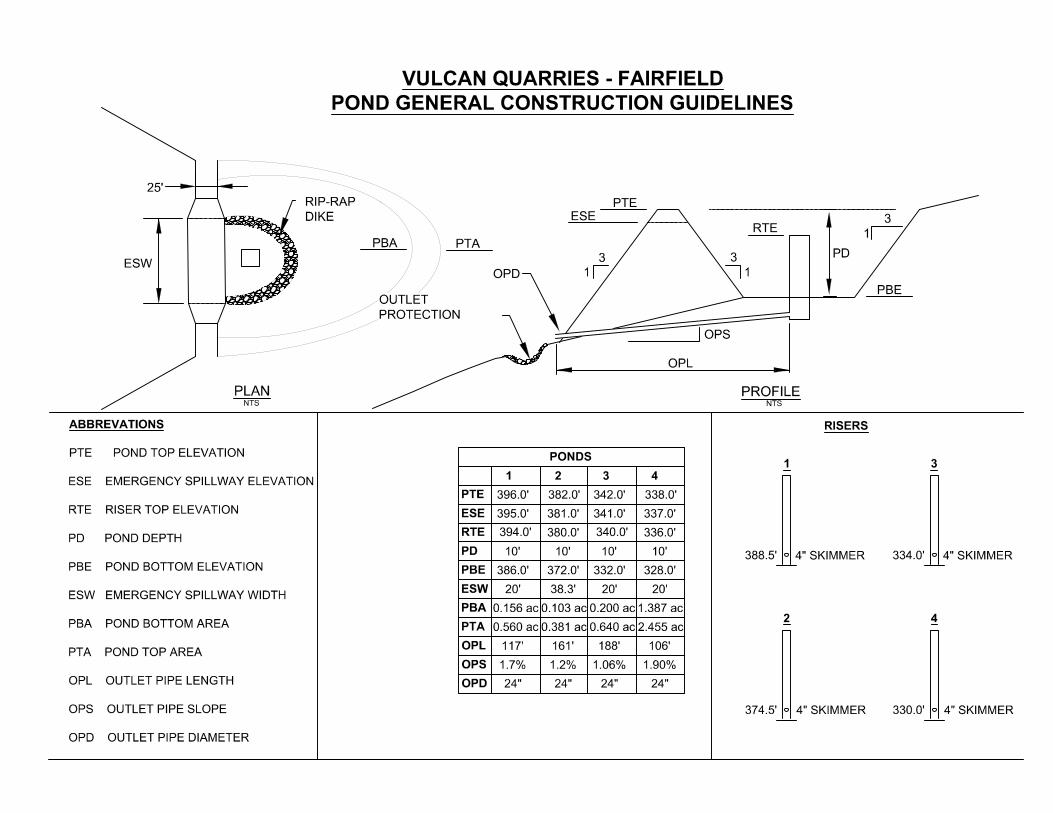
on a figure included as Attachment 1. The attachment titled Pond Parameters describes the
Page 2
Mr. John Aultman, P.E. March 10, 2020 Page 2
P:\Vulcan Construction Materials.963\18. Fairfield Quarry\01.2019 Mine Map Amendment\Submittal\Final Submittal\0 - Letter Fairfield Ponds.docx
drainage areas, flow rates, and individual design guideline criteria for each of the ponds
(Attachment 2). The design guideline criteria for the ponds are shown as a detail on the grading
plans and in the attached chart titled Pond General Construction Guidelines (Attachment 3).
Attachment 2 is intended for field use. The calculations for the sediment ponds are included as
Attachment 4.
The predominant soil type in the area is Wilkes sandy loam. The Wilkes soil type carries a
hydrologic soil group classification of C. Pre-construction ground cover is considered to be
woods-grass combination (tree farm) in fair hydrologic condition. The curve number
representing pre-construction conditions is 76. The future groundcover with the placement of
overburden is considered to have approximately 50 percent grass cover with a relatively poor
hydrologic soil condition. The curve number representing the future conditions is 86. There are
areas that contribute runoff to the discharge points that will remain undisturbed and will
bypass the four sediment ponds. Curve Numbers for these areas are identical to pre-
construction conditions. A soil map is included as Attachment 5.
The sediment produced from the overburden area will be routed to the four ponds, which will
maintain a sediment trapping efficiency of at least 80 percent during a 25-year, 24-hour storm
event.
The following criteria will be identical for sediment ponds 1, 2, 3, and 4:
Concrete riser structure
o Minimum dimensions 3 feet x 3 feet
o Trash rack
o Floating Skimmers
Rip-rap (SCDOT Class C) dike surrounding riser
o #5 stone on face
o Tie-in to earthen berm
o Minimum 5 feet distance between rip-rap and riser
Outlet pipe
o Concrete or corrugated metal
o Tie-in to riser
Discharge location
o Plunge pool-shaped rip-rap stone bed apron
o Filter fabric underlain and tied in to adjacent grades
o Apron length and width adequate for proper energy dissipation
Page 3
Mr. John Aultman, P.E. March 10, 2020 Page 3
P:\Vulcan Construction Materials.963\18. Fairfield Quarry\01.2019 Mine Map Amendment\Submittal\Final Submittal\0 - Letter Fairfield Ponds.docx
Berm designs
o All Ponds
Minimum width of 25 feet
Tie-in to existing ground
o 3:1 side slope design
Check dams downstream of the pond discharge locations are recommended. The purposes of
the check dams would be to reduce concentrated flows as an additional energy dissipation
method and to provide additional settling.
In addition, best management practices — including, but not limited to, silt fence, check dams,
storm water ditching, and grassing — shall be used throughout the site during and after
construction of the overburden areas to control any and all erosion and/or offsite sedimentation.
Please review the package and respond with comments at your convenience.
Sincerely,
SynTerra Corp.
Brian Green, P.E.
ATTACHMENTS:
1. Drainage Area Figure
2. Pond Parameters
3. Pond General Construction Guidelines
4. SEDCAD Calculations
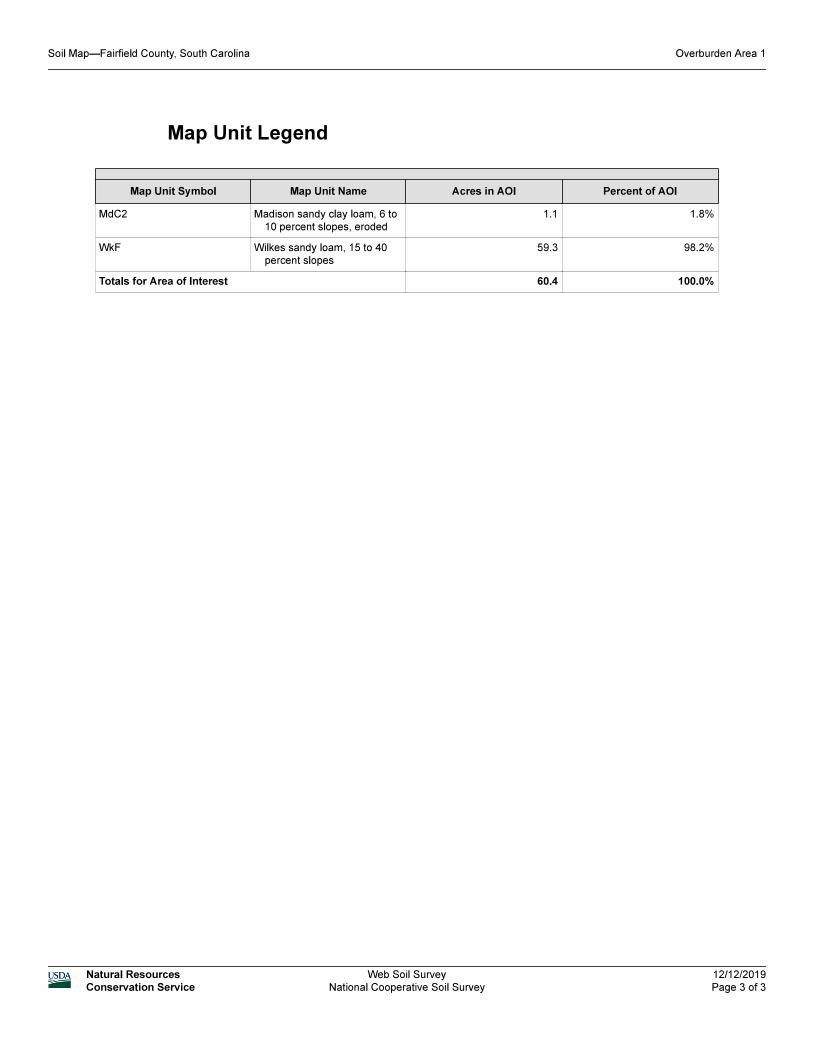
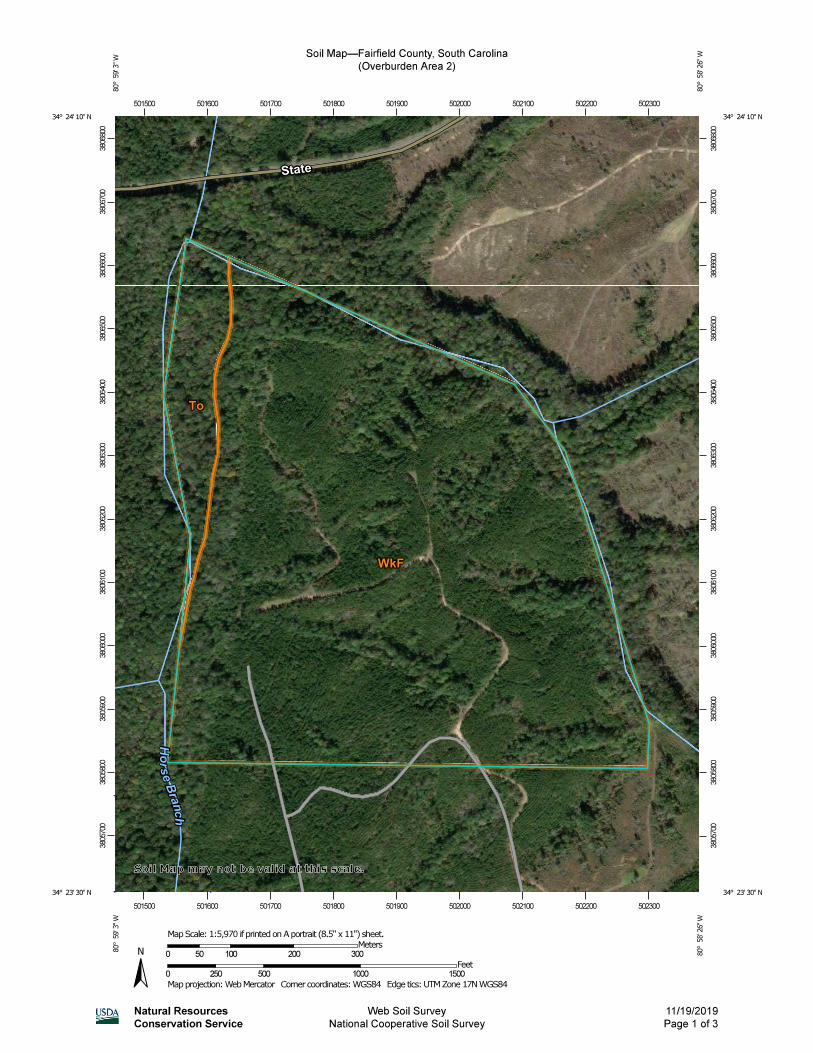
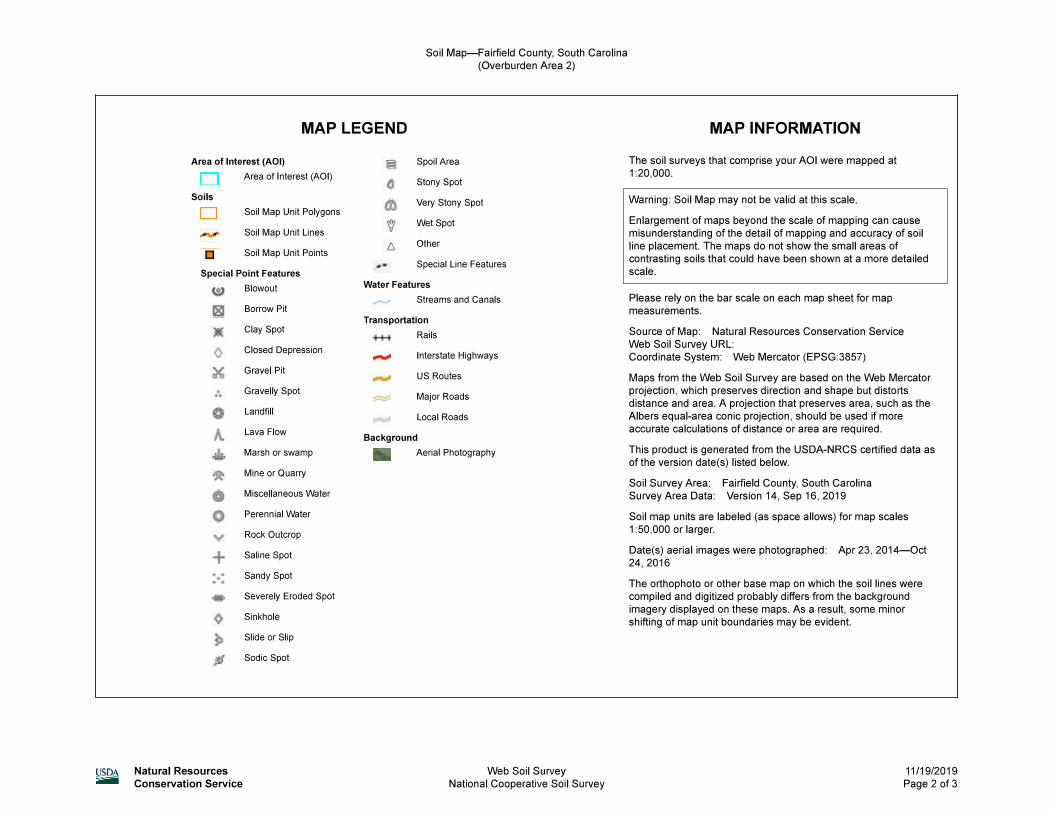
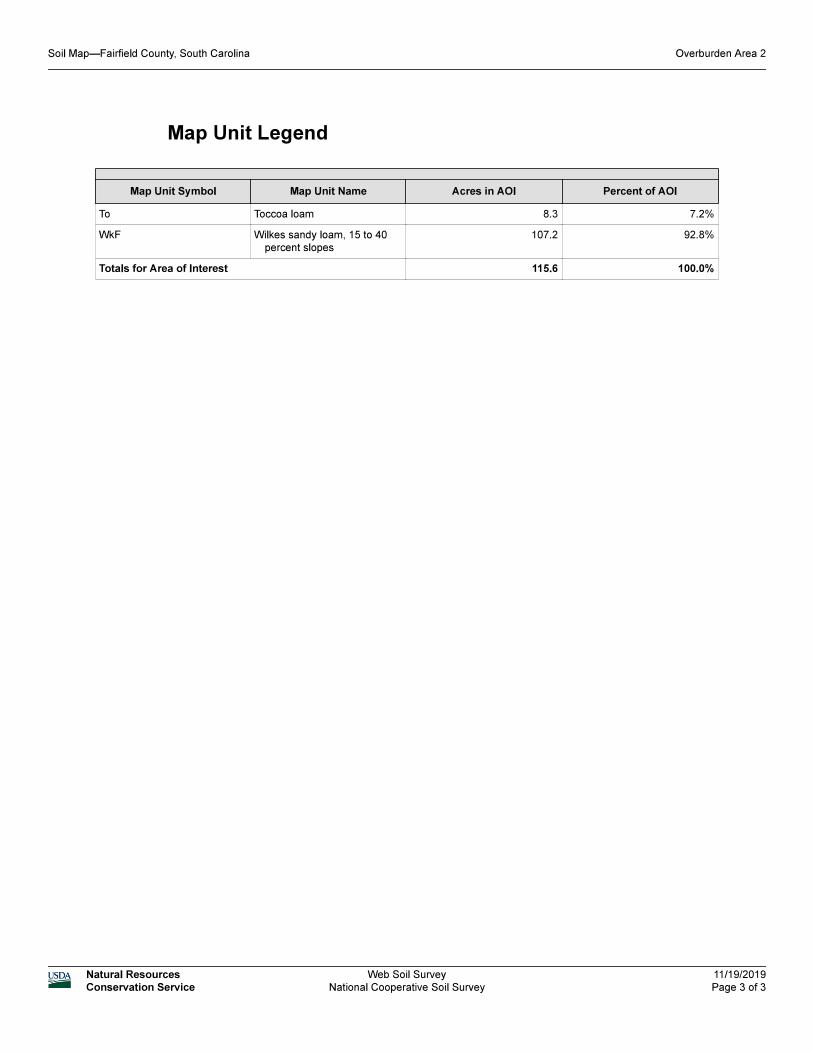
5. Soil Map
Page 4
x 357
x 358
x 357
x 358
x 399
x 400
x 357
x 358
x 358
x 359
x 359
x 360
x 360
x 361
x 361
x 362
x 362
x 363
x 363
x 364
x 364
x 365
x 365
x 366
x 366
x 367
x 367
x 368
x 377
x 378
x 378
x 379
x 379
x 380
x 380
x 381
x 381
x 382
x 382
x 383
x 383
x 384
x 384
x 385
x 385
x 386
x 386
x 386
x 387
x 387
x 388
x 397
x 398
x 398
x 399
x 399
x 400
x 400
x 401
x 401
x 402
x 402
x 403
x 357
x 358
x 358
x 359
x 359
x 360
x 360
x 361
x 361
x 362
x 362
x 363
x 363
x 363
x 364
x 364
x 365
x 365
x 366
x 366
x 367
x 367
x 368
x 368
x 369
x 369
x 370
x 377
x 378
x 378
x 379
x 379
x 380
x 380x 381
x 381
x 382
x 382
x 383
x 383
x 383
x 384
x 384
x 385
x 385
x 386
x 386
x 387
x 387
x 388
x 388
x 389
x 389
x 390
x 390
x 391
x 391
x 392
x 392
x 393
x 393
x 397
x 398
x 398
x 399
x 399
x 400
x 400x 401
x 401
x 402
x 402
x 403
x 403
x 403
x 404
x 404
x 405
x 405
x 406
x 406
x 407
x 417
x 418
x 418
x 419
x 419
x 420
x 420
x 421
x 421
x 422
x 422
x 423
x 423
x 424
x 424
x 425
x 425
x 426
x 426
x 426
x 427
x 417
x 418
x 361
x 362
x 362
x 363
x 363
x 364
x 364
x 365
x 365
x 366
x 366
x 367
x 381
x 382
x 382
x 383
x 383
x 384
x 384
x 384
x 385
x 361
x 362
x 362
x 363
x 363
x 364
x 363
x 364
x 365
x 365
x 366
x 366
x 367
x 367
x 368
x 381
x 382
x 382
x 383
x 383
x 384
x 384
x 385
x 385
x 386
x 386
x 387
x 387
x 388
x 388
x 389
x 389
x 390
x 385
x 386
x 386
x 387
x 387
x 388
x 401
x 402
x 401
x 402
x 402
x 403
x 401
x 402
x 402
x 403
x 403
x 404
x 403
x 404
x 404
x 405
x 404
x 405
x 405
x 406
x 406
x 421
x 422
x 422
x 423
x 423
x 424
x 401
x 402
x 402
x 403
x 403
x 404
x 404
x 405
x 405
x 406
x 406
x 407
x 407
x 408
x 408
x 409
x 409
x 410
x 410
x 411
x 411
x 412
x 415
x 416
x 416
x 415
x 416
x 417
x 435
x 436
x 436
x 437
x 437
x 438
x 416
x 417
x 436
x 437
x 437
x 438
x 421
x 422
x 422
x 423
x 435
x 436
x 455
x 456
x 441
x 442
x 441
x 442
x 442
x 443
x 443
x 444
x 442
x 443
x 443
x 444
x 456
x 457
x 457
x 458
x 458
x 459
x 461
x 462
x 462
x 463
x 455
x 456
x 456
x 457
x 455
x 456
x 456
x 457
x 457
x 458
x 444
x 445
x 445
x 446
x 446
x 447
x 447
x 448
x 448
x 449
x 449
x 450
x 450
x 451
x 451
x 452
x 450
x 451
x 450
x 449
x 449
x 448
x 448
x 447
x 447
x 447
x 446
x 446
x 445
x 445
x 444
x 444
x 443
x 461
x 464
x 463
x 463
x 464
x 455
x 456
x 456
x 457
x 457
x 458
x 458
x 459
x 459
x 460
x 460
x 461
x 461
x 462
x 462
x 463
x 463
x 464
x 464
x 465
x 465
x 466
x 466
x 467
x 467
x 468
x 468
x 469
x 469
x 470
x 470
x 471
x 471
x 472
x 472
x 473
x 464
x 465
x 465
x 466
x 466
x 467
x 467
x 468
x 468
x 469
x 469
x 470
x 470
x 471
x 471
x 472
x 464
x 465
x 465
x 466
x 466
x 467
x 467
x 468
x 468
x 469
430
440
450
4
2
0
4
1
0
4
0
0
4
1
0
4
2
04
3
0
4
4
04
5
0
4
5
0
3
6
0
3
7
0
380
390
400
410
420
4
4
0
4
3
0
4
2
0
4
0
0
3
8
0
3
6
0
3
5
0
3
6
0
3
7
0
3
6
0
3
5
0
3
4
0
3
3
0
320
3
2
0
3
1
0
3
7
0
3
9
0
4
0
0
4
1
0
4
2
0
4
3
0
4
4
0
4
7
0
4
5
0
4
6
0
3
5
0
4
2
0
4
1
0
4
0
0
390
380
370
360
350
340
330
320
330
3
4
0
350
360
3
7
0
3
8
0
3
9
0
4
0
0
4
1
0
4
2
0
4
3
0
4
4
0
4
5
0
4
6
0
4
7
0
4
8
0
3
6
0
3
7
0
3
8
0
390
4
0
0
4
1
0
4
2
0
430
4
3
0
370
380
390
400
410
4
2
0
4
2
0
4
1
0
4
0
0
390
380
360
370
380
390
400
410
420
4
3
0
4
1
0
4
2
0
Materials Company
POST -DEVELOPED
DRAINAGE AREAS
www.synterracorp.com
148 River Street, Suite 220Greenville, South Carolina 29601
864-421-9999
SHEET 1 OF 1
P:\V
ULC
AN
C
ON
ST
RU
CT
IO
N M
AT
ER
IA
LS
.963\18. F
AIR
FIE
LD
Q
UA
RR
Y\01.2019 M
IN
E M
AP
A
ME
ND
ME
NT
\D
WG
\9631801-M
IN
E LA
ND
U
SE
-R
EV
A
.D
WG
FAIRFIELD QUARRY
N. DAVIS
B. GREEN
1" = 300'02/14/2020 3/3/2020
A
FOR CLIENT REVIEW03/03/2020 CCN
NOTES:
1. BASE TOPOGRAPHY PROVIDED BY:
TUCK MAPPING SOLUTIONS
BIG STONE GAP, VIRGINIA
DATE OF PHOTOGRAPHY: JUNE 6, 2019
HYDROLOGIC POINT OF INTEREST
PRE-DEVELOPED DRAINAGE AREA
195.35 ACRES
POND 1 DRAINAGE AREA
10.33 ACRES
POND 2 DRAINAGE AREA
8.27 ACRES
POND 3 DRAINAGE AREA
13.27 ACRES
POND 4 DRAINAGE AREA
24.48 ACRES
POND 1
POND 3
POND 2
POND 4
OW-1
OW-2
AutoCAD SHX Text
MAGNETIC
AutoCAD SHX Text
REVISION
AutoCAD SHX Text
DWG. NO.
AutoCAD SHX Text
DIVISION
AutoCAD SHX Text
PROJ. NO.
AutoCAD SHX Text
THIS DRAWING IN DESIGN AND DETAIL IS THE PROPERTY OF VULCAN MATERIALS COMPANY AND MUST BE RETURNED UPON DEMAND. THIS DRAWING MUST NOT BE COPIED, REPRODUCED, OR USED WITHOUT PERMISSION.
AutoCAD SHX Text
FRACTIONAL: DECIMAL: ANGLE:
AutoCAD SHX Text
TOLERANCES-UNLESS NOTED
AutoCAD SHX Text
± 1/16" ± 0.010" ± 0.1°
Page 5
Existing (acre)
Pond 1 Pond 2 Pond 3 Pond 4 Total
Overburden (acre) 10.33 8.27 13.27 24.48 56.35
Offsite (acre) 139.00
Total (acre) 195.35
Storm Event
2-year, 24-hour
10-year, 24-hour
25-year, 24-hour
100-year, 24-hour
Storm Event
2-year, 24-hour
10-year, 24-hour
25-year, 24-hour
100-year, 24-hour
Pond 1 Pond 2 Pond 3 Pond 4
Bottom Elevation (ft) 386 372 332 328
Top Elevation (ft) 396 382 342 338
Depth (ft) 10 10 10 10
Full Pond Surface Area (acre) 0.560 0.381 0.640 2.455
Width (ft) 20.0 38.3 20.0 20.0
Elevation (ft) 395 381 341 337
Riser Height (ft) 8 8 8 8
Skimmer Diameter (in) 4 4 4 4
Orifice Elevation (ft) 388.5 374.5 334.0 330.0
Diameter (in) 24 24 24 24
Length (ft) 117 161 188 106
Minimum Slope (%) 1.7 1.2 1.06 1.9
Material RCP RCP RCP RCP
Pond Dimensions
Pond Riser
Pond Emergency Spillway
Pond Outlet Pipe
713.99
139.88
272.89
393.44
634.74
Hydrologic Point of Interest
Pond Parameters
Pre-Development Drainage Area
Post-Development Drainage Area
Pre-Development Flow Rates (cfs)
Post-Development Flow Rates (cfs)
195.35
Hydrologic Point of Interest
182.49
360.11
491.17
Page 6
ASDFASD
PTE
ESE
RTE
PBE
ESW
PD
PTAPBA
PLAN
NTS
PROFILE
NTS
3
1
OPS
OPL
25'
1
3
1
3
RIP-RAP
DIKE
OUTLET
PROTECTION
OPD
ABBREVATIONS
PTE POND TOP ELEVATION
ESE EMERGENCY SPILLWAY ELEVATION
RTE RISER TOP ELEVATION
PD POND DEPTH
PBE POND BOTTOM ELEVATION
ESW EMERGENCY SPILLWAY WIDTH
PBA POND BOTTOM AREA
PTA POND TOP AREA
OPL OUTLET PIPE LENGTH
OPS OUTLET PIPE SLOPE
OPD OUTLET PIPE DIAMETER
PONDS
PTE
ESE
RTE
PD
PBE
ESW
PBA
PTA
OPL
OPS
1 2
396.0' 382.0'
395.0' 381.0'
394.0'380.0'
10' 10'
386.0' 372.0'
20' 38.3'
0.156 ac0.103 ac
0.560 ac0.381 ac
117' 161'
1.7% 1.2%
RISERS
1
4" SKIMMER388.5'
OPD 24" 24"
2
374.5' 4" SKIMMER
3 4
342.0' 338.0'
341.0' 337.0'
340.0'336.0'
10' 10'
332.0' 328.0'
20' 20'
1.387 ac
2.455 ac
188' 106'
1.06% 1.90%
24" 24"
0.200 ac
0.640 ac
3
4" SKIMMER334.0'
4
330.0' 4" SKIMMER
VULCAN QUARRIES - FAIRFIELD
POND GENERAL CONSTRUCTION GUIDELINES
AutoCAD SHX Text
POND TOP ELEVATION
Page 7
Vulcan Fairfield Quarry
Pre-development Calculations
2-year 24-hour Storm Event
3.5 inches
N. Davis
Filename: Pre-Developed.sc4 Printed 02-13-2020
SEDCAD 4 for WindowsCopyright 1998 -2010 Pamela J. SchwabCivil Software Design, LLC 1
Page 8
General Information
Storm Information:Storm Type: NRCS Type II
Design Storm: 2 yr - 24 hr
Rainfall Depth: 3.500 inches
Filename: Pre-Developed.sc4 Printed 02-13-2020
SEDCAD 4 for WindowsCopyright 1998 -2010 Pamela J. SchwabCivil Software Design, LLC 2
Page 9
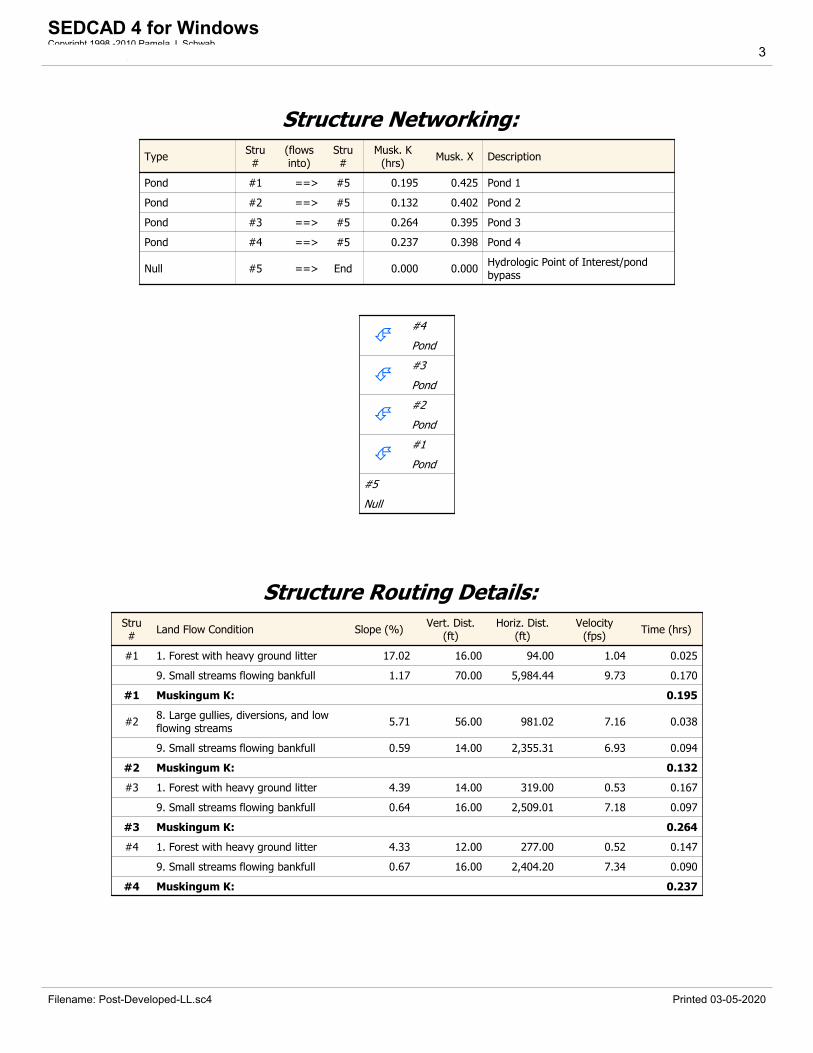
Structure Networking:
TypeStru#
(flowsinto)
Stru#
Musk. K(hrs)
Musk. X Description
Null #1 ==> End 0.000 0.000 Hydrologic Point of Interest
#1
Null
Filename: Pre-Developed.sc4 Printed 02-13-2020
SEDCAD 4 for WindowsCopyright 1998 -2010 Pamela J. SchwabCivil Software Design, LLC 3
Page 10
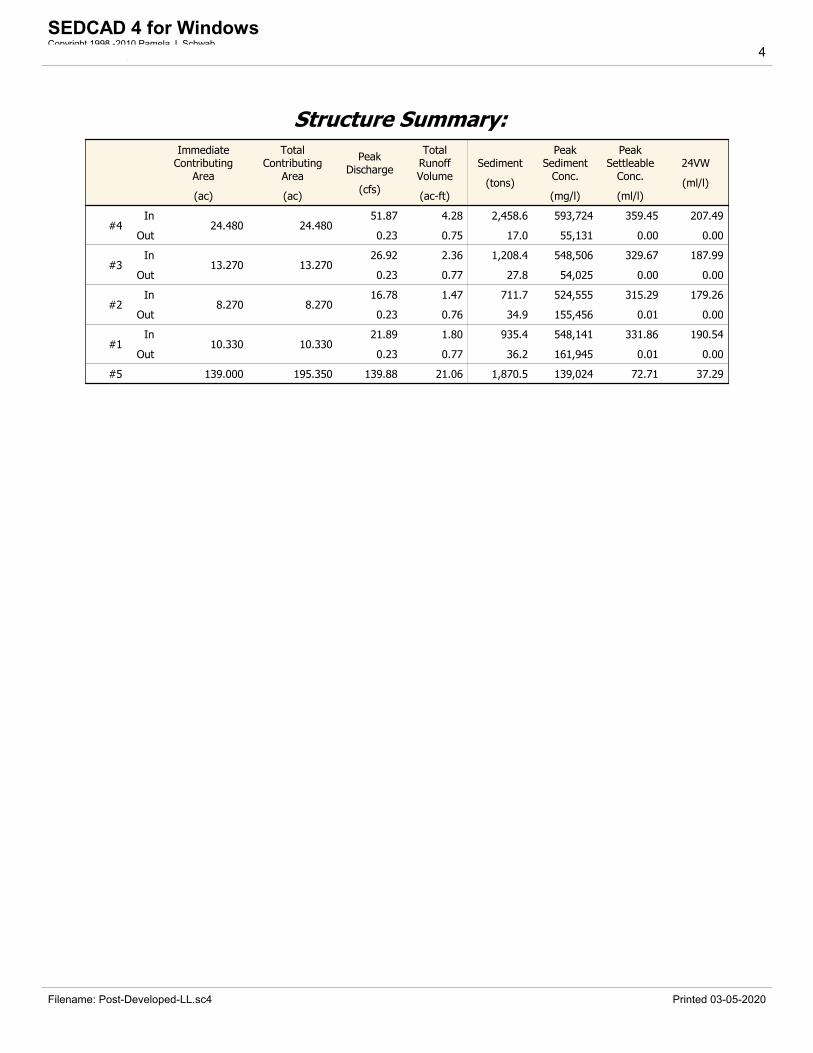
Structure Summary:Immediate
ContributingArea
(ac)
TotalContributing
Area
(ac)
PeakDischarge
(cfs)
TotalRunoffVolume
(ac-ft)
#1 195.350 195.350 182.49 22.10
Filename: Pre-Developed.sc4 Printed 02-13-2020
SEDCAD 4 for WindowsCopyright 1998 -2010 Pamela J. SchwabCivil Software Design, LLC 4
Page 11
Structure Detail:
Structure #1 (Null)
Hydrologic Point of Interest
Filename: Pre-Developed.sc4 Printed 02-13-2020
SEDCAD 4 for WindowsCopyright 1998 -2010 Pamela J. SchwabCivil Software Design, LLC 5
Page 12
Subwatershed Hydrology Detail:
Stru#
SWS#
SWS Area
(ac)
Time ofConc
(hrs)
Musk K
(hrs)Musk X
Curve
NumberUHS
PeakDischarge
(cfs)
RunoffVolume
(ac-ft)
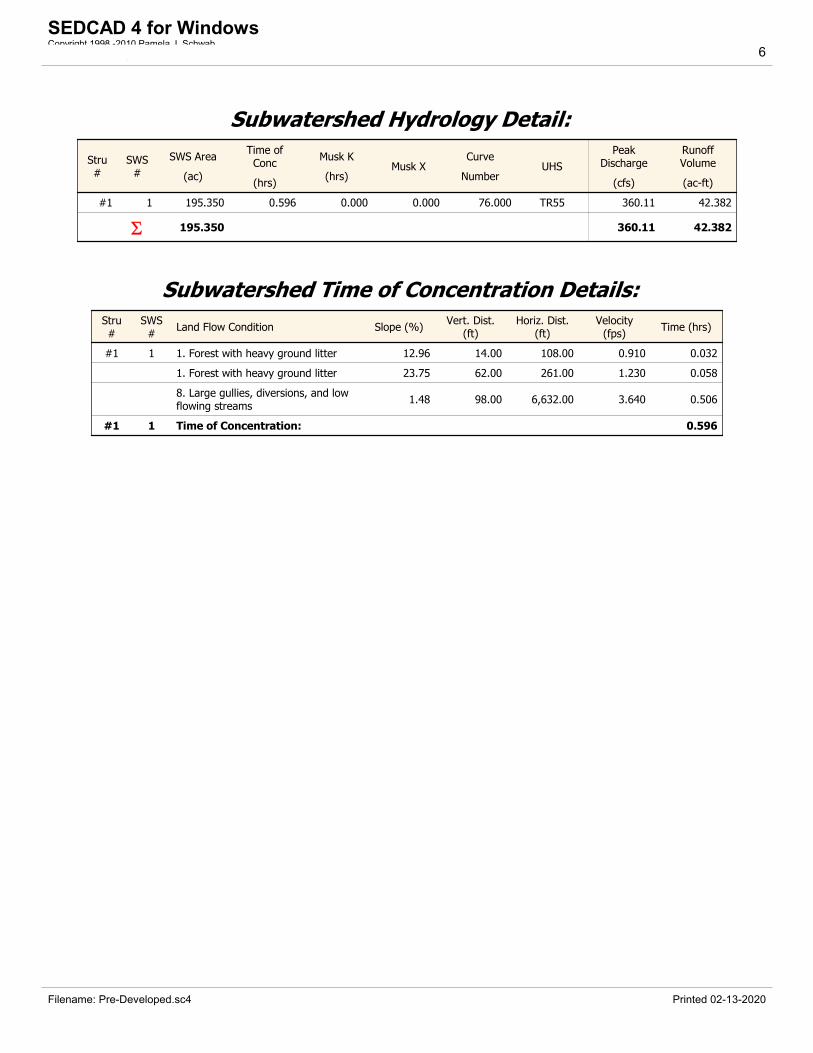
#1 1 195.350 0.596 0.000 0.000 76.000 TR55 182.49 22.102
195.350 182.49 22.102
Subwatershed Time of Concentration Details:Stru#
SWS#
Land Flow Condition Slope (%)Vert. Dist.
(ft)Horiz. Dist.
(ft)Velocity
(fps)Time (hrs)
#1 1 1. Forest with heavy ground litter 12.96 14.00 108.00 0.910 0.032
1. Forest with heavy ground litter 23.75 62.00 261.00 1.230 0.058
8. Large gullies, diversions, and lowflowing streams
1.48 98.00 6,632.00 3.640 0.506
#1 1 Time of Concentration: 0.596
Filename: Pre-Developed.sc4 Printed 02-13-2020
SEDCAD 4 for WindowsCopyright 1998 -2010 Pamela J. SchwabCivil Software Design, LLC 6
Page 13
Vulcan Fairfield Quarry
Post-development Calculations
2-year 24-hour Storm Event
3.5 inches
N. Davis
Filename: Post-Developed-LL.sc4 Printed 03-05-2020
SEDCAD 4 for WindowsCopyright 1998 -2010 Pamela J. SchwabCivil Software Design, LLC 1
Page 14
General Information
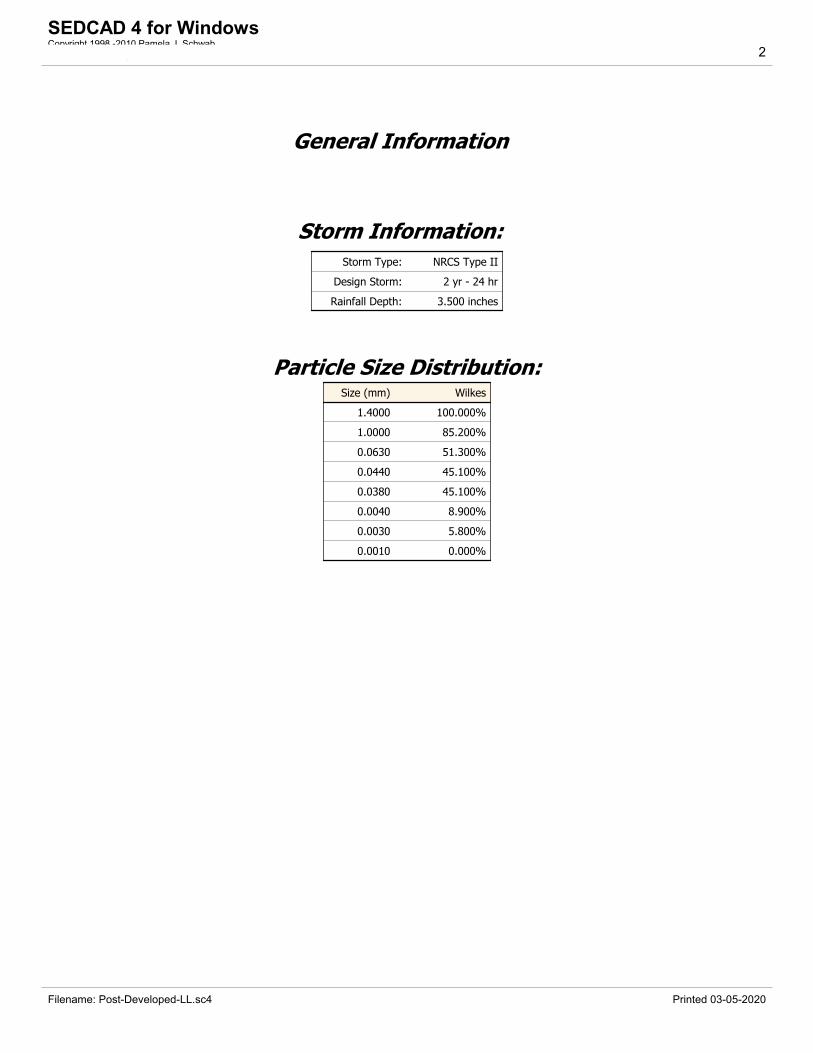
Storm Information:Storm Type: NRCS Type II
Design Storm: 2 yr - 24 hr
Rainfall Depth: 3.500 inches
Particle Size Distribution:Size (mm) Wilkes
1.4000 100.000%
1.0000 85.200%
0.0630 51.300%
0.0440 45.100%
0.0380 45.100%
0.0040 8.900%
0.0030 5.800%
0.0010 0.000%
Filename: Post-Developed-LL.sc4 Printed 03-05-2020
SEDCAD 4 for WindowsCopyright 1998 -2010 Pamela J. SchwabCivil Software Design, LLC 2
Page 15
Structure Networking:
TypeStru#
(flowsinto)
Stru#
Musk. K(hrs)
Musk. X Description
Pond #1 ==> #5 0.195 0.425 Pond 1
Pond #2 ==> #5 0.132 0.402 Pond 2
Pond #3 ==> #5 0.264 0.395 Pond 3
Pond #4 ==> #5 0.237 0.398 Pond 4
Null #5 ==> End 0.000 0.000Hydrologic Point of Interest/pondbypass
#4
Pond
#3
Pond
#2
Pond
#1
Pond
#5
Null
Structure Routing Details:Stru#
Land Flow Condition Slope (%)Vert. Dist.
(ft)Horiz. Dist.
(ft)Velocity
(fps)Time (hrs)
#1 1. Forest with heavy ground litter 17.02 16.00 94.00 1.04 0.025
9. Small streams flowing bankfull 1.17 70.00 5,984.44 9.73 0.170
#1 Muskingum K: 0.195
#28. Large gullies, diversions, and lowflowing streams
5.71 56.00 981.02 7.16 0.038
9. Small streams flowing bankfull 0.59 14.00 2,355.31 6.93 0.094
#2 Muskingum K: 0.132
#3 1. Forest with heavy ground litter 4.39 14.00 319.00 0.53 0.167
9. Small streams flowing bankfull 0.64 16.00 2,509.01 7.18 0.097
#3 Muskingum K: 0.264
#4 1. Forest with heavy ground litter 4.33 12.00 277.00 0.52 0.147
9. Small streams flowing bankfull 0.67 16.00 2,404.20 7.34 0.090
#4 Muskingum K: 0.237
Filename: Post-Developed-LL.sc4 Printed 03-05-2020
SEDCAD 4 for WindowsCopyright 1998 -2010 Pamela J. SchwabCivil Software Design, LLC 3
Page 16
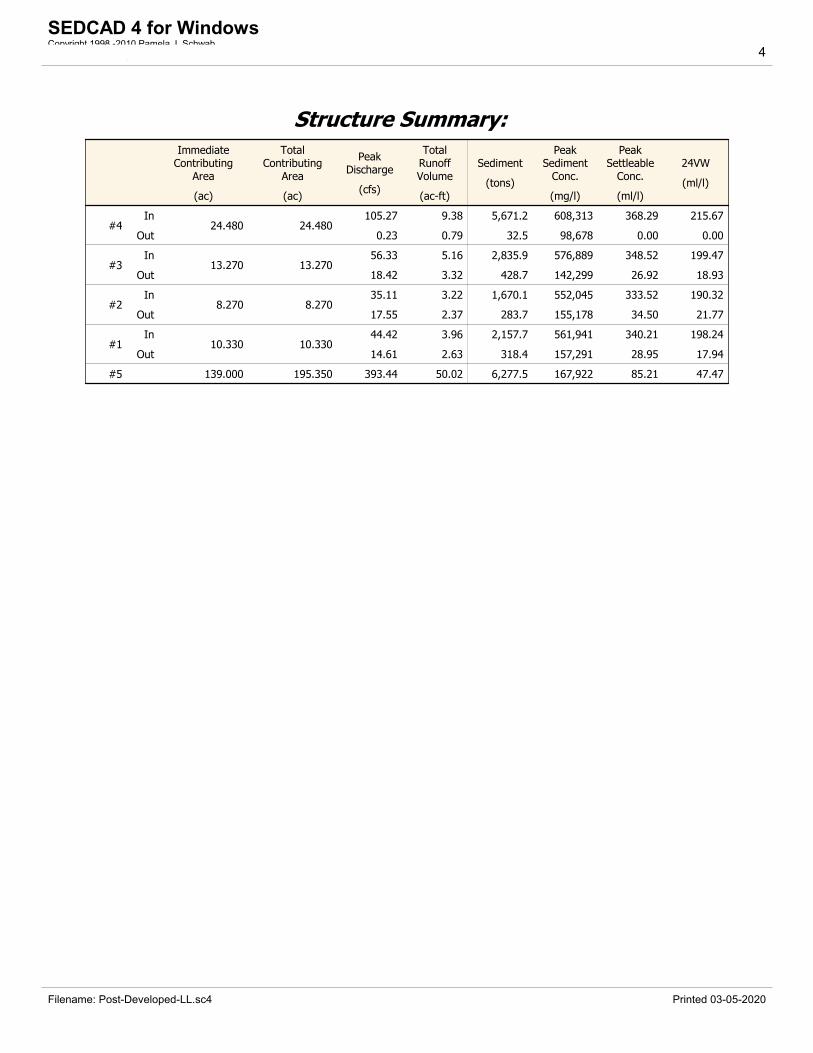
Structure Summary:Immediate
ContributingArea
(ac)
TotalContributing
Area
(ac)
PeakDischarge
(cfs)
TotalRunoffVolume
(ac-ft)
Sediment
(tons)
PeakSediment
Conc.
(mg/l)
PeakSettleable
Conc.
(ml/l)
24VW
(ml/l)
#4In
Out24.480 24.480
51.87
0.23
4.28
0.75
2,458.6
17.0
593,724
55,131
359.45
0.00
207.49
0.00
#3In
Out13.270 13.270
26.92
0.23
2.36
0.77
1,208.4
27.8
548,506
54,025
329.67
0.00
187.99
0.00
#2In
Out8.270 8.270
16.78
0.23
1.47
0.76
711.7
34.9
524,555
155,456
315.29
0.01
179.26
0.00
#1In
Out10.330 10.330
21.89
0.23
1.80
0.77
935.4
36.2
548,141
161,945
331.86
0.01
190.54
0.00
#5 139.000 195.350 139.88 21.06 1,870.5 139,024 72.71 37.29
Filename: Post-Developed-LL.sc4 Printed 03-05-2020
SEDCAD 4 for WindowsCopyright 1998 -2010 Pamela J. SchwabCivil Software Design, LLC 4
Page 17
Particle Size Distribution(s) at Each Structure
Structure #4 (Pond 4):Size (mm) In Out
1.4000 100.000% 100.000%
1.0000 85.200% 100.000%
0.0630 51.300% 100.000%
0.0440 45.100% 100.000%
0.0380 45.100% 100.000%
0.0040 8.900% 100.000%
0.0030 5.800% 100.000%
0.0010 0.000% 0.000%
Structure #3 (Pond 3):Size (mm) In Out
1.4000 100.000% 100.000%
1.0000 87.307% 100.000%
0.0630 52.569% 100.000%
0.0440 46.216% 100.000%
0.0380 46.216% 100.000%
0.0040 9.120% 100.000%
0.0030 5.943% 100.000%
0.0010 0.000% 0.000%
Structure #2 (Pond 2):Size (mm) In Out
1.4000 100.000% 100.000%
1.0000 87.297% 100.000%
0.0630 52.563% 100.000%
0.0440 46.210% 100.000%
0.0380 46.210% 100.000%
0.0040 9.119% 100.000%
0.0030 5.943% 100.000%
0.0010 0.000% 0.000%
Filename: Post-Developed-LL.sc4 Printed 03-05-2020
SEDCAD 4 for WindowsCopyright 1998 -2010 Pamela J. SchwabCivil Software Design, LLC 5
Page 18
Structure #1 (Pond 1):Size (mm) In Out
1.4000 100.000% 100.000%
1.0000 85.200% 100.000%
0.0630 51.300% 100.000%
0.0440 45.100% 100.000%
0.0380 45.100% 100.000%
0.0040 8.900% 100.000%
0.0030 5.800% 100.000%
0.0010 0.000% 0.000%
Structure #5:Size (mm) In/Out
1.4000 100.000%
1.0000 100.000%
0.0630 67.010%
0.0440 59.659%
0.0380 59.659%
0.0040 16.744%
0.0030 13.069%
0.0010 0.000%
Filename: Post-Developed-LL.sc4 Printed 03-05-2020
SEDCAD 4 for WindowsCopyright 1998 -2010 Pamela J. SchwabCivil Software Design, LLC 6
Page 19
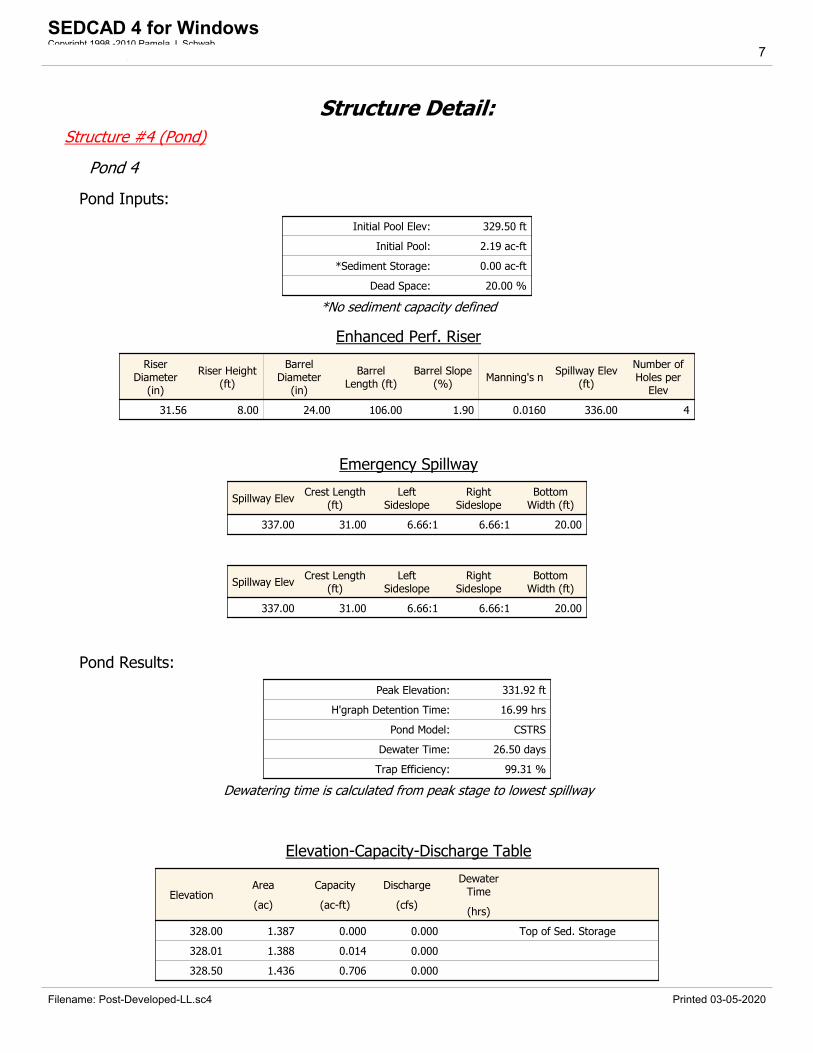
Structure Detail:Structure #4 (Pond)
Pond 4
Pond Inputs:
Initial Pool Elev: 329.50 ft
Initial Pool: 2.19 ac-ft
*Sediment Storage: 0.00 ac-ft
Dead Space: 20.00 %
*No sediment capacity defined
Enhanced Perf. Riser
RiserDiameter
(in)
Riser Height(ft)
BarrelDiameter
(in)
BarrelLength (ft)
Barrel Slope(%)
Manning's nSpillway Elev
(ft)
Number ofHoles per
Elev
31.56 8.00 24.00 106.00 1.90 0.0160 336.00 4
Emergency Spillway
Spillway ElevCrest Length
(ft)Left
SideslopeRight
SideslopeBottom
Width (ft)
337.00 31.00 6.66:1 6.66:1 20.00
Spillway ElevCrest Length
(ft)Left
SideslopeRight
SideslopeBottom
Width (ft)
337.00 31.00 6.66:1 6.66:1 20.00
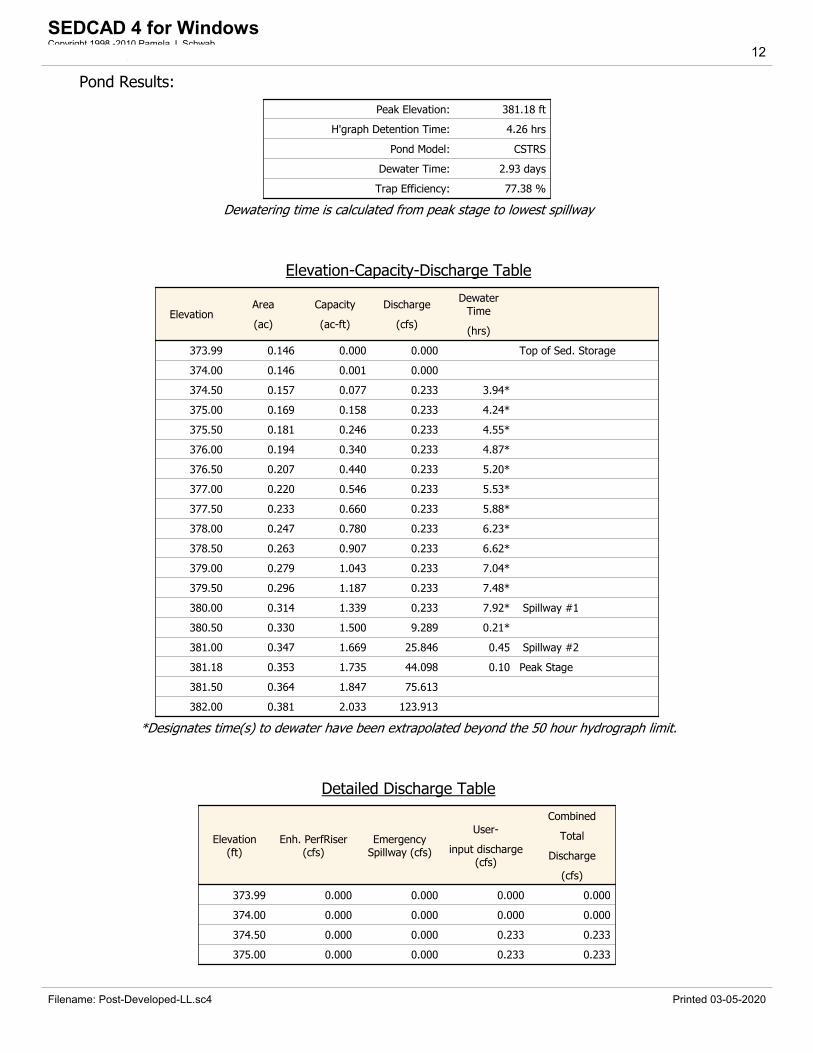
Pond Results:
Peak Elevation: 331.92 ft
H'graph Detention Time: 16.99 hrs
Pond Model: CSTRS
Dewater Time: 26.50 days
Trap Efficiency: 99.31 %
Dewatering time is calculated from peak stage to lowest spillway
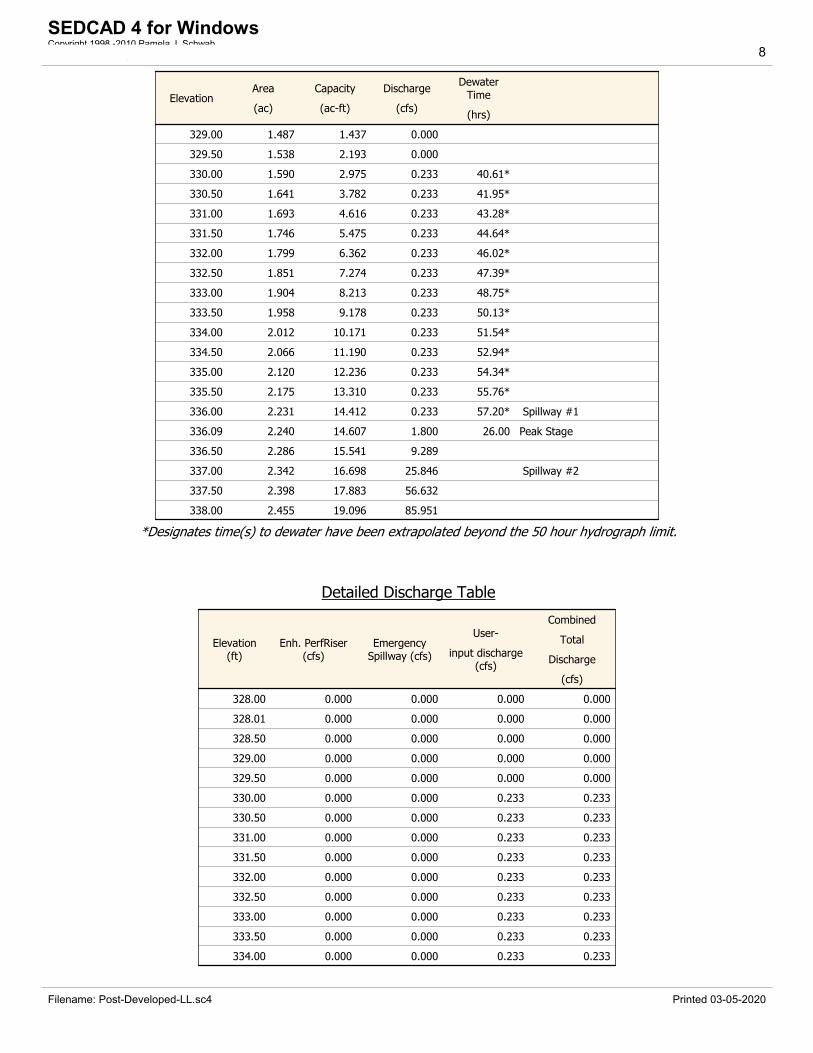
Elevation-Capacity-Discharge Table
ElevationArea
(ac)
Capacity
(ac-ft)
Discharge
(cfs)
DewaterTime
(hrs)
328.00 1.387 0.000 0.000 Top of Sed. Storage
328.01 1.388 0.014 0.000
328.50 1.436 0.706 0.000
Filename: Post-Developed-LL.sc4 Printed 03-05-2020
SEDCAD 4 for WindowsCopyright 1998 -2010 Pamela J. SchwabCivil Software Design, LLC 7
Page 20
ElevationArea
(ac)
Capacity
(ac-ft)
Discharge
(cfs)
DewaterTime
(hrs)
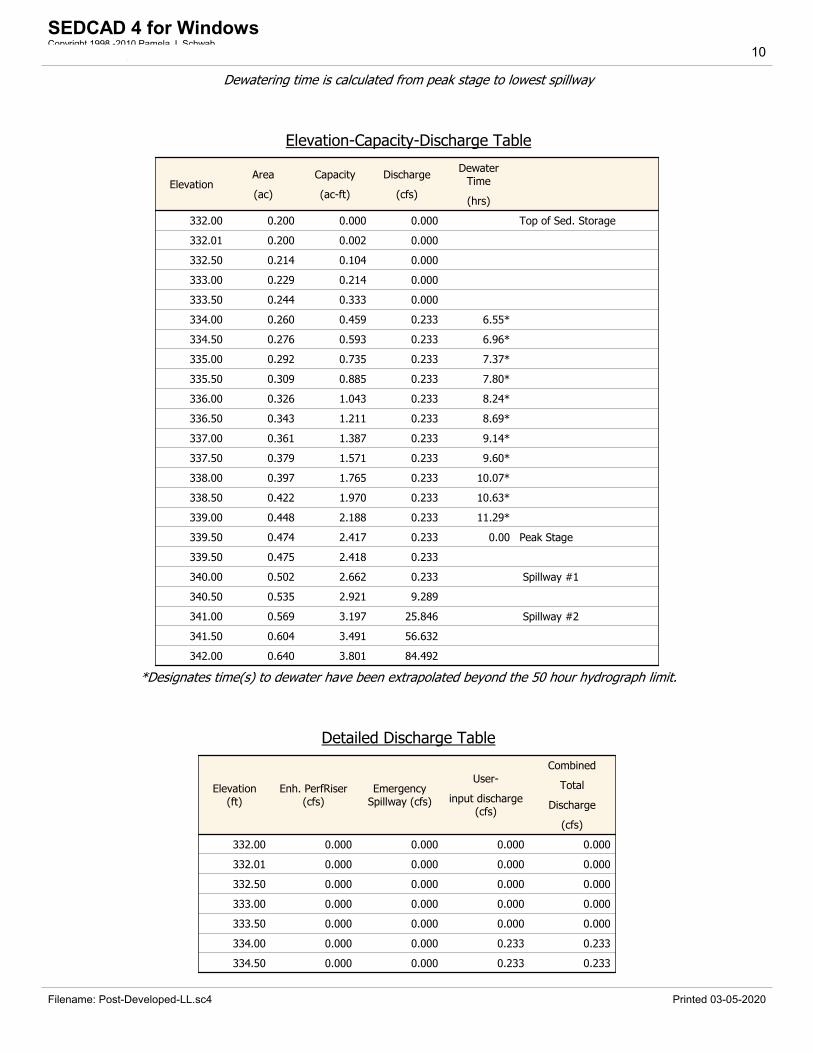
329.00 1.487 1.437 0.000
329.50 1.538 2.193 0.000
330.00 1.590 2.975 0.233 40.61*
330.50 1.641 3.782 0.233 41.95*
331.00 1.693 4.616 0.233 43.28*
331.50 1.746 5.475 0.233 44.64*
331.92 1.790 6.218 0.233 0.00 Peak Stage
332.00 1.799 6.362 0.233
332.50 1.851 7.274 0.233
333.00 1.904 8.213 0.233
333.50 1.958 9.178 0.233
334.00 2.012 10.171 0.233
334.50 2.066 11.190 0.233
335.00 2.120 12.236 0.233
335.50 2.175 13.310 0.233
336.00 2.231 14.412 0.233 Spillway #1
336.50 2.286 15.541 9.289
337.00 2.342 16.698 25.846 Spillway #2
337.50 2.398 17.883 56.632
338.00 2.455 19.096 85.951
*Designates time(s) to dewater have been extrapolated beyond the 50 hour hydrograph limit.
Detailed Discharge Table
Elevation(ft)
Enh. PerfRiser(cfs)
EmergencySpillway (cfs)
User-
input discharge(cfs)
Combined
Total
Discharge
(cfs)
328.00 0.000 0.000 0.000 0.000
328.01 0.000 0.000 0.000 0.000
328.50 0.000 0.000 0.000 0.000
329.00 0.000 0.000 0.000 0.000
329.50 0.000 0.000 0.000 0.000
330.00 0.000 0.000 0.233 0.233
330.50 0.000 0.000 0.233 0.233
331.00 0.000 0.000 0.233 0.233
331.50 0.000 0.000 0.233 0.233
332.00 0.000 0.000 0.233 0.233
332.50 0.000 0.000 0.233 0.233
333.00 0.000 0.000 0.233 0.233
333.50 0.000 0.000 0.233 0.233
334.00 0.000 0.000 0.233 0.233
Filename: Post-Developed-LL.sc4 Printed 03-05-2020
SEDCAD 4 for WindowsCopyright 1998 -2010 Pamela J. SchwabCivil Software Design, LLC 8
Page 21
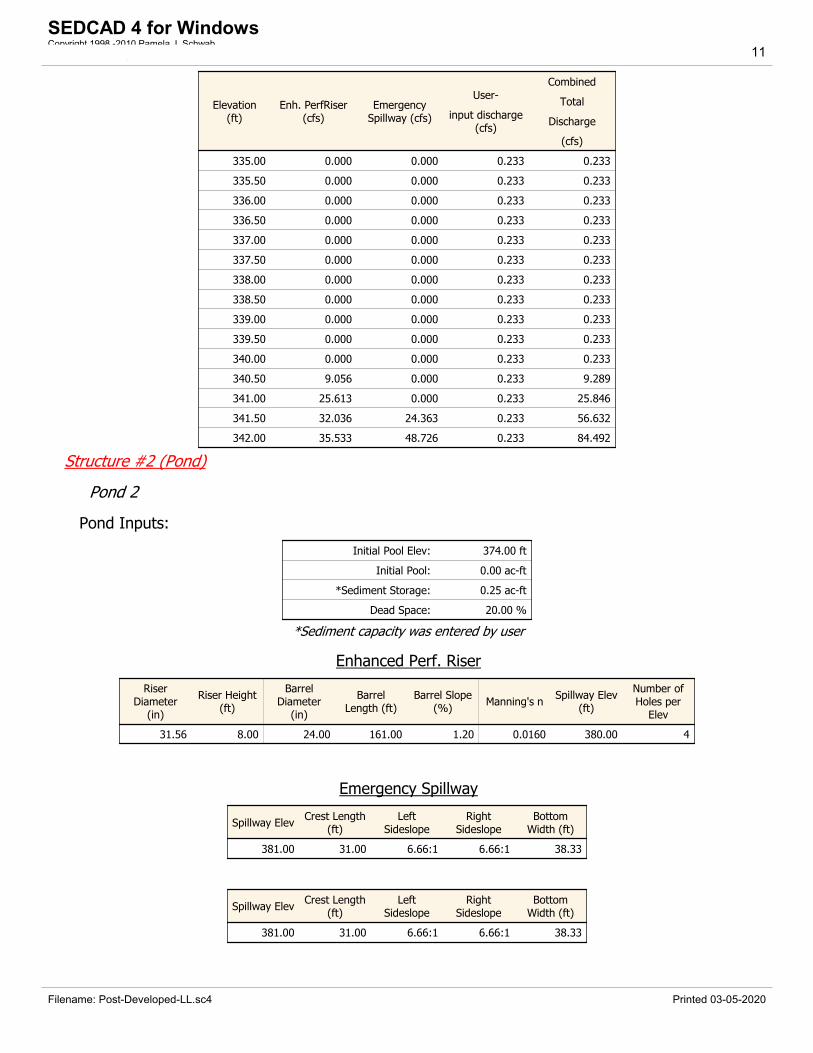
Elevation(ft)
Enh. PerfRiser(cfs)
EmergencySpillway (cfs)
User-
input discharge(cfs)
Combined
Total
Discharge
(cfs)
334.50 0.000 0.000 0.233 0.233
335.00 0.000 0.000 0.233 0.233
335.50 0.000 0.000 0.233 0.233
336.00 0.000 0.000 0.233 0.233
336.50 9.056 0.000 0.233 9.289
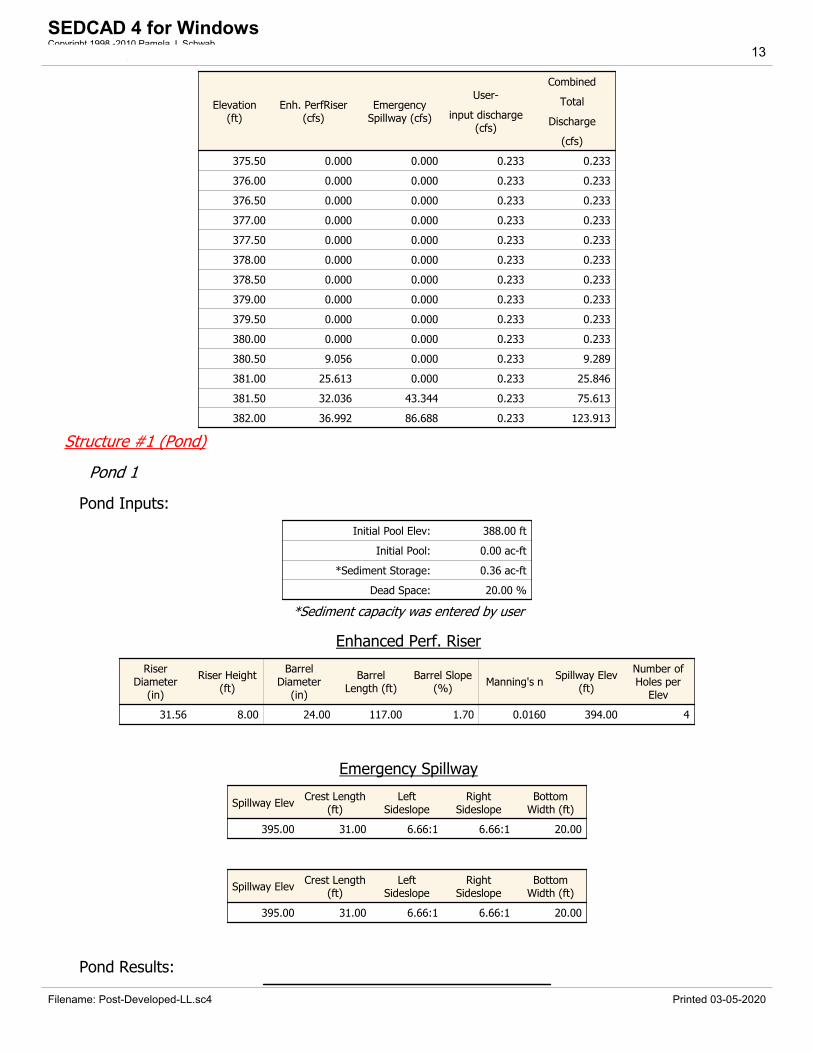
337.00 25.613 0.000 0.233 25.846
337.50 32.036 24.363 0.233 56.632
338.00 36.992 48.726 0.233 85.951
Structure #3 (Pond)
Pond 3
Pond Inputs:
Initial Pool Elev: 333.50 ft
Initial Pool: 0.33 ac-ft
*Sediment Storage: 0.00 ac-ft
Dead Space: 20.00 %
*No sediment capacity defined
Enhanced Perf. Riser
RiserDiameter
(in)
Riser Height(ft)
BarrelDiameter
(in)
BarrelLength (ft)
Barrel Slope(%)
Manning's nSpillway Elev
(ft)
Number ofHoles per
Elev
31.56 8.00 24.00 188.00 1.06 0.0160 340.00 4
Emergency Spillway
Spillway ElevCrest Length
(ft)Left
SideslopeRight
SideslopeBottom
Width (ft)
341.00 31.00 6.66:1 6.66:1 20.00
Spillway ElevCrest Length
(ft)Left
SideslopeRight
SideslopeBottom
Width (ft)
341.00 31.00 6.66:1 6.66:1 20.00
Pond Results:
Peak Elevation: 339.50 ft
H'graph Detention Time: 16.40 hrs
Pond Model: CSTRS
Dewater Time: 5.05 days
Trap Efficiency: 97.70 %
Filename: Post-Developed-LL.sc4 Printed 03-05-2020
SEDCAD 4 for WindowsCopyright 1998 -2010 Pamela J. SchwabCivil Software Design, LLC 9
Page 22
Dewatering time is calculated from peak stage to lowest spillway
Elevation-Capacity-Discharge Table
ElevationArea
(ac)
Capacity
(ac-ft)
Discharge
(cfs)
DewaterTime
(hrs)
332.00 0.200 0.000 0.000 Top of Sed. Storage
332.01 0.200 0.002 0.000
332.50 0.214 0.104 0.000
333.00 0.229 0.214 0.000
333.50 0.244 0.333 0.000
334.00 0.260 0.459 0.233 6.55*
334.50 0.276 0.593 0.233 6.96*
335.00 0.292 0.735 0.233 7.37*
335.50 0.309 0.885 0.233 7.80*
336.00 0.326 1.043 0.233 8.24*
336.50 0.343 1.211 0.233 8.69*
337.00 0.361 1.387 0.233 9.14*
337.50 0.379 1.571 0.233 9.60*
338.00 0.397 1.765 0.233 10.07*
338.50 0.422 1.970 0.233 10.63*
339.00 0.448 2.188 0.233 11.29*
339.50 0.474 2.417 0.233 0.00 Peak Stage
339.50 0.475 2.418 0.233
340.00 0.502 2.662 0.233 Spillway #1
340.50 0.535 2.921 9.289
341.00 0.569 3.197 25.846 Spillway #2
341.50 0.604 3.491 56.632
342.00 0.640 3.801 84.492
*Designates time(s) to dewater have been extrapolated beyond the 50 hour hydrograph limit.
Detailed Discharge Table
Elevation(ft)
Enh. PerfRiser(cfs)
EmergencySpillway (cfs)
User-
input discharge(cfs)
Combined
Total
Discharge
(cfs)
332.00 0.000 0.000 0.000 0.000
332.01 0.000 0.000 0.000 0.000
332.50 0.000 0.000 0.000 0.000
333.00 0.000 0.000 0.000 0.000
333.50 0.000 0.000 0.000 0.000
334.00 0.000 0.000 0.233 0.233
334.50 0.000 0.000 0.233 0.233
Filename: Post-Developed-LL.sc4 Printed 03-05-2020
SEDCAD 4 for WindowsCopyright 1998 -2010 Pamela J. SchwabCivil Software Design, LLC 10
Page 23
Elevation(ft)
Enh. PerfRiser(cfs)
EmergencySpillway (cfs)
User-
input discharge(cfs)
Combined
Total
Discharge
(cfs)
335.00 0.000 0.000 0.233 0.233
335.50 0.000 0.000 0.233 0.233
336.00 0.000 0.000 0.233 0.233
336.50 0.000 0.000 0.233 0.233
337.00 0.000 0.000 0.233 0.233
337.50 0.000 0.000 0.233 0.233
338.00 0.000 0.000 0.233 0.233
338.50 0.000 0.000 0.233 0.233
339.00 0.000 0.000 0.233 0.233
339.50 0.000 0.000 0.233 0.233
340.00 0.000 0.000 0.233 0.233
340.50 9.056 0.000 0.233 9.289
341.00 25.613 0.000 0.233 25.846
341.50 32.036 24.363 0.233 56.632
342.00 35.533 48.726 0.233 84.492
Structure #2 (Pond)
Pond 2
Pond Inputs:
Initial Pool Elev: 374.00 ft
Initial Pool: 0.00 ac-ft
*Sediment Storage: 0.25 ac-ft
Dead Space: 20.00 %
*Sediment capacity was entered by user
Enhanced Perf. Riser
RiserDiameter
(in)
Riser Height(ft)
BarrelDiameter
(in)
BarrelLength (ft)
Barrel Slope(%)
Manning's nSpillway Elev
(ft)
Number ofHoles per
Elev
31.56 8.00 24.00 161.00 1.20 0.0160 380.00 4
Emergency Spillway
Spillway ElevCrest Length
(ft)Left
SideslopeRight
SideslopeBottom
Width (ft)
381.00 31.00 6.66:1 6.66:1 38.33
Spillway ElevCrest Length
(ft)Left
SideslopeRight
SideslopeBottom
Width (ft)
381.00 31.00 6.66:1 6.66:1 38.33
Filename: Post-Developed-LL.sc4 Printed 03-05-2020
SEDCAD 4 for WindowsCopyright 1998 -2010 Pamela J. SchwabCivil Software Design, LLC 11
Page 24
Pond Results:
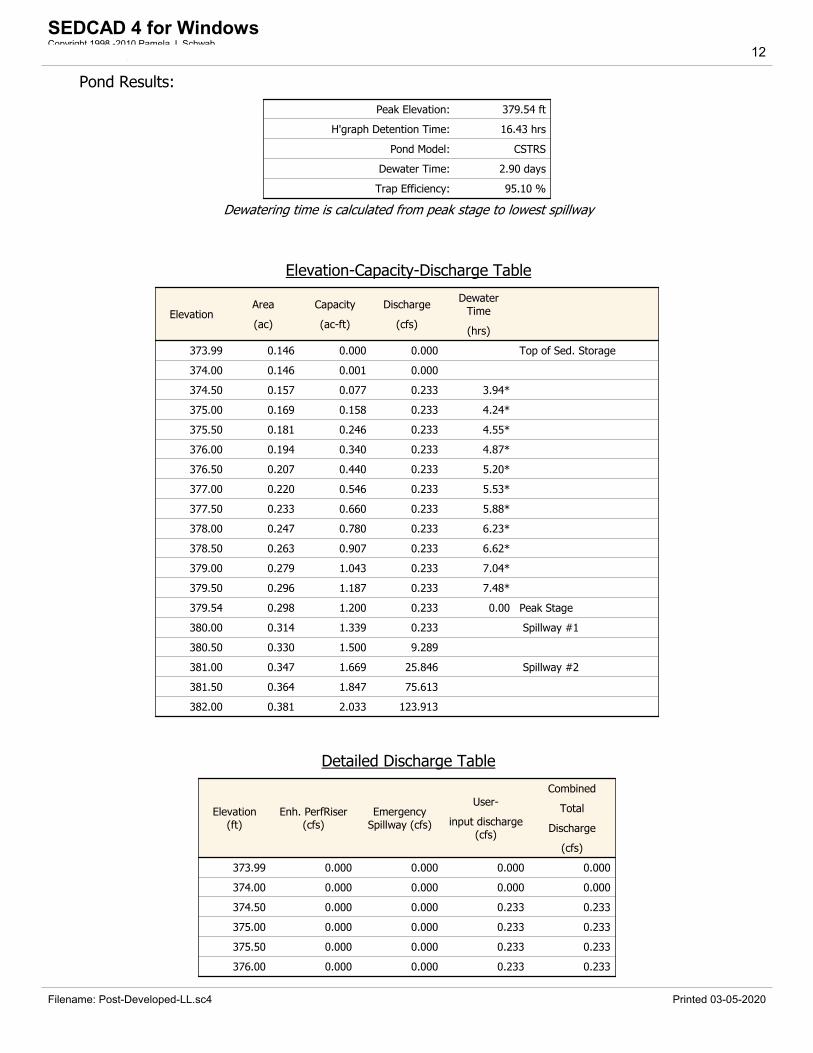
Peak Elevation: 379.54 ft
H'graph Detention Time: 16.43 hrs
Pond Model: CSTRS
Dewater Time: 2.90 days
Trap Efficiency: 95.10 %
Dewatering time is calculated from peak stage to lowest spillway
Elevation-Capacity-Discharge Table
ElevationArea
(ac)
Capacity
(ac-ft)
Discharge
(cfs)
DewaterTime
(hrs)
373.99 0.146 0.000 0.000 Top of Sed. Storage
374.00 0.146 0.001 0.000
374.50 0.157 0.077 0.233 3.94*
375.00 0.169 0.158 0.233 4.24*
375.50 0.181 0.246 0.233 4.55*
376.00 0.194 0.340 0.233 4.87*
376.50 0.207 0.440 0.233 5.20*
377.00 0.220 0.546 0.233 5.53*
377.50 0.233 0.660 0.233 5.88*
378.00 0.247 0.780 0.233 6.23*
378.50 0.263 0.907 0.233 6.62*
379.00 0.279 1.043 0.233 7.04*
379.50 0.296 1.187 0.233 7.48*
379.54 0.298 1.200 0.233 0.00 Peak Stage
380.00 0.314 1.339 0.233 Spillway #1
380.50 0.330 1.500 9.289
381.00 0.347 1.669 25.846 Spillway #2
381.50 0.364 1.847 75.613
382.00 0.381 2.033 123.913
Detailed Discharge Table
Elevation(ft)
Enh. PerfRiser(cfs)
EmergencySpillway (cfs)
User-
input discharge(cfs)
Combined
Total
Discharge
(cfs)
373.99 0.000 0.000 0.000 0.000
374.00 0.000 0.000 0.000 0.000
374.50 0.000 0.000 0.233 0.233
375.00 0.000 0.000 0.233 0.233
375.50 0.000 0.000 0.233 0.233
376.00 0.000 0.000 0.233 0.233
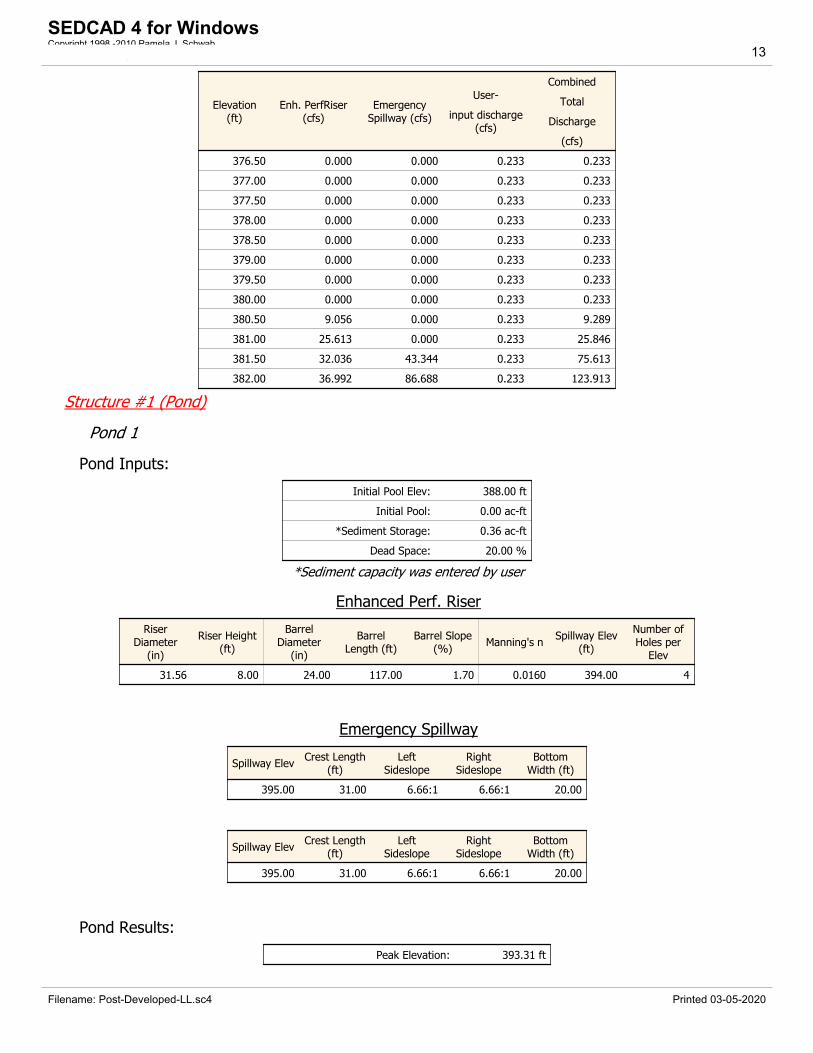
Filename: Post-Developed-LL.sc4 Printed 03-05-2020
SEDCAD 4 for WindowsCopyright 1998 -2010 Pamela J. SchwabCivil Software Design, LLC 12
Page 25
Elevation(ft)
Enh. PerfRiser(cfs)
EmergencySpillway (cfs)
User-
input discharge(cfs)
Combined
Total
Discharge
(cfs)
376.50 0.000 0.000 0.233 0.233
377.00 0.000 0.000 0.233 0.233
377.50 0.000 0.000 0.233 0.233
378.00 0.000 0.000 0.233 0.233
378.50 0.000 0.000 0.233 0.233
379.00 0.000 0.000 0.233 0.233
379.50 0.000 0.000 0.233 0.233
380.00 0.000 0.000 0.233 0.233
380.50 9.056 0.000 0.233 9.289
381.00 25.613 0.000 0.233 25.846
381.50 32.036 43.344 0.233 75.613
382.00 36.992 86.688 0.233 123.913
Structure #1 (Pond)
Pond 1
Pond Inputs:
Initial Pool Elev: 388.00 ft
Initial Pool: 0.00 ac-ft
*Sediment Storage: 0.36 ac-ft
Dead Space: 20.00 %
*Sediment capacity was entered by user
Enhanced Perf. Riser
RiserDiameter
(in)
Riser Height(ft)
BarrelDiameter
(in)
BarrelLength (ft)
Barrel Slope(%)
Manning's nSpillway Elev
(ft)
Number ofHoles per
Elev
31.56 8.00 24.00 117.00 1.70 0.0160 394.00 4
Emergency Spillway
Spillway ElevCrest Length
(ft)Left
SideslopeRight
SideslopeBottom
Width (ft)
395.00 31.00 6.66:1 6.66:1 20.00
Spillway ElevCrest Length
(ft)Left
SideslopeRight
SideslopeBottom
Width (ft)
395.00 31.00 6.66:1 6.66:1 20.00
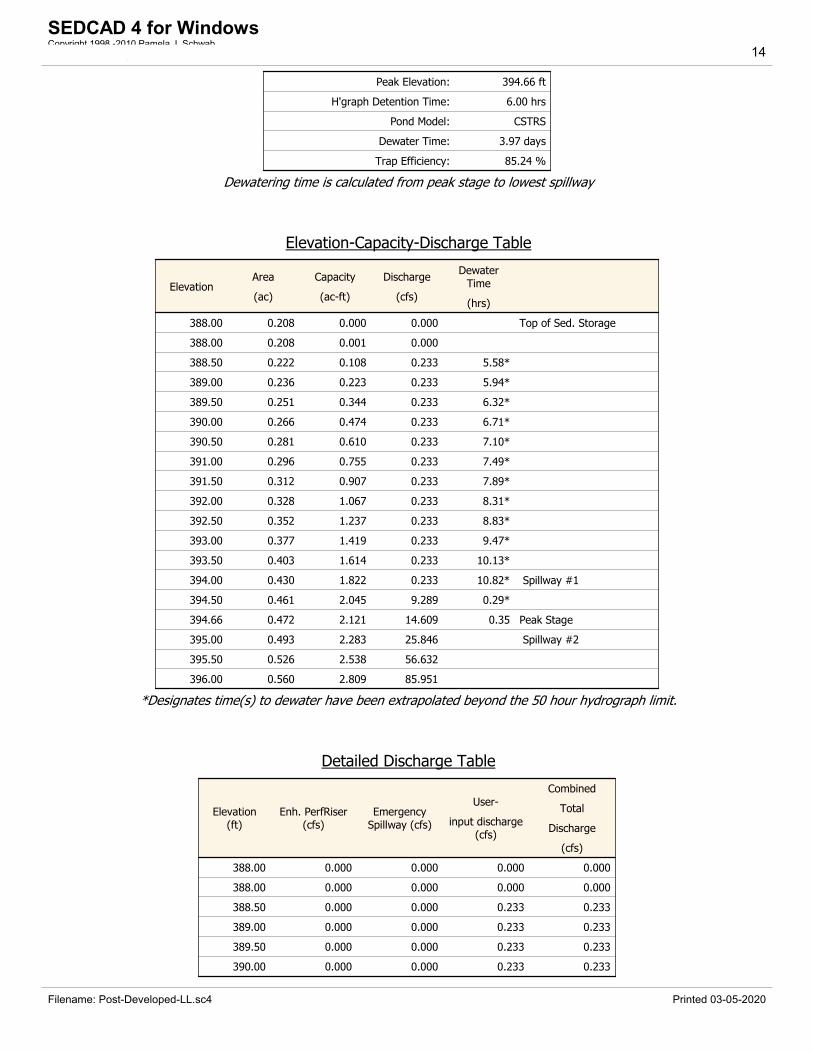
Pond Results:
Peak Elevation: 393.31 ft
Filename: Post-Developed-LL.sc4 Printed 03-05-2020
SEDCAD 4 for WindowsCopyright 1998 -2010 Pamela J. SchwabCivil Software Design, LLC 13
Page 26
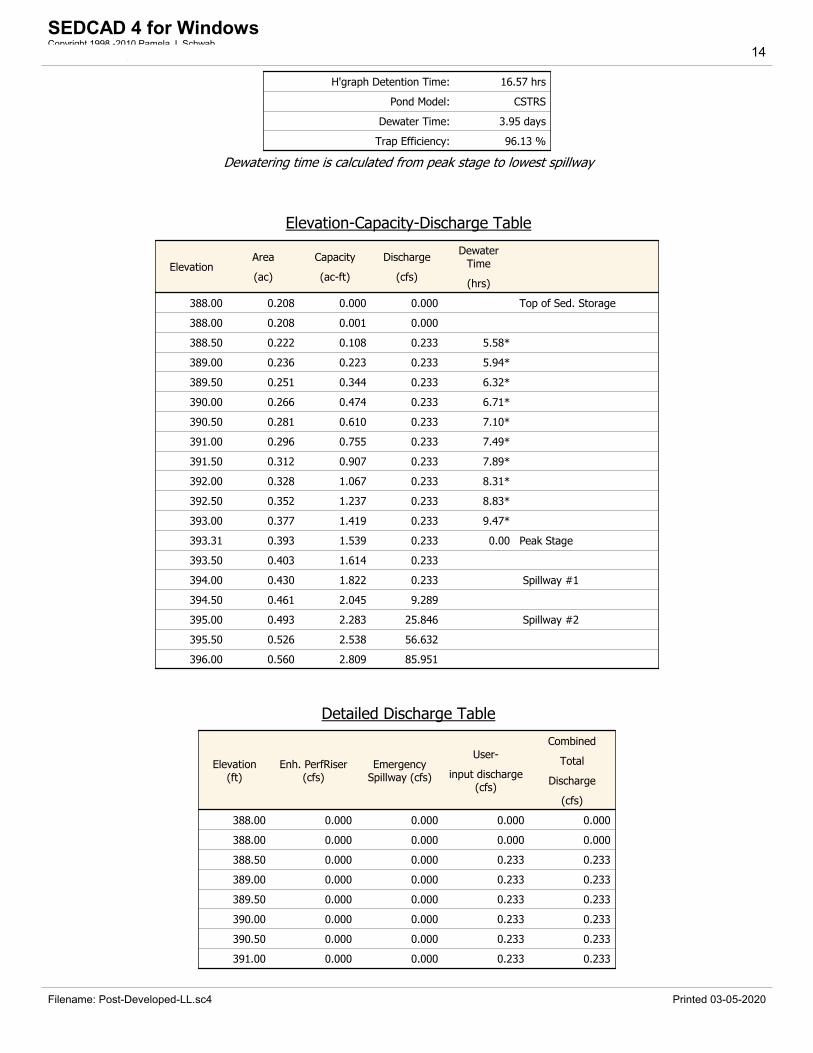
H'graph Detention Time: 16.57 hrs
Pond Model: CSTRS
Dewater Time: 3.95 days
Trap Efficiency: 96.13 %
Dewatering time is calculated from peak stage to lowest spillway
Elevation-Capacity-Discharge Table
ElevationArea
(ac)
Capacity
(ac-ft)
Discharge
(cfs)
DewaterTime
(hrs)
388.00 0.208 0.000 0.000 Top of Sed. Storage
388.00 0.208 0.001 0.000
388.50 0.222 0.108 0.233 5.58*
389.00 0.236 0.223 0.233 5.94*
389.50 0.251 0.344 0.233 6.32*
390.00 0.266 0.474 0.233 6.71*
390.50 0.281 0.610 0.233 7.10*
391.00 0.296 0.755 0.233 7.49*
391.50 0.312 0.907 0.233 7.89*
392.00 0.328 1.067 0.233 8.31*
392.50 0.352 1.237 0.233 8.83*
393.00 0.377 1.419 0.233 9.47*
393.31 0.393 1.539 0.233 0.00 Peak Stage
393.50 0.403 1.614 0.233
394.00 0.430 1.822 0.233 Spillway #1
394.50 0.461 2.045 9.289
395.00 0.493 2.283 25.846 Spillway #2
395.50 0.526 2.538 56.632
396.00 0.560 2.809 85.951
Detailed Discharge Table
Elevation(ft)
Enh. PerfRiser(cfs)
EmergencySpillway (cfs)
User-
input discharge(cfs)
Combined
Total
Discharge
(cfs)
388.00 0.000 0.000 0.000 0.000
388.00 0.000 0.000 0.000 0.000
388.50 0.000 0.000 0.233 0.233
389.00 0.000 0.000 0.233 0.233
389.50 0.000 0.000 0.233 0.233
390.00 0.000 0.000 0.233 0.233
390.50 0.000 0.000 0.233 0.233
391.00 0.000 0.000 0.233 0.233
Filename: Post-Developed-LL.sc4 Printed 03-05-2020
SEDCAD 4 for WindowsCopyright 1998 -2010 Pamela J. SchwabCivil Software Design, LLC 14
Page 27
Elevation(ft)
Enh. PerfRiser(cfs)
EmergencySpillway (cfs)
User-
input discharge(cfs)
Combined
Total
Discharge
(cfs)
391.50 0.000 0.000 0.233 0.233
392.00 0.000 0.000 0.233 0.233
392.50 0.000 0.000 0.233 0.233
393.00 0.000 0.000 0.233 0.233
393.50 0.000 0.000 0.233 0.233
394.00 0.000 0.000 0.233 0.233
394.50 9.056 0.000 0.233 9.289
395.00 25.613 0.000 0.233 25.846
395.50 32.036 24.363 0.233 56.632
396.00 36.992 48.726 0.233 85.951
Structure #5 (Null)
Hydrologic Point of Interest/pond bypass
Filename: Post-Developed-LL.sc4 Printed 03-05-2020
SEDCAD 4 for WindowsCopyright 1998 -2010 Pamela J. SchwabCivil Software Design, LLC 15
Page 28
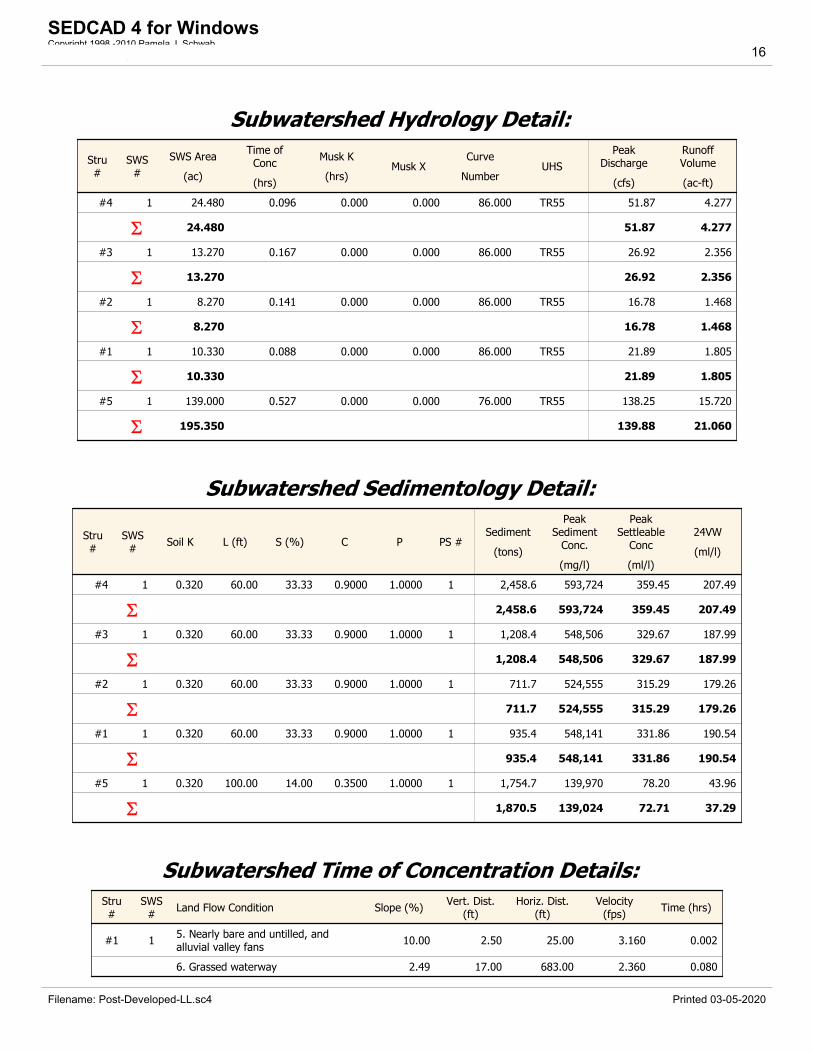
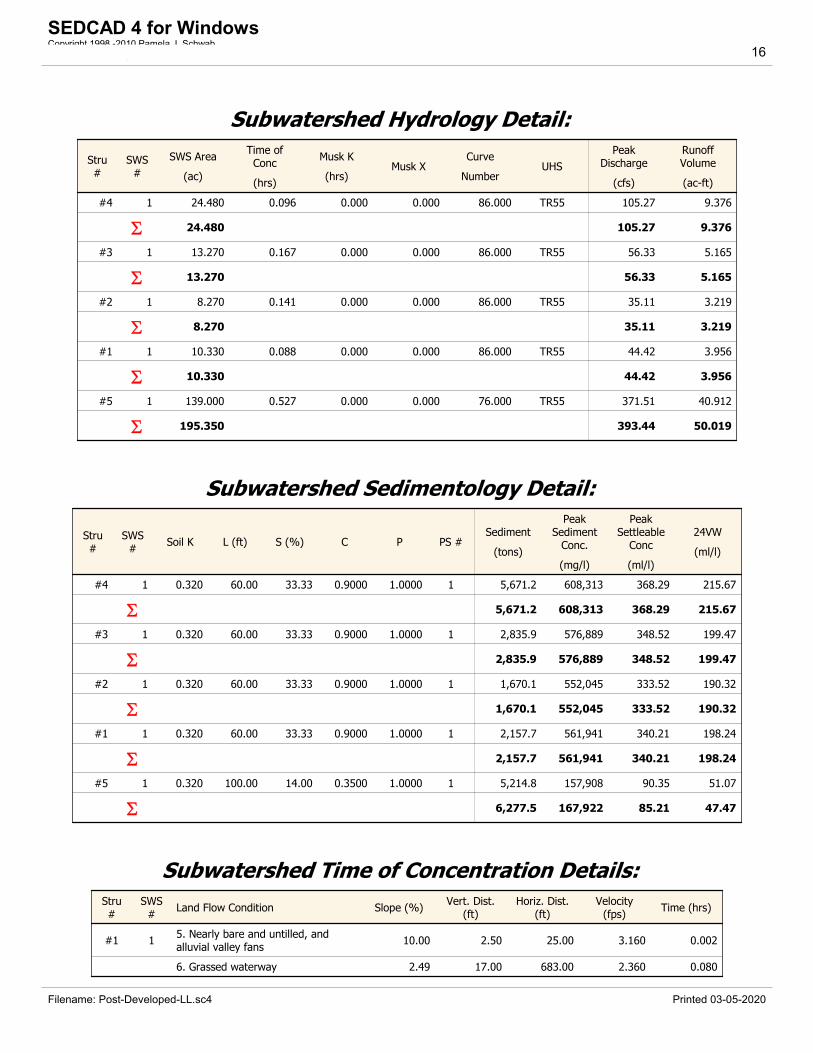
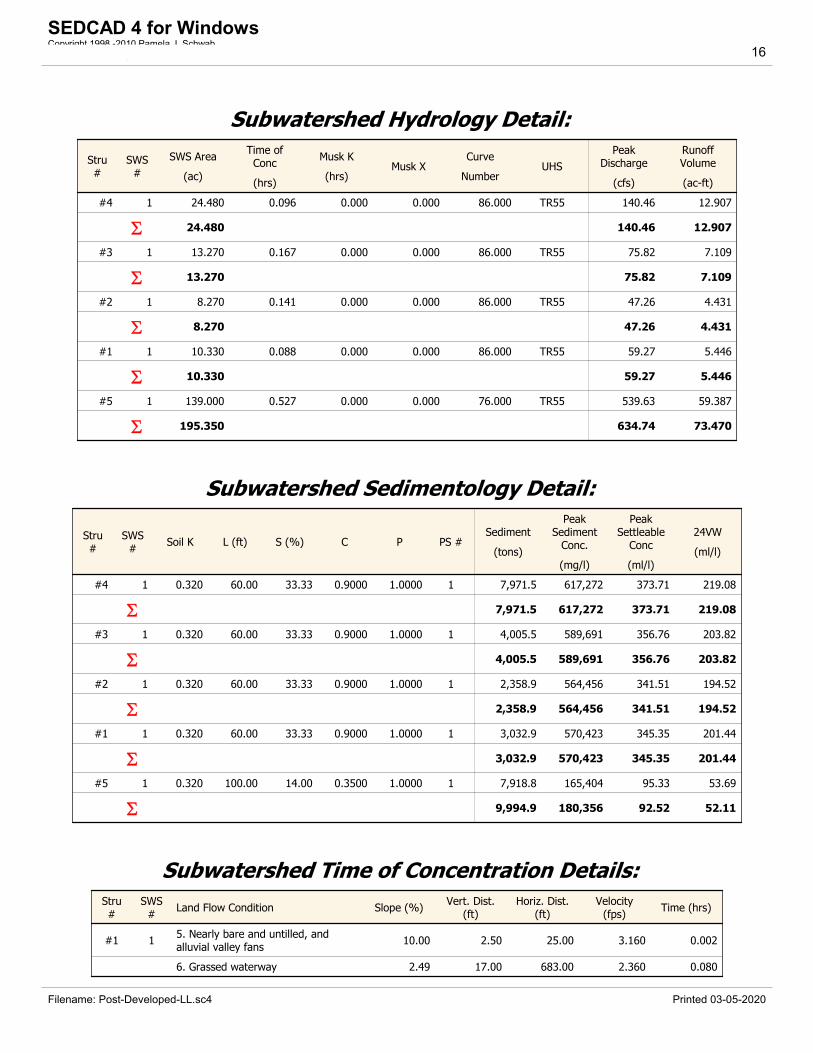
Subwatershed Hydrology Detail:
Stru#
SWS#
SWS Area
(ac)
Time ofConc
(hrs)
Musk K
(hrs)Musk X
Curve
NumberUHS
PeakDischarge
(cfs)
RunoffVolume
(ac-ft)
#4 1 24.480 0.096 0.000 0.000 86.000 TR55 51.87 4.277
24.480 51.87 4.277
#3 1 13.270 0.167 0.000 0.000 86.000 TR55 26.92 2.356
13.270 26.92 2.356
#2 1 8.270 0.141 0.000 0.000 86.000 TR55 16.78 1.468
8.270 16.78 1.468
#1 1 10.330 0.088 0.000 0.000 86.000 TR55 21.89 1.805
10.330 21.89 1.805
#5 1 139.000 0.527 0.000 0.000 76.000 TR55 138.25 15.720
195.350 139.88 21.060
Subwatershed Sedimentology Detail:
Stru#
SWS#
Soil K L (ft) S (%) C P PS #Sediment
(tons)
PeakSediment
Conc.
(mg/l)
PeakSettleable
Conc
(ml/l)
24VW
(ml/l)
#4 1 0.320 60.00 33.33 0.9000 1.0000 1 2,458.6 593,724 359.45 207.49
2,458.6 593,724 359.45 207.49
#3 1 0.320 60.00 33.33 0.9000 1.0000 1 1,208.4 548,506 329.67 187.99
1,208.4 548,506 329.67 187.99
#2 1 0.320 60.00 33.33 0.9000 1.0000 1 711.7 524,555 315.29 179.26
711.7 524,555 315.29 179.26
#1 1 0.320 60.00 33.33 0.9000 1.0000 1 935.4 548,141 331.86 190.54
935.4 548,141 331.86 190.54
#5 1 0.320 100.00 14.00 0.3500 1.0000 1 1,754.7 139,970 78.20 43.96
1,870.5 139,024 72.71 37.29
Subwatershed Time of Concentration Details:Stru#
SWS#
Land Flow Condition Slope (%)Vert. Dist.
(ft)Horiz. Dist.
(ft)Velocity
(fps)Time (hrs)
#1 15. Nearly bare and untilled, andalluvial valley fans
10.00 2.50 25.00 3.160 0.002
6. Grassed waterway 2.49 17.00 683.00 2.360 0.080
Filename: Post-Developed-LL.sc4 Printed 03-05-2020
SEDCAD 4 for WindowsCopyright 1998 -2010 Pamela J. SchwabCivil Software Design, LLC 16
Page 29
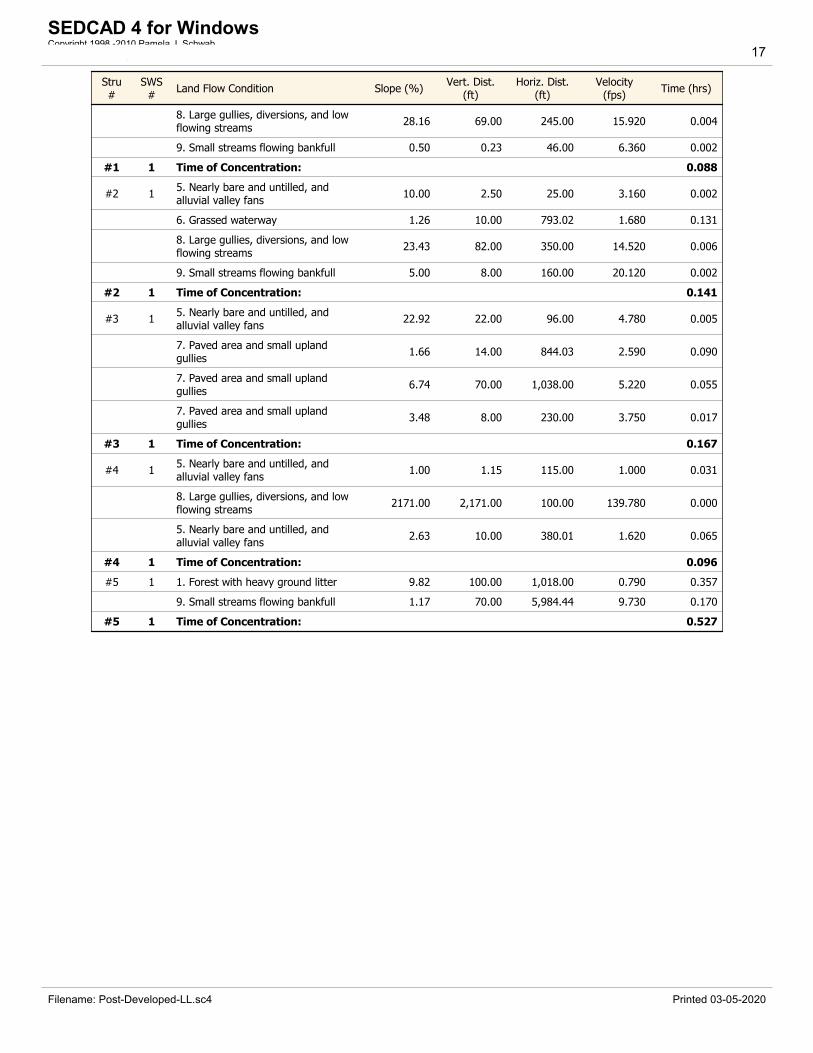
Stru#
SWS#
Land Flow Condition Slope (%)Vert. Dist.
(ft)Horiz. Dist.
(ft)Velocity
(fps)Time (hrs)
8. Large gullies, diversions, and lowflowing streams
28.16 69.00 245.00 15.920 0.004
9. Small streams flowing bankfull 0.50 0.23 46.00 6.360 0.002
#1 1 Time of Concentration: 0.088
#2 15. Nearly bare and untilled, andalluvial valley fans
10.00 2.50 25.00 3.160 0.002
6. Grassed waterway 1.26 10.00 793.02 1.680 0.131
8. Large gullies, diversions, and lowflowing streams
23.43 82.00 350.00 14.520 0.006
9. Small streams flowing bankfull 5.00 8.00 160.00 20.120 0.002
#2 1 Time of Concentration: 0.141
#3 15. Nearly bare and untilled, andalluvial valley fans
22.92 22.00 96.00 4.780 0.005
7. Paved area and small uplandgullies
1.66 14.00 844.03 2.590 0.090
7. Paved area and small uplandgullies
6.74 70.00 1,038.00 5.220 0.055
7. Paved area and small uplandgullies
3.48 8.00 230.00 3.750 0.017
#3 1 Time of Concentration: 0.167
#4 15. Nearly bare and untilled, andalluvial valley fans
1.00 1.15 115.00 1.000 0.031
8. Large gullies, diversions, and lowflowing streams
2171.00 2,171.00 100.00 139.780 0.000
5. Nearly bare and untilled, andalluvial valley fans
2.63 10.00 380.01 1.620 0.065
#4 1 Time of Concentration: 0.096
#5 1 1. Forest with heavy ground litter 9.82 100.00 1,018.00 0.790 0.357
9. Small streams flowing bankfull 1.17 70.00 5,984.44 9.730 0.170
#5 1 Time of Concentration: 0.527
Filename: Post-Developed-LL.sc4 Printed 03-05-2020
SEDCAD 4 for WindowsCopyright 1998 -2010 Pamela J. SchwabCivil Software Design, LLC 17
Page 30
Vulcan Fairfield Quarry
Pre-development Calculations
10-year 24-hour Storm Event
5.1 inches
N. Davis
Filename: Pre-Developed.sc4 Printed 02-13-2020
SEDCAD 4 for WindowsCopyright 1998 -2010 Pamela J. SchwabCivil Software Design, LLC 1
Page 31
General Information
Storm Information:Storm Type: NRCS Type II
Design Storm: 10 yr - 24 hr
Rainfall Depth: 5.100 inches
Filename: Pre-Developed.sc4 Printed 02-13-2020
SEDCAD 4 for WindowsCopyright 1998 -2010 Pamela J. SchwabCivil Software Design, LLC 2
Page 32
Structure Networking:
TypeStru#
(flowsinto)
Stru#
Musk. K(hrs)
Musk. X Description
Null #1 ==> End 0.000 0.000 Hydrologic Point of Interest
#1
Null
Filename: Pre-Developed.sc4 Printed 02-13-2020
SEDCAD 4 for WindowsCopyright 1998 -2010 Pamela J. SchwabCivil Software Design, LLC 3
Page 33
Structure Summary:Immediate
ContributingArea
(ac)
TotalContributing
Area
(ac)
PeakDischarge
(cfs)
TotalRunoffVolume
(ac-ft)
#1 195.350 195.350 360.11 42.38
Filename: Pre-Developed.sc4 Printed 02-13-2020
SEDCAD 4 for WindowsCopyright 1998 -2010 Pamela J. SchwabCivil Software Design, LLC 4
Page 34
Structure Detail:
Structure #1 (Null)
Hydrologic Point of Interest
Filename: Pre-Developed.sc4 Printed 02-13-2020
SEDCAD 4 for WindowsCopyright 1998 -2010 Pamela J. SchwabCivil Software Design, LLC 5
Page 35
Subwatershed Hydrology Detail:
Stru#
SWS#
SWS Area
(ac)
Time ofConc
(hrs)
Musk K
(hrs)Musk X
Curve
NumberUHS
PeakDischarge
(cfs)
RunoffVolume
(ac-ft)
#1 1 195.350 0.596 0.000 0.000 76.000 TR55 360.11 42.382
195.350 360.11 42.382
Subwatershed Time of Concentration Details:Stru#
SWS#
Land Flow Condition Slope (%)Vert. Dist.
(ft)Horiz. Dist.
(ft)Velocity
(fps)Time (hrs)
#1 1 1. Forest with heavy ground litter 12.96 14.00 108.00 0.910 0.032
1. Forest with heavy ground litter 23.75 62.00 261.00 1.230 0.058
8. Large gullies, diversions, and lowflowing streams
1.48 98.00 6,632.00 3.640 0.506
#1 1 Time of Concentration: 0.596
Filename: Pre-Developed.sc4 Printed 02-13-2020
SEDCAD 4 for WindowsCopyright 1998 -2010 Pamela J. SchwabCivil Software Design, LLC 6
Page 36
Vulcan Fairfield Quarry
Post-development Calculations
10-year 24-hour Storm Event
5.1 inches
N. Davis
Filename: Post-Developed-LL.sc4 Printed 03-05-2020
SEDCAD 4 for WindowsCopyright 1998 -2010 Pamela J. SchwabCivil Software Design, LLC 1
Page 37
General Information
Storm Information:Storm Type: NRCS Type II
Design Storm: 10 yr - 24 hr
Rainfall Depth: 5.100 inches
Particle Size Distribution:Size (mm) Wilkes
1.4000 100.000%
1.0000 85.200%
0.0630 51.300%
0.0440 45.100%
0.0380 45.100%
0.0040 8.900%
0.0030 5.800%
0.0010 0.000%
Filename: Post-Developed-LL.sc4 Printed 03-05-2020
SEDCAD 4 for WindowsCopyright 1998 -2010 Pamela J. SchwabCivil Software Design, LLC 2
Page 38
Structure Networking:
TypeStru#
(flowsinto)
Stru#
Musk. K(hrs)
Musk. X Description
Pond #1 ==> #5 0.195 0.425 Pond 1
Pond #2 ==> #5 0.132 0.402 Pond 2
Pond #3 ==> #5 0.264 0.395 Pond 3
Pond #4 ==> #5 0.237 0.398 Pond 4
Null #5 ==> End 0.000 0.000Hydrologic Point of Interest/pondbypass
#4
Pond
#3
Pond
#2
Pond
#1
Pond
#5
Null
Structure Routing Details:Stru#
Land Flow Condition Slope (%)Vert. Dist.
(ft)Horiz. Dist.
(ft)Velocity
(fps)Time (hrs)
#1 1. Forest with heavy ground litter 17.02 16.00 94.00 1.04 0.025
9. Small streams flowing bankfull 1.17 70.00 5,984.44 9.73 0.170
#1 Muskingum K: 0.195
#28. Large gullies, diversions, and lowflowing streams
5.71 56.00 981.02 7.16 0.038
9. Small streams flowing bankfull 0.59 14.00 2,355.31 6.93 0.094
#2 Muskingum K: 0.132
#3 1. Forest with heavy ground litter 4.39 14.00 319.00 0.53 0.167
9. Small streams flowing bankfull 0.64 16.00 2,509.01 7.18 0.097
#3 Muskingum K: 0.264
#4 1. Forest with heavy ground litter 4.33 12.00 277.00 0.52 0.147
9. Small streams flowing bankfull 0.67 16.00 2,404.20 7.34 0.090
#4 Muskingum K: 0.237
Filename: Post-Developed-LL.sc4 Printed 03-05-2020
SEDCAD 4 for WindowsCopyright 1998 -2010 Pamela J. SchwabCivil Software Design, LLC 3
Page 39
Structure Summary:Immediate
ContributingArea
(ac)
TotalContributing
Area
(ac)
PeakDischarge
(cfs)
TotalRunoffVolume
(ac-ft)
Sediment
(tons)
PeakSediment
Conc.
(mg/l)
PeakSettleable
Conc.
(ml/l)
24VW
(ml/l)
#4In
Out24.480 24.480
83.58
0.23
7.26
0.77
4,318.0
26.8
602,478
84,591
364.75
0.00
213.01
0.00
#3In
Out13.270 13.270
44.35
4.88
4.00
2.15
2,149.0
207.4
567,229
132,451
342.20
3.66
195.88
2.16
#2In
Out8.270 8.270
27.64
4.73
2.49
1.65
1,265.5
148.3
542,684
150,451
327.40
15.22
186.86
7.94
#1In
Out10.330 10.330
35.27
3.48
3.06
1.74
1,642.9
153.4
556,419
158,567
336.87
3.07
195.73
1.47
#5 139.000 195.350 272.89 36.45 4,226.2 151,670 75.91 43.28
Filename: Post-Developed-LL.sc4 Printed 03-05-2020
SEDCAD 4 for WindowsCopyright 1998 -2010 Pamela J. SchwabCivil Software Design, LLC 4
Page 40
Particle Size Distribution(s) at Each Structure
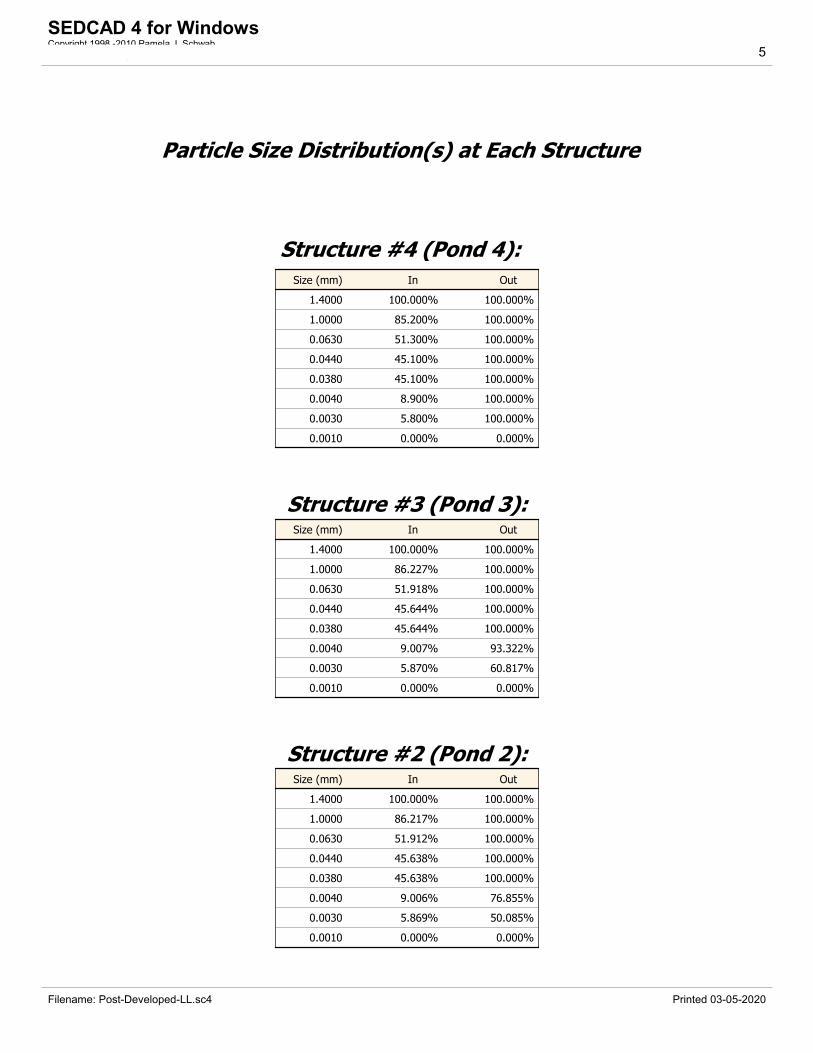
Structure #4 (Pond 4):Size (mm) In Out
1.4000 100.000% 100.000%
1.0000 85.200% 100.000%
0.0630 51.300% 100.000%
0.0440 45.100% 100.000%
0.0380 45.100% 100.000%
0.0040 8.900% 100.000%
0.0030 5.800% 100.000%
0.0010 0.000% 0.000%
Structure #3 (Pond 3):Size (mm) In Out
1.4000 100.000% 100.000%
1.0000 86.227% 100.000%
0.0630 51.918% 100.000%
0.0440 45.644% 100.000%
0.0380 45.644% 100.000%
0.0040 9.007% 93.322%
0.0030 5.870% 60.817%
0.0010 0.000% 0.000%
Structure #2 (Pond 2):Size (mm) In Out
1.4000 100.000% 100.000%
1.0000 86.217% 100.000%
0.0630 51.912% 100.000%
0.0440 45.638% 100.000%
0.0380 45.638% 100.000%
0.0040 9.006% 76.855%
0.0030 5.869% 50.085%
0.0010 0.000% 0.000%
Filename: Post-Developed-LL.sc4 Printed 03-05-2020
SEDCAD 4 for WindowsCopyright 1998 -2010 Pamela J. SchwabCivil Software Design, LLC 5
Page 41
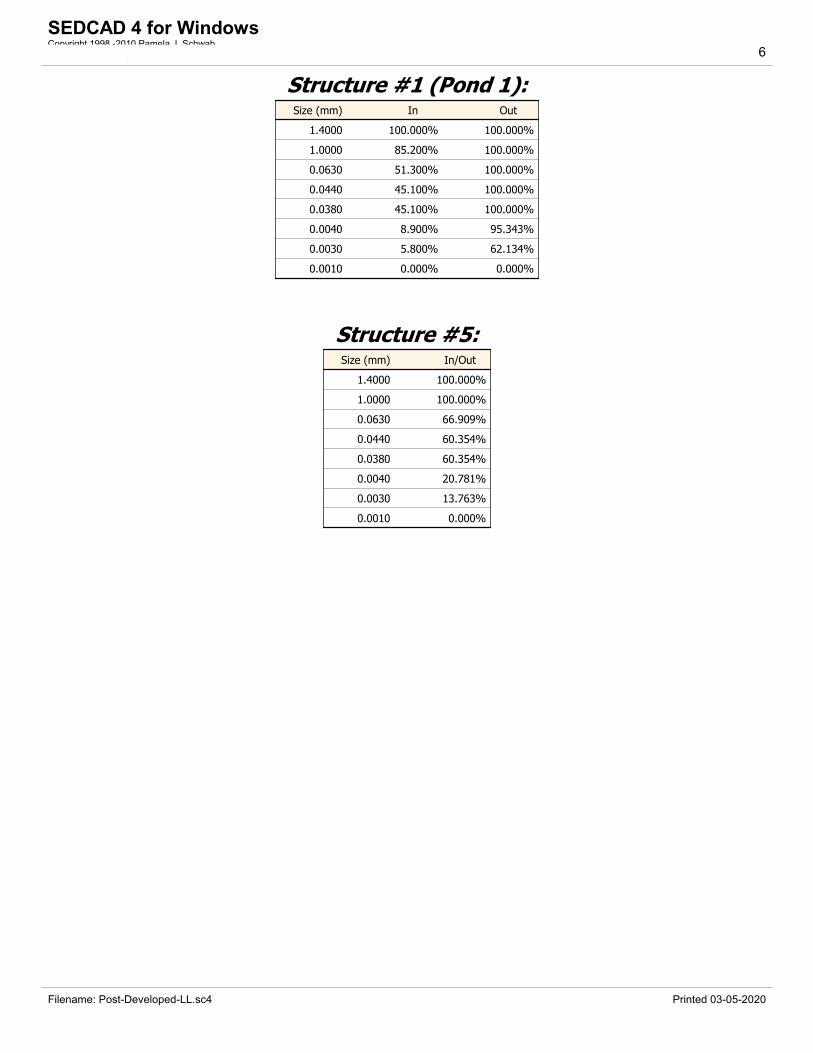
Structure #1 (Pond 1):Size (mm) In Out
1.4000 100.000% 100.000%
1.0000 85.200% 100.000%
0.0630 51.300% 100.000%
0.0440 45.100% 100.000%
0.0380 45.100% 100.000%
0.0040 8.900% 95.343%
0.0030 5.800% 62.134%
0.0010 0.000% 0.000%
Structure #5:Size (mm) In/Out
1.4000 100.000%
1.0000 100.000%
0.0630 66.909%
0.0440 60.354%
0.0380 60.354%
0.0040 20.781%
0.0030 13.763%
0.0010 0.000%
Filename: Post-Developed-LL.sc4 Printed 03-05-2020
SEDCAD 4 for WindowsCopyright 1998 -2010 Pamela J. SchwabCivil Software Design, LLC 6
Page 42
Structure Detail:Structure #4 (Pond)
Pond 4
Pond Inputs:
Initial Pool Elev: 329.50 ft
Initial Pool: 2.19 ac-ft
*Sediment Storage: 0.00 ac-ft
Dead Space: 20.00 %
*No sediment capacity defined
Enhanced Perf. Riser
RiserDiameter
(in)
Riser Height(ft)
BarrelDiameter
(in)
BarrelLength (ft)
Barrel Slope(%)
Manning's nSpillway Elev
(ft)
Number ofHoles per
Elev
31.56 8.00 24.00 106.00 1.90 0.0160 336.00 4
Emergency Spillway
Spillway ElevCrest Length
(ft)Left
SideslopeRight
SideslopeBottom
Width (ft)
337.00 31.00 6.66:1 6.66:1 20.00
Spillway ElevCrest Length
(ft)Left
SideslopeRight
SideslopeBottom
Width (ft)
337.00 31.00 6.66:1 6.66:1 20.00
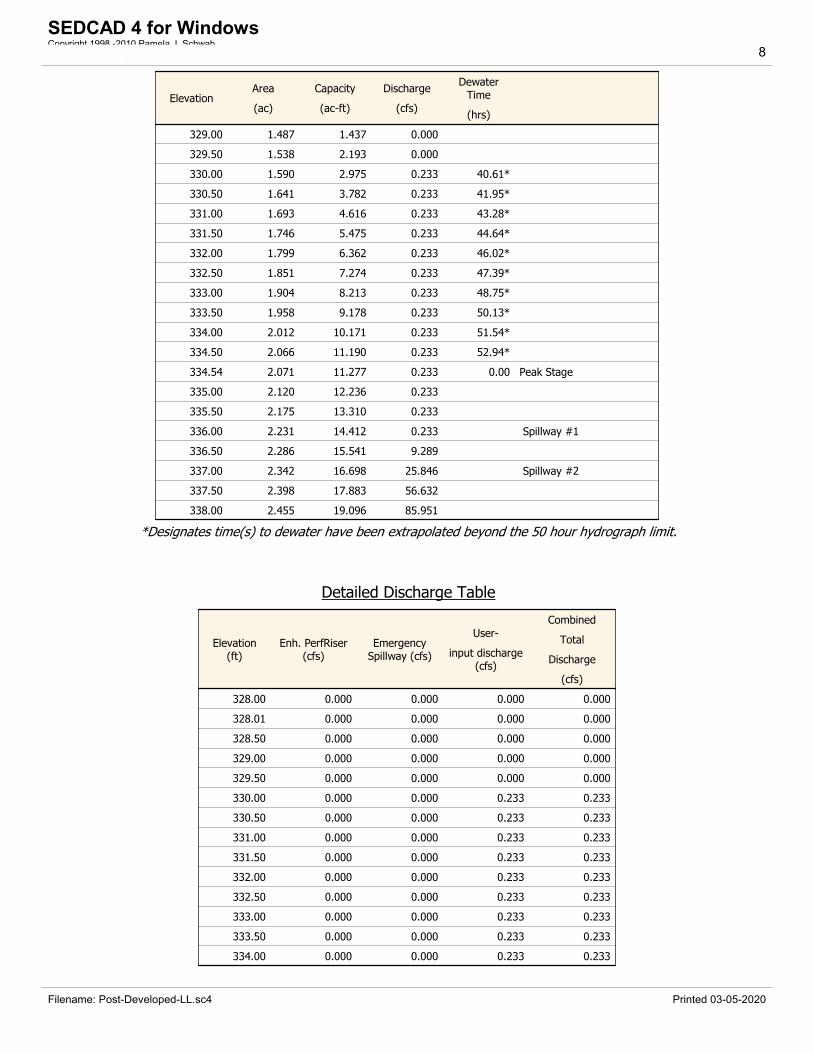
Pond Results:
Peak Elevation: 333.50 ft
H'graph Detention Time: 16.67 hrs
Pond Model: CSTRS
Dewater Time: 26.50 days
Trap Efficiency: 99.38 %
Dewatering time is calculated from peak stage to lowest spillway
Elevation-Capacity-Discharge Table
ElevationArea
(ac)
Capacity
(ac-ft)
Discharge
(cfs)
DewaterTime
(hrs)
328.00 1.387 0.000 0.000 Top of Sed. Storage
328.01 1.388 0.014 0.000
328.50 1.436 0.706 0.000
Filename: Post-Developed-LL.sc4 Printed 03-05-2020
SEDCAD 4 for WindowsCopyright 1998 -2010 Pamela J. SchwabCivil Software Design, LLC 7
Page 43
ElevationArea
(ac)
Capacity
(ac-ft)
Discharge
(cfs)
DewaterTime
(hrs)
329.00 1.487 1.437 0.000
329.50 1.538 2.193 0.000
330.00 1.590 2.975 0.233 40.61*
330.50 1.641 3.782 0.233 41.95*
331.00 1.693 4.616 0.233 43.28*
331.50 1.746 5.475 0.233 44.64*
332.00 1.799 6.362 0.233 46.02*
332.50 1.851 7.274 0.233 47.39*
333.00 1.904 8.213 0.233 48.75*
333.50 1.957 9.175 0.233 0.00 Peak Stage
333.50 1.958 9.178 0.233
334.00 2.012 10.171 0.233
334.50 2.066 11.190 0.233
335.00 2.120 12.236 0.233
335.50 2.175 13.310 0.233
336.00 2.231 14.412 0.233 Spillway #1
336.50 2.286 15.541 9.289
337.00 2.342 16.698 25.846 Spillway #2
337.50 2.398 17.883 56.632
338.00 2.455 19.096 85.951
*Designates time(s) to dewater have been extrapolated beyond the 50 hour hydrograph limit.
Detailed Discharge Table
Elevation(ft)
Enh. PerfRiser(cfs)
EmergencySpillway (cfs)
User-
input discharge(cfs)
Combined
Total
Discharge
(cfs)
328.00 0.000 0.000 0.000 0.000
328.01 0.000 0.000 0.000 0.000
328.50 0.000 0.000 0.000 0.000
329.00 0.000 0.000 0.000 0.000
329.50 0.000 0.000 0.000 0.000
330.00 0.000 0.000 0.233 0.233
330.50 0.000 0.000 0.233 0.233
331.00 0.000 0.000 0.233 0.233
331.50 0.000 0.000 0.233 0.233
332.00 0.000 0.000 0.233 0.233
332.50 0.000 0.000 0.233 0.233
333.00 0.000 0.000 0.233 0.233
333.50 0.000 0.000 0.233 0.233
334.00 0.000 0.000 0.233 0.233
Filename: Post-Developed-LL.sc4 Printed 03-05-2020
SEDCAD 4 for WindowsCopyright 1998 -2010 Pamela J. SchwabCivil Software Design, LLC 8
Page 44
Elevation(ft)
Enh. PerfRiser(cfs)
EmergencySpillway (cfs)
User-
input discharge(cfs)
Combined
Total
Discharge
(cfs)
334.50 0.000 0.000 0.233 0.233
335.00 0.000 0.000 0.233 0.233
335.50 0.000 0.000 0.233 0.233
336.00 0.000 0.000 0.233 0.233
336.50 9.056 0.000 0.233 9.289
337.00 25.613 0.000 0.233 25.846
337.50 32.036 24.363 0.233 56.632
338.00 36.992 48.726 0.233 85.951
Structure #3 (Pond)
Pond 3
Pond Inputs:
Initial Pool Elev: 333.50 ft
Initial Pool: 0.33 ac-ft
*Sediment Storage: 0.00 ac-ft
Dead Space: 20.00 %
*No sediment capacity defined
Enhanced Perf. Riser
RiserDiameter
(in)
Riser Height(ft)
BarrelDiameter
(in)
BarrelLength (ft)
Barrel Slope(%)
Manning's nSpillway Elev
(ft)
Number ofHoles per
Elev
31.56 8.00 24.00 188.00 1.06 0.0160 340.00 4
Emergency Spillway
Spillway ElevCrest Length
(ft)Left
SideslopeRight
SideslopeBottom
Width (ft)
341.00 31.00 6.66:1 6.66:1 20.00
Spillway ElevCrest Length
(ft)Left
SideslopeRight
SideslopeBottom
Width (ft)
341.00 31.00 6.66:1 6.66:1 20.00
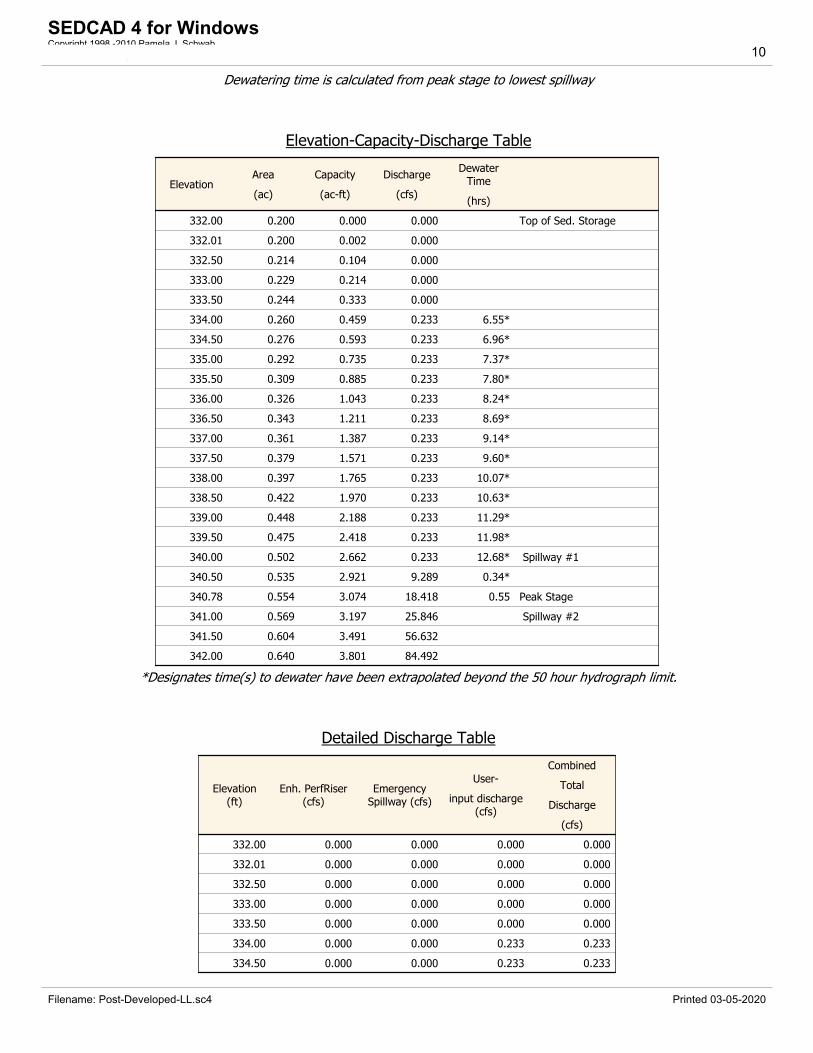
Pond Results:
Peak Elevation: 340.26 ft
H'graph Detention Time: 7.52 hrs
Pond Model: CSTRS
Dewater Time: 6.60 days
Trap Efficiency: 90.35 %
Filename: Post-Developed-LL.sc4 Printed 03-05-2020
SEDCAD 4 for WindowsCopyright 1998 -2010 Pamela J. SchwabCivil Software Design, LLC 9
Page 45
Dewatering time is calculated from peak stage to lowest spillway
Elevation-Capacity-Discharge Table
ElevationArea
(ac)
Capacity
(ac-ft)
Discharge
(cfs)
DewaterTime
(hrs)
332.00 0.200 0.000 0.000 Top of Sed. Storage
332.01 0.200 0.002 0.000
332.50 0.214 0.104 0.000
333.00 0.229 0.214 0.000
333.50 0.244 0.333 0.000
334.00 0.260 0.459 0.233 6.55*
334.50 0.276 0.593 0.233 6.96*
335.00 0.292 0.735 0.233 7.37*
335.50 0.309 0.885 0.233 7.80*
336.00 0.326 1.043 0.233 8.24*
336.50 0.343 1.211 0.233 8.69*
337.00 0.361 1.387 0.233 9.14*
337.50 0.379 1.571 0.233 9.60*
338.00 0.397 1.765 0.233 10.07*
338.50 0.422 1.970 0.233 10.63*
339.00 0.448 2.188 0.233 11.29*
339.50 0.475 2.418 0.233 11.98*
340.00 0.502 2.662 0.233 12.68* Spillway #1
340.26 0.520 2.795 4.876 37.15 Peak Stage
340.50 0.535 2.921 9.289
341.00 0.569 3.197 25.846 Spillway #2
341.50 0.604 3.491 56.632
342.00 0.640 3.801 84.492
*Designates time(s) to dewater have been extrapolated beyond the 50 hour hydrograph limit.
Detailed Discharge Table
Elevation(ft)
Enh. PerfRiser(cfs)
EmergencySpillway (cfs)
User-
input discharge(cfs)
Combined
Total
Discharge
(cfs)
332.00 0.000 0.000 0.000 0.000
332.01 0.000 0.000 0.000 0.000
332.50 0.000 0.000 0.000 0.000
333.00 0.000 0.000 0.000 0.000
333.50 0.000 0.000 0.000 0.000
334.00 0.000 0.000 0.233 0.233
334.50 0.000 0.000 0.233 0.233
Filename: Post-Developed-LL.sc4 Printed 03-05-2020
SEDCAD 4 for WindowsCopyright 1998 -2010 Pamela J. SchwabCivil Software Design, LLC 10
Page 46
Elevation(ft)
Enh. PerfRiser(cfs)
EmergencySpillway (cfs)
User-
input discharge(cfs)
Combined
Total
Discharge
(cfs)
335.00 0.000 0.000 0.233 0.233
335.50 0.000 0.000 0.233 0.233
336.00 0.000 0.000 0.233 0.233
336.50 0.000 0.000 0.233 0.233
337.00 0.000 0.000 0.233 0.233
337.50 0.000 0.000 0.233 0.233
338.00 0.000 0.000 0.233 0.233
338.50 0.000 0.000 0.233 0.233
339.00 0.000 0.000 0.233 0.233
339.50 0.000 0.000 0.233 0.233
340.00 0.000 0.000 0.233 0.233
340.50 9.056 0.000 0.233 9.289
341.00 25.613 0.000 0.233 25.846
341.50 32.036 24.363 0.233 56.632
342.00 35.533 48.726 0.233 84.492
Structure #2 (Pond)
Pond 2
Pond Inputs:
Initial Pool Elev: 374.00 ft
Initial Pool: 0.00 ac-ft
*Sediment Storage: 0.25 ac-ft
Dead Space: 20.00 %
*Sediment capacity was entered by user
Enhanced Perf. Riser
RiserDiameter
(in)
Riser Height(ft)
BarrelDiameter
(in)
BarrelLength (ft)
Barrel Slope(%)
Manning's nSpillway Elev
(ft)
Number ofHoles per
Elev
31.56 8.00 24.00 161.00 1.20 0.0160 380.00 4
Emergency Spillway
Spillway ElevCrest Length
(ft)Left
SideslopeRight
SideslopeBottom
Width (ft)
381.00 31.00 6.66:1 6.66:1 38.33
Spillway ElevCrest Length
(ft)Left
SideslopeRight
SideslopeBottom
Width (ft)
381.00 31.00 6.66:1 6.66:1 38.33
Filename: Post-Developed-LL.sc4 Printed 03-05-2020
SEDCAD 4 for WindowsCopyright 1998 -2010 Pamela J. SchwabCivil Software Design, LLC 11
Page 47
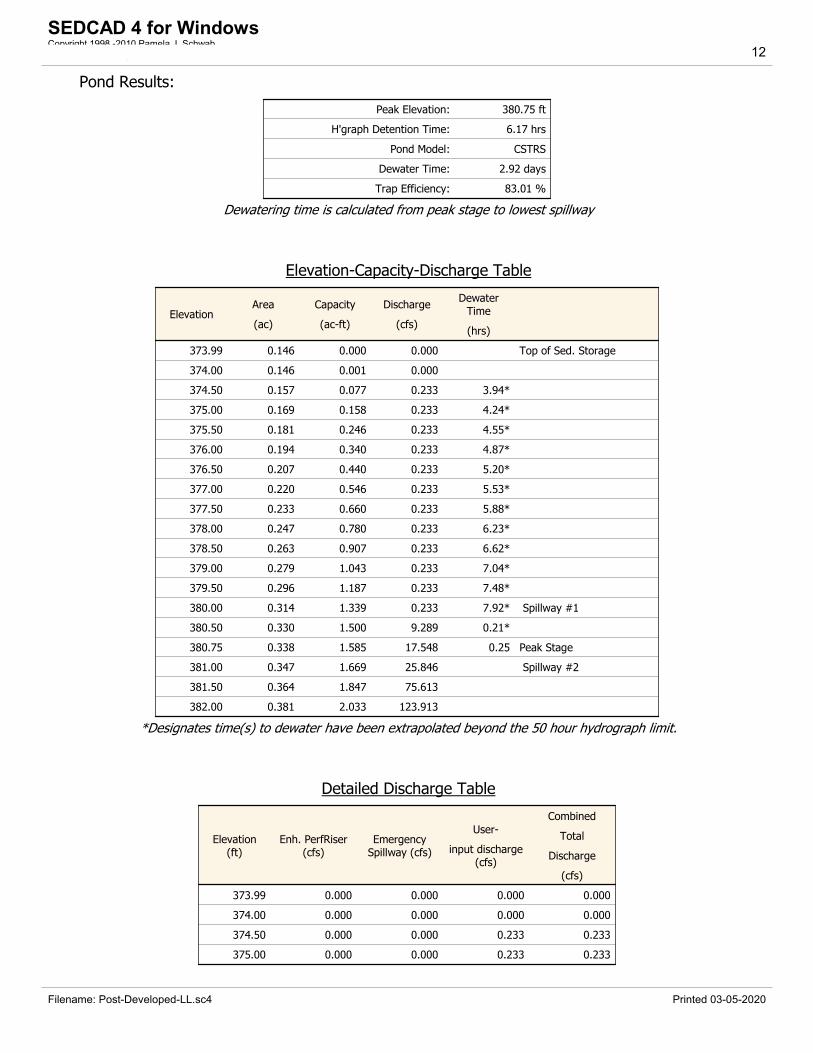
Pond Results:
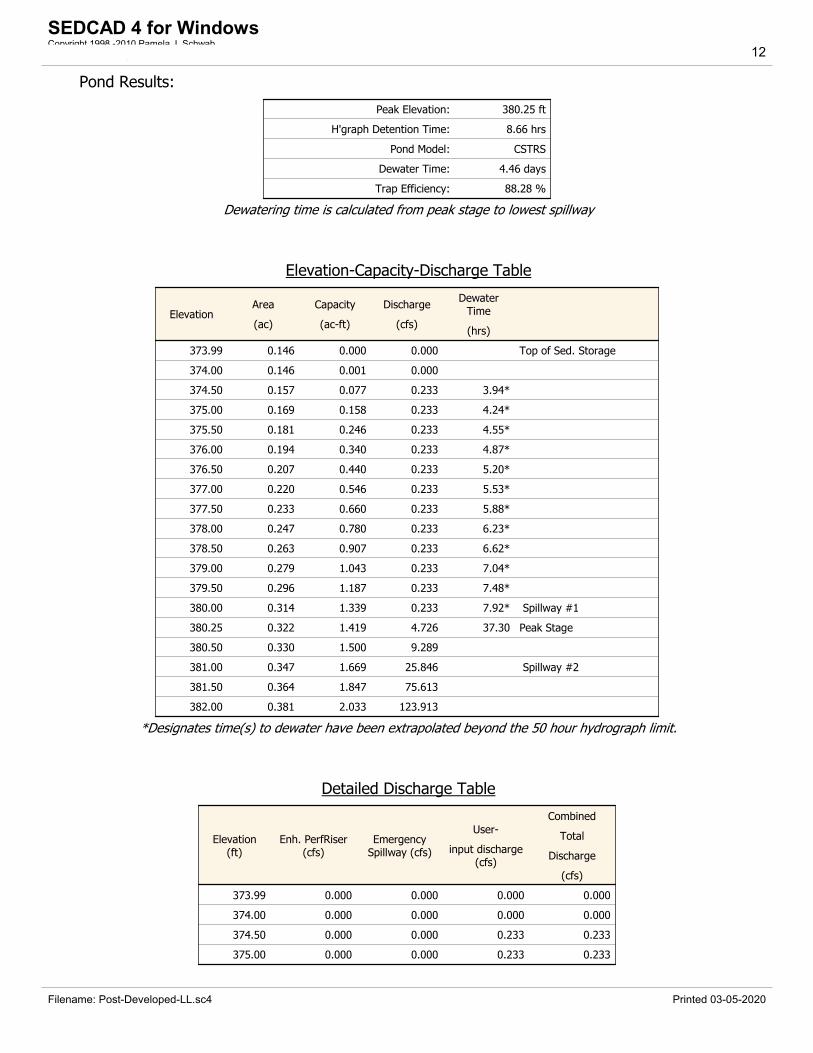
Peak Elevation: 380.25 ft
H'graph Detention Time: 8.66 hrs
Pond Model: CSTRS
Dewater Time: 4.46 days
Trap Efficiency: 88.28 %
Dewatering time is calculated from peak stage to lowest spillway
Elevation-Capacity-Discharge Table
ElevationArea
(ac)
Capacity
(ac-ft)
Discharge
(cfs)
DewaterTime
(hrs)
373.99 0.146 0.000 0.000 Top of Sed. Storage
374.00 0.146 0.001 0.000
374.50 0.157 0.077 0.233 3.94*
375.00 0.169 0.158 0.233 4.24*
375.50 0.181 0.246 0.233 4.55*
376.00 0.194 0.340 0.233 4.87*
376.50 0.207 0.440 0.233 5.20*
377.00 0.220 0.546 0.233 5.53*
377.50 0.233 0.660 0.233 5.88*
378.00 0.247 0.780 0.233 6.23*
378.50 0.263 0.907 0.233 6.62*
379.00 0.279 1.043 0.233 7.04*
379.50 0.296 1.187 0.233 7.48*
380.00 0.314 1.339 0.233 7.92* Spillway #1
380.25 0.322 1.419 4.726 37.30 Peak Stage
380.50 0.330 1.500 9.289
381.00 0.347 1.669 25.846 Spillway #2
381.50 0.364 1.847 75.613
382.00 0.381 2.033 123.913
*Designates time(s) to dewater have been extrapolated beyond the 50 hour hydrograph limit.
Detailed Discharge Table
Elevation(ft)
Enh. PerfRiser(cfs)
EmergencySpillway (cfs)
User-
input discharge(cfs)
Combined
Total
Discharge
(cfs)
373.99 0.000 0.000 0.000 0.000
374.00 0.000 0.000 0.000 0.000
374.50 0.000 0.000 0.233 0.233
375.00 0.000 0.000 0.233 0.233
Filename: Post-Developed-LL.sc4 Printed 03-05-2020
SEDCAD 4 for WindowsCopyright 1998 -2010 Pamela J. SchwabCivil Software Design, LLC 12
Page 48
Elevation(ft)
Enh. PerfRiser(cfs)
EmergencySpillway (cfs)
User-
input discharge(cfs)
Combined
Total
Discharge
(cfs)
375.50 0.000 0.000 0.233 0.233
376.00 0.000 0.000 0.233 0.233
376.50 0.000 0.000 0.233 0.233
377.00 0.000 0.000 0.233 0.233
377.50 0.000 0.000 0.233 0.233
378.00 0.000 0.000 0.233 0.233
378.50 0.000 0.000 0.233 0.233
379.00 0.000 0.000 0.233 0.233
379.50 0.000 0.000 0.233 0.233
380.00 0.000 0.000 0.233 0.233
380.50 9.056 0.000 0.233 9.289
381.00 25.613 0.000 0.233 25.846
381.50 32.036 43.344 0.233 75.613
382.00 36.992 86.688 0.233 123.913
Structure #1 (Pond)
Pond 1
Pond Inputs:
Initial Pool Elev: 388.00 ft
Initial Pool: 0.00 ac-ft
*Sediment Storage: 0.36 ac-ft
Dead Space: 20.00 %
*Sediment capacity was entered by user
Enhanced Perf. Riser
RiserDiameter
(in)
Riser Height(ft)
BarrelDiameter
(in)
BarrelLength (ft)
Barrel Slope(%)
Manning's nSpillway Elev
(ft)
Number ofHoles per
Elev
31.56 8.00 24.00 117.00 1.70 0.0160 394.00 4
Emergency Spillway
Spillway ElevCrest Length
(ft)Left
SideslopeRight
SideslopeBottom
Width (ft)
395.00 31.00 6.66:1 6.66:1 20.00
Spillway ElevCrest Length
(ft)Left
SideslopeRight
SideslopeBottom
Width (ft)
395.00 31.00 6.66:1 6.66:1 20.00
Pond Results:
Filename: Post-Developed-LL.sc4 Printed 03-05-2020
SEDCAD 4 for WindowsCopyright 1998 -2010 Pamela J. SchwabCivil Software Design, LLC 13
Page 49
Peak Elevation: 394.18 ft
H'graph Detention Time: 8.77 hrs
Pond Model: CSTRS
Dewater Time: 5.49 days
Trap Efficiency: 90.67 %
Dewatering time is calculated from peak stage to lowest spillway
Elevation-Capacity-Discharge Table
ElevationArea
(ac)
Capacity
(ac-ft)
Discharge
(cfs)
DewaterTime
(hrs)
388.00 0.208 0.000 0.000 Top of Sed. Storage
388.00 0.208 0.001 0.000
388.50 0.222 0.108 0.233 5.58*
389.00 0.236 0.223 0.233 5.94*
389.50 0.251 0.344 0.233 6.32*
390.00 0.266 0.474 0.233 6.71*
390.50 0.281 0.610 0.233 7.10*
391.00 0.296 0.755 0.233 7.49*
391.50 0.312 0.907 0.233 7.89*
392.00 0.328 1.067 0.233 8.31*
392.50 0.352 1.237 0.233 8.83*
393.00 0.377 1.419 0.233 9.47*
393.50 0.403 1.614 0.233 10.13*
394.00 0.430 1.822 0.233 10.82* Spillway #1
394.18 0.442 1.902 3.476 36.95 Peak Stage
394.50 0.461 2.045 9.289
395.00 0.493 2.283 25.846 Spillway #2
395.50 0.526 2.538 56.632
396.00 0.560 2.809 85.951
*Designates time(s) to dewater have been extrapolated beyond the 50 hour hydrograph limit.
Detailed Discharge Table
Elevation(ft)
Enh. PerfRiser(cfs)
EmergencySpillway (cfs)
User-
input discharge(cfs)
Combined
Total
Discharge
(cfs)
388.00 0.000 0.000 0.000 0.000
388.00 0.000 0.000 0.000 0.000
388.50 0.000 0.000 0.233 0.233
389.00 0.000 0.000 0.233 0.233
389.50 0.000 0.000 0.233 0.233
390.00 0.000 0.000 0.233 0.233
Filename: Post-Developed-LL.sc4 Printed 03-05-2020
SEDCAD 4 for WindowsCopyright 1998 -2010 Pamela J. SchwabCivil Software Design, LLC 14
Page 50
Elevation(ft)
Enh. PerfRiser(cfs)
EmergencySpillway (cfs)
User-
input discharge(cfs)
Combined
Total
Discharge
(cfs)
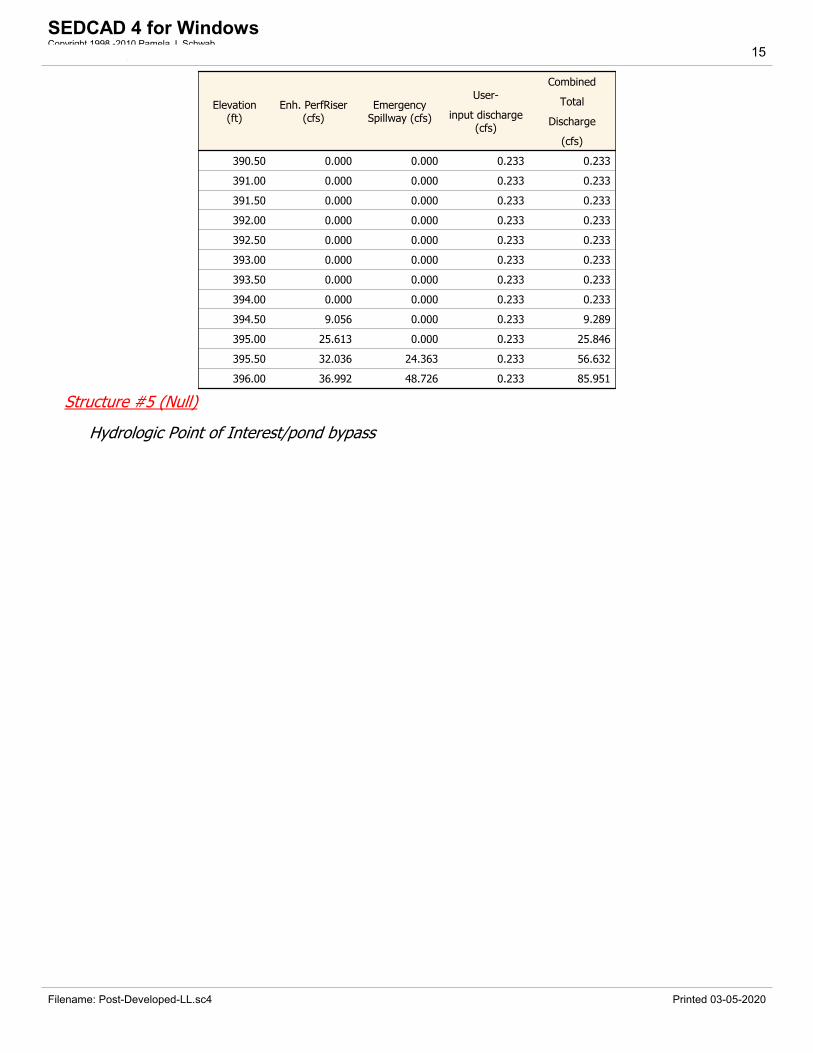
390.50 0.000 0.000 0.233 0.233
391.00 0.000 0.000 0.233 0.233
391.50 0.000 0.000 0.233 0.233
392.00 0.000 0.000 0.233 0.233
392.50 0.000 0.000 0.233 0.233
393.00 0.000 0.000 0.233 0.233
393.50 0.000 0.000 0.233 0.233
394.00 0.000 0.000 0.233 0.233
394.50 9.056 0.000 0.233 9.289
395.00 25.613 0.000 0.233 25.846
395.50 32.036 24.363 0.233 56.632
396.00 36.992 48.726 0.233 85.951
Structure #5 (Null)
Hydrologic Point of Interest/pond bypass
Filename: Post-Developed-LL.sc4 Printed 03-05-2020
SEDCAD 4 for WindowsCopyright 1998 -2010 Pamela J. SchwabCivil Software Design, LLC 15
Page 51
Subwatershed Hydrology Detail:
Stru#
SWS#
SWS Area
(ac)
Time ofConc
(hrs)
Musk K
(hrs)Musk X
Curve
NumberUHS
PeakDischarge
(cfs)
RunoffVolume
(ac-ft)
#4 1 24.480 0.096 0.000 0.000 86.000 TR55 83.58 7.257
24.480 83.58 7.257
#3 1 13.270 0.167 0.000 0.000 86.000 TR55 44.35 3.998
13.270 44.35 3.998
#2 1 8.270 0.141 0.000 0.000 86.000 TR55 27.64 2.492
8.270 27.64 2.492
#1 1 10.330 0.088 0.000 0.000 86.000 TR55 35.27 3.062
10.330 35.27 3.062
#5 1 139.000 0.527 0.000 0.000 76.000 TR55 271.95 30.145
195.350 272.89 36.451
Subwatershed Sedimentology Detail:
Stru#
SWS#
Soil K L (ft) S (%) C P PS #Sediment
(tons)
PeakSediment
Conc.
(mg/l)
PeakSettleable
Conc
(ml/l)
24VW
(ml/l)
#4 1 0.320 60.00 33.33 0.9000 1.0000 1 4,318.0 602,478 364.75 213.01
4,318.0 602,478 364.75 213.01
#3 1 0.320 60.00 33.33 0.9000 1.0000 1 2,149.0 567,229 342.20 195.88
2,149.0 567,229 342.20 195.88
#2 1 0.320 60.00 33.33 0.9000 1.0000 1 1,265.5 542,684 327.40 186.86
1,265.5 542,684 327.40 186.86
#1 1 0.320 60.00 33.33 0.9000 1.0000 1 1,642.9 556,419 336.87 195.73
1,642.9 556,419 336.87 195.73
#5 1 0.320 100.00 14.00 0.3500 1.0000 1 3,690.6 151,759 86.21 48.81
4,226.2 151,670 75.91 43.28
Subwatershed Time of Concentration Details:Stru#
SWS#
Land Flow Condition Slope (%)Vert. Dist.
(ft)Horiz. Dist.
(ft)Velocity
(fps)Time (hrs)
#1 15. Nearly bare and untilled, andalluvial valley fans
10.00 2.50 25.00 3.160 0.002
6. Grassed waterway 2.49 17.00 683.00 2.360 0.080
Filename: Post-Developed-LL.sc4 Printed 03-05-2020
SEDCAD 4 for WindowsCopyright 1998 -2010 Pamela J. SchwabCivil Software Design, LLC 16
Page 52
Stru#
SWS#
Land Flow Condition Slope (%)Vert. Dist.
(ft)Horiz. Dist.
(ft)Velocity
(fps)Time (hrs)
8. Large gullies, diversions, and lowflowing streams
28.16 69.00 245.00 15.920 0.004
9. Small streams flowing bankfull 0.50 0.23 46.00 6.360 0.002
#1 1 Time of Concentration: 0.088
#2 15. Nearly bare and untilled, andalluvial valley fans
10.00 2.50 25.00 3.160 0.002
6. Grassed waterway 1.26 10.00 793.02 1.680 0.131
8. Large gullies, diversions, and lowflowing streams
23.43 82.00 350.00 14.520 0.006
9. Small streams flowing bankfull 5.00 8.00 160.00 20.120 0.002
#2 1 Time of Concentration: 0.141
#3 15. Nearly bare and untilled, andalluvial valley fans
22.92 22.00 96.00 4.780 0.005
7. Paved area and small uplandgullies
1.66 14.00 844.03 2.590 0.090
7. Paved area and small uplandgullies
6.74 70.00 1,038.00 5.220 0.055
7. Paved area and small uplandgullies
3.48 8.00 230.00 3.750 0.017
#3 1 Time of Concentration: 0.167
#4 15. Nearly bare and untilled, andalluvial valley fans
1.00 1.15 115.00 1.000 0.031
8. Large gullies, diversions, and lowflowing streams
2171.00 2,171.00 100.00 139.780 0.000
5. Nearly bare and untilled, andalluvial valley fans
2.63 10.00 380.01 1.620 0.065
#4 1 Time of Concentration: 0.096
#5 1 1. Forest with heavy ground litter 9.82 100.00 1,018.00 0.790 0.357
9. Small streams flowing bankfull 1.17 70.00 5,984.44 9.730 0.170
#5 1 Time of Concentration: 0.527
Filename: Post-Developed-LL.sc4 Printed 03-05-2020
SEDCAD 4 for WindowsCopyright 1998 -2010 Pamela J. SchwabCivil Software Design, LLC 17
Page 53
Vulcan Fairfield Quarry
Pre-development Calculations
25-year 24-hour Storm Event
6.2 inches
N. Davis
Filename: Pre-Developed.sc4 Printed 02-13-2020
SEDCAD 4 for WindowsCopyright 1998 -2010 Pamela J. SchwabCivil Software Design, LLC 1
Page 54
General Information
Storm Information:Storm Type: NRCS Type II
Design Storm: 25 yr - 24 hr
Rainfall Depth: 6.200 inches
Filename: Pre-Developed.sc4 Printed 02-13-2020
SEDCAD 4 for WindowsCopyright 1998 -2010 Pamela J. SchwabCivil Software Design, LLC 2
Page 55
Structure Networking:
TypeStru#
(flowsinto)
Stru#
Musk. K(hrs)
Musk. X Description
Null #1 ==> End 0.000 0.000 Hydrologic Point of Interest
#1
Null
Filename: Pre-Developed.sc4 Printed 02-13-2020
SEDCAD 4 for WindowsCopyright 1998 -2010 Pamela J. SchwabCivil Software Design, LLC 3
Page 56
Structure Summary:Immediate
ContributingArea
(ac)
TotalContributing
Area
(ac)
PeakDischarge
(cfs)
TotalRunoffVolume
(ac-ft)
#1 195.350 195.350 491.17 57.52
Filename: Pre-Developed.sc4 Printed 02-13-2020
SEDCAD 4 for WindowsCopyright 1998 -2010 Pamela J. SchwabCivil Software Design, LLC 4
Page 57
Structure Detail:
Structure #1 (Null)
Hydrologic Point of Interest
Filename: Pre-Developed.sc4 Printed 02-13-2020
SEDCAD 4 for WindowsCopyright 1998 -2010 Pamela J. SchwabCivil Software Design, LLC 5
Page 58
Subwatershed Hydrology Detail:
Stru#
SWS#
SWS Area
(ac)
Time ofConc
(hrs)
Musk K
(hrs)Musk X
Curve
NumberUHS
PeakDischarge
(cfs)
RunoffVolume
(ac-ft)
#1 1 195.350 0.596 0.000 0.000 76.000 TR55 491.17 57.521
195.350 491.17 57.521
Subwatershed Time of Concentration Details:Stru#
SWS#
Land Flow Condition Slope (%)Vert. Dist.
(ft)Horiz. Dist.
(ft)Velocity
(fps)Time (hrs)
#1 1 1. Forest with heavy ground litter 12.96 14.00 108.00 0.910 0.032
1. Forest with heavy ground litter 23.75 62.00 261.00 1.230 0.058
8. Large gullies, diversions, and lowflowing streams
1.48 98.00 6,632.00 3.640 0.506
#1 1 Time of Concentration: 0.596
Filename: Pre-Developed.sc4 Printed 02-13-2020
SEDCAD 4 for WindowsCopyright 1998 -2010 Pamela J. SchwabCivil Software Design, LLC 6
Page 59
Vulcan Fairfield Quarry
Post-development Calculations
25-year 24-hour Storm Event
6.2 inches
N. Davis
Filename: Post-Developed-LL.sc4 Printed 03-05-2020
SEDCAD 4 for WindowsCopyright 1998 -2010 Pamela J. SchwabCivil Software Design, LLC 1
Page 60
General Information
Storm Information:Storm Type: NRCS Type II
Design Storm: 25 yr - 24 hr
Rainfall Depth: 6.200 inches
Particle Size Distribution:Size (mm) Wilkes
1.4000 100.000%
1.0000 85.200%
0.0630 51.300%
0.0440 45.100%
0.0380 45.100%
0.0040 8.900%
0.0030 5.800%
0.0010 0.000%
Filename: Post-Developed-LL.sc4 Printed 03-05-2020
SEDCAD 4 for WindowsCopyright 1998 -2010 Pamela J. SchwabCivil Software Design, LLC 2
Page 61
Structure Networking:
TypeStru#
(flowsinto)
Stru#
Musk. K(hrs)
Musk. X Description
Pond #1 ==> #5 0.195 0.425 Pond 1
Pond #2 ==> #5 0.132 0.402 Pond 2
Pond #3 ==> #5 0.264 0.395 Pond 3
Pond #4 ==> #5 0.237 0.398 Pond 4
Null #5 ==> End 0.000 0.000Hydrologic Point of Interest/pondbypass
#4
Pond
#3
Pond
#2
Pond
#1
Pond
#5
Null
Structure Routing Details:Stru#
Land Flow Condition Slope (%)Vert. Dist.
(ft)Horiz. Dist.
(ft)Velocity
(fps)Time (hrs)
#1 1. Forest with heavy ground litter 17.02 16.00 94.00 1.04 0.025
9. Small streams flowing bankfull 1.17 70.00 5,984.44 9.73 0.170
#1 Muskingum K: 0.195
#28. Large gullies, diversions, and lowflowing streams
5.71 56.00 981.02 7.16 0.038
9. Small streams flowing bankfull 0.59 14.00 2,355.31 6.93 0.094
#2 Muskingum K: 0.132
#3 1. Forest with heavy ground litter 4.39 14.00 319.00 0.53 0.167
9. Small streams flowing bankfull 0.64 16.00 2,509.01 7.18 0.097
#3 Muskingum K: 0.264
#4 1. Forest with heavy ground litter 4.33 12.00 277.00 0.52 0.147
9. Small streams flowing bankfull 0.67 16.00 2,404.20 7.34 0.090
#4 Muskingum K: 0.237
Filename: Post-Developed-LL.sc4 Printed 03-05-2020
SEDCAD 4 for WindowsCopyright 1998 -2010 Pamela J. SchwabCivil Software Design, LLC 3
Page 62
Structure Summary:Immediate
ContributingArea
(ac)
TotalContributing
Area
(ac)
PeakDischarge
(cfs)
TotalRunoffVolume
(ac-ft)
Sediment
(tons)
PeakSediment
Conc.
(mg/l)
PeakSettleable
Conc.
(ml/l)
24VW
(ml/l)
#4In
Out24.480 24.480
105.27
0.23
9.38
0.79
5,671.2
32.5
608,313
98,678
368.29
0.00
215.67
0.00
#3In
Out13.270 13.270
56.33
18.42
5.16
3.32
2,835.9
428.7
576,889
142,299
348.52
26.92
199.47
18.93
#2In
Out8.270 8.270
35.11
17.55
3.22
2.37
1,670.1
283.7
552,045
155,178
333.52
34.50
190.32
21.77
#1In
Out10.330 10.330
44.42
14.61
3.96
2.63
2,157.7
318.4
561,941
157,291
340.21
28.95
198.24
17.94
#5 139.000 195.350 393.44 50.02 6,277.5 167,922 85.21 47.47
Filename: Post-Developed-LL.sc4 Printed 03-05-2020
SEDCAD 4 for WindowsCopyright 1998 -2010 Pamela J. SchwabCivil Software Design, LLC 4
Page 63
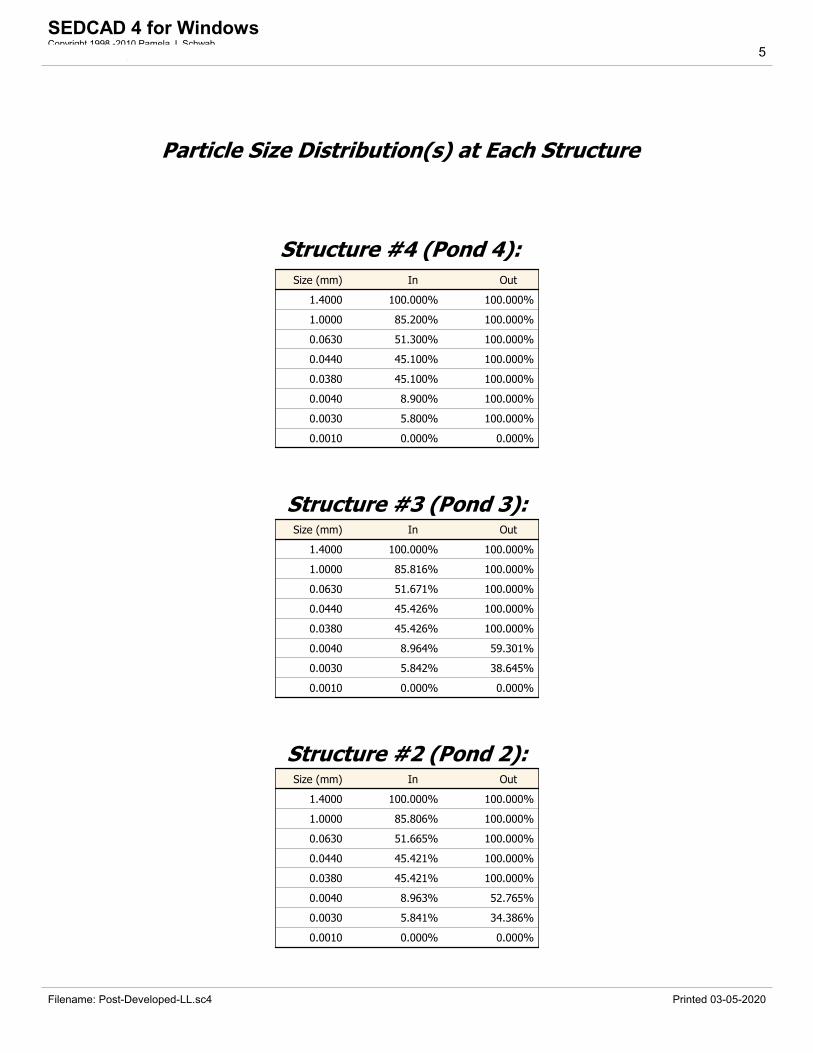
Particle Size Distribution(s) at Each Structure
Structure #4 (Pond 4):Size (mm) In Out
1.4000 100.000% 100.000%
1.0000 85.200% 100.000%
0.0630 51.300% 100.000%
0.0440 45.100% 100.000%
0.0380 45.100% 100.000%
0.0040 8.900% 100.000%
0.0030 5.800% 100.000%
0.0010 0.000% 0.000%
Structure #3 (Pond 3):Size (mm) In Out
1.4000 100.000% 100.000%
1.0000 85.816% 100.000%
0.0630 51.671% 100.000%
0.0440 45.426% 100.000%
0.0380 45.426% 100.000%
0.0040 8.964% 59.301%
0.0030 5.842% 38.645%
0.0010 0.000% 0.000%
Structure #2 (Pond 2):Size (mm) In Out
1.4000 100.000% 100.000%
1.0000 85.806% 100.000%
0.0630 51.665% 100.000%
0.0440 45.421% 100.000%
0.0380 45.421% 100.000%
0.0040 8.963% 52.765%
0.0030 5.841% 34.386%
0.0010 0.000% 0.000%
Filename: Post-Developed-LL.sc4 Printed 03-05-2020
SEDCAD 4 for WindowsCopyright 1998 -2010 Pamela J. SchwabCivil Software Design, LLC 5
Page 64
Structure #1 (Pond 1):Size (mm) In Out
1.4000 100.000% 100.000%
1.0000 85.200% 100.000%
0.0630 51.300% 100.000%
0.0440 45.100% 100.000%
0.0380 45.100% 100.000%
0.0040 8.900% 60.310%
0.0030 5.800% 39.303%
0.0010 0.000% 0.000%
Structure #5:Size (mm) In/Out
1.4000 100.000%
1.0000 100.000%
0.0630 67.549%
0.0440 61.431%
0.0380 61.431%
0.0040 18.792%
0.0030 12.426%
0.0010 0.000%
Filename: Post-Developed-LL.sc4 Printed 03-05-2020
SEDCAD 4 for WindowsCopyright 1998 -2010 Pamela J. SchwabCivil Software Design, LLC 6
Page 65
Structure Detail:Structure #4 (Pond)
Pond 4
Pond Inputs:
Initial Pool Elev: 329.50 ft
Initial Pool: 2.19 ac-ft
*Sediment Storage: 0.00 ac-ft
Dead Space: 20.00 %
*No sediment capacity defined
Enhanced Perf. Riser
RiserDiameter
(in)
Riser Height(ft)
BarrelDiameter
(in)
BarrelLength (ft)
Barrel Slope(%)
Manning's nSpillway Elev
(ft)
Number ofHoles per
Elev
31.56 8.00 24.00 106.00 1.90 0.0160 336.00 4
Emergency Spillway
Spillway ElevCrest Length
(ft)Left
SideslopeRight
SideslopeBottom
Width (ft)
337.00 31.00 6.66:1 6.66:1 20.00
Spillway ElevCrest Length
(ft)Left
SideslopeRight
SideslopeBottom
Width (ft)
337.00 31.00 6.66:1 6.66:1 20.00
Pond Results:
Peak Elevation: 334.54 ft
H'graph Detention Time: 16.37 hrs
Pond Model: CSTRS
Dewater Time: 26.50 days
Trap Efficiency: 99.43 %
Dewatering time is calculated from peak stage to lowest spillway
Elevation-Capacity-Discharge Table
ElevationArea
(ac)
Capacity
(ac-ft)
Discharge
(cfs)
DewaterTime
(hrs)
328.00 1.387 0.000 0.000 Top of Sed. Storage
328.01 1.388 0.014 0.000
328.50 1.436 0.706 0.000
Filename: Post-Developed-LL.sc4 Printed 03-05-2020
SEDCAD 4 for WindowsCopyright 1998 -2010 Pamela J. SchwabCivil Software Design, LLC 7
Page 66
ElevationArea
(ac)
Capacity
(ac-ft)
Discharge
(cfs)
DewaterTime
(hrs)
329.00 1.487 1.437 0.000
329.50 1.538 2.193 0.000
330.00 1.590 2.975 0.233 40.61*
330.50 1.641 3.782 0.233 41.95*
331.00 1.693 4.616 0.233 43.28*
331.50 1.746 5.475 0.233 44.64*
332.00 1.799 6.362 0.233 46.02*
332.50 1.851 7.274 0.233 47.39*
333.00 1.904 8.213 0.233 48.75*
333.50 1.958 9.178 0.233 50.13*
334.00 2.012 10.171 0.233 51.54*
334.50 2.066 11.190 0.233 52.94*
334.54 2.071 11.277 0.233 0.00 Peak Stage
335.00 2.120 12.236 0.233
335.50 2.175 13.310 0.233
336.00 2.231 14.412 0.233 Spillway #1
336.50 2.286 15.541 9.289
337.00 2.342 16.698 25.846 Spillway #2
337.50 2.398 17.883 56.632
338.00 2.455 19.096 85.951
*Designates time(s) to dewater have been extrapolated beyond the 50 hour hydrograph limit.
Detailed Discharge Table
Elevation(ft)
Enh. PerfRiser(cfs)
EmergencySpillway (cfs)
User-
input discharge(cfs)
Combined
Total
Discharge
(cfs)
328.00 0.000 0.000 0.000 0.000
328.01 0.000 0.000 0.000 0.000
328.50 0.000 0.000 0.000 0.000
329.00 0.000 0.000 0.000 0.000
329.50 0.000 0.000 0.000 0.000
330.00 0.000 0.000 0.233 0.233
330.50 0.000 0.000 0.233 0.233
331.00 0.000 0.000 0.233 0.233
331.50 0.000 0.000 0.233 0.233
332.00 0.000 0.000 0.233 0.233
332.50 0.000 0.000 0.233 0.233
333.00 0.000 0.000 0.233 0.233
333.50 0.000 0.000 0.233 0.233
334.00 0.000 0.000 0.233 0.233
Filename: Post-Developed-LL.sc4 Printed 03-05-2020
SEDCAD 4 for WindowsCopyright 1998 -2010 Pamela J. SchwabCivil Software Design, LLC 8
Page 67
Elevation(ft)
Enh. PerfRiser(cfs)
EmergencySpillway (cfs)
User-
input discharge(cfs)
Combined
Total
Discharge
(cfs)
334.50 0.000 0.000 0.233 0.233
335.00 0.000 0.000 0.233 0.233
335.50 0.000 0.000 0.233 0.233
336.00 0.000 0.000 0.233 0.233
336.50 9.056 0.000 0.233 9.289
337.00 25.613 0.000 0.233 25.846
337.50 32.036 24.363 0.233 56.632
338.00 36.992 48.726 0.233 85.951
Structure #3 (Pond)
Pond 3
Pond Inputs:
Initial Pool Elev: 333.50 ft
Initial Pool: 0.33 ac-ft
*Sediment Storage: 0.00 ac-ft
Dead Space: 20.00 %
*No sediment capacity defined
Enhanced Perf. Riser
RiserDiameter
(in)
Riser Height(ft)
BarrelDiameter
(in)
BarrelLength (ft)
Barrel Slope(%)
Manning's nSpillway Elev
(ft)
Number ofHoles per
Elev
31.56 8.00 24.00 188.00 1.06 0.0160 340.00 4
Emergency Spillway
Spillway ElevCrest Length
(ft)Left
SideslopeRight
SideslopeBottom
Width (ft)
341.00 31.00 6.66:1 6.66:1 20.00
Spillway ElevCrest Length
(ft)Left
SideslopeRight
SideslopeBottom
Width (ft)
341.00 31.00 6.66:1 6.66:1 20.00
Pond Results:
Peak Elevation: 340.78 ft
H'graph Detention Time: 5.11 hrs
Pond Model: CSTRS
Dewater Time: 5.08 days
Trap Efficiency: 84.88 %
Filename: Post-Developed-LL.sc4 Printed 03-05-2020
SEDCAD 4 for WindowsCopyright 1998 -2010 Pamela J. SchwabCivil Software Design, LLC 9
Page 68
Dewatering time is calculated from peak stage to lowest spillway
Elevation-Capacity-Discharge Table
ElevationArea
(ac)
Capacity
(ac-ft)
Discharge
(cfs)
DewaterTime
(hrs)
332.00 0.200 0.000 0.000 Top of Sed. Storage
332.01 0.200 0.002 0.000
332.50 0.214 0.104 0.000
333.00 0.229 0.214 0.000
333.50 0.244 0.333 0.000
334.00 0.260 0.459 0.233 6.55*
334.50 0.276 0.593 0.233 6.96*
335.00 0.292 0.735 0.233 7.37*
335.50 0.309 0.885 0.233 7.80*
336.00 0.326 1.043 0.233 8.24*
336.50 0.343 1.211 0.233 8.69*
337.00 0.361 1.387 0.233 9.14*
337.50 0.379 1.571 0.233 9.60*
338.00 0.397 1.765 0.233 10.07*
338.50 0.422 1.970 0.233 10.63*
339.00 0.448 2.188 0.233 11.29*
339.50 0.475 2.418 0.233 11.98*
340.00 0.502 2.662 0.233 12.68* Spillway #1
340.50 0.535 2.921 9.289 0.34*
340.78 0.554 3.074 18.418 0.55 Peak Stage
341.00 0.569 3.197 25.846 Spillway #2
341.50 0.604 3.491 56.632
342.00 0.640 3.801 84.492
*Designates time(s) to dewater have been extrapolated beyond the 50 hour hydrograph limit.
Detailed Discharge Table
Elevation(ft)
Enh. PerfRiser(cfs)
EmergencySpillway (cfs)
User-
input discharge(cfs)
Combined
Total
Discharge
(cfs)
332.00 0.000 0.000 0.000 0.000
332.01 0.000 0.000 0.000 0.000
332.50 0.000 0.000 0.000 0.000
333.00 0.000 0.000 0.000 0.000
333.50 0.000 0.000 0.000 0.000
334.00 0.000 0.000 0.233 0.233
334.50 0.000 0.000 0.233 0.233
Filename: Post-Developed-LL.sc4 Printed 03-05-2020
SEDCAD 4 for WindowsCopyright 1998 -2010 Pamela J. SchwabCivil Software Design, LLC 10
Page 69
Elevation(ft)
Enh. PerfRiser(cfs)
EmergencySpillway (cfs)
User-
input discharge(cfs)
Combined
Total
Discharge
(cfs)
335.00 0.000 0.000 0.233 0.233
335.50 0.000 0.000 0.233 0.233
336.00 0.000 0.000 0.233 0.233
336.50 0.000 0.000 0.233 0.233
337.00 0.000 0.000 0.233 0.233
337.50 0.000 0.000 0.233 0.233
338.00 0.000 0.000 0.233 0.233
338.50 0.000 0.000 0.233 0.233
339.00 0.000 0.000 0.233 0.233
339.50 0.000 0.000 0.233 0.233
340.00 0.000 0.000 0.233 0.233
340.50 9.056 0.000 0.233 9.289
341.00 25.613 0.000 0.233 25.846
341.50 32.036 24.363 0.233 56.632
342.00 35.533 48.726 0.233 84.492
Structure #2 (Pond)
Pond 2
Pond Inputs:
Initial Pool Elev: 374.00 ft
Initial Pool: 0.00 ac-ft
*Sediment Storage: 0.25 ac-ft
Dead Space: 20.00 %
*Sediment capacity was entered by user
Enhanced Perf. Riser
RiserDiameter
(in)
Riser Height(ft)
BarrelDiameter
(in)
BarrelLength (ft)
Barrel Slope(%)
Manning's nSpillway Elev
(ft)
Number ofHoles per
Elev
31.56 8.00 24.00 161.00 1.20 0.0160 380.00 4
Emergency Spillway
Spillway ElevCrest Length
(ft)Left
SideslopeRight
SideslopeBottom
Width (ft)
381.00 31.00 6.66:1 6.66:1 38.33
Spillway ElevCrest Length
(ft)Left
SideslopeRight
SideslopeBottom
Width (ft)
381.00 31.00 6.66:1 6.66:1 38.33
Filename: Post-Developed-LL.sc4 Printed 03-05-2020
SEDCAD 4 for WindowsCopyright 1998 -2010 Pamela J. SchwabCivil Software Design, LLC 11
Page 70
Pond Results:
Peak Elevation: 380.75 ft
H'graph Detention Time: 6.17 hrs
Pond Model: CSTRS
Dewater Time: 2.92 days
Trap Efficiency: 83.01 %
Dewatering time is calculated from peak stage to lowest spillway
Elevation-Capacity-Discharge Table
ElevationArea
(ac)
Capacity
(ac-ft)
Discharge
(cfs)
DewaterTime
(hrs)
373.99 0.146 0.000 0.000 Top of Sed. Storage
374.00 0.146 0.001 0.000
374.50 0.157 0.077 0.233 3.94*
375.00 0.169 0.158 0.233 4.24*
375.50 0.181 0.246 0.233 4.55*
376.00 0.194 0.340 0.233 4.87*
376.50 0.207 0.440 0.233 5.20*
377.00 0.220 0.546 0.233 5.53*
377.50 0.233 0.660 0.233 5.88*
378.00 0.247 0.780 0.233 6.23*
378.50 0.263 0.907 0.233 6.62*
379.00 0.279 1.043 0.233 7.04*
379.50 0.296 1.187 0.233 7.48*
380.00 0.314 1.339 0.233 7.92* Spillway #1
380.50 0.330 1.500 9.289 0.21*
380.75 0.338 1.585 17.548 0.25 Peak Stage
381.00 0.347 1.669 25.846 Spillway #2
381.50 0.364 1.847 75.613
382.00 0.381 2.033 123.913
*Designates time(s) to dewater have been extrapolated beyond the 50 hour hydrograph limit.
Detailed Discharge Table
Elevation(ft)
Enh. PerfRiser(cfs)
EmergencySpillway (cfs)
User-
input discharge(cfs)
Combined
Total
Discharge
(cfs)
373.99 0.000 0.000 0.000 0.000
374.00 0.000 0.000 0.000 0.000
374.50 0.000 0.000 0.233 0.233
375.00 0.000 0.000 0.233 0.233
Filename: Post-Developed-LL.sc4 Printed 03-05-2020
SEDCAD 4 for WindowsCopyright 1998 -2010 Pamela J. SchwabCivil Software Design, LLC 12
Page 71
Elevation(ft)
Enh. PerfRiser(cfs)
EmergencySpillway (cfs)
User-
input discharge(cfs)
Combined
Total
Discharge
(cfs)
375.50 0.000 0.000 0.233 0.233
376.00 0.000 0.000 0.233 0.233
376.50 0.000 0.000 0.233 0.233
377.00 0.000 0.000 0.233 0.233
377.50 0.000 0.000 0.233 0.233
378.00 0.000 0.000 0.233 0.233
378.50 0.000 0.000 0.233 0.233
379.00 0.000 0.000 0.233 0.233
379.50 0.000 0.000 0.233 0.233
380.00 0.000 0.000 0.233 0.233
380.50 9.056 0.000 0.233 9.289
381.00 25.613 0.000 0.233 25.846
381.50 32.036 43.344 0.233 75.613
382.00 36.992 86.688 0.233 123.913
Structure #1 (Pond)
Pond 1
Pond Inputs:
Initial Pool Elev: 388.00 ft
Initial Pool: 0.00 ac-ft
*Sediment Storage: 0.36 ac-ft
Dead Space: 20.00 %
*Sediment capacity was entered by user
Enhanced Perf. Riser
RiserDiameter
(in)
Riser Height(ft)
BarrelDiameter
(in)
BarrelLength (ft)
Barrel Slope(%)
Manning's nSpillway Elev
(ft)
Number ofHoles per
Elev
31.56 8.00 24.00 117.00 1.70 0.0160 394.00 4
Emergency Spillway
Spillway ElevCrest Length
(ft)Left
SideslopeRight
SideslopeBottom
Width (ft)
395.00 31.00 6.66:1 6.66:1 20.00
Spillway ElevCrest Length
(ft)Left
SideslopeRight
SideslopeBottom
Width (ft)
395.00 31.00 6.66:1 6.66:1 20.00
Pond Results:
Filename: Post-Developed-LL.sc4 Printed 03-05-2020
SEDCAD 4 for WindowsCopyright 1998 -2010 Pamela J. SchwabCivil Software Design, LLC 13
Page 72
Peak Elevation: 394.66 ft
H'graph Detention Time: 6.00 hrs
Pond Model: CSTRS
Dewater Time: 3.97 days
Trap Efficiency: 85.24 %
Dewatering time is calculated from peak stage to lowest spillway
Elevation-Capacity-Discharge Table
ElevationArea
(ac)
Capacity
(ac-ft)
Discharge
(cfs)
DewaterTime
(hrs)
388.00 0.208 0.000 0.000 Top of Sed. Storage
388.00 0.208 0.001 0.000
388.50 0.222 0.108 0.233 5.58*
389.00 0.236 0.223 0.233 5.94*
389.50 0.251 0.344 0.233 6.32*
390.00 0.266 0.474 0.233 6.71*
390.50 0.281 0.610 0.233 7.10*
391.00 0.296 0.755 0.233 7.49*
391.50 0.312 0.907 0.233 7.89*
392.00 0.328 1.067 0.233 8.31*
392.50 0.352 1.237 0.233 8.83*
393.00 0.377 1.419 0.233 9.47*
393.50 0.403 1.614 0.233 10.13*
394.00 0.430 1.822 0.233 10.82* Spillway #1
394.50 0.461 2.045 9.289 0.29*
394.66 0.472 2.121 14.609 0.35 Peak Stage
395.00 0.493 2.283 25.846 Spillway #2
395.50 0.526 2.538 56.632
396.00 0.560 2.809 85.951
*Designates time(s) to dewater have been extrapolated beyond the 50 hour hydrograph limit.
Detailed Discharge Table
Elevation(ft)
Enh. PerfRiser(cfs)
EmergencySpillway (cfs)
User-
input discharge(cfs)
Combined
Total
Discharge
(cfs)
388.00 0.000 0.000 0.000 0.000
388.00 0.000 0.000 0.000 0.000
388.50 0.000 0.000 0.233 0.233
389.00 0.000 0.000 0.233 0.233
389.50 0.000 0.000 0.233 0.233
390.00 0.000 0.000 0.233 0.233
Filename: Post-Developed-LL.sc4 Printed 03-05-2020
SEDCAD 4 for WindowsCopyright 1998 -2010 Pamela J. SchwabCivil Software Design, LLC 14
Page 73
Elevation(ft)
Enh. PerfRiser(cfs)
EmergencySpillway (cfs)
User-
input discharge(cfs)
Combined
Total
Discharge
(cfs)
390.50 0.000 0.000 0.233 0.233
391.00 0.000 0.000 0.233 0.233
391.50 0.000 0.000 0.233 0.233
392.00 0.000 0.000 0.233 0.233
392.50 0.000 0.000 0.233 0.233
393.00 0.000 0.000 0.233 0.233
393.50 0.000 0.000 0.233 0.233
394.00 0.000 0.000 0.233 0.233
394.50 9.056 0.000 0.233 9.289
395.00 25.613 0.000 0.233 25.846
395.50 32.036 24.363 0.233 56.632
396.00 36.992 48.726 0.233 85.951
Structure #5 (Null)
Hydrologic Point of Interest/pond bypass
Filename: Post-Developed-LL.sc4 Printed 03-05-2020
SEDCAD 4 for WindowsCopyright 1998 -2010 Pamela J. SchwabCivil Software Design, LLC 15
Page 74
Subwatershed Hydrology Detail:
Stru#
SWS#
SWS Area
(ac)
Time ofConc
(hrs)
Musk K
(hrs)Musk X
Curve
NumberUHS
PeakDischarge
(cfs)
RunoffVolume
(ac-ft)
#4 1 24.480 0.096 0.000 0.000 86.000 TR55 105.27 9.376
24.480 105.27 9.376
#3 1 13.270 0.167 0.000 0.000 86.000 TR55 56.33 5.165
13.270 56.33 5.165
#2 1 8.270 0.141 0.000 0.000 86.000 TR55 35.11 3.219
8.270 35.11 3.219
#1 1 10.330 0.088 0.000 0.000 86.000 TR55 44.42 3.956
10.330 44.42 3.956
#5 1 139.000 0.527 0.000 0.000 76.000 TR55 371.51 40.912
195.350 393.44 50.019
Subwatershed Sedimentology Detail:
Stru#
SWS#
Soil K L (ft) S (%) C P PS #Sediment
(tons)
PeakSediment
Conc.
(mg/l)
PeakSettleable
Conc
(ml/l)
24VW
(ml/l)
#4 1 0.320 60.00 33.33 0.9000 1.0000 1 5,671.2 608,313 368.29 215.67
5,671.2 608,313 368.29 215.67
#3 1 0.320 60.00 33.33 0.9000 1.0000 1 2,835.9 576,889 348.52 199.47
2,835.9 576,889 348.52 199.47
#2 1 0.320 60.00 33.33 0.9000 1.0000 1 1,670.1 552,045 333.52 190.32
1,670.1 552,045 333.52 190.32
#1 1 0.320 60.00 33.33 0.9000 1.0000 1 2,157.7 561,941 340.21 198.24
2,157.7 561,941 340.21 198.24
#5 1 0.320 100.00 14.00 0.3500 1.0000 1 5,214.8 157,908 90.35 51.07
6,277.5 167,922 85.21 47.47
Subwatershed Time of Concentration Details:Stru#
SWS#
Land Flow Condition Slope (%)Vert. Dist.
(ft)Horiz. Dist.
(ft)Velocity
(fps)Time (hrs)
#1 15. Nearly bare and untilled, andalluvial valley fans
10.00 2.50 25.00 3.160 0.002
6. Grassed waterway 2.49 17.00 683.00 2.360 0.080
Filename: Post-Developed-LL.sc4 Printed 03-05-2020
SEDCAD 4 for WindowsCopyright 1998 -2010 Pamela J. SchwabCivil Software Design, LLC 16
Page 75
Stru#
SWS#
Land Flow Condition Slope (%)Vert. Dist.
(ft)Horiz. Dist.
(ft)Velocity
(fps)Time (hrs)
8. Large gullies, diversions, and lowflowing streams
28.16 69.00 245.00 15.920 0.004
9. Small streams flowing bankfull 0.50 0.23 46.00 6.360 0.002
#1 1 Time of Concentration: 0.088
#2 15. Nearly bare and untilled, andalluvial valley fans
10.00 2.50 25.00 3.160 0.002
6. Grassed waterway 1.26 10.00 793.02 1.680 0.131
8. Large gullies, diversions, and lowflowing streams
23.43 82.00 350.00 14.520 0.006
9. Small streams flowing bankfull 5.00 8.00 160.00 20.120 0.002
#2 1 Time of Concentration: 0.141
#3 15. Nearly bare and untilled, andalluvial valley fans
22.92 22.00 96.00 4.780 0.005
7. Paved area and small uplandgullies
1.66 14.00 844.03 2.590 0.090
7. Paved area and small uplandgullies
6.74 70.00 1,038.00 5.220 0.055
7. Paved area and small uplandgullies
3.48 8.00 230.00 3.750 0.017
#3 1 Time of Concentration: 0.167
#4 15. Nearly bare and untilled, andalluvial valley fans
1.00 1.15 115.00 1.000 0.031
8. Large gullies, diversions, and lowflowing streams
2171.00 2,171.00 100.00 139.780 0.000
5. Nearly bare and untilled, andalluvial valley fans
2.63 10.00 380.01 1.620 0.065
#4 1 Time of Concentration: 0.096
#5 1 1. Forest with heavy ground litter 9.82 100.00 1,018.00 0.790 0.357
9. Small streams flowing bankfull 1.17 70.00 5,984.44 9.730 0.170
#5 1 Time of Concentration: 0.527
Filename: Post-Developed-LL.sc4 Printed 03-05-2020
SEDCAD 4 for WindowsCopyright 1998 -2010 Pamela J. SchwabCivil Software Design, LLC 17
Page 76
Vulcan Fairfield Quarry
Pre-development Calculations
100-year 24-hour Storm Event
8.0 inches
N. Davis
Filename: Pre-Developed.sc4 Printed 02-13-2020
SEDCAD 4 for WindowsCopyright 1998 -2010 Pamela J. SchwabCivil Software Design, LLC 1
Page 77
General Information
Storm Information:Storm Type: NRCS Type II
Design Storm: 100 yr - 24 hr
Rainfall Depth: 8.000 inches
Filename: Pre-Developed.sc4 Printed 02-13-2020
SEDCAD 4 for WindowsCopyright 1998 -2010 Pamela J. SchwabCivil Software Design, LLC 2
Page 78
Structure Networking:
TypeStru#
(flowsinto)
Stru#
Musk. K(hrs)
Musk. X Description
Null #1 ==> End 0.000 0.000 Hydrologic Point of Interest
#1
Null
Filename: Pre-Developed.sc4 Printed 02-13-2020
SEDCAD 4 for WindowsCopyright 1998 -2010 Pamela J. SchwabCivil Software Design, LLC 3
Page 79
Structure Summary:Immediate
ContributingArea
(ac)
TotalContributing
Area
(ac)
PeakDischarge
(cfs)
TotalRunoffVolume
(ac-ft)
#1 195.350 195.350 713.99 83.50
Filename: Pre-Developed.sc4 Printed 02-13-2020
SEDCAD 4 for WindowsCopyright 1998 -2010 Pamela J. SchwabCivil Software Design, LLC 4
Page 80
Structure Detail:
Structure #1 (Null)
Hydrologic Point of Interest
Filename: Pre-Developed.sc4 Printed 02-13-2020
SEDCAD 4 for WindowsCopyright 1998 -2010 Pamela J. SchwabCivil Software Design, LLC 5
Page 81
Subwatershed Hydrology Detail:
Stru#
SWS#
SWS Area
(ac)
Time ofConc
(hrs)
Musk K
(hrs)Musk X
Curve
NumberUHS
PeakDischarge
(cfs)
RunoffVolume
(ac-ft)
#1 1 195.350 0.596 0.000 0.000 76.000 TR55 713.99 83.496
195.350 713.99 83.496
Subwatershed Time of Concentration Details:Stru#
SWS#
Land Flow Condition Slope (%)Vert. Dist.
(ft)Horiz. Dist.
(ft)Velocity
(fps)Time (hrs)
#1 1 1. Forest with heavy ground litter 12.96 14.00 108.00 0.910 0.032
1. Forest with heavy ground litter 23.75 62.00 261.00 1.230 0.058
8. Large gullies, diversions, and lowflowing streams
1.48 98.00 6,632.00 3.640 0.506
#1 1 Time of Concentration: 0.596
Filename: Pre-Developed.sc4 Printed 02-13-2020
SEDCAD 4 for WindowsCopyright 1998 -2010 Pamela J. SchwabCivil Software Design, LLC 6
Page 82
Vulcan Fairfield Quarry
Post-development Calculations
100-year 24-hour Storm Event
8.0 inches
N. Davis
Filename: Post-Developed-LL.sc4 Printed 03-05-2020
SEDCAD 4 for WindowsCopyright 1998 -2010 Pamela J. SchwabCivil Software Design, LLC 1
Page 83
General Information
Storm Information:Storm Type: NRCS Type II
Design Storm: 100 yr - 24 hr
Rainfall Depth: 8.000 inches
Particle Size Distribution:Size (mm) Wilkes
1.4000 100.000%
1.0000 85.200%
0.0630 51.300%
0.0440 45.100%
0.0380 45.100%
0.0040 8.900%
0.0030 5.800%
0.0010 0.000%
Filename: Post-Developed-LL.sc4 Printed 03-05-2020
SEDCAD 4 for WindowsCopyright 1998 -2010 Pamela J. SchwabCivil Software Design, LLC 2
Page 84
Structure Networking:
TypeStru#
(flowsinto)
Stru#
Musk. K(hrs)
Musk. X Description
Pond #1 ==> #5 0.195 0.425 Pond 1
Pond #2 ==> #5 0.132 0.402 Pond 2
Pond #3 ==> #5 0.264 0.395 Pond 3
Pond #4 ==> #5 0.237 0.398 Pond 4
Null #5 ==> End 0.000 0.000Hydrologic Point of Interest/pondbypass
#4
Pond
#3
Pond
#2
Pond
#1
Pond
#5
Null
Structure Routing Details:Stru#
Land Flow Condition Slope (%)Vert. Dist.
(ft)Horiz. Dist.
(ft)Velocity
(fps)Time (hrs)
#1 1. Forest with heavy ground litter 17.02 16.00 94.00 1.04 0.025
9. Small streams flowing bankfull 1.17 70.00 5,984.44 9.73 0.170
#1 Muskingum K: 0.195
#28. Large gullies, diversions, and lowflowing streams
5.71 56.00 981.02 7.16 0.038
9. Small streams flowing bankfull 0.59 14.00 2,355.31 6.93 0.094
#2 Muskingum K: 0.132
#3 1. Forest with heavy ground litter 4.39 14.00 319.00 0.53 0.167
9. Small streams flowing bankfull 0.64 16.00 2,509.01 7.18 0.097
#3 Muskingum K: 0.264
#4 1. Forest with heavy ground litter 4.33 12.00 277.00 0.52 0.147
9. Small streams flowing bankfull 0.67 16.00 2,404.20 7.34 0.090
#4 Muskingum K: 0.237
Filename: Post-Developed-LL.sc4 Printed 03-05-2020
SEDCAD 4 for WindowsCopyright 1998 -2010 Pamela J. SchwabCivil Software Design, LLC 3
Page 85
Structure Summary:Immediate
ContributingArea
(ac)
TotalContributing
Area
(ac)
PeakDischarge
(cfs)
TotalRunoffVolume
(ac-ft)
Sediment
(tons)
PeakSediment
Conc.
(mg/l)
PeakSettleable
Conc.
(ml/l)
24VW
(ml/l)
#4In
Out24.480 24.480
140.46
1.80
12.91
1.12
7,971.5
57.9
617,272
114,644
373.71
0.00
219.08
0.00
#3In
Out13.270 13.270
75.82
56.74
7.11
5.26
4,005.5
854.3
589,691
172,390
356.76
47.86
203.82
33.55
#2In
Out8.270 8.270
47.26
44.10
4.43
3.58
2,358.9
533.5
564,456
179,618
341.51
52.03
194.52
33.45
#1In
Out10.330 10.330
59.27
49.14
5.45
4.12
3,032.9
631.5
570,423
176,933
345.35
48.30
201.44
31.97
#5 139.000 195.350 634.74 73.47 9,994.9 180,356 92.52 52.11
Filename: Post-Developed-LL.sc4 Printed 03-05-2020
SEDCAD 4 for WindowsCopyright 1998 -2010 Pamela J. SchwabCivil Software Design, LLC 4
Page 86
Particle Size Distribution(s) at Each Structure
Structure #4 (Pond 4):Size (mm) In Out
1.4000 100.000% 100.000%
1.0000 85.200% 100.000%
0.0630 51.300% 100.000%
0.0440 45.100% 100.000%
0.0380 45.100% 100.000%
0.0040 8.900% 100.000%
0.0030 5.800% 100.000%
0.0010 0.000% 0.000%
Structure #3 (Pond 3):Size (mm) In Out
1.4000 100.000% 100.000%
1.0000 85.402% 100.000%
0.0630 51.421% 100.000%
0.0440 45.207% 100.000%
0.0380 45.207% 100.000%
0.0040 8.921% 41.826%
0.0030 5.814% 27.258%
0.0010 0.000% 0.000%
Structure #2 (Pond 2):Size (mm) In Out
1.4000 100.000% 100.000%
1.0000 85.392% 100.000%
0.0630 51.415% 100.000%
0.0440 45.201% 100.000%
0.0380 45.201% 100.000%
0.0040 8.920% 39.441%
0.0030 5.813% 25.703%
0.0010 0.000% 0.000%
Filename: Post-Developed-LL.sc4 Printed 03-05-2020
SEDCAD 4 for WindowsCopyright 1998 -2010 Pamela J. SchwabCivil Software Design, LLC 5
Page 87
Structure #1 (Pond 1):Size (mm) In Out
1.4000 100.000% 100.000%
1.0000 85.200% 100.000%
0.0630 51.300% 100.000%
0.0440 45.100% 100.000%
0.0380 45.100% 100.000%
0.0040 8.900% 42.748%
0.0030 5.800% 27.858%
0.0010 0.000% 0.000%
Structure #5:Size (mm) In/Out
1.4000 100.000%
1.0000 99.340%
0.0630 68.078%
0.0440 62.361%
0.0380 62.361%
0.0040 17.167%
0.0030 11.389%
0.0010 0.000%
Filename: Post-Developed-LL.sc4 Printed 03-05-2020
SEDCAD 4 for WindowsCopyright 1998 -2010 Pamela J. SchwabCivil Software Design, LLC 6
Page 88
Structure Detail:Structure #4 (Pond)
Pond 4
Pond Inputs:
Initial Pool Elev: 329.50 ft
Initial Pool: 2.19 ac-ft
*Sediment Storage: 0.00 ac-ft
Dead Space: 20.00 %
*No sediment capacity defined
Enhanced Perf. Riser
RiserDiameter
(in)
Riser Height(ft)
BarrelDiameter
(in)
BarrelLength (ft)
Barrel Slope(%)
Manning's nSpillway Elev
(ft)
Number ofHoles per
Elev
31.56 8.00 24.00 106.00 1.90 0.0160 336.00 4
Emergency Spillway
Spillway ElevCrest Length
(ft)Left
SideslopeRight
SideslopeBottom
Width (ft)
337.00 31.00 6.66:1 6.66:1 20.00
Spillway ElevCrest Length
(ft)Left
SideslopeRight
SideslopeBottom
Width (ft)
337.00 31.00 6.66:1 6.66:1 20.00
Pond Results:
Peak Elevation: 336.09 ft
H'graph Detention Time: 14.53 hrs
Pond Model: CSTRS
Dewater Time: 27.58 days
Trap Efficiency: 99.27 %
Dewatering time is calculated from peak stage to lowest spillway
Elevation-Capacity-Discharge Table
ElevationArea
(ac)
Capacity
(ac-ft)
Discharge
(cfs)
DewaterTime
(hrs)
328.00 1.387 0.000 0.000 Top of Sed. Storage
328.01 1.388 0.014 0.000
328.50 1.436 0.706 0.000
Filename: Post-Developed-LL.sc4 Printed 03-05-2020
SEDCAD 4 for WindowsCopyright 1998 -2010 Pamela J. SchwabCivil Software Design, LLC 7
Page 89
ElevationArea
(ac)
Capacity
(ac-ft)
Discharge
(cfs)
DewaterTime
(hrs)
329.00 1.487 1.437 0.000
329.50 1.538 2.193 0.000
330.00 1.590 2.975 0.233 40.61*
330.50 1.641 3.782 0.233 41.95*
331.00 1.693 4.616 0.233 43.28*
331.50 1.746 5.475 0.233 44.64*
332.00 1.799 6.362 0.233 46.02*
332.50 1.851 7.274 0.233 47.39*
333.00 1.904 8.213 0.233 48.75*
333.50 1.958 9.178 0.233 50.13*
334.00 2.012 10.171 0.233 51.54*
334.50 2.066 11.190 0.233 52.94*
335.00 2.120 12.236 0.233 54.34*
335.50 2.175 13.310 0.233 55.76*
336.00 2.231 14.412 0.233 57.20* Spillway #1
336.09 2.240 14.607 1.800 26.00 Peak Stage
336.50 2.286 15.541 9.289
337.00 2.342 16.698 25.846 Spillway #2
337.50 2.398 17.883 56.632
338.00 2.455 19.096 85.951
*Designates time(s) to dewater have been extrapolated beyond the 50 hour hydrograph limit.
Detailed Discharge Table
Elevation(ft)
Enh. PerfRiser(cfs)
EmergencySpillway (cfs)
User-
input discharge(cfs)
Combined
Total
Discharge
(cfs)
328.00 0.000 0.000 0.000 0.000
328.01 0.000 0.000 0.000 0.000
328.50 0.000 0.000 0.000 0.000
329.00 0.000 0.000 0.000 0.000
329.50 0.000 0.000 0.000 0.000
330.00 0.000 0.000 0.233 0.233
330.50 0.000 0.000 0.233 0.233
331.00 0.000 0.000 0.233 0.233
331.50 0.000 0.000 0.233 0.233
332.00 0.000 0.000 0.233 0.233
332.50 0.000 0.000 0.233 0.233
333.00 0.000 0.000 0.233 0.233
333.50 0.000 0.000 0.233 0.233
334.00 0.000 0.000 0.233 0.233
Filename: Post-Developed-LL.sc4 Printed 03-05-2020
SEDCAD 4 for WindowsCopyright 1998 -2010 Pamela J. SchwabCivil Software Design, LLC 8
Page 90
Elevation(ft)
Enh. PerfRiser(cfs)
EmergencySpillway (cfs)
User-
input discharge(cfs)
Combined
Total
Discharge
(cfs)
334.50 0.000 0.000 0.233 0.233
335.00 0.000 0.000 0.233 0.233
335.50 0.000 0.000 0.233 0.233
336.00 0.000 0.000 0.233 0.233
336.50 9.056 0.000 0.233 9.289
337.00 25.613 0.000 0.233 25.846
337.50 32.036 24.363 0.233 56.632
338.00 36.992 48.726 0.233 85.951
Structure #3 (Pond)
Pond 3
Pond Inputs:
Initial Pool Elev: 333.50 ft
Initial Pool: 0.33 ac-ft
*Sediment Storage: 0.00 ac-ft
Dead Space: 20.00 %
*No sediment capacity defined
Enhanced Perf. Riser
RiserDiameter
(in)
Riser Height(ft)
BarrelDiameter
(in)
BarrelLength (ft)
Barrel Slope(%)
Manning's nSpillway Elev
(ft)
Number ofHoles per
Elev
31.56 8.00 24.00 188.00 1.06 0.0160 340.00 4
Emergency Spillway
Spillway ElevCrest Length
(ft)Left
SideslopeRight
SideslopeBottom
Width (ft)
341.00 31.00 6.66:1 6.66:1 20.00
Spillway ElevCrest Length
(ft)Left
SideslopeRight
SideslopeBottom
Width (ft)
341.00 31.00 6.66:1 6.66:1 20.00
Pond Results:
Peak Elevation: 341.50 ft
H'graph Detention Time: 3.45 hrs
Pond Model: CSTRS
Dewater Time: 5.09 days
Trap Efficiency: 78.67 %
Filename: Post-Developed-LL.sc4 Printed 03-05-2020
SEDCAD 4 for WindowsCopyright 1998 -2010 Pamela J. SchwabCivil Software Design, LLC 9
Page 91
Dewatering time is calculated from peak stage to lowest spillway
Elevation-Capacity-Discharge Table
ElevationArea
(ac)
Capacity
(ac-ft)
Discharge
(cfs)
DewaterTime
(hrs)
332.00 0.200 0.000 0.000 Top of Sed. Storage
332.01 0.200 0.002 0.000
332.50 0.214 0.104 0.000
333.00 0.229 0.214 0.000
333.50 0.244 0.333 0.000
334.00 0.260 0.459 0.233 6.55*
334.50 0.276 0.593 0.233 6.96*
335.00 0.292 0.735 0.233 7.37*
335.50 0.309 0.885 0.233 7.80*
336.00 0.326 1.043 0.233 8.24*
336.50 0.343 1.211 0.233 8.69*
337.00 0.361 1.387 0.233 9.14*
337.50 0.379 1.571 0.233 9.60*
338.00 0.397 1.765 0.233 10.07*
338.50 0.422 1.970 0.233 10.63*
339.00 0.448 2.188 0.233 11.29*
339.50 0.475 2.418 0.233 11.98*
340.00 0.502 2.662 0.233 12.68* Spillway #1
340.50 0.535 2.921 9.289 0.34*
341.00 0.569 3.197 25.846 0.70 Spillway #2
341.50 0.604 3.491 56.632
341.50 0.605 3.492 56.738 0.20 Peak Stage
342.00 0.640 3.801 84.492
*Designates time(s) to dewater have been extrapolated beyond the 50 hour hydrograph limit.
Detailed Discharge Table
Elevation(ft)
Enh. PerfRiser(cfs)
EmergencySpillway (cfs)
User-
input discharge(cfs)
Combined
Total
Discharge
(cfs)
332.00 0.000 0.000 0.000 0.000
332.01 0.000 0.000 0.000 0.000
332.50 0.000 0.000 0.000 0.000
333.00 0.000 0.000 0.000 0.000
333.50 0.000 0.000 0.000 0.000
334.00 0.000 0.000 0.233 0.233
334.50 0.000 0.000 0.233 0.233
Filename: Post-Developed-LL.sc4 Printed 03-05-2020
SEDCAD 4 for WindowsCopyright 1998 -2010 Pamela J. SchwabCivil Software Design, LLC 10
Page 92
Elevation(ft)
Enh. PerfRiser(cfs)
EmergencySpillway (cfs)
User-
input discharge(cfs)
Combined
Total
Discharge
(cfs)
335.00 0.000 0.000 0.233 0.233
335.50 0.000 0.000 0.233 0.233
336.00 0.000 0.000 0.233 0.233
336.50 0.000 0.000 0.233 0.233
337.00 0.000 0.000 0.233 0.233
337.50 0.000 0.000 0.233 0.233
338.00 0.000 0.000 0.233 0.233
338.50 0.000 0.000 0.233 0.233
339.00 0.000 0.000 0.233 0.233
339.50 0.000 0.000 0.233 0.233
340.00 0.000 0.000 0.233 0.233
340.50 9.056 0.000 0.233 9.289
341.00 25.613 0.000 0.233 25.846
341.50 32.036 24.363 0.233 56.632
342.00 35.533 48.726 0.233 84.492
Structure #2 (Pond)
Pond 2
Pond Inputs:
Initial Pool Elev: 374.00 ft
Initial Pool: 0.00 ac-ft
*Sediment Storage: 0.25 ac-ft
Dead Space: 20.00 %
*Sediment capacity was entered by user
Enhanced Perf. Riser
RiserDiameter
(in)
Riser Height(ft)
BarrelDiameter
(in)
BarrelLength (ft)
Barrel Slope(%)
Manning's nSpillway Elev
(ft)
Number ofHoles per
Elev
31.56 8.00 24.00 161.00 1.20 0.0160 380.00 4
Emergency Spillway
Spillway ElevCrest Length
(ft)Left
SideslopeRight
SideslopeBottom
Width (ft)
381.00 31.00 6.66:1 6.66:1 38.33
Spillway ElevCrest Length
(ft)Left
SideslopeRight
SideslopeBottom
Width (ft)
381.00 31.00 6.66:1 6.66:1 38.33
Filename: Post-Developed-LL.sc4 Printed 03-05-2020
SEDCAD 4 for WindowsCopyright 1998 -2010 Pamela J. SchwabCivil Software Design, LLC 11
Page 93
Pond Results:
Peak Elevation: 381.18 ft
H'graph Detention Time: 4.26 hrs
Pond Model: CSTRS
Dewater Time: 2.93 days
Trap Efficiency: 77.38 %
Dewatering time is calculated from peak stage to lowest spillway
Elevation-Capacity-Discharge Table
ElevationArea
(ac)
Capacity
(ac-ft)
Discharge
(cfs)
DewaterTime
(hrs)
373.99 0.146 0.000 0.000 Top of Sed. Storage
374.00 0.146 0.001 0.000
374.50 0.157 0.077 0.233 3.94*
375.00 0.169 0.158 0.233 4.24*
375.50 0.181 0.246 0.233 4.55*
376.00 0.194 0.340 0.233 4.87*
376.50 0.207 0.440 0.233 5.20*
377.00 0.220 0.546 0.233 5.53*
377.50 0.233 0.660 0.233 5.88*
378.00 0.247 0.780 0.233 6.23*
378.50 0.263 0.907 0.233 6.62*
379.00 0.279 1.043 0.233 7.04*
379.50 0.296 1.187 0.233 7.48*
380.00 0.314 1.339 0.233 7.92* Spillway #1
380.50 0.330 1.500 9.289 0.21*
381.00 0.347 1.669 25.846 0.45 Spillway #2
381.18 0.353 1.735 44.098 0.10 Peak Stage
381.50 0.364 1.847 75.613
382.00 0.381 2.033 123.913
*Designates time(s) to dewater have been extrapolated beyond the 50 hour hydrograph limit.
Detailed Discharge Table
Elevation(ft)
Enh. PerfRiser(cfs)
EmergencySpillway (cfs)
User-
input discharge(cfs)
Combined
Total
Discharge
(cfs)
373.99 0.000 0.000 0.000 0.000
374.00 0.000 0.000 0.000 0.000
374.50 0.000 0.000 0.233 0.233
375.00 0.000 0.000 0.233 0.233
Filename: Post-Developed-LL.sc4 Printed 03-05-2020
SEDCAD 4 for WindowsCopyright 1998 -2010 Pamela J. SchwabCivil Software Design, LLC 12
Page 94
Elevation(ft)
Enh. PerfRiser(cfs)
EmergencySpillway (cfs)
User-
input discharge(cfs)
Combined
Total
Discharge
(cfs)
375.50 0.000 0.000 0.233 0.233
376.00 0.000 0.000 0.233 0.233
376.50 0.000 0.000 0.233 0.233
377.00 0.000 0.000 0.233 0.233
377.50 0.000 0.000 0.233 0.233
378.00 0.000 0.000 0.233 0.233
378.50 0.000 0.000 0.233 0.233
379.00 0.000 0.000 0.233 0.233
379.50 0.000 0.000 0.233 0.233
380.00 0.000 0.000 0.233 0.233
380.50 9.056 0.000 0.233 9.289
381.00 25.613 0.000 0.233 25.846
381.50 32.036 43.344 0.233 75.613
382.00 36.992 86.688 0.233 123.913
Structure #1 (Pond)
Pond 1
Pond Inputs:
Initial Pool Elev: 388.00 ft
Initial Pool: 0.00 ac-ft
*Sediment Storage: 0.36 ac-ft
Dead Space: 20.00 %
*Sediment capacity was entered by user
Enhanced Perf. Riser
RiserDiameter
(in)
Riser Height(ft)
BarrelDiameter
(in)
BarrelLength (ft)
Barrel Slope(%)
Manning's nSpillway Elev
(ft)
Number ofHoles per
Elev
31.56 8.00 24.00 117.00 1.70 0.0160 394.00 4
Emergency Spillway
Spillway ElevCrest Length
(ft)Left
SideslopeRight
SideslopeBottom
Width (ft)
395.00 31.00 6.66:1 6.66:1 20.00
Spillway ElevCrest Length
(ft)Left
SideslopeRight
SideslopeBottom
Width (ft)
395.00 31.00 6.66:1 6.66:1 20.00
Pond Results:
Filename: Post-Developed-LL.sc4 Printed 03-05-2020
SEDCAD 4 for WindowsCopyright 1998 -2010 Pamela J. SchwabCivil Software Design, LLC 13
Page 95
Peak Elevation: 395.38 ft
H'graph Detention Time: 4.04 hrs
Pond Model: CSTRS
Dewater Time: 3.98 days
Trap Efficiency: 79.18 %
Dewatering time is calculated from peak stage to lowest spillway
Elevation-Capacity-Discharge Table
ElevationArea
(ac)
Capacity
(ac-ft)
Discharge
(cfs)
DewaterTime
(hrs)
388.00 0.208 0.000 0.000 Top of Sed. Storage
388.00 0.208 0.001 0.000
388.50 0.222 0.108 0.233 5.58*
389.00 0.236 0.223 0.233 5.94*
389.50 0.251 0.344 0.233 6.32*
390.00 0.266 0.474 0.233 6.71*
390.50 0.281 0.610 0.233 7.10*
391.00 0.296 0.755 0.233 7.49*
391.50 0.312 0.907 0.233 7.89*
392.00 0.328 1.067 0.233 8.31*
392.50 0.352 1.237 0.233 8.83*
393.00 0.377 1.419 0.233 9.47*
393.50 0.403 1.614 0.233 10.13*
394.00 0.430 1.822 0.233 10.82* Spillway #1
394.50 0.461 2.045 9.289 0.29*
395.00 0.493 2.283 25.846 0.50 Spillway #2
395.38 0.518 2.476 49.136 0.10 Peak Stage
395.50 0.526 2.538 56.632
396.00 0.560 2.809 85.951
*Designates time(s) to dewater have been extrapolated beyond the 50 hour hydrograph limit.
Detailed Discharge Table
Elevation(ft)
Enh. PerfRiser(cfs)
EmergencySpillway (cfs)
User-
input discharge(cfs)
Combined
Total
Discharge
(cfs)
388.00 0.000 0.000 0.000 0.000
388.00 0.000 0.000 0.000 0.000
388.50 0.000 0.000 0.233 0.233
389.00 0.000 0.000 0.233 0.233
389.50 0.000 0.000 0.233 0.233
390.00 0.000 0.000 0.233 0.233
Filename: Post-Developed-LL.sc4 Printed 03-05-2020
SEDCAD 4 for WindowsCopyright 1998 -2010 Pamela J. SchwabCivil Software Design, LLC 14
Page 96
Elevation(ft)
Enh. PerfRiser(cfs)
EmergencySpillway (cfs)
User-
input discharge(cfs)
Combined
Total
Discharge
(cfs)
390.50 0.000 0.000 0.233 0.233
391.00 0.000 0.000 0.233 0.233
391.50 0.000 0.000 0.233 0.233
392.00 0.000 0.000 0.233 0.233
392.50 0.000 0.000 0.233 0.233
393.00 0.000 0.000 0.233 0.233
393.50 0.000 0.000 0.233 0.233
394.00 0.000 0.000 0.233 0.233
394.50 9.056 0.000 0.233 9.289
395.00 25.613 0.000 0.233 25.846
395.50 32.036 24.363 0.233 56.632
396.00 36.992 48.726 0.233 85.951
Structure #5 (Null)
Hydrologic Point of Interest/pond bypass
Filename: Post-Developed-LL.sc4 Printed 03-05-2020
SEDCAD 4 for WindowsCopyright 1998 -2010 Pamela J. SchwabCivil Software Design, LLC 15
Page 97
Subwatershed Hydrology Detail:
Stru#
SWS#
SWS Area
(ac)
Time ofConc
(hrs)
Musk K
(hrs)Musk X
Curve
NumberUHS
PeakDischarge
(cfs)
RunoffVolume
(ac-ft)
#4 1 24.480 0.096 0.000 0.000 86.000 TR55 140.46 12.907
24.480 140.46 12.907
#3 1 13.270 0.167 0.000 0.000 86.000 TR55 75.82 7.109
13.270 75.82 7.109
#2 1 8.270 0.141 0.000 0.000 86.000 TR55 47.26 4.431
8.270 47.26 4.431
#1 1 10.330 0.088 0.000 0.000 86.000 TR55 59.27 5.446
10.330 59.27 5.446
#5 1 139.000 0.527 0.000 0.000 76.000 TR55 539.63 59.387
195.350 634.74 73.470
Subwatershed Sedimentology Detail:
Stru#
SWS#
Soil K L (ft) S (%) C P PS #Sediment
(tons)
PeakSediment
Conc.
(mg/l)
PeakSettleable
Conc
(ml/l)
24VW
(ml/l)
#4 1 0.320 60.00 33.33 0.9000 1.0000 1 7,971.5 617,272 373.71 219.08
7,971.5 617,272 373.71 219.08
#3 1 0.320 60.00 33.33 0.9000 1.0000 1 4,005.5 589,691 356.76 203.82
4,005.5 589,691 356.76 203.82
#2 1 0.320 60.00 33.33 0.9000 1.0000 1 2,358.9 564,456 341.51 194.52
2,358.9 564,456 341.51 194.52
#1 1 0.320 60.00 33.33 0.9000 1.0000 1 3,032.9 570,423 345.35 201.44
3,032.9 570,423 345.35 201.44
#5 1 0.320 100.00 14.00 0.3500 1.0000 1 7,918.8 165,404 95.33 53.69
9,994.9 180,356 92.52 52.11
Subwatershed Time of Concentration Details:Stru#
SWS#
Land Flow Condition Slope (%)Vert. Dist.
(ft)Horiz. Dist.
(ft)Velocity
(fps)Time (hrs)
#1 15. Nearly bare and untilled, andalluvial valley fans
10.00 2.50 25.00 3.160 0.002
6. Grassed waterway 2.49 17.00 683.00 2.360 0.080
Filename: Post-Developed-LL.sc4 Printed 03-05-2020
SEDCAD 4 for WindowsCopyright 1998 -2010 Pamela J. SchwabCivil Software Design, LLC 16
Page 98
Stru#
SWS#
Land Flow Condition Slope (%)Vert. Dist.
(ft)Horiz. Dist.
(ft)Velocity
(fps)Time (hrs)
8. Large gullies, diversions, and lowflowing streams
28.16 69.00 245.00 15.920 0.004
9. Small streams flowing bankfull 0.50 0.23 46.00 6.360 0.002
#1 1 Time of Concentration: 0.088
#2 15. Nearly bare and untilled, andalluvial valley fans
10.00 2.50 25.00 3.160 0.002
6. Grassed waterway 1.26 10.00 793.02 1.680 0.131
8. Large gullies, diversions, and lowflowing streams
23.43 82.00 350.00 14.520 0.006
9. Small streams flowing bankfull 5.00 8.00 160.00 20.120 0.002
#2 1 Time of Concentration: 0.141
#3 15. Nearly bare and untilled, andalluvial valley fans
22.92 22.00 96.00 4.780 0.005
7. Paved area and small uplandgullies
1.66 14.00 844.03 2.590 0.090
7. Paved area and small uplandgullies
6.74 70.00 1,038.00 5.220 0.055
7. Paved area and small uplandgullies
3.48 8.00 230.00 3.750 0.017
#3 1 Time of Concentration: 0.167
#4 15. Nearly bare and untilled, andalluvial valley fans
1.00 1.15 115.00 1.000 0.031
8. Large gullies, diversions, and lowflowing streams
2171.00 2,171.00 100.00 139.780 0.000
5. Nearly bare and untilled, andalluvial valley fans
2.63 10.00 380.01 1.620 0.065
#4 1 Time of Concentration: 0.096
#5 1 1. Forest with heavy ground litter 9.82 100.00 1,018.00 0.790 0.357
9. Small streams flowing bankfull 1.17 70.00 5,984.44 9.730 0.170
#5 1 Time of Concentration: 0.527
Filename: Post-Developed-LL.sc4 Printed 03-05-2020
SEDCAD 4 for WindowsCopyright 1998 -2010 Pamela J. SchwabCivil Software Design, LLC 17