March 1990 A FISHERIES EVALUATION OF THE RICHLAND AND TOPPENISH/SATUS CANAL FISH SCREENING FACILITIES, SPRING 1986 THIS IS INVISIBLE TEXT TO KEEP VERTICAL ALIGNMENT THIS IS INVISIBLE TEXT TO KEEP VERTICAL ALIGNMENT THIS IS INVISIBLE TEXT TO KEEP VERTICAL ALIGNMENT THIS IS INVISIBLE TEXT TO KEEP VERTICAL ALIGNMENT THIS IS INVISIBLE TEXT TO KEEP VERTICAL ALIGNMENT DOE/BP-01830-2
Transcript
March 1990
A FISHERIES EVALUATION OF THE RICHLAND ANDTOPPENISH/SATUS CANAL FISH SCREENING FACILITIES,
SPRING 1986
THIS IS INVISIBLE TEXT TO KEEP VERTICAL ALIGNMENT THIS IS INVISIBLE TEXT TO KEEP VERTICAL ALIGNMENT THIS IS INVISIBLE TEXT TO KEEP VERTICAL ALIGNMENT THIS IS INVISIBLE TEXT TO KEEP VERTICAL ALIGNMENT THIS IS INVISIBLE TEXT TO KEEP VERTICAL ALIGNMENT
DOE/BP-01830-2
This report was funded by the Bonneville Power Administration (BPA), U.S. Department of Energy, as part ofBPA's program to protect, mitigate, and enhance fish and wildlife affected by the development and operation ofhydroelectric facilities on the Columbia River and its tributaries. The views of this report are the author's and do notnecessarily represent the views of BPA.
This document should be cited as follows: Neitzel,Duane A., C. Scott Abernethy, E. William Lusty, The Bonneville Power Administration under a Related ServicesAgreement with the U.S. Department of Energy Contract DE-AC06-76RL0 1830, Pacific Northwest Laboratory, 76electronic pages (BPA Report DOE/BP-01830-2)
This report and other BPA Fish and Wildlife Publications are available on the Internet at:
FISH SURVIVAL AT THE SCREENING FACILITY. .POTENTIAL FOR PREDATION AT T H E SCREENING FACILITIES : : : : :
39
POTENTIAL FOR FISH DELAY AT T H E SCREENING FACILITIES . . . . . 1:FISH PASSAGE THROUGH OR OVER THE ROTARY SCREENS. . . . . . . . 44POTENTIAL EFFECTS OF CHANGING SCREEN OPERATION . . . . . . . . 45
ix
S U M M A R Y . . . . . . . . . . . . . . . . . . . . . . . . . . . . . . 4 9
APPENDIX A - RELEASE AND CAPTURE DATA FROM SUNNYSIDE, RICHLAND,AND TOPPENISH/SATUS CANAL FISH SCREENING FACILITYEVALUATIONS. . . . . . . . . . . . . . . . . . . . . . A.1
X
F IGURES
1
2
3
4
5
6
7
8
9
10
11
12
Yakima River Basin, Including Locations of Richland andToppenish/Satus Fish Screening Facilities and Other FishProtection and Passage Facilities . . . . . . . . . . . . . . .
Yakima River Basin Showing Location of Richlandand Toppenish/Satus Canal Fish Screening Facilities . . . . . .
Flow Control Structure and the Bypass System in theRichland Canal Fish Screening Facility. . . . . . . . . . . . .
Flow Control Structure and Bypass System in theToppenish/Satus Canal Fish Screening Facility . . . . . . . . .
Inclined Plane System Used at Richland and Toppenish/SatusCanal Fish Screening Facilities, Spring 1986. . . . . . . . . .
Fyke Net Used at Richland Canal Fish ScreeningFacilities, Spring 1986 . . . . . . . . . . . . . . . . . . . .
Movement of Spring Chinook Salmon, Oncorh nchus tshawytscha& &;a1Smolts Based on the Capture of Test
Fish Screening Facility, Spring 1986. . . . . . . . . . . . . .
Movement of Steelhead, Salmo airdneri Smolts Based on the-+-,Capture of Test Fish at the Richland Canal Fish ScreeningFacility, Spring 1986 . . . . . . . . . . . . . . . . . . . . .
Movement of Fall Chinook Salmon, Oncorhynchus tshawytscha,Fingerlings Based on the Capture of Test Fish at the RichlandCanal Fish Screening Facility, Spring 1986. . . . . . . . . . .
Movement of Steelhead, Salmo gairdneri, Smolts Based onthe Capture of Test Fish at Toppenish/Satus Canal FishScreening Facility, Spring 1986 . . . . . . . . . . . . . . . .
3
6
7
9
19
20
27
28
29
32
Movement of Fall Chinook Salmon, Oncorhynchus tshawytscha,Fingerlings Based on the Capture of Test Fish at Toppenish/SatusCanal Fish Screening Facility, Spring 1986. . . . . . . . . . . 32
Movement of Spring Chinook Salmon, Oncorhynchus tshawytscha,Smolts Based on the Capture of Test Fish at Toppenish/SatusCanal Fish Screening Facility, Spring 1986. . . . . . . . . . . 33
xi
TABLES
Descaling and Mortality Data from Release and CaptureTests with Steelhead, Salmo gairdneri, Smolts at theRichland Canal Fish Scxng Facility, Spring 1986 . . . . . .
Descaling and Mortality Data from Release and CaptureTests with Spring Chinook Salmon, Oncorhynchus tshawytscha,Smolts at the Richland Canal Fish Screening Facility,Spring1986..........................
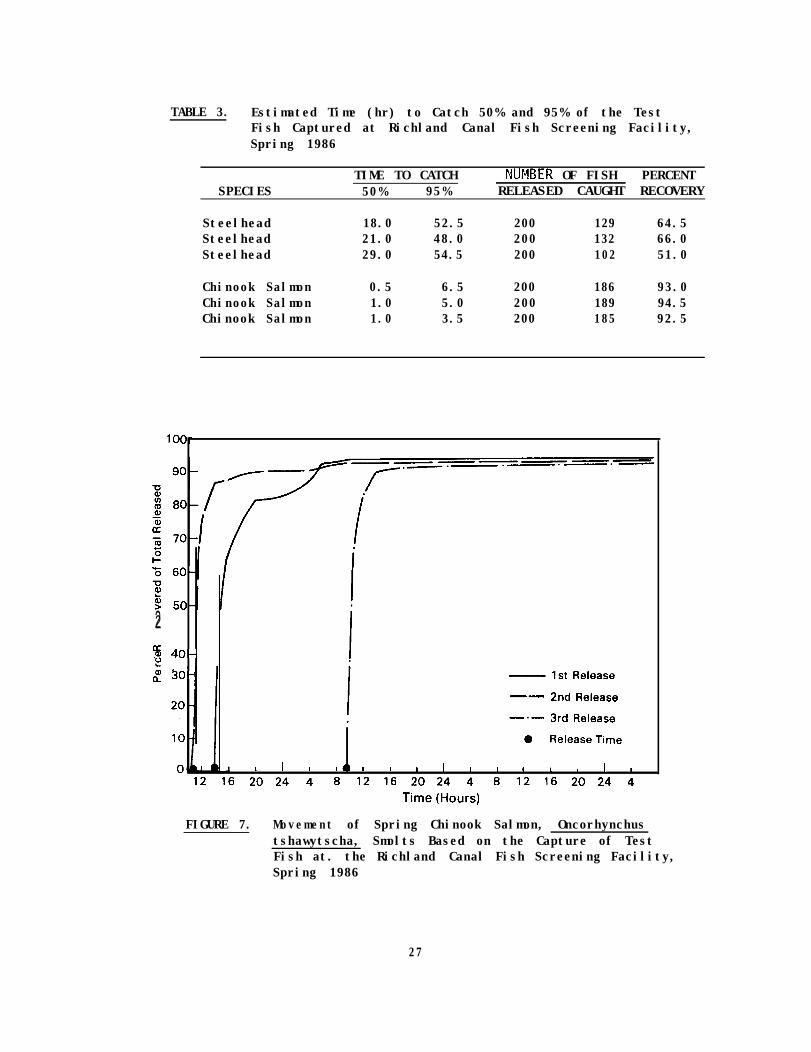
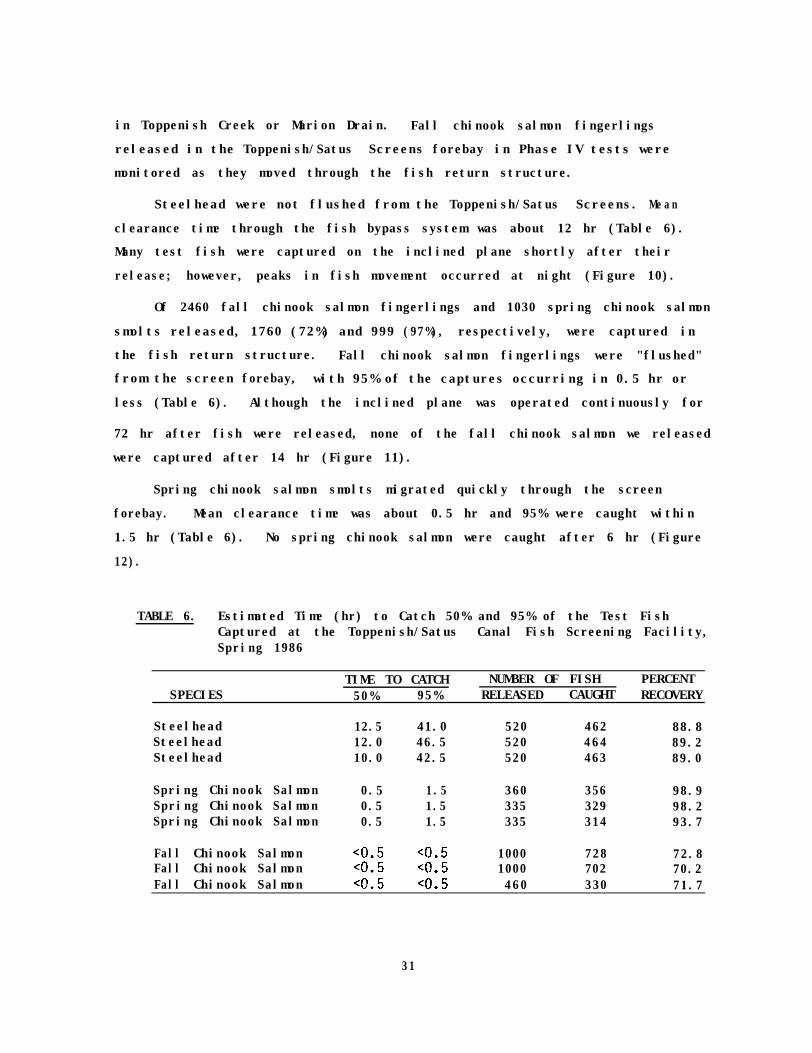
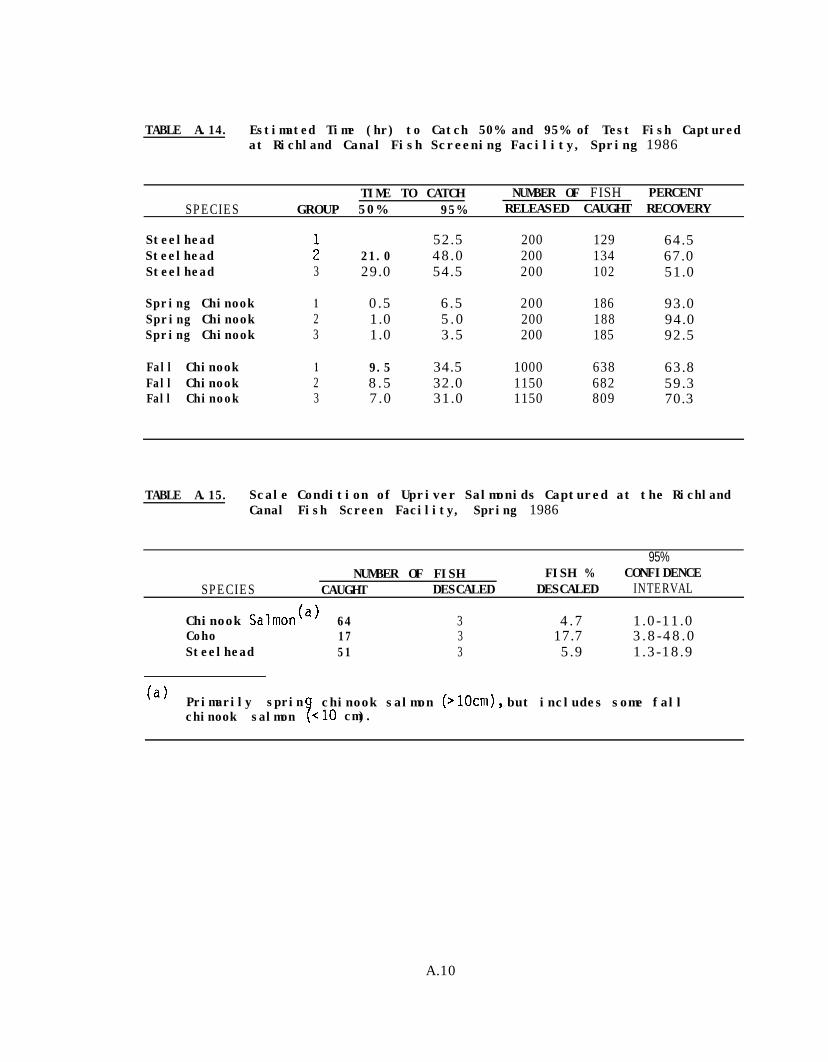
Estimated Time (hr) to Catch 50% and 95% of the Test FishCaptured at Richland Canal Fish Screening Facility,Spring1986..........................
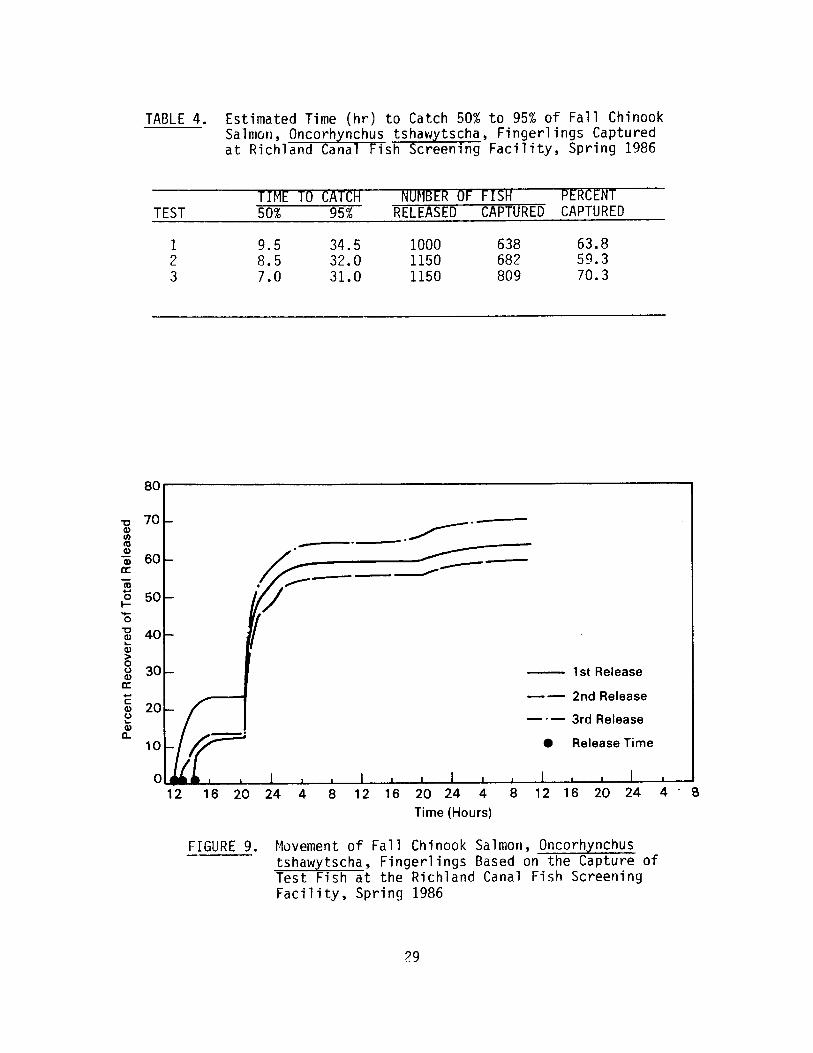
Estimated Time (hr) to Catch 50% and 95% of Fall Chinook Salmon,Oncorhynchus tshawytscha, Fingerlings Captured at RichlandCanal Fish Screening Facility, Spring 1986. . . . . . . . . . .
Descaling and Mortality Data from Release and CaptureTests with Steelhead, Salmo gairdneri, Smolts at theToppenish/Satus Canal Fish Screening Facility, Spring 1986. . .
Estimated Time (hr) to Catch 50% and 95% of the Test Fish,Captured at Toppenish/Satus Canal Fish Screening Facility,Spring1986..........................
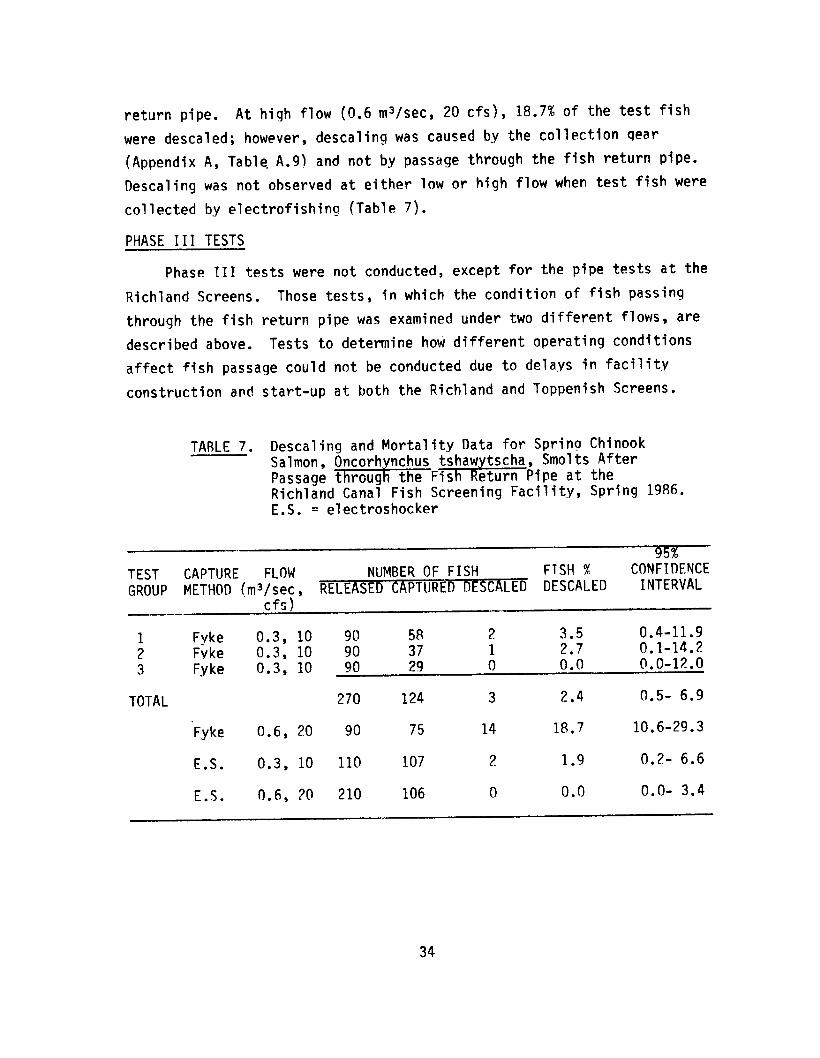
Descaling and Mortality Data for Spring Chinook Salmon,Oncorhynchus tshawytscha, Smolts After Passage through theFish Return Pipe at the Richland Canal Fish ScreeningFacility, Spring 1986 . . . . . . . . . . . . . . . . . . . . .
Descaling and Mortality Data for Upriver Salmonids Capturedat the Richland Canal Fish Screening Facility, Spring 1986. . .
Descaling and Mortality Data for Upriver Salmonids CapturedDuring Tests at Toppenish/Satus Canal Fish Screening Facility,Spring1986..........................
26
26
27
29
30
31
34
36
37
A.1 Percentage of Coho Salmon, Oncorhynchus kisutch, Smolts Descaledor Killed during Tests of the Inclined Plane at SunnysideCanal Fish Screening Facility, Spring 1985. . . . . . . . . . . A.3
A.2 Percentage of Steelhead, Salmo gairdneri, and ChinookSalmon, Oncorhynchus tshawytscha, Smolts Descaled or Killedduring Tests of the Fyke Net at Sunnyside Canal FishScreening Facility, Spring 1985 . . . . . . . . . . . . . . . . A.3
xiii
A.3
A.4
A.5
A.6
A.7
A.8
A.9
A.10
A.11
A.12
A.13
A.14
Percentage of Steelhead, Salmo gairdneri, SmoltsDescaled Before Being Use-Tests at Sunnyside CanalFish Screening Facility, Spring 1985 . . . . . . . . . . . . . A.4
Percentage of Chinook Salmon, Oncorhynchus tshawytscha,Smolts Descaled Before Being Used in Tests atSunnyside Canal Fish Screening Facility, Spring 1985 . . . . . A.4
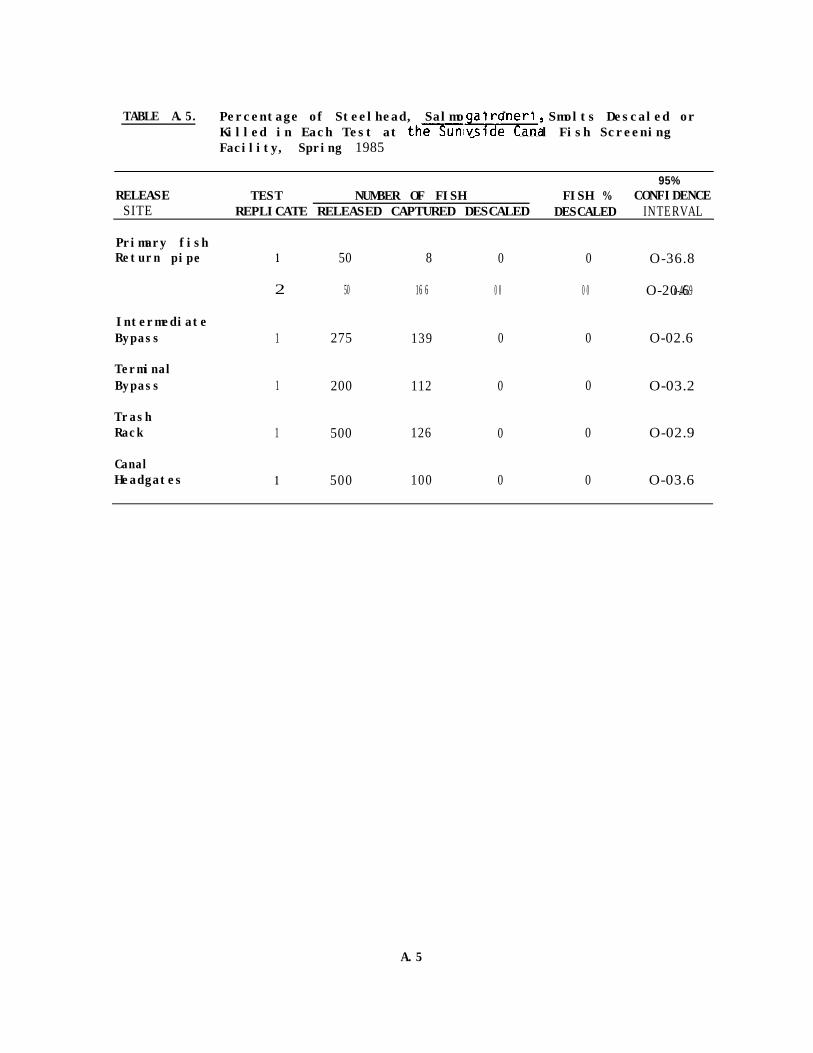
Percentage of Steelhead, Salmo gairdneri, Smolts Descaledor Killed in Each Test at the Sunnyside Canal FishScreening Facility, Spring 1985. . , . . . . . . . . . . . . . A.5
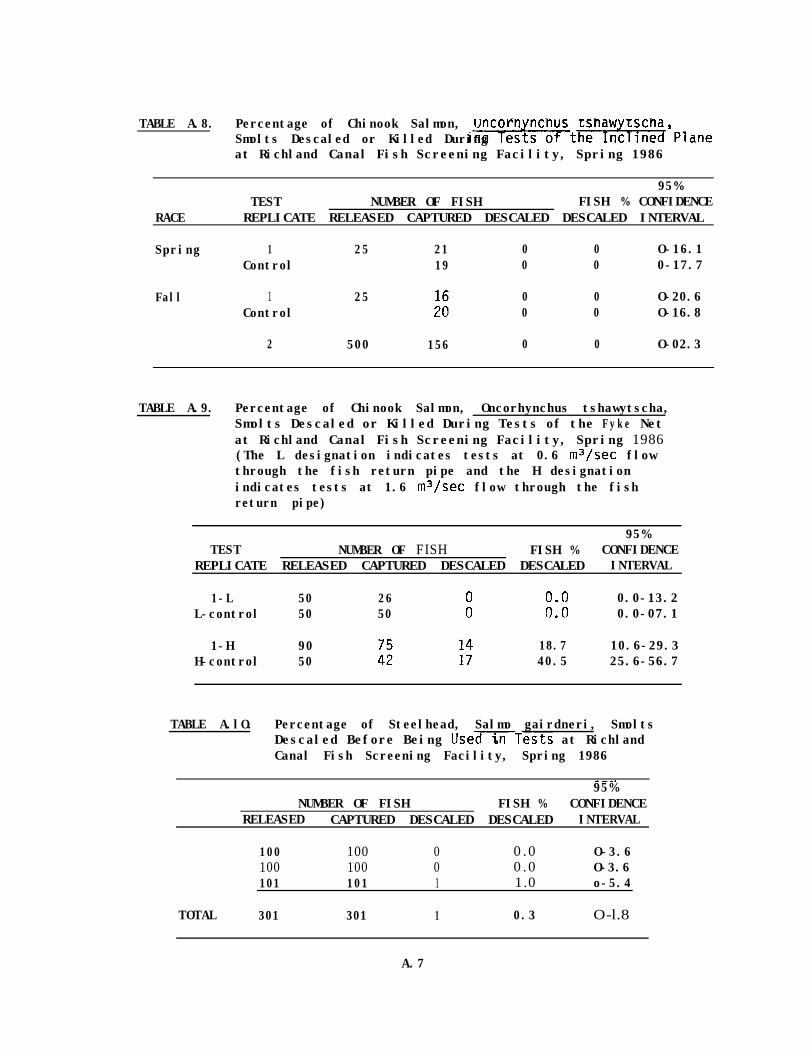
Percentage of Chinook Salmon, Oncorhynchus tshawytscha, SmoltsDescaled or Killed in Each Test at the SunnysideCanal Fish Screening Facility, Spring 1985 . . . . . . . . . . A.6
Scale Loss for Hatchery-Released and Native Salmonids CapturedDuring Tests at the Sunnyside Canal Fish ScreeningFacility, Spring 1985. . . . . . . . . . . . . . . . . . . . . A.6
Percentage of Juvenile Chinook Salmon, Oncorhynchus tshawytscha,Descaled or Killed During Tests of the Inclined Plane atRichland Canal Fish Screening Facility, Spring 1986. . . . . .
Percentage of Chinook Salmon, Oncorhynchus tshawytscha,Smolts Descaled or Killed during Tests of the Fyke Net atRichland Canal Fish Screening Facility, Spring 1986. . . . . .
Percentage of Steelhead, Salmo gairdneri, SmoltsDescaled Before Being UsenTests at Richland Canal FishScreening Facility, Spring 1986. . . . . . . . . . . . . . . .
Percentage of Chinook Salmon, Oncorhynchus tshawytscha,Smolts Descaled Before Being Used in Tests atRichland Canal Fish Screening Facility, Spring 1986. . . . . .
Descaling and Mortality Data from Release and CaptureTests with Steelhead, Salmo airdneri Smolts at theRichland Canal Fish Screening-h;, Spring 1986. . . . . .
Descaling and Mortality Data from Release and CaptureTests with Spring Chinook Salmon, Oncorhynchustshawytscha, Smolts at the Richland Canal Fish ScreeningFacility, Spring 1986. . . . . . . . . . . . . . . . . . . . .
Estimated Time (hr) to Catch 50% and 95% of Test FishCaptured at Richland Canal Fish Screening Facility,Sprinq 1986. . . . . . . . . . . . . . . . . . . . . . . . . .
A.7
A.7
A.7
A.8
A.8
A.9
A.10
xiv
A.15 Scale Condition of Upriver Salmonids Captured at theRichland Canal Fish Screening Facility, Spring 1986. . . . . . . A.10
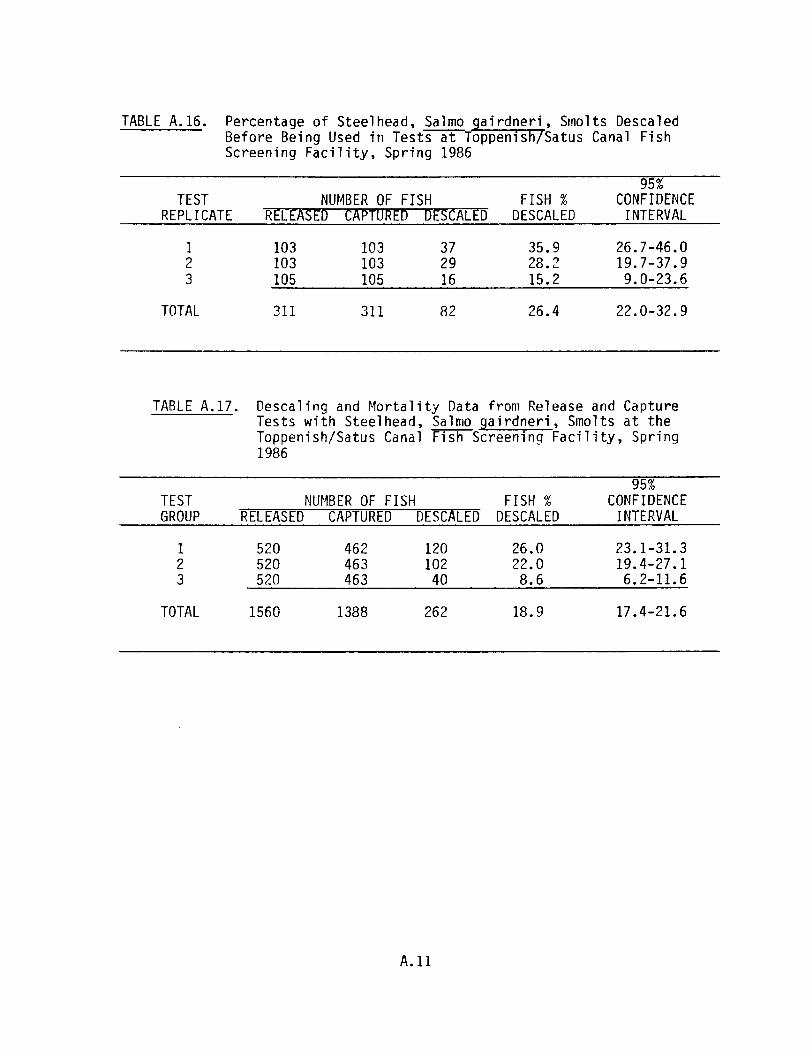
A.l6 Percentage of Steelhead, Salmo airdneri SmoltsDescaled Before Being Used in Tests at oppenish/Satus%'Canal Fish Screening Facility, Spring 1986 . . . . . . . . . . . A.11
A.17 Descaling and Mortality Data from Release and CaptureTests with Steelhead, Salmo gairdneri, Smolts at theToppenish/Satus Canal FishScreening Facility,Spring 1986. . . . . . . . . . . . . . . . . . . . . . . . . . . A.11
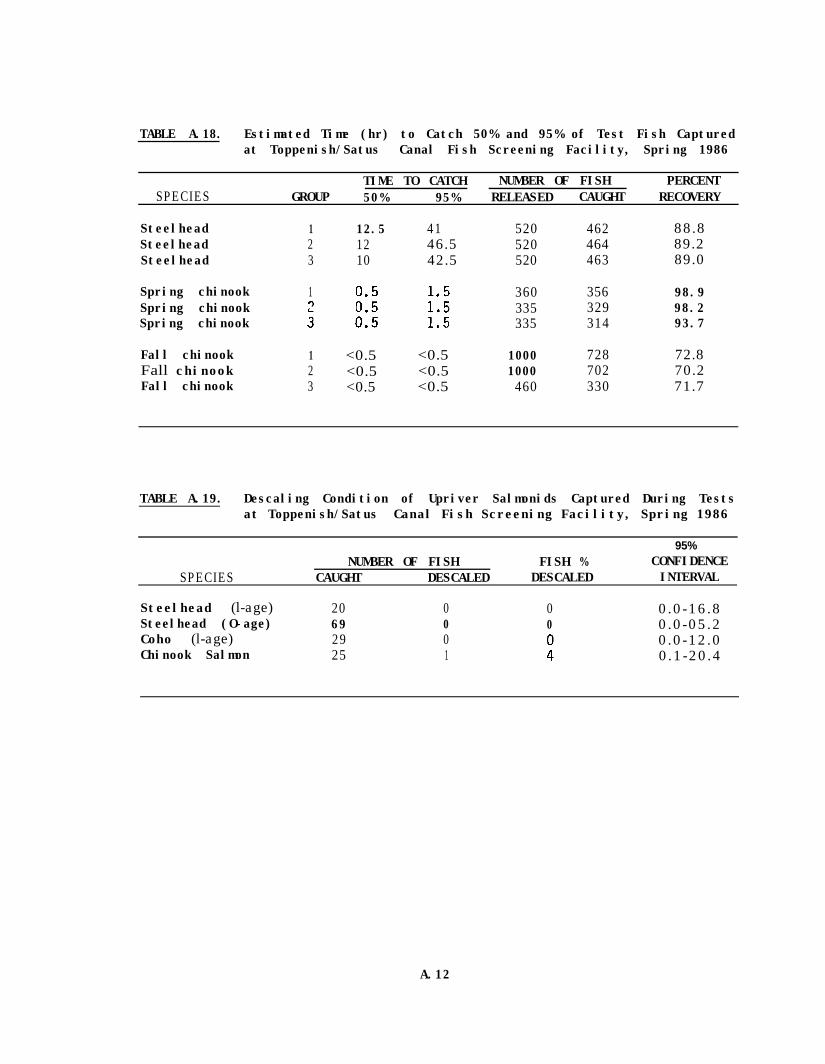
A.18 Estimated Time (hr) to Catch 50% and 95% of Test FishCaptured at Toppenish/Satus Canal Fish Screening Facility,Spring 1986. . . . . . . . . . . . . . . . . . . . . . . . . . . A.12
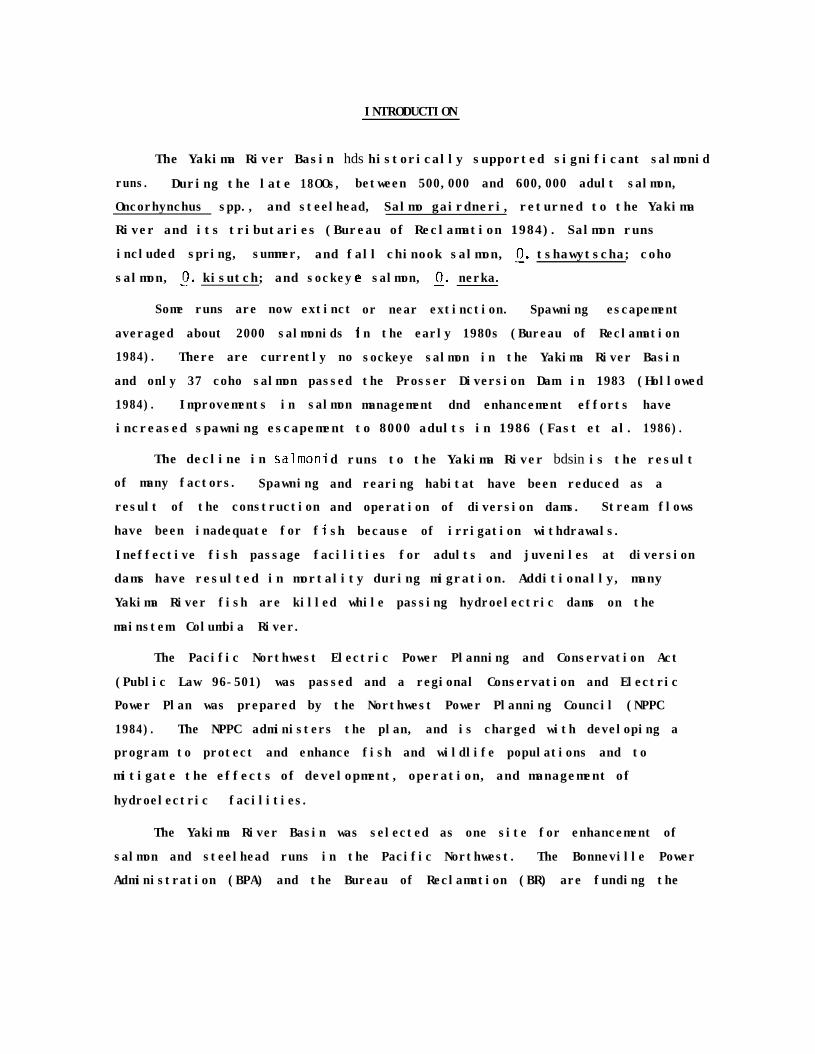
The Yakima River Basin hds historically supported significant salmonid
runs. During the late 18OOs, between 500,000 and 600,000 adult salmon,
Oncorhynchus spp., and steelhead, Salmo gairdneri, returned to the Yakima
River and its tributaries (Bureau of Reclamation 1984). Salmon runs
included spring, summer, and fall chinook salmon, 2. tshawytscha; coho
salmon, 0. kisutch; and sockeyy e salmon, 0. nerka.
or near extinction. Spawning escapement
in the early 1980s (Bureau of Reclamation
sockeye salmon in the Yakima River Basin
the Prosser Diversion Dam in 1983 (Hollowed
management dnd enhancement efforts have
increased spawning escapement to 8000 adults in 1986 (Fast et al. 1986).
Some runs are now extinct
averaged about 2000 salmonids
1984). There are currently no
and only 37 coho salmon passed
1984). Improvements in salmon
INTRODUCTION
The decline in salmoni d runs to the Yakima River bdsin is the result
of many factors. Spawning and rearing habitat have been reduced as a
result of the construction and operation of diversion dams. Stream flows
have been inadequate for f sh because of irrigation withdrawals.
Ineffective fish passage facilities for adults and juveniles at diversion
dams have resulted in mortality during migration. Additionally, many
Yakima River fish are killed while passing hydroelectric dams on the
mainstem Columbia River.
The Pacific Northwest Electric Power Planning and Conservation Act
(Public Law 96-501) was passed and a regional Conservation and Electric
Power Plan was prepared by the Northwest Power Planning Council (NPPC
1984). The NPPC administers the plan, and is charged with developing a
program to protect and enhance fish and wildlife populations and to
mitigate the effects of development, operation, and management of
hydroelectric facilities.
The Yakima River Basin was selected as one site for enhancement of
salmon and steelhead runs in the Pacific Northwest. The Bonneville Power
Administration (BPA) and the Bureau of Reclamation (BR) are funding the
construction of fish passage and protection facilities at 20 irrigation
diversions in the Yakima River Basin (Figure 1). The BPA is also providing
funds to the Yakima Indian Nation to increase production of spring chinook
salmon in the Yakima River Basin.
The BPA and BR are constructing screen facilities in the Yakima Basin
to protect outmigrating salmonids. The Richland and Toppenish/Satus Canal
Fish Screening Facilities (Richland and Toppenish/Satus Screens) are two of
the protection facilities being constructed. Construction of the screens
was completed in the spring of 1986. The BPA asked the Pacific Northwest
Laboratory (PNL) to evaluate the effectiveness of these diversion
facilities in returning fish that had entered the Richland Canal and the
Satus Canal back to the river.
This report describes each screening facility, methods used to
evaluate the effectiveness of the screens, and study results. Results of
the studies at the Richland and Toppenish/Satus Screens are compared with
those from the Sunnyside Screens (Neitzel et al. 1985).
1 Easton Diversion D a m2 Taneum Diversion D a m3 Westside Ditch4 Thorp MIII Ditch5 Town DIversion Dam6 Roza Diversion D a m7 Stevens Ditch DIversion8 Wapatok Diversion D a m9 Natches Cowiche Diversion
1 0 Roza Powerplant Wasteway11 Wapato Diversion Dam12 Old Reservation Canal Diversion13 Sunnysde Diversion Dam14 Snipes A l l en Diversion15 Toppenish Creek Diversion16 Marion Drain Diversion17 Toppenish Creek Status Unit
D Ive rs ion18 Satus Creek Diversion19 Prosser Diversion Dam20 Horn Raplds Diversion Dam
(Richland and Columbia Screens)
n Fish Ladder Improvements
0 Fish Screen and/or Bypass Improvements
FIGURE 1. Yakima River Basin, Including Locations of the Richland andToppenish/Satus Fish Screening Facilities and Other FishProtection and Passage Facilities
DESCRIPTION OF STUDY AREAS-
The study areas included the canal from the trash rack to the
screening facility, the fish bypass system within the screening facility,
the terminus of the fish bypass system, and the canal downstream of the
screening facility. Our description of the study areas includes the range
of conditions in which the sites are operated. Specific conditions tested
during the evaluations are reported in the results and discussion of the
results.
RICHLAND CANAL FISH SCREENING FACILITY
The headgates of the Richland Canal are located at the Horn Rapids
Diversion Dam on the Yakima River (Figure 7) at river km 29 (RM 18). The
carrying capacity of the Richland Canal is about 2.5 m3/sec f90 cubic feet
per second (cfs)l. Canal flow is maintained at 0.8 to 1.4 m3/sec (30 to
50 cfs) during the irrigation season (April to October) and at about
0.6 m3/sec (20 cfs) during the rest of the year.
Canal flow is regulated at. the canal headgates about 1 km upstream of
the Richland Screens. The screening facility diverts fish that have
entered the canal and directs them back to the Yakima River. A trash rack
placed in the canal upstream of the screening facility (Figures 2 and 3)
"filters" out large debris that could damage the screens or interfere with
flow control through the screening facility.
A waste-water channel is immediately upstream of the trash rack. The
channel runs perpendicular to the canal and discharges into the Yakima
River. Excess water spills into the waste-water channel when the canal
flow exceeds the combined flows through the screens and fish return pipe.
Waste-water flow can be regulated to help keep debris from accumulating on
the trash rack and helps prevent flooding of the screening facility during
the winter when ice forms at the screens.
The screening facility houses four rotary drum screens with axes
parallel to the length of the structure (Figure 3). Each screen is about
3 m (10 ft) wide and 1.8 m (6 ft) in diameter. The screen mesh openings
are 3.18 mm (l/8 in.). Water depth at the screens varies with canal flow.
FIGURE 2. Yakima River Basin Showing Location of Richland and Toppenish/Satus CanalFish Screening Facilities
Richland Canal
~Yakima River ---------_
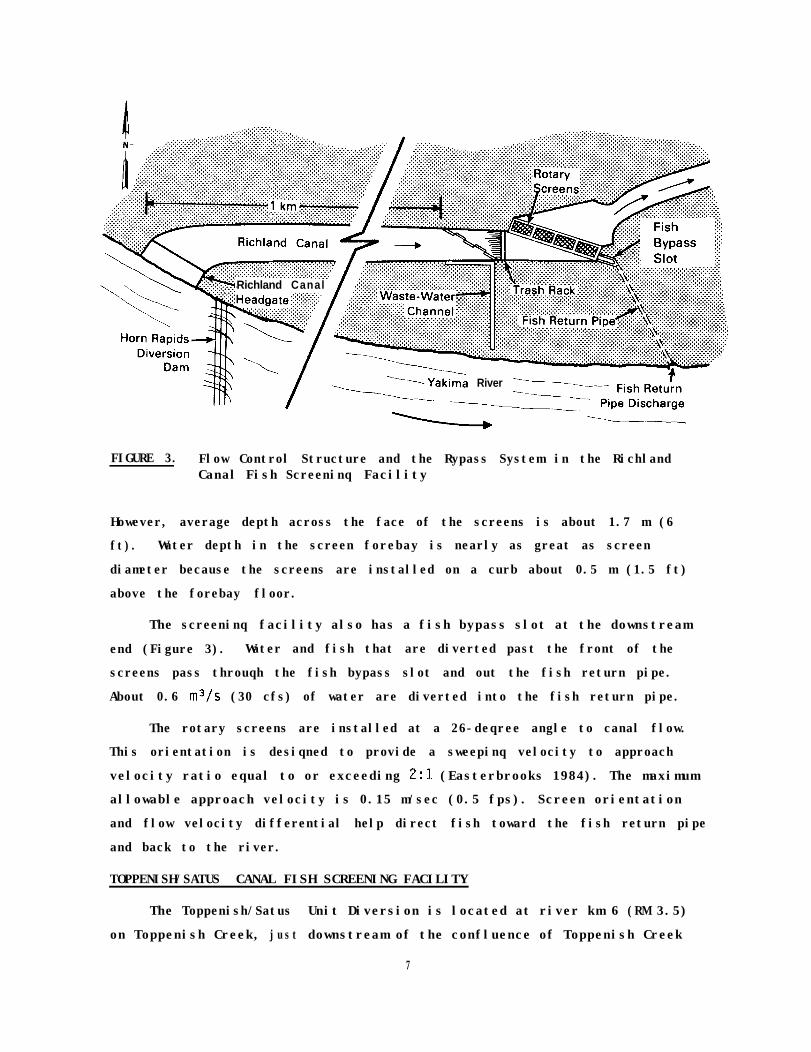
FIGURE 3. Flow Control Structure and the Rypass System in the RichlandCanal Fish Screeninq Facility
However, average depth across the face of the screens is about 1.7 m (6
ft). Water depth in the screen forebay is nearly as great as screen
diameter because the screens are installed on a curb about 0.5 m (1.5 ft)
above the forebay floor.
The screeninq facility also has a fish bypass slot at the downstream
end (Figure 3). Water and fish that are diverted past the front of the
screens pass throuqh the fish bypass slot and out the fish return pipe.
About 0.6 m3/s (30 cfs) of water are diverted into the fish return pipe.
The rotary screens are installed at a 26-deqree angle to canal flow.
This orientation is desiqned to provide a sweepinq velocity to approach
velocity ratio equal to or exceeding 2:3. (Easterbrooks 1984). The maximum
allowable approach velocity is 0.15 m/sec (0.5 fps). Screen orientation
and flow velocity differential help direct fish toward the fish return pipe
and back to the river.
TOPPENISH/SATUS CANAL FISH SCREENING FACILITY
The Toppenish/Satus Unit Diversion is located at river km 6 (RM 3.5)
on Toppenish Creek, just downstream of the confluence of Toppenish Creek
7
and Marion Drain (Figure 4). The diversion directs water from Marion Drain
and Toppenish Creek to the Satus Canal. Canal operation begins in late
March or early April and continues through the irrigation season, usually
to mid-October. Canal capacity is about 18 m3/sec (650 cfs).
The Toppenish/Satus Screens are located about 200 m (650 ft)
downstream of the headgates of Satus Canal. The facility (Figures 2 and 4)
diverts fish entering the canal and directs them back to Toppenish Creek.
A trash rack, installed immediately upstream of the screening facility
(Figures 2 and 4), "filters" out debris entering the canal such as large
logs or tree branches that may damage the screens or interfere with flow
through the facility. The rack is equipped with an automated trash removal
system designed to clean the upper 2 m (6 ft) of the trash racks. This
system is especially important at Toppenish/Satus because of the large
quantity of aquatic macrophytes that enter the canal from Marion Drain and
Toppenish Creek during the summer.
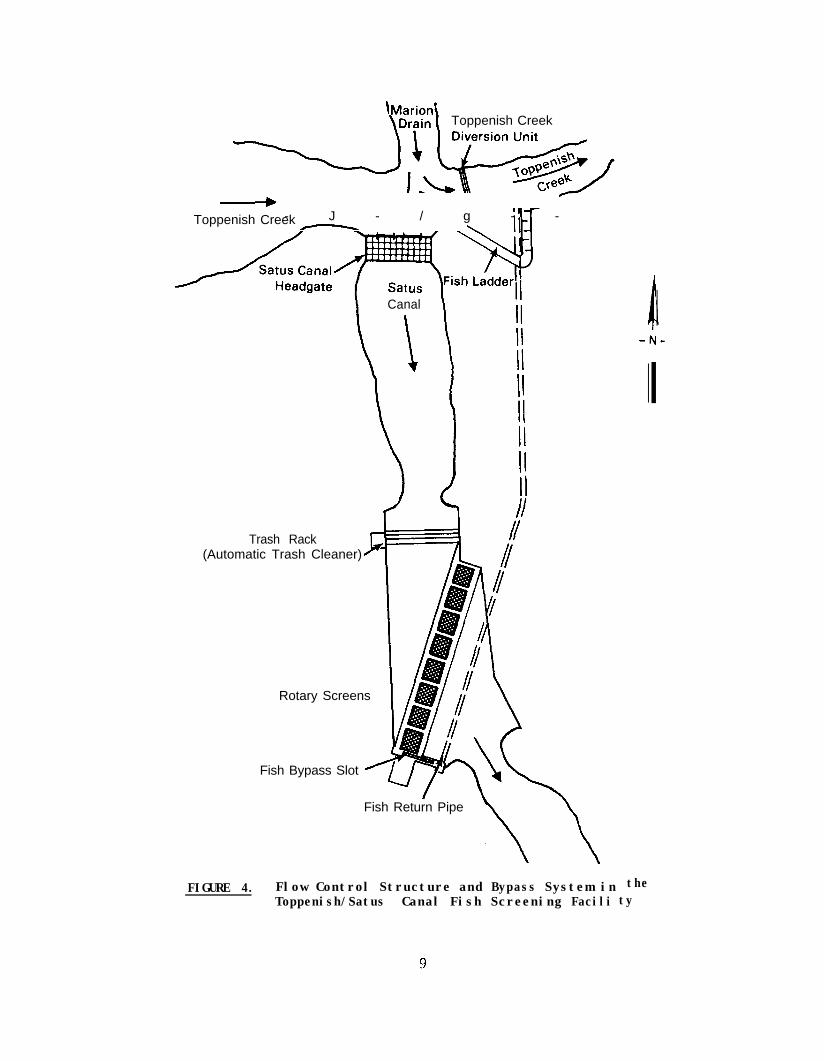
The screening facility houses eight rotary drum screens (Figure 4)
with axes parallel to the length of the structure. Each screen is about
5.5 m (18 ft) wide and 3.7 m (12 ft) diameter. The screen mesh openings
are 3.18 mm (l/8 in). Water depth at the screens varies with canal flow.
The average depth across the face of the screens is about 2.4 m (8 ft).
The rotary drum screens are installed in the canal at a X-degree angle to
the canal flow. This orientation is designed to provide a sweeping
velocity to approach velocity ratio of 2:l. The maximum allowable approach
velocity is 0.15 m/sec (0.5 ft) (Easterbrooks 1984). This orientation
guides fish toward the fish return pipe and back to the river.
The fish bypass slot (Figure 4) is located at the downstream end of
the screening facility. About 0.6 m3/sec (20 cfs) of water pass through
the fish bypass slot and out the fish return pipe. A fish sampling screen
has been installed in the fish bypass slot at the Toppenish/Satus
Screens, although it cannot be used because it does not include any means
for cleaning.
‘y;;;ye\ Toppenish Creek
- - J - / g - -Toppenish Creek -
Canal
\ 1\
IIIIIIII
I II
FIGURE 4. Flow Control Structure and Bypass System in theToppenish/Satus Canal Fish Screening Facili ty
Trash Rack(Automatic Trash Cleaner)F
1
Rotary Screens I /1
Fish Bypass Slot 'Ll-7-1 -
Fish Return Pipe
\\
WORK PLAN
The work plan for BPA-funded screen evaluations includes four phases.
Phases I through III involve release/capture studies to determine changes
in fish condition after the fish have moved through the screening facility,
and to estimate the time required to divert fish from the screening
facility to the river. Phase IV involves a monitoring study to determine
the presence of predators near the screening facilities, to determine if
fish pass through the screens into the canals, and to estimate arrival
times of outmigrating salmonid populations at the screening facilities.
The work plan addresses a generic facility (i.e., a facility with
headgates, a trash rack, screens, a fish return-water pumpback system,
a separation chamber, and a fish return pipe). Although some components
may be different or absent at a given facility, the four-phase concept is
flexible and can be applied to all the facilities in the Yakima Basin. It
is not always necessary to implement all phases at all sites. The most
important data necessary to evaluate a specific site are determined by the
BPA and the fisheries management agencies in the Yakima Basin.
Identification of needs determines which phases of the work plan are
implemented at each site.
PHASE I
Phase I tests are conducted to determine the condition of juvenile
salmonids after they pass through components of the diversion facility.
Phase I tests are accomplished by releasing branded fish at the entry to
the fish bypass system. Released fish are collected near the terminus of
the fish return pipe. The percent of fish that are descaled, the number of
fish killed (both immediately and after 4 days), and the rate and extent of
other injuries are recorded.
Severaa 1 collection systems may be used, including a net at the
terminus of the primary fish return pipe or a modified inclined plane
placed near the terminus of the diversion system. Collection systems are
chosen after a site-specific evaluation of each screening facility.
Collection systems are tested to ensure their effectiveness and to verify
11
that fish are not injured or stressed by the equipment. These tests are
conducted by releasing fish in and near the collection system. Efficiency
and handling tests are conducted throughout the evaluation.
Collection of released fish begins immediately after their release.
Recovery duration varies depending on the site and the test objective. If
the primary objective is to estimate the proportion of released fish that
are killed or descaled, we continue collecting until an acceptable 95%
confidence estimate is obtained. When estimating travel time through a
component of the screening facility, a similar criterion is used to
determine sample duration. Whenever possible, samples are collected
continuously during the first 24 to 48 hr after release. If, after 48 hr,
the total catch is insufficient to obtain an accurate estimate, the
collection period is extended up to 96 hr.
Phase I will help develop a hypothesis about the fate of noncollected
fish from each release. The hypothesis will be based on catch efficiency
data that we collect during the control tests, duration of the sample
effort, and data from replicate tests.
Expected results from Phase I tests include determination of the
percent of fish that are killed or descaled during passage through the fish
bypass system, the change in condition of fish that survive passage through
the bypass, suspected fate of noncollected fish, effects of sampling
equipment, and handling effects from marking, release, and capture
techniques.
PHASE II
Phase II tests evaluate the change in condition of fish by comparing
the condition of fish released upstream of the trash rack to the condition
of fish that have passed through the bypass system (Phase IIa) or through
individual fish passage components of the screening facility (Phase IIb).
Whether Phase IIa or IIb tests are conducted depends on whether fish are
killed or injured during Phase I. If no mortalities or injuries occur
12
after passage through the bypass system during Phase I, Phase IIa follows
Phase I. If there are mortalities or injuries during Phase I, Phase IIb
follows Phase I.
Phase IIa
If no effect is observed in Phase I, the condition of fish that pass
through the screening facility (from upstream of the trash rack through the
bypass) is determined. Fish are released at the trash rack and collected
at the terminus of the fish return pipe. The percentage of fish descaled,
number of fish killed (immediately and after 4 days), and rate and extent
of injuries are noted. Releases are made in and near the collection system
to determine collection efficiency and handling effects.
Phase IIa studies evaluate the condition of fish that have been
diverted into a canal and returned to the river through the primary fish
return pipe. Additionally, the transit time of fish from the trash racks
to the fish return pipe discharge is determined.
Expected results from Phase IIa tests include determination of the
change in condition of fish that travel through the entire fish diversion
and are returned to the river, suspected fate of noncollected fish, transit
time for fish traveling through the diversion facility, and collection
efficiency and handling effects.
Phase IIb
If a detrimental effect is observed in Phase I tests, the condition of
fish that pass through or by specific components of the fish bypass system
( i.e., the intermediate bypass pipe, secondary separation chamber,
traveling screens, and the fish return pipe) is determined. The number of
fish released is determined by the same criteria used in Phase I. Fish are
released into specific components of the bypass system and collected at the
terminus of the component or fish return pipe, depending on the data needed
and the probability of successfully sampling within the component.
The study evaluates the condition of fish after they have passed
through the bypass and secondary separation chambers and at the fish return
13
pipe discharge, the transit time of fish through specific components of the
screeninq facility, and the transit time of fish through the entire
facility.
Expected results include the determination of bypass components that
adversely affect the condition of fish passing through the screening
facility, suspected fate of noncollected fish, and possible changes to the
screening facility that may reduce identified effects.
PHASE III
Phase III tests evaluate screen operating conditions and canal flow
changes that may affect the screen efficiency. Test design, test species,
and most of the study objectives are the same as in Phases I and IIa. The
study evaluates operating conditions that maximize screen efficiency, the
effectiveness of the screens over a range of flows, and factors that affect
fish transit time through the facilities.
Expected results include determination of any chanqe in the facility
effectiveness over a range of canal flows and examination of operating
conditions that may change transit time of fish throuqh the facility.
PHASE IV
Phase IV has two segments (Phase IVa and IVb); Phase IVa is desiqned
to monitor the presence and temporal distribution of predators and other
fish populations near the screens, and Phase IVb is desiqned to examine
rates of fish impingement on the screens, and to determine if fish can pass
through, around, under, or over the screens and be lost in the irrigation
canal.
Phase IVa
Phase IVa includes use of an inclined plane, fyke nets, beach seines,
or electroshocker to monitor the presence and temporal distribution of
natural fish populations near the screening facility. Proposed locations
for monitoring are downstream of the headgates, in the fish bypass slot of
the screening facility, and in the river downstream of the fish return pipe
discharge. Sampling equipment and techniques will be chosen to prevent
14
interference with our evaluation efforts in other work phases. In most
cases, collection can be conducted concurrently with other phases. However,
collection that miqht affect other evaluations, such as samplinq between a
release point and collection point, will have to be conducted independently.
Collection efforts will be determined by consulting with the RPA, Yakima
Rasin fisheries agencies, and by the priority placed on Phase IV work.
Phase IVa monitorinq of the occurrence of native outmigrant salmonid and
predatory fish populations will be conducted durinq all release/capture
tests in Phases I, IT, and III.
The study evaluates the presence of predatory fish populations and
native and hatchery-released outmigrant salmonids at each screeninq
facility.
Expected results include a qualitative determination of fish predator
populations near the facility and expected arrival time of native and
hatchery-released outmiqrant salmonid populations at the screening
facility.
Phase IVb
Phase IVb monitorina evaluates the rotary and vertical traveling
screens. Visual observations will be made to determine if fish are
impinaed on or can pass over the screens. In addition, some Phase IVb
objectives may require the release of fish. For example, screen integrity
m a y be determined by releasing marked fish upstream of the screens and
monitoring for their presence in the irriqation canal downstream of the
screens. Marked fish would also be released behind the screens to evaluate
gear and sampling efficiency.
The study evaluates the rate of impingement on the rotary and travel-
ing screens, and the rate of passage through the screens.
Expected results include determination of the rate of fish impingement
on rotary screens, rate of fish impingement on travelinq screens,
effectiveness of the screens in preventing fish from entering the canal
downstream of the screens, and the operating conditions that might result
in fish impingement.
15
METHCDS
Fish were released upstream of the screening facility and captured at
the terminus of the fish bypass slot or the primary fish return pipe.
Some test fish were held for post-test observation. Nontest fish were also
collected during release/capture tests.
TEST FISH
The species of test fish used at the Richland and Toppenish/Satus
Screens were recommended by fisheries biologists from the Washington State
Department of Fisheries, United States Fish and Wildlife Service (USFWS),
and the Yakima Indian Nation. Salmonid smolts and fry of both hatchery and
natural origin migrate down the Yakima River and its tributaries each year
during the spring and early summer.
Young steelhead, spring and fall chinook salmon, and coho salmon
migrate from upriver rearing habitats and could be impacted by the Richland
Screens on the lower Yakima River. Spring chinook salmon and steelhead
smolts were selected to evaluate descaling so that results could be
compared to previous evaluations at the Sunnyside Screens. In addition,
fall chinook salmon fingerlings (~60 mm) were selected to evaluate
impingement frequency and the effectiveness of rotary screens at preventing
small salmonids from entering the irrigation canal.
Steelhead and fall chinook salmon use the Toppenish Creek drainage.
Steelhead spawn in the headwaters of Toppenish Creek and fall chinook
salmon spawn in Marion Drain, which enters Toppenish Creek near the
lhead smolts and fall chinook salmon
evaluate the Toppenish/Satus Screens.
headgates of Satus Canal. Thus, stee
fingerlings (~60 mm) were selected to
Steelhead
Yearling steelhead were obtained from the Washington State Department
of Game (WDG) and came from stocks designated for release in the upper
Yakima Basin. The steelhead were hatched, reared, and adipose-fin-clipped
at the WDG Naches Trout Hatchery in Naches, Washington. They weighed about
28 fish/kg when transferred to PNL on March 18 and 19, 1986. The fish were
17
held outdoors at 12°C in a mixture of Columbia River and well water until
they weighed 18 to 23 fish/kg (41) to 50/lb) and were 15- to 23-cm (6 to
9 in.) fork length (FL). Test fish were acclimated to test-site
temperature at least 1 week prior to release.
Spring Chinook Salmon
Yearling spring chinook salmon were obtained from the USFWS
Leavenworth National Hatchery in Leavenworth, Washington. The fish weighed
about 46 fish/kg (l00/lb) when transferred to PNL on March 26, 1986. They
were reared outdoors in ambient Columbia River water (7°C to 13°C) until
smoltinq occurred. Test groups were acclimated to test-site temperature at
least 1 week prior to testing. The fish weighed 25 to 33 fish/kg (55 to
75/lb) and were 12- to 16-cm (5 to 6 in) FL when released.
Fall Chinook Salmon
Fall chinook salmon were obtained from the USFWS Spring Creek Hatchery
in Underwood, Washington. The fish were 1500 fish/kg (3300/lb) when
transferred to PNL on March 6, 1986. They were held indoors in chilled
well water (8°C) and acclimated to test-site temperature at least 1 week
prior to testing. Fall chinook salmon finqerlings weiqhed 385 fish/kg
(850/lb) and were 55- to 70-mm FL (20 to 30 in.) when released.
SAMPLING EQUIPMENT
Released fish had to be captured within the screening facility and at
the terminus of the primary fish return pipe. Fish were collected with an
inclined plane and fyke net that were custom fit to the structures at the
Richland and Toppenish/Satus Screens. Temporary fish-holdinq facilities
were installed at each test site.
Inclined Plane
Fish were captured by placing an inclined plane in the fish bypass
slot between the most downstream rotary screen and the fish return pipe
(Figure 5). The inclined plane used at the Richland Canal was 2.5 m (8 ft)
long and 0.76 m (2 ft) wide. Adjustable wings, 2.5 m (8 ft) lonq and
0.15 m (0.5 ft) wide, were fastened to the sides of the inclined plane to
18
Chain Attached
-Fish Return Pipe
FIGIJRE 5. Inclined Plane Svstem Used at Richland and---.Toppenish/Satus Canal Fish Screening Facilities,Spring 1986
compensate for irregularities in the walls of the fish bypass slot. A
live-box rO.37 m (1 ft) long by 0.75 m (2 ft) wide, 45-l (12 gal) volume1
was fastened at the end of the inclined plane. The inclined plane had an
aluminum framework covered with a perforated aluminum sheet T0.32-cm
(l/8 in.) diameter holes, staggered centers, 40% openl. Water flow was
directed over the plane surface by placing dam boards in the upstream end
of the fish bypass slot. The height of the dam boards relative to water
depth determined the water volume through the fish bypass slot.
The inclined plane at Toppenish/Satus was similar to that used at
Richland, differing only in plane dimension and live-box size. The plane
was 4.25 m (15 ft) long and 0.46 m (2 ft) wide. The live-box was 0.61 m
(2 ft) long and 0.46 m (2 ft) wide, with a 57-l (15 gal) volume. Flow rate
was controlled by placing dam boards in the upstream end of the fish bypass
slot.
19
The inclined planes were lowered into position with an electric winch
or hand hoist. Planes were brushed periodically to prevent the perforated
sheet from becoming clogged with vegetation and debris.
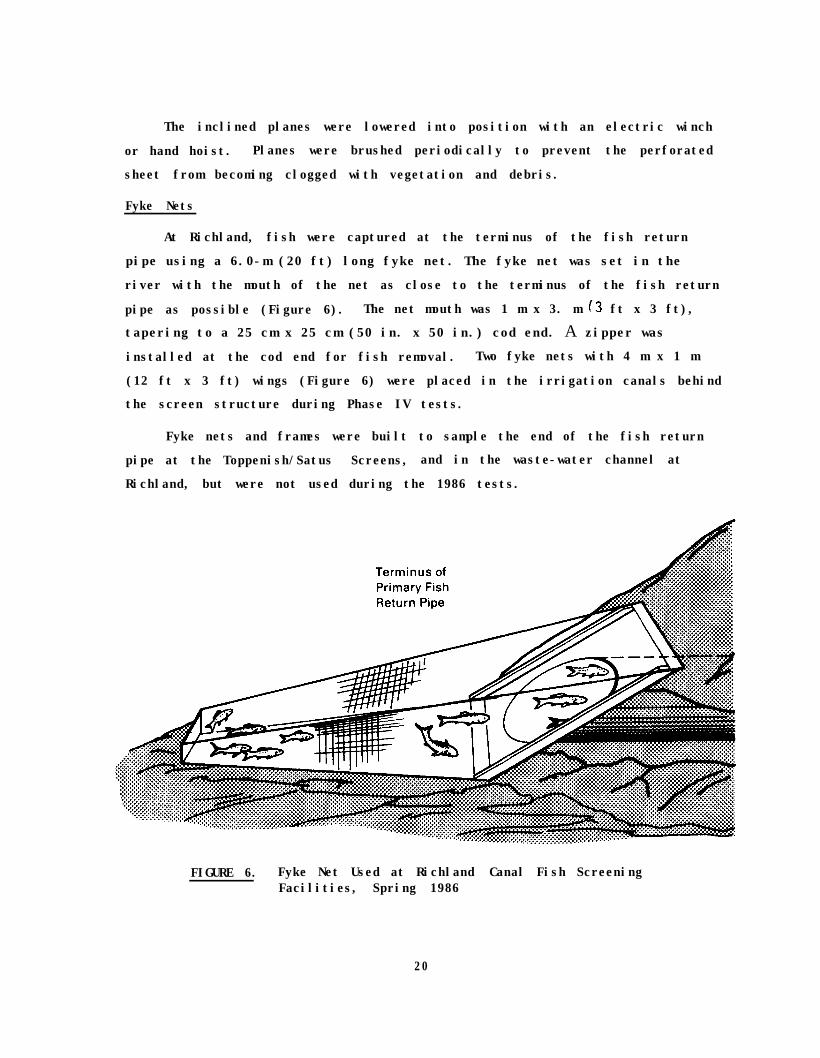
Fyke Nets
At Richland, fish were captured at the terminus of the fish return
pipe using a 6.0-m (20 ft) long fyke net. The fyke net was set in the
river with the mouth of the net as close to the terminus of the fish return
pipe as possible (Figure 6). The net mouth was 1 m x 3. m f3 ft x 3 ft),
tapering to a 25 cm x 25 cm (50 in. x 50 in.) cod end. A zipper wasinstalled at the cod end for fish removal. Two fyke nets with 4 m x 1 m
(12 ft x 3 ft) wings (Figure 6) were placed in the irrigation canals behind
the screen structure during Phase IV tests.
Fyke nets and frames were built to sample the end of the fish return
pipe at the Toppenish/Satus Screens, and in the waste-water channel at
Richland, but were not used during the 1986 tests.
FIGURE 6. Fyke Net Used at Richland Canal Fish ScreeningFacilities, Spring 1986
20
Electrofishing Gear
An electroshocker (Smith-Root Model Type VI Electrofisher) was used at
the terminus of the fish return pipe at Richland. The probes were placed in
the water, one on either side of the pipe. Fish were shocked as they
exited the pipe. Electroshocked fish were dipped from the river. At
Richland and Toppenish/Satus, a Smith-Root Model Type VII backpack
electrofisher was used in the irrigation canal behind the rotary screens.
When sampling behind the screens, the backpack electrofisher was used from
a 4 m aluminum boat. Electrofishinq served as an alternative to fyke net
collection at the end of the fish return pipe and supplemented fyke net
catch data in tests where fish were released in the canal behind the rotary
screens.
Holding Facilities
After fish were netted from the live-box they were placed in holding
facilities at the site. The holding facilities were set up to hold fish
for evaluation of injury and descaling, and to retain some fish for 96 hr
after capture. Four metal troughs cl.5 m (5 ft) x 0.3 m (1 ft) x 0.2 m
(1 ft! deep, 90-l (25 gal) volume! and one fiberglass circular tank r1.2 m
(4 ft) diameter x 0.75 m (2 ft) deep, 725-l (190 gal) volume1 were
installed at Richland, and 4 fiberglass troughs [3 m (10 ft) x 0.56 m
(2 ft) x 0.75 m (1 ft) deep, 540-l (150 gal) volume' were installed at
Topnenish/Satus. All tanks were supplied with canal water that was pumped
from behind the screens.
DESCALJNG EVALUATION
The evaluation system developed b y the U. S . Army Corps of Engineers
(Basham et al. 1982) was used to monitor fish condition at both test sites.
Evaluation criteria included modifications established in 1985 (Neitzel et
al. 1985). Baseline descaling was determined by randomly sampling the
groups of test fish prior to their release. Descaling was evaluated in
each of ten areas, five on each side of the fish. When 40% or more scale
loss was observed in any two areas on one side of a fish, the fish was
classified as descaled.
21
TEST PROCEDURE
At the Richland and Toppenish/Satus Screens branded groups of test
fish were released into the canal systems and captured as they moved
through the screening facility. Fish were released in the canal behind the
trash racks or at the head of the fish return pipe, depending on the test
objective. Fish were released in the canal to quantify descaling and
mortalities resulting from passage in front of the rotary drum screens
(Phase IIa tests). At the Richland Screens, fish were released at the head
of the fish return pipe to determine if fish that safely entered the fish
bypass slot returned to the river unharmed (Phase IIb tests!. Fall chinook
salmon were released behind the rotary screens in Phase IV tests at both
the Pichland and Toppenish/Satus Screens to evaluate screen integrity.
Test Stock Identification
Steelhead, fall chinook salmon, and spring chinook salmon were cold
branded to identify specific test groups. Fish were marked in one of four
locations: right anterior, left anterior, right dorsal, and left dorsal.
Brands were applied at least 1 week prior to release. Brands were approved
by the National Marine Fisheries Service and were unique from other brands
used in the Columbia River Basin. Releases of test fish were reported to
the Fish Passage Center in Portland, Oregon, for entry into their computer
files. Thus, our test fish could be identified by U.S. Army Corps of
Engineers biologists as they arrived at dams on the lower Columbia River.
Fish Transport and Release
Test fish were transported at acclimation temperature in an insulated
tank [400-l (100 gal) volume1 supplied with oxygen. Transit time from PNL
to the Richland and Toppenish/Satus Screens was 0.3 hr and 1.0 hr,
respectively. Loading densities did not exceed 120 g of fish/l. Water
temperature in the transporter changed less than 1°C during transit. Test
fish were netted from the transporter into buckets for release into the
canal. There were no losses attributable to transporting.
22
Fish Release Locations
Test fish were released uniformly across the canal downstream of the
trash rack during Phase IIa tests at Richland and Toppenish/Satus. During
Phase IIb tests at Richland, fish were released in the fish return structure
within 1 m of the head end of the fish return pipe. Fall chinook salmon
used during Phase IV tests at Richland and Toppenish/Satus were released at
two locations: uniformly along the downstream side of the trash rack and
uniformly along the downstream side of the rotary screens.
Release Controls
The condition of test fish at the time of release (baseline condition
was estimated by sampling fish from the transporter. For Phase IIa tests,
100 fish were sampled for baseline condition and 200 to 500 fish were
released into the canal. During Phase IIb tests, groups of 10 to 20 test
fish were serially removed from the transport tank and released. Release
controls were similarly removed and evaluated throughout the test series.
Fish Capture and Evaluation
Fish captured during Phase IIa tests were dip netted from the live-box
at the end of the inclined plane and placed in a holding tank before
evaluation. Evaluations were made at half-hour intervals. Fish were
anesthetized in K-222, examined to determine the extent of scale loss, and
returned to a holding tank. Some fish were held for 96 hr to determine
possible delayed mortality. After fish recovered from the anesthetic, they
were released to the river via the fish return pipe.
Fish were captured either by fyke net or electrofishing in Phase IIb
tests. Fish were removed from the cod end of the net 10 minutes after
their release at the head of the fish return pipe. When the electroshocker
was used, stunned fish were dip netted at the end of the fish return pipe.
Fish were anesthetized with MS-222, examined, held in a cage at the river
bank to recover, and released into the river.
23
STATISTICAL ANALYSIS
The percent of fish descaled or killed was estimated based on the
number of test fish caught. Descaled fish, defined by Basham et al.
(1982), were considered dead for evaluation of the data. Confidence
intervals for these estimates were calculated from Mainland's Tables
(Mainland et al. 1956). Data for replicate tests were combined to obtain a
mean estimate. The estimate assumes each fish behaved independently (i.e.,
fish within a test did not behave more similarly than fish between tests,
and there were no interactions among fish within a test). Although some
interaction is expected among fish, the assumption that each fish behaved
independently is necessary for the analytical methods used. All tests were
conducted in the same manner to reduce nonindependent behavior of fish.
The time required for planted fish to move out of the screening
facility was estimated from the total number of fish recovered and the
recovery times. Median passage times were calculated and represent the
time when 50% and 95% of the recovered fish were captured.
24
RESULTS
Fish passed through the fish bypass systems in the Richland and Satus
Canals without being descaled or killed. The results of the tests are
shown below as they relate to the objectives of each phase outlined in the
work plan. Appendix A contains a detailed summary of the catch data and
estimates for percent of test fish descaled or killed.
PHASE I TESTS
Phase I tests were designed to evaluate components within the fish
diversion system other than the rotary screens. Fish return structures at
the Richland and Toppenish/Satus Screens are simple in design and do not
include pumpback systems, multiple fish return pipes, or traveling screens.
Therefore, Phase I tests were not conducted at these sites.
PHASE II TESTS
Phase II tests were designed to evaluate either the entire fish bypass
system from the trash rack through the fish return pipe (Phase IIa), or to
evaluate specific components of the fish return system (Phase IIb). At the
Richland and Toppenish/Satus Screens, we initiated our evaluations with
Phase IIa testing. We released fish at the trash rack and captured them
before they entered the fish return pipe. We also conducted Phase IIb
tests at the Richland Screens to evaluate the potential effects of passage
through the fish return pipe. We also determined how long released fish
remained upstream of or within the fish screening facilities.
Phase IIa, Richland Screens
Of the three groups of steelhead and spring chinook salmon released
behind the trash rack (200 fish/group; 1200 fish total), 363 (61%)
steelhead and 560 (93%) spring chinook salmon were captured. About 1% of
the steelhead and 0.7% of the spring chinook salmon were descaled or dead
(Tables 1 and 2). Of 157 steelhead and 154 spring chinook salmon held for
96-hr observation, 2 steelhead and no spring chinook salmon died. Combined
losses from descaling and delayed mortality were within the 95% confidence
interval for the condition controls (Appendix A; Tables A.10 and A.ll).
25
TABLE 1. Descaling and Mortality Data from Release and Capture Tests with Steelhead, Salmo airdneri Smolts at the -g+4 Richland Canal Fish Screening aclllty, Spring 1986
95% NUMBER OF FISH FISH % CONFIDENCE
TEST GROUP RELEASED CAPTURED DESCALED DESCALED INTERVAL
II II II Ia IIa I II 11 II II I II I II 11 II II1212 1616 2020 2424 44 88 1212 1616 2020 2424 44 88 12 16 2012 16 20 2424 44
Time (Hours)Time(Hours)
FIGURE 7. Movement of Spring Chinook Salmon, Oncorhynchustshawytscha, Smolts Based on the Capture of TestFish at. the Richland Canal Fish Screening Facility,Spring 1986
FIGURE 8. Hovement of Steelhead, Salmo airdneri SmoltsBased on The Capture of- ish at the Richland+'Canal Fish Screening Facility, Spring 1986
In Phase IV tests at Richland, we released 3300 fall chinook salmon
fingerlings downstream of the trash rack and caught over 2000 of the fish
in the next 48 hr. The fish were fingerlings and, therefore, were not
expected to move quickly from the canal. Additionally, the flow at the
Richland Screens was near low flow during our tests. Although the
fingerlings were not "flushed" from the screen forebay, many were captured
in the fish return structure shortly after their release.
the test fish seemed to move out of the canal through the
time to catch
le 4). Peak mi
structure of their own volition. Estimated
chinook salmon captured was about 8 hr (Tab
after sunset (Figure 9).
Phase IIa, Toppenish/Satus Screens
The tests at Toppenish/Satus were started in June, 2 months after the
The remainder of
fish return
50% of the fall
gration occurred
canal was filled. We did not start our tests when the canal was filled
because the screens were not ready. Because of the late start date for the
tests the steelhead had to be held in water at 17°C. The scales were
easily dislodged and many fish lost scales during acclimation and
transport. To evaluate fish descaling after passage through the diversionfacility, the condition of fish captured on the inclined plane was compared
to that of fish in the control group (fish that were transported to the
site with the test fish but were not placed in the canal).
28
TABLE 4. Estimated Time (hr) to Catch 50% to 95% of Fall Chinook Salmon Oncorh nchus tshaw tscha Fingerlings Captured at Ri&l&s~'Facility, Spring 1986
TEST
:
3
TIME TO CAlCH NUMBER Ot- FISH PtRCtNT 50% 95% RELEASED CAPTURED CAPTURED
8.5 9.5 34.5 32.0 1000 1150 682 638 59.3 63.8
7.0 31.0 1150 809 70.3
80
-0 70 $ 3 5 60 K
5. z 50
73 $ 40 z z g 30
K
i 20
d 10
0
- 1st Release
-- 2nd Release
- * - 3rd Release
0 Release Time
I I I I I I I I I L 12 16 20 24 4 8 12 16 20 24 4 8 12 16 20 24 4 . 8
Time(Hours)
FIGURE 9. Movement of Fall Chinook Salmon, Oncorhynchus tshawytscha, Fingerlings Based on the Capture of Test Fish at the Richland Canal Fish Screening Facility, Spring 1986
?9
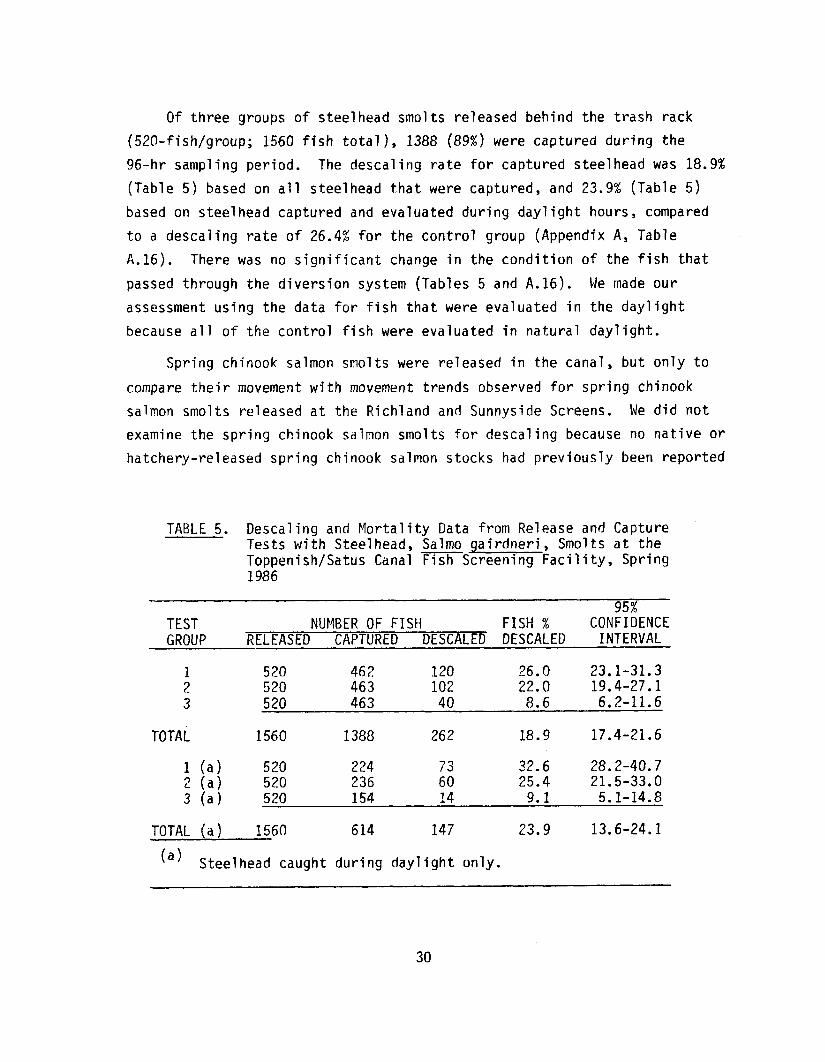
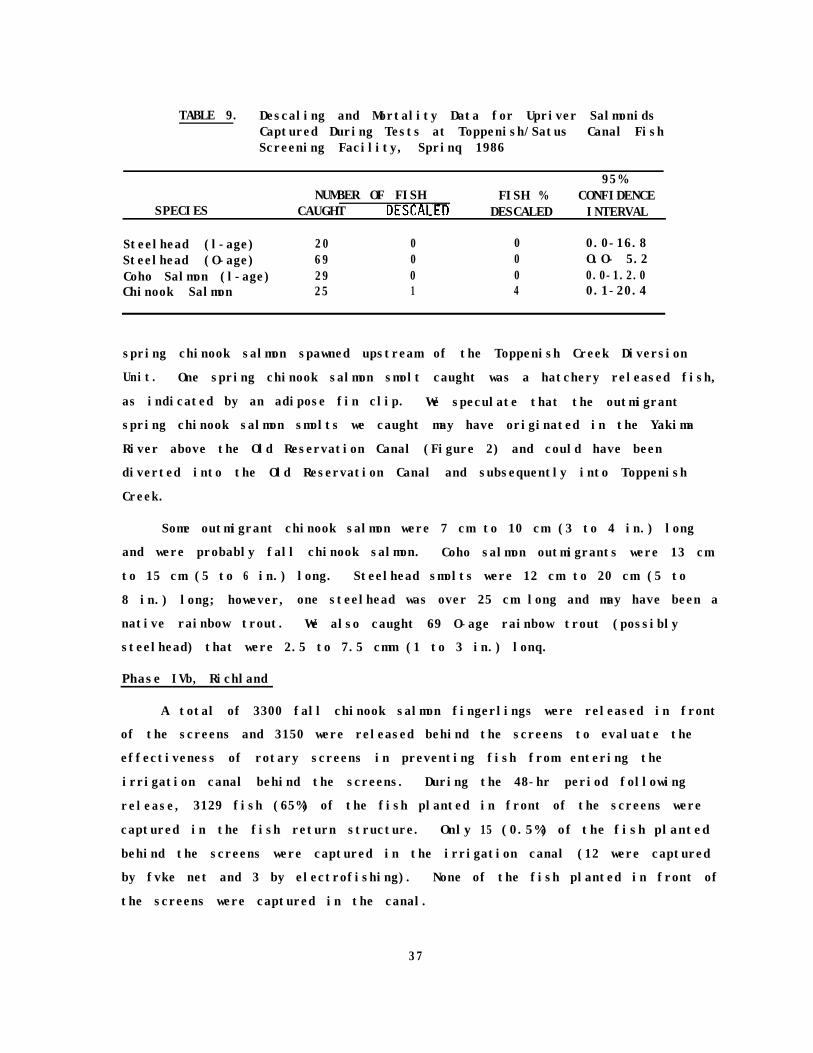
Of three groups of steelhead smolts released behind the trash rack
(52&fish/group; 1560 fish total), 1388 (89%) were captured during the
96-hr sampling period. The descaling rate for captured steelhead was 18.9%
(Table 5) based on all steelhead that were captured, and 23.9% (Table 5)
based on steelhead captured and evaluated during daylight hours, compared
to a descaling rate of 26.4% for the control group (Appendix A, Table
A.16). There was no significant change in the condition of the fish that
passed through the diversion system (Tables 5 and A.16). We made our
assessment using the data for fish that were evaluated in the daylight
because all of the control fish were evaluated in natural daylight.
Spring chinook salmon smolts were released in the canal, but only to
compare their movement with movement trends observed for spring chinook
salmon smolts released at the Richland and Sunnyside Screens. We did not
examine the spring chinook salmon smolts for descaling because no native or
hatchery-released spring chinook salmon stocks had previously been reported
TABLE 5. Descaling and Mortality Data from Release and Capture Tests with Steelhead, Salmo gairdneri, Smolts at the Toppenish/Satus Canal FishScreening Facility, Spring 1986
95% TEST NUMBER OF FISH FISH % CONFIDENCE GROUP RELEASED CAPTURED DESCALED DESCALED INTERVAL
our efforts at Richland this year and negated the data we collected.
Because of the heightened interest in evaluating screen integrity, we have
recommended new collection techniques be used during the 1987 sampling (see
Recommendations section).
POTENTIAL EFFECTS OF CHANGING SCREEN OPERATION
Operating conditions at a screening facility are important when
evaluating the relevance of fisheries evaluation data. Screen efficiency
may vary with flow, water temperature, amount of debris in the water, other
conditions that affect the screens, and the condition of the fish that
enter the screening facility. Normal operating conditions must be clearly
defined at each screening facility in order to properly evaluate screen
effectiveness.
Tests at the Richland Canal were conducted in mid-May. Peak migration
of salmonids at Horn Rapids Diversion Dam occurs in April and early May,
when water temperature is near 10°C. Capture rate of wild and hatchery
salmonids released upriver decreased throughout the sampling period,
indicating that migration had already peaked at Horn Rapids Dam.
Temperatures ranged from 13°C to 17°C during our tests.
The Richland Canal is a small irrigation diversion. Water usage
varies from 2.3 m3/sec (80 cfs) during the summer to about 0.8 m3/sec
(30 cfs) during the winter. The facility was designed for a maximum flow
of 2.5 m3/sec (90 cfs) through the screens. Our evaluation was conducted
under low flow conditions, with a flow of about 0.9 m3/sec (30 cfs) passing
through the screens, 0.3 to 0.4 m3/sec (10 to 15 cfs) through the fish
return pipe, and no spill at the waste-water channel.
Normal operating flow through the fish return system and the waste-
water channel is not defined. Flow through the fish return pipe can be
regulated from 0 to about 0.7 m3/sec (0 to 25 cfs) by usinq dam boards in
the fish bypass slot. The waste-water channel was set to be used only for
the emergency return of water to the river in case of screen failure during
our tests. However, water mav be spilled continuously to prevent the
45
buildup of debris on the trash rack and to increase water flow and velocity
to the screen structure. Outmigrant salmonids would probably move into the
channel if it were operated continuously. If the waste-water channel is
operated so that fish might routinely utilize it during migration, the
concrete channel should be extended to reach the the Yakima River at low
flow. Additionally, the continuous discharge of large volumes of water out
the waste-water channel could attract migrating adult salmonids, which
could cause them to move away from the fish ladders at Horn Rapids Dam.
Satus Canal is operated from late March through early October. The
canal was filled in early April during 1986 but the fish screens were not
put into service until the end of Flay. Our evaluation was conducted during
the first week of June, when water temperatures were high for salmonids--
24°C in Toppenish Creek and 17°C in Marion Drain. Water temperature in the
canal ranged from 18.5"C to 20°C during our evaluation, indicating that
most of the water entering the canal was from Marion Drain. The barrier
dam across Toppenish Creek was diverting all water and outmigrant fish into
the canal. The small catches of chinook and coho salmon and steelhead
indicate that very few salmonids migrate out of Toppenish Creek or Marion
Drain as late as June.
Water flow through the fish bypass slot and fish return pipe was
restricted by the BR's fish sampling plane, which was plugged with debris
and lodged in the fish bypass slot. Our tests were conducted with about
0.4 m3/sec (15 cfs) of water running through the fish return pipe, the
maximum flow available with the incapacitated plane in place. The assumed
normal operating flow through the fish return pipe (0.7 m3/sec, 25 cfs) was
not attainable during our evaluation.
The accumulation of aquatic vegetation and debris is a serious problem
at the Toppenish/Satus Screens in June. Our sampling equipment was
scrubbed at lo-minute intervals to prevent clogging. The debris can also
inhibit flow at the trash rack, causing the water level at the screens to
fluctuate. Debris that washes through the trash racks during cleaning can
accumulate at the head end of the fish bypass slot and restrict flow
through the fish return pipe. Automatic trash rack cleaners were not
46
effective at keeping the trash rack clean. The cleaners do not clean the
lower half of the trash rack. When the trash rack is partially plugged,
fish could be injured or killed at the trash rack. However, the aquatic
vegetation problem is probably more severe in the summer than it is in the
spring when most salmonids are expected to migrate through the system.
Tests at Sunnyside Canal were also conducted in June under near-
maximum flow conditions. Peak runs of native and hatchery-released
salmonids had already passed Sunnyside Dam, except for a late release of
coho salmon smolts. Delays in start up and problems with screening
facility equipment prevented us from testing more than one canal flow
condition. Impingement velocities at the screens are probably greater at
maximum flow operation than during low flow operation of the canal.
However, during low canal flows, reduced velocities might affect the
efficiency of the fish bypass system or delay migration.
47
SUMMARY
Release and capture tests and other monitoring studies have been
conducted at three diversion screening facilities in the Yakima Basin:
Sunnyside Screens (Neitzel et al. 1985), Richland Screens, and
Toppenish/Satus Screens. Objectives were to determine if fish that enter
an irrigation canal are safely and expeditiously diverted back to the
river. The objective is met by determining: 1) if fish that pass through
the diversion are killed, injured, or eaten by predators, 2) if fish are
delayed at the screen structure extend their downstream migration, and 3)
if fish are prevented from passing through or over the screens.
PHASE I
Phase I tests were conducted at the Sunnyside Screens using chinook
salmon and steelhead smolts. Test data indicate that fish safely pass
through all components of the fish bypass system. Phase I tests were not
conducted at the Richland or Toppenish/Satus Screens because the fish
bypass systems did not incorporate intermediate and terminal bypasses,
a separation chamber, traveling screens, or pumpback systems in their
designs.
PHASE II
Phase IIa tests were conducted at the Sunnyside, Richland, and
Toppenish/Satus Screens. At the Sunnyside Screens, fish were released at
either the trash rack or the headgates. Fish captured after moving through
the screen forebay and diversion system were not injured or killed. At the
Richland and Toppenish/Satus Screens, fish were released at the trash
rack. Captured fish were not killed or injured. Tests at the Sunnyside
Screens were conducted with chinook salmon and steelhead smolts, and tests
at the Richland and Toppenish/Satus Screens were conducted with chinooksalmon fingerlings as well as chinook salmon and steelhead smolts.
Phase IIb tests were conducted at Sunnyside and Richland. At
Sunnyside, tests were conducted to evaluate the intermediate bypass system,
the terminal bypass system, the secondary separation chamber, and the
primary fish return pipe. At Richland, the fish return pipe was evaluated.
49
PHASE III
Phase III tests were not conducted at the screening facilities with
the exception of fish return pipe tests at Richland, where tests were
conducted at two flows. Opportunities to conduct tests under different
canal flows were limited because of delays in construction and start up at
each of the three sites. The Sunnyside and Toppenish/Satus Screens were
evaluated at full flow condition. The Richland Screens were evaluated at
minimum flow conditions expected during the outmigration of juvenile
salmonid.
PHASE IV
Fish other than test fish were collected during all release/capture
tests. The gut contents of predacious fish were examined. Birds were
observed feeding near the screen structures and in the river near the
terminus of the fish return pipe. Rotary drum screens were examined during
release/capture tests to determine if any fish were impinged on or passed
over the screens. Although screen integrity tests were initiated at all
screens, no conclusive data have been collected.
50
RECOMMENDATIONS
Fish are safely diverted by the screening facilities. Similar tests
should be conducted at all future diversion sites to assess potential
site-specific problems. Unless data from future tests suggest otherwise,
no further testing of the bypass systems at the Sunnyside, Richland, and
Toppenish/Satus Screens is necessary.
We have not observed increased predation on juvenile salmonids in or
near the screening facilities that could be attributed to the screens. At
Richland, seagulls caught test fish as they exited the fish return pipe.
Such predation seemed to occur only when many disoriented fish were
released together. Predation by birds at the terminus of the fish return
pipe could be reduced if the pipe entered the river in a pool instead of a
riffle area. However, there is no indication that predation at the
Richland Screens was greater for upriver juvenile salmonids diverted
through the screen structure than for salmonids passing over Horn Rapids
Dam. Any potential for increased predation at the end of the fish return
pipe might be reduced if the pipe terminated in deeper water and further
from the shore. Qualitative observations on predacious fish populations
made to date could be supplemented by surveys conducted when canals are
dewatered after the irrigation season. At the Richland Canal and other
systems that operate year-round, predator surveys should be conducted after
at least one season of continuous operation.
The data are not conclusive regarding the potential for delay at the
screens. Data collected up to 96 hr after release have not documented the
clearance of all test fish from the screening facility. Test fish released
at the Richland and Toppenish/Satus Screens were monitored as they arrived
at McNary and John Day Dams. The relatively small number of fish released
in our tests is not adequate to analyze these data. However, releases oflarger numbers of salmonids in and near the screening facilities could
provide the amount of fish necessary to analyze data from the dams to
determine if juvenile salmonids are delayed by the screening facilities.
51
Testing of screen integrity should be given a high priority during
1987 tests. Determining screen integrity was a secondary priority behind
descaling tests during 1985 and 1986. Future evaluations must emphasize
collecting data to quantitatively evaluate the efficiency of screening
facilities in preventing juvenile salmonids from entering the irrigation
canals downstream of the screening facilities. For tests during 1987, we
have designed an electroshocking system to increase the efficiency of our
collection facility in the canal. A similar electroshocking system is
being used successfully at hatcheries in Western Oregon to guide adult
fish. We are planning to use the electroshocking system to increase net
efficiency and net retention; we do not expect to guide the juvenile
salmonids toward our collection facility. This system is designed to
provide us with an adequate sample to quantitatively estimate the number of
fish passing through the screens. We will release branded fish to test the
effectiveness of our sampling gear.
Operating standards for each screening facility must be established,
including minimum flow through the fish bypass, conditions for
implementation of auxiliary systems like the waste-water channel at the
Richland Screens or the secondary fish return pipe at the Sunnyside
Screens, and pumping schedules for fish-water return systems. Operating
standards should require a log of screen operations (e.g., screen downtime,
screen removal, screen clogging, flow volume through various bypass
components). Practically all tests at the Sunnyside, Richland, and
Toppenish/Satus Screens were conducted under one set of operating
conditions for each site. Evaluations may be recommended for a range of
operating conditions (i.e., lowest canal flow to highest flow, lowest water
temperature to highest, maximum to minimum flow through the fish bypass
system). Whether or not we recommend more tests will depend on the results
of tests at Wapato and Town and the standard operating procedures that are
established for Sunnyside, Richland, and Toppenish/Satus. Further tests
may be required at Richland when the operating procedures for the waste-
water channel are established. Additionally, the potential for the
waste-water channel to attract adult salmonids should be evaluated.
52
REFERENCES
Basham, L. R., M. R. Delarm, J. B. Athern, and S. W. Pettit. 1982. FishTransportation Oversight Team Annual Report, FY 1981: TransportOperations on the Snake and Columbia Rivers. Technical ServicesDivision, Northwest Regional Office, National Oceanic and AtmosphericAdministration, National Marine Fisheries Service, Portland, Oregon.
Bureau of Reclamation. 1984. Finding of No Significant Impact: FishPassage and Protective Facilities, Yakima River Basin, Washington.Bureau of Reclamation, Pacific Northwest Region, Boise, Idaho.
Easterbrooks, J. A. 1984. Juvenile Fish Screen Design Criteria: AReview of the Objectives and Scientific Data Base. State of Washington,Department of Fisheries, Habitat Management Division, Yakima, Washington.
Fast, D., J. Hubble, and B. Watson. 1986. Yakima River Spring ChinookEnhancement Study Fisheries Resources Management Yakima Indian Nation.Prepared bv the Division of Fisheries, Yakima Indian Nation for theBonneville Power Administration, Portland, Oregon.
Hollowed, J. J. 1984. 1983 Yakima River Fall Fish Counts at Prosser Dam.Yakima Indian Nation, Fisheries Resource Management Technical Report No.84-11. Yakima Indian Nation, Toppenish, Washington.
Mainland, D., L. Herrera, and M. I. Sutcliffe. 1956. Tables for Use WithBinomial Samples. Mainland, Herrera, and Sutcliffe, New York, New York.
Neitzel. D. A.. C. S. Abernethv. E. W. Lustv. and L. A. Prohammer. 1985.A Fisheries-Evaluation of the Sunnyside Canal Fish Screening Facility,Spring 1985. Prepared by the Pacific Northwest Laboratory, Richland,
inqton for the Division of Fish and Wildlife, Bonneville PowerWashAdministration, Portland, Oregon.
Northwest Power Planning Council (NPPC). 1984. Fish and Wildlife Program(as amended). Northwest Power Planning Council, Portland, Oregon.
53
APPENDIX A
RELEASE AND CAPTURE DATA FR O M THE SUNNYSIDE, RICHLAND,
AND TOPPENISH/SATUS CANAL FISH SCREENING FACILITY EVALUATIONS
APPENDIX A
RELEASE AND CAPTURE DATA FROM SUNNYSIDE, RICHLAND,
AND TOPPENISH/SATUS CANAL FISH SCREENING FACILITIES EVALUATIONS
This appendix contains data collected during the evaluations of
Sunnyside (Neitzel et al. 1985), Richland, and Toppenish/Satus Fish
Screening Facilities. Data presented in the Results sections are sometimes
combined (i.e., individual trials within a test series were combined for a
single estimate). Descaled fish were considered dead for these estimates.
Combining of dead and descaled fish was also used to evaluate screen
performance.
Data from the Sunnyside Screens indicate that fish are safely diverted
from the canal to the river. Data are presented in seven tables (Tables
A.l-A.7). The data in Tables A.1 and A.2 are from the evaluation of the
inclined plane and fyke net. Both samplers collected fish without killing
or descaling the fish. Data in Tables A.3 and A.4 are evaluations of the
condition of test fish prior to releasing in the canal or screen facility.
Test fish were in good condition prior to their release. Data in Tables
A.5 and A.6 are the results of the screening facility evaluations.
Descaling data from upriver hatchery and native fish are presented in
Table A.7.
Data from the Richland Screens evaluation indicate that fish are
safely diverted from the canal to the river. Data are presented in seven
tables (Tables A.8-A.15). Data in Tables A.8 and A.9 are from the
evaluation of the inclined plane and the fyke net. The inclined plane
safely collected fish. The fyke net descaled too many fish to be used as
an effective collection device at the terminus of the Richland Canal fish
return pipe during flows of 0.6 m3/sec (20 cfs). Therefore, we used an
electroshocker to collect fish during the evaluation of the fish return
pipe. Data in Tables A.10 and A.11 are evaluations of the condition of the
test fish prior to their release in the canal. Fish were in good condition
prior to release. Data in Tables A.12 and A.13 are the results of
A.1
screening facility evaluations. Data in Table A.14 are the estimated times
for test fish to move through the Richland Screen Facility. Descaling data
from upriver hatchery and native fish are presented in Table A.15.
Data from the Toppenish/Satus Screens evaluation indicate that fish
are safely diverted from the canal to the river. Data are presented in
four tables (Tables A.16-A.19). Data in Table A.16 are evaluations of the
condition of the test fish prior to release in the canal. The fish were in
marginal condition prior to testing. The water temperature at the canal
during testing was near 2O"C, therefore we acclimated the test to near
20°C. The scales were loose on the test fish and many of them became
descaled during acclimation and transport; however, the test data are
useful. The condition of the test fish as a population was not degraded by
passage through the screen diversion. This conclusion is based on the
change of condition between test and control populations. Data in Table
A.17 are the results of screening facility evaluations. Data in Table A.18
are the estimated times for test fish to move through the Toppenish/Satus
Screen Facility. Descaling data from upriver hatchery released and native
fish are in Table A.19.
A.2
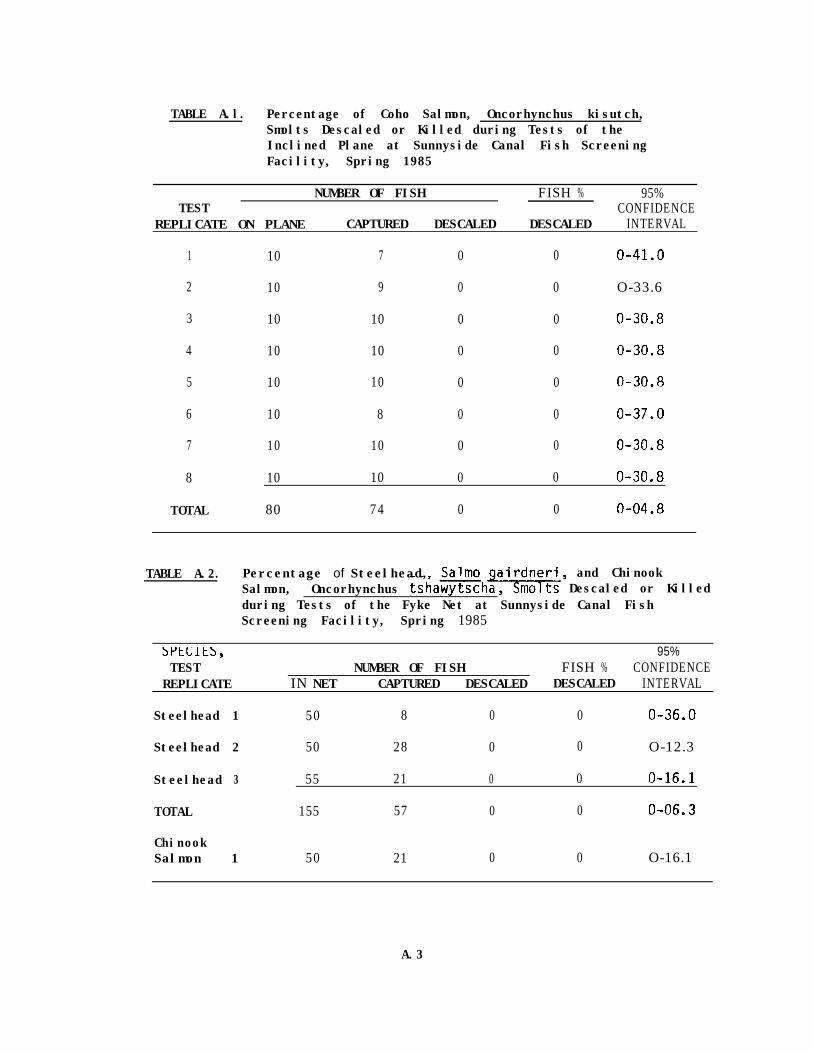
TABLE A.l. Percentage of Coho Salmon, Oncorhynchus kisutch,Smolts Descaled or Killed during Tests of theInclined Plane at Sunnyside Canal Fish ScreeningFacility, Spring 1985
NUMBER OF FISH FISH % 95%TEST CONFIDENCE
REPLICATE ON PLANE CAPTURED DESCALED DESCALED INTERVAL
1 10 7 0 0 O-41.0
2 10 9 0 0 O-33.6
3 10 10 0 0 O-30.8
4 10 10 0 0 O-30.8
5 10 10 0 0 O-30.8
6 10 8 0 0 O-37.0
7 10 10 0 0 O-30.8
8 10 10 0 0 O-30.8
TOTAL 80 74 0 0 O-04.8
TABLE A.2. Percentage of Steelhead, and ChinookSalmon, Oncorhynchus Descaled or Killedduring Tests of the Fyke Net at Sunnyside Canal FishScreening Facility, Spring 1985
SPECIES, 95%TEST NUMBER OF FISH FISH % CONFIDENCE
REPLICATE IN NET CAPTURED DESCALED DESCALED INTERVAL
Steelhead 1 50 8 0 0 O-36.0
Steelhead 2 50 28 0 0 O-12.3
Steelhead 3 55 21 0 0 O-16.1
TOTAL 155 57 0 0 O-06.3
ChinookSalmon 1 50 21 0 0 O-16.1
A.3
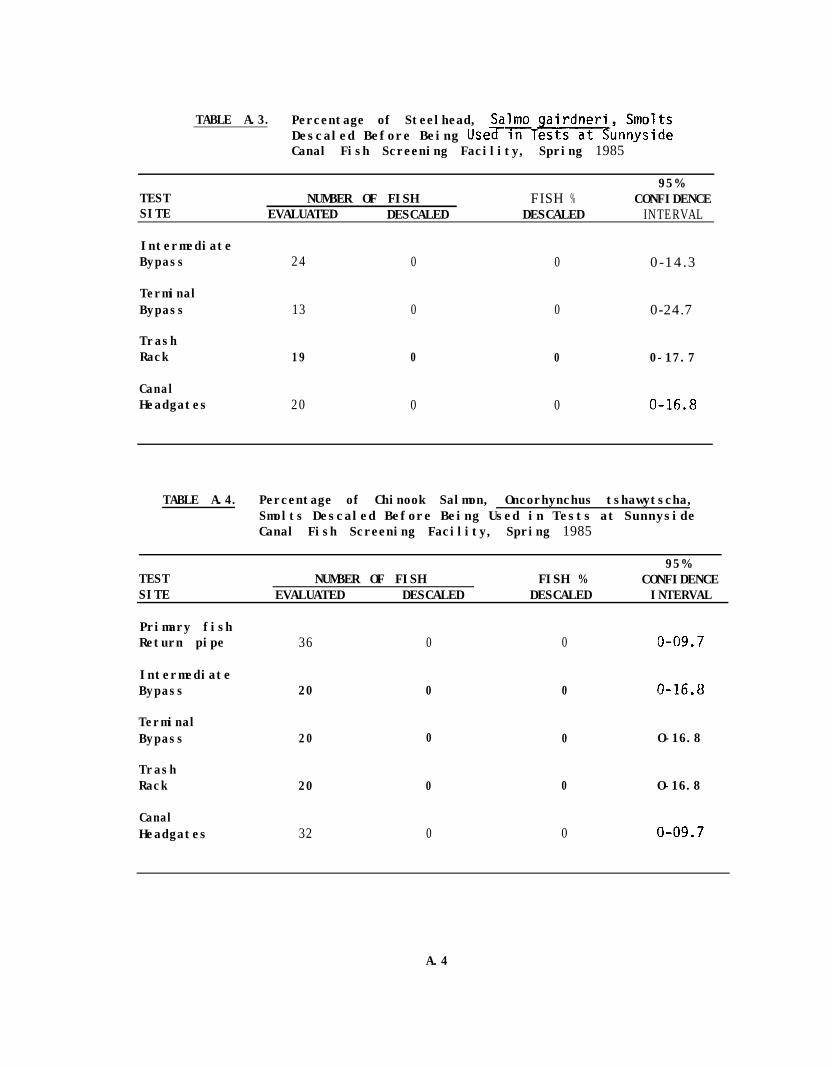
TABLE A.3. Percentage of Steelhead, SalmoDescaled Before Being Used inT T at
gairdner~~n~;;~;~
Canal Fish Screening Facility, Spring 1985
95%TEST NUMBER OF FISH FISH % CONFIDENCESITE EVALUATED DESCALED DESCALED INTERVAL
IntermediateBypass 24 0 0 0-14.3
TerminalBypass 13 0 0 0-24.7
TrashRack 19 0 0 0-17.7
CanalHeadgates 20 0 0 O-16.8
TABLE A.4. Percentage of Chinook Salmon, Oncorhynchus tshawytscha,Smolts Descaled Before Being Used in Tests at SunnysideCanal Fish Screening Facility, Spring 1985
95%TEST NUMBER OF FISH FISH % CONFIDENCESITE EVALUATED DESCALED DESCALED INTERVAL
Primary fishReturn pipe 36 0 0 O-09.7
IntermediateBypass 20 0 0 O-16.8
TerminalBypass 20 0 0 O-16.8
TrashRack 20 0 0 O-16.8
CanalHeadgates 32 0 0 O-09.7
A.4
TABLE A.5. Percentage of Steelhead, Salmo airdneri Smolts Descaled orKilled in Each Test at the Sunnyside anal Fish Screening+'Facility, Spring 1985
95%RELEASE TEST NUMBER OF FISH FISH % CONFIDENCE
SITE REPLICATE RELEASED CAPTURED DESCALED DESCALED INTERVAL
Primary fishReturn pipe 1 50 8 0 0 O-36.8
2 50 16 6 0 0 0 0 O-20.6 o-45.9
IntermediateBypass 1 275 139 0 0 O-02.6
TerminalBypass 1 200 112 0 0 O-03.2
TrashRack 1 500 126 0 0 O-02.9
CanalHeadgates 1 500 100 0 0 O-03.6
A.5
TABLE A.8. Percentage of Chinook Salmon, Oncorh nchus tshaw tscha~&tthe'PlaneSmolts Descaled or Killed During
at Richland Canal Fish Screening Facility, Spring 1986
95%TEST NUMBER OF FISH FISH % CONFIDENCE
RACE REPLICATE RELEASED CAPTURED DESCALED DESCALED INTERVAL
Spring 1 25 21 0 0 O-16.1Control 19 0 0 0-17.7
Fall 1 25 0 0 O-20.6Control 0 0 O-16.8
2 500 156 0 0 O-02.3
TABLE A.9. Percentage of Chinook Salmon, Oncorhynchus tshawytscha,Smolts Descaled or Killed During Tests of the Fy k e Netat Richland Canal Fish Screening Facility, Spring 1986(The L designation indicates tests at 0.6 m3/sec flowthrough the fish return pipe and the H designationindicates tests at 1.6 ms/sec flow through the fishreturn pipe)
95%TEST NUMBER OF FISH FISH % CONFIDENCE
REPLICATE RELEASED CAPTURED DESCALED DESCALED INTERVAL
TABLE A.12. Descaling and Mortality Data from Release and CaptureTests with Steelhead, Salmo airdneri Smolts at the-J-+Richland Canal Fish Screening Faci lty, Spring 1986
95%TEST NUMBER OF FISH FISH % CONFIDENCEGROUP 4 DESCALED INTERVAL
TABLE A.13.-e-w- Descaling and Mortality Data from Release and CaptureTests with Spring Chinook Salmon, Oncorhvnchus tshawytscha,Smolts at the Richland Canal Fish Screening Facility,Spring 1986 (E.S. = electroshocker and I.P. = inclinedplane)
95%TFST CAPURE FLOW NUMRER OF FISH FISH % CONFIDENCESITE METHOD (m3/sec, RELEASED CAPTURED DESCALED DESCALED INTERVAL
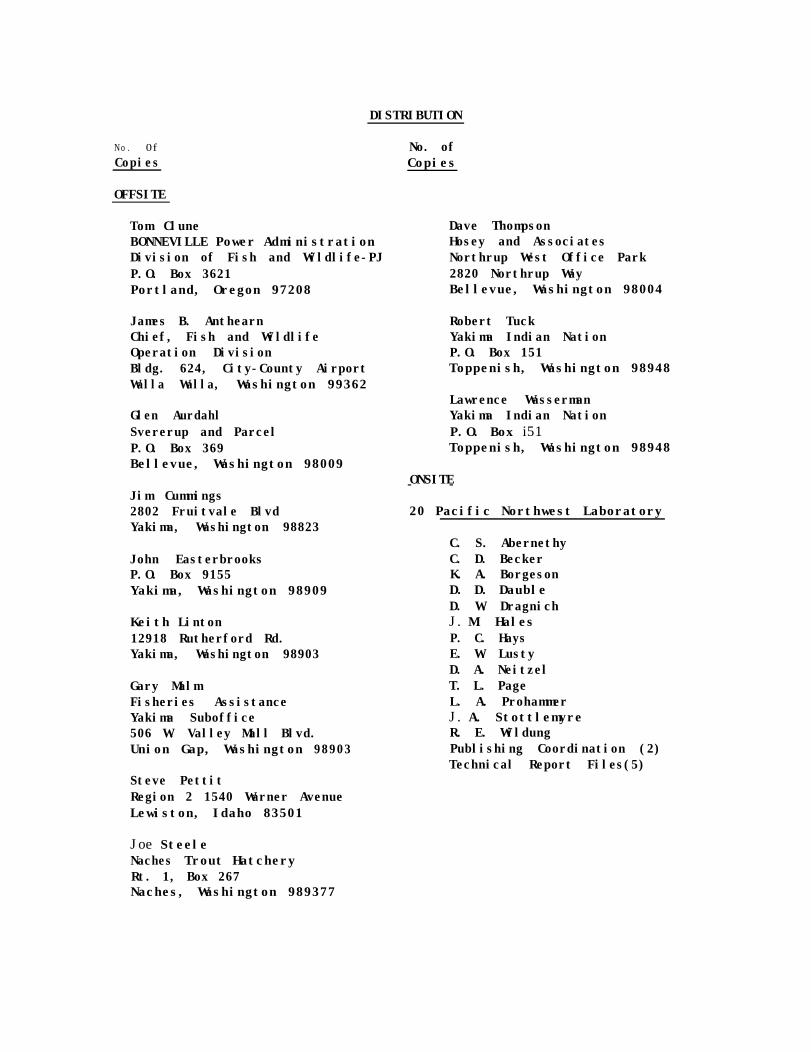
Tom CluneBONNEVILLE Power AdministrationDivision of Fish and Wildlife-PJP.O. Box 3621Portland, Oregon 97208
James B. AnthearnChief, Fish and WildlifeOperation DivisionBldg. 624, City-County AirportWalla Walla, Washington 99362
Glen AurdahlSvererup and ParcelP.O. Box 369Bellevue, Washington 98009
Jim Cummings2802 Fruitvale BlvdYakima, Washington 98823
John EasterbrooksP.O. Box 9155Yakima, Washington 98909
Keith Linton12918 Rutherford Rd.Yakima, Washington 98903
Gary MalmFisheries AssistanceYakima Suboffice506 W. Valley Mall Blvd.Union Gap, Washington 98903
Steve PettitRegion 2 1540 Warner AvenueLewiston, Idaho 83501
Joe SteeleNaches Trout HatcheryRt. 1, Box 267Naches, Washington 989377
No. ofCopies
Dave ThompsonHosey and AssociatesNorthrup West Office Park2820 Northrup WayBellevue, Washington 98004
Robert TuckYakima Indian NationP.O. Box 151Toppenish, Washington 98948
Lawrence WassermanYakima Indian NationP.O. Box i51Toppenish, Washington 98948
ONSITE- -
20 Pacific Northwest Laboratory
C. S. AbernethyC. D. BeckerK. A. BorgesonD. D. DaubleD. W. DragnichJ. M. HalesP. C. HaysE. W. LustyD. A. NeitzelT. L. PageL. A. ProhammerJ. A. StottlemyreR. E. WildungPublishing Coordination (2)Technical Report Files(5)