80
Page 1 Grazing Winter Crops Roadshow Workshop Notes March 2008
Page 1
Grazing Winter Crops Roadshow
Workshop NotesMarch 2008


Grazing Winter Crops Roadshow
Workshop NotesMarch 2008
Free Food Thoughtfor
Grazing Winter Crops Roadshow
Workshop NotesMarch 2008

Page ii
Free Food Thoughtfor
Intent of these workshop notes
These notes bring together the latest results from the Grain & Graze Program on grazing winter crops.
They combine experimental results, producer information and observations from areas across Australia and identify insights and consequences of grazing winter crops on mixed farms. The notes are not intended to report on all the information that exist on grazing winter crops but rather to support the events being conducted by Grain & Graze in March 2008.
Winter crops offer many opportunities beyond sowing and harvesting for grain. There is opportunity for grazing and grain, but farmers need to know how to exploit the opportunities grazing provides while minimising any negative effects.
Grazing winter crops can provide a ‘free lunch’, but only if the advantages gained from grazing are not outweighed by the impact the grazing has on silage or hay, crop yields, grain quality and the longer term effects on weeds and the soil.
The circumstances on every farm will be different which means there is a vast range of possible combinations. There is no recipe to grazing winter crops. Instead there are some general rules that help farmers and advisors to appreciate the impacts and benefi ts from grazing different crops, at different times and for different durations and intensities. Each individual will need to consider these pros and cons and determine the best fi t for their farm.
The workshop notes are structured in a way to answer the questions farmers commonly ask about grazing winter crops.
The notes have been compiled by Cam Nicholson with contributions from people in the following Grain & Graze regions
Avon (David Kessell, Shahajahan Miyan, Sam Clune, Barb Sage, Tenielle Martin)•
Corangamite / Glenelg Hopkins (Geoff Dean, Simon Falkiner, Frank Mickan, • Cam Nicholson and David Watson).
Eyre Peninsula (Brian ‘Smokey’ Ashton, Emma McInerny, Tim Prance) •
Mallee (Tim Prance, Zubair Shahzad)•
Murrumbidgee (Katrina Sait)•
Northern Ag (Janette Drew, Phil Barrett-Lennard, Tim Wiley)•
National support•
CSIRO (Hugh Dove, Libby Salmon) –
Consultants (Andrew Bathgate) –
Editing (Sefton & Associates) –
Design & Illustration – Marg McKenzie
Printing – Adams Print, Geelong
DisclaimerThe advice provided in these notes is intended as a source of information only. Grain & Graze does not guarantee that these notes are without fl aw of any kind or is wholly appropriate for your purposes and therefore disclaims all liability for any error, loss or other consequence which may arise from you relying on any information in this publication.
Copying of these notes and information contained within Information in these notes may be reproduced in whole or part, as long as due recognition is given to the Grain & Graze Program.

Page iii
Grazing Winter Crops Roadshow
Workshop NotesMarch 2008
Contents1. The opportunities grazing winter crops provide (why do it?) 1
1.1 The grazing opportunity 5
1.2 Calculating the amount of extra feed 5
1.3 How can the grazing opportunity be valued? 7
1.3.1 Valuing the dry matter eaten 7
1.3.2 Valuing the liveweight gain 8
1.3.3 Valuing the extra stocking rate 9
1.3.4 Valuing the extra pasture grown when the crops are grazed 11
1.3.5 Valuing the whole farm impacts 12
1.4 Balancing the benefi ts and the cost 14
1.5 Grazing crops - making the decision 15
1.6 What is on the horizon with grazing crops? 17
2: What and how to do it (agronomy at the paddock scale) 21
2.1 When to sow 25
2.2 What to sow 26
2.3 How much dry matter is produced? 28
2.4 Options for increasing dry matter production up to growth stage 30 30
2.5 What is the quality of the dry matter? 33
2.6 Grazing 34
2.7 Suitable livestock 43
2.8 Use of herbicides 43
3: The effects of grazing (impacts at the paddock scale) 45
3.1 Variability in the growing season 45
3.2 Effect of grazing on crop maturity 47
3.3 Effect of grazing on grain yield 49
3.4 Effect of grazing on grain quality and grain characteristics 52
3.5 Effect of grazing on silage, hay and stubble 53
3.6 Livestock response to grazing (and animal health issues) 56
3.6.1 Liveweight 56
3.6.2 Animal health 58
3.7 Grazing and the impact on crop weeds 59
3.7.1 So what does this mean for grazing crops? 60
3.8 Grazing and the impact on crop diseases 64
Appendix 1: Cereal growth rates by Grain & Graze region 66
Appendix 2: Ready reckoner of crop height and estimated dry matter 68
Appendix 3: Dry sheep equivalent (DSE) rating for different classes 69 of livestock
Appendix 4: Budget sheet to calculate the number of stock needed 70 to graze a specifi ed herbage mass over a given number of days

Page iv
Free Food Thoughtfor

Page 1
Grazing Winter Crops Roadshow
Workshop NotesMarch 2008
1. The opportunities grazing winter crops provide (why do it?)
Winter crops offer a range of opportunities to the farming system. The most obvious
opportunity in a mixed farming system is to graze the crop when it is tillering, eating
the leaves at the time of year when other feed is often in short supply. Once grazing
is completed, there may also be opportunities to use the crop for silage, hay, grain
and straw. Winter crops are also being considered as an alternative forage source to
traditional pasture as variability in climate becomes more challenging. The alternative
uses provide an opportunity to make different decisions depending on the season (see
Grazing crops as a drought strategy to minimise seasonal risk in Western Australia).
Grazing crops as a drought strategy to minimise seasonal risk in Western Australia
Due to drought, some farmers in the previously reliable northern wheat belt of Western
Australia are turning to winter crops to reduce production risk. They are increasing
the area sown to crops, but are reducing up-front inputs and therefore costs. As the
season unfolds they are making tactical decisions about further inputs (e.g. nitrogen
and post emergent weed control) and whether to graze some crops.
If the early winter rains are good then annual pasture paddocks will produce suffi cient
feed which means the crops are not needed for grazing. The grain crops are then taken
through to harvest ungrazed. However, if early rains are poor then cropped paddocks
will be grazed to ensure there is enough feed for livestock without additional hand
feeding. Grazing will also control the seed set of weeds, such as wild radish, without
the need for post emergent herbicides.
The timing and duration of grazing is also fl exible. A single grazing in the tillering to
stem elongation phase will not reduce grain yield, and may even increase yield in a
dry year as there is less leaf canopy in winter and so more soil moisture remaining for
grain fi ll in spring. If the season turns into a true drought, then livestock will continue
grazing crops for the remainder of the season. These crops would have failed for
grain production anyway, but provide valuable feed for livestock. The grazed crops
also provide better protection from wind erosion than volunteer pastures over the
following summer.
Page 2
Free Food Thoughtfor
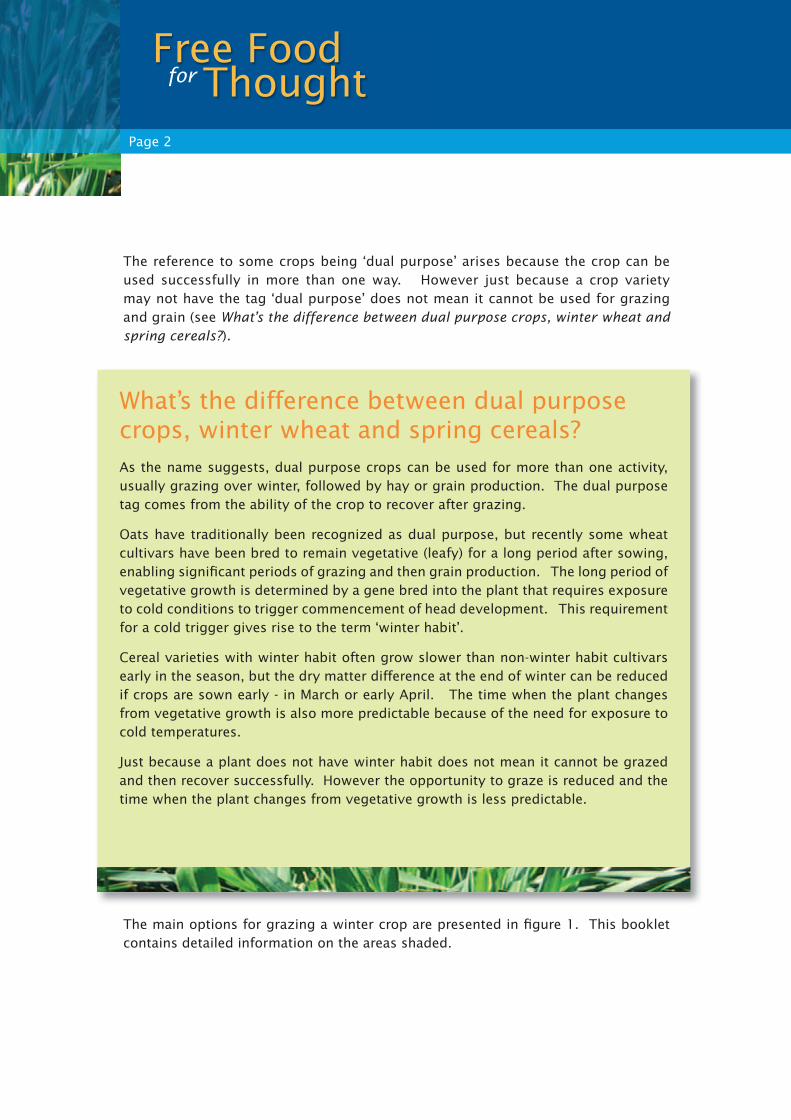
The reference to some crops being ‘dual purpose’ arises because the crop can be
used successfully in more than one way. However just because a crop variety
may not have the tag ‘dual purpose’ does not mean it cannot be used for grazing
and grain (see What’s the difference between dual purpose crops, winter wheat and
spring cereals?).
The main options for grazing a winter crop are presented in fi gure 1. This booklet
contains detailed information on the areas shaded.
What’s the difference between dual purpose crops, winter wheat and spring cereals?
As the name suggests, dual purpose crops can be used for more than one activity,
usually grazing over winter, followed by hay or grain production. The dual purpose
tag comes from the ability of the crop to recover after grazing.
Oats have traditionally been recognized as dual purpose, but recently some wheat
cultivars have been bred to remain vegetative (leafy) for a long period after sowing,
enabling signifi cant periods of grazing and then grain production. The long period of
vegetative growth is determined by a gene bred into the plant that requires exposure
to cold conditions to trigger commencement of head development. This requirement
for a cold trigger gives rise to the term ‘winter habit’.
Cereal varieties with winter habit often grow slower than non-winter habit cultivars
early in the season, but the dry matter difference at the end of winter can be reduced
if crops are sown early - in March or early April. The time when the plant changes
from vegetative growth is also more predictable because of the need for exposure to
cold temperatures.
Just because a plant does not have winter habit does not mean it cannot be grazed
and then recover successfully. However the opportunity to graze is reduced and the
time when the plant changes from vegetative growth is less predictable.
Page 3
Grazing Winter Crops Roadshow
Workshop NotesMarch 2008
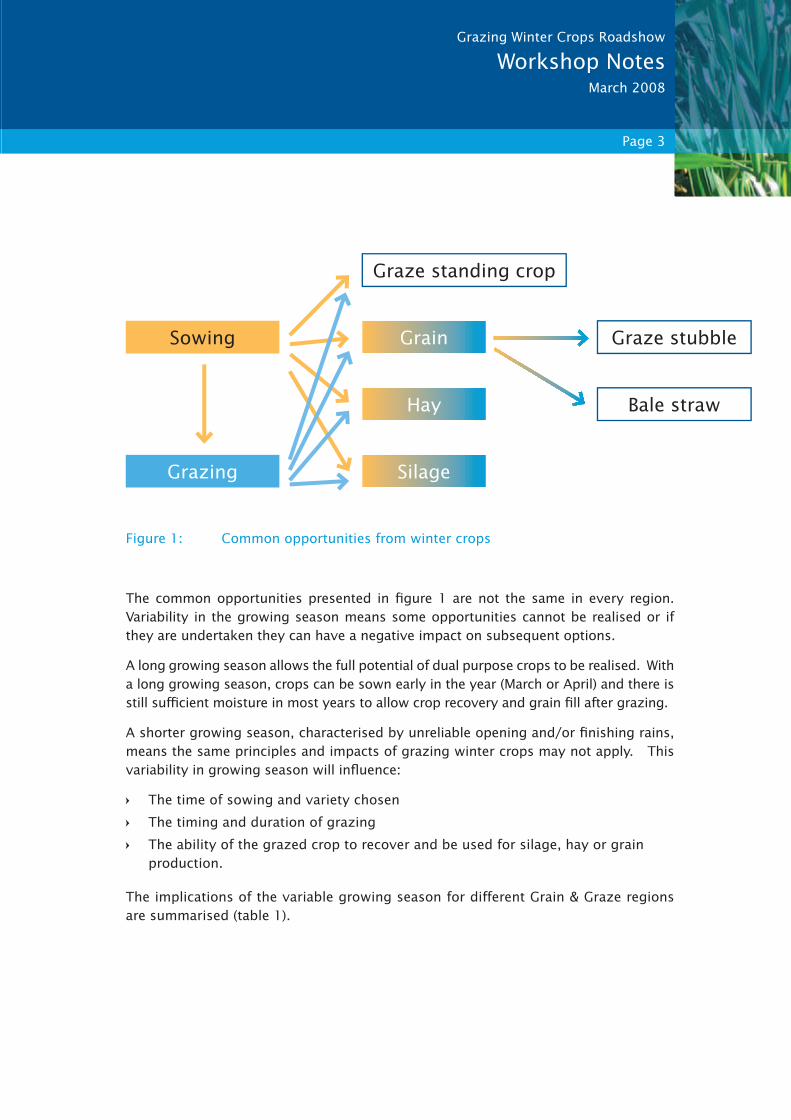
Figure 1: Common opportunities from winter crops
The common opportunities presented in fi gure 1 are not the same in every region.
Variability in the growing season means some opportunities cannot be realised or if
they are undertaken they can have a negative impact on subsequent options.
A long growing season allows the full potential of dual purpose crops to be realised. With
a long growing season, crops can be sown early in the year (March or April) and there is
still suffi cient moisture in most years to allow crop recovery and grain fi ll after grazing.
A shorter growing season, characterised by unreliable opening and/or fi nishing rains,
means the same principles and impacts of grazing winter crops may not apply. This
variability in growing season will infl uence:
The time of sowing and variety chosen
The timing and duration of grazing
The ability of the grazed crop to recover and be used for silage, hay or grain
production.
The implications of the variable growing season for different Grain & Graze regions
are summarised (table 1).
Sowing
Grazing Silage
Hay
Graze standing crop
Graze stubble
Bale straw
Grain

Page 4
Free Food Thoughtfor
Table 1 Characteristics of the growing season and implications for grazing
winter crops
Region Time of sowing Opportunity for grazing
Recovery after grazing
Avon (Sthn WA) Late April to beginning of June
Limited to about two to four weeks in low rainfall areas, four to six weeks in higher rainfall areas.
Grain yield usually not affected if grazed early.
Grazing at late tillering likely to affect yield unless favourable spring fi nish.
Southern Vic, SE South Aust and Tasmania
(Corangamite / Glenelg Hopkins)
Usual May sowing. Feb/ March sowing unreliable except with irrigation. Often reliable in Tas.
Limited to about six to eight weeks to avoid grain yield loss. Drymatter for grazing often small. 10 weeks in Tas.
Generally good unless warm dry conditions in early Spring. Silage or hay is possible. Grain fi ll is generally not affected unless dry late spring.
Upper Eyre Peninsula (SA)
Usually May
Early / dry sowing in March / April
Limited to four weeks if targeting grain
Grain yield usually affected, except under very favourable seasons
Lower Eyre Peninsula / Kangaroo Island, (SA)
May / June Four – six weeks if targeting grain
Not affected if grazed early. Grazing at late tillering likely to affect yield unless favourable spring fi nish.
Mid North & Yorke Peninsula, SA
May / June Limited to about six to eight weeks to avoid grain yield loss.
Grain fi ll is generally not affected unless dry late spring.
Mallee (SA, Vic, NSW)
Usually May. Rare opportunity for early sowing but success relies on follow up rains.
Limited to about four to six weeks.
Affected in most years. Reduction in grain yield common even if grazing is completed before stem elongation.
Murrumbidgee (NSW)
Often in Feb / March because of adequate autumn rains.
Up to 10 weeks if sown early.
Generally good unless warm dry conditions in early Spring. Silage or hay is possible. Grain fi ll is generally not affected unless dry late spring.
Northern WA (Northern Ag Region)
Late April to the beginning of June
Limited to about two to four weeks in low rainfall areas, four to six weeks in higher rainfall areas.
One grazing in lower rainfall areas. Grazing twice can substantially reduce grain yields.
Stock can selectively graze out weeds in lupins and certain cereal varieties.
It is critical to appreciate the differences in regional characteristics so the opportunities
and risks of grazing winter crops are understood before decisions are made.
Details about the agronomy and risk of grazing winter crops are presented in section
2 and 3 of these notes.

“”
Page 5
Grazing Winter Crops Roadshow
Workshop NotesMarch 2008
1.1 The grazing opportunity
In the context of a whole farm, winter crops
change the amount of feed available for grazing
(i.e. it is increased). Just how this additional
feed is captured and used to best advantage will
depend on the individual.
The most common uses of this extra feed is to:
Fill a winter feed defi cit, avoiding underfeeding,
reducing the need for supplementation or the
need to sell stock at low prices (see case study 1)
Provide more feed so stocking rates can be
increased to better utilise the spring surplus
(see How do winter crops change feed supply
and infl uence stocking rate?)
To ‘spell’ pastures from grazing, enabling
them to ‘get away’ and reach pasture
benchmarks for lambing or calving
Provide the opportunity to ‘punt’ and trade
stock, by purchasing at times of low prices
(see case study 2).
1.2 Calculating the amount of extra feed
The amount of dry matter (DM) available for
grazing can be calculated if the type of crop,
growth rate and days before grazing commences,
are known. However it is important to use the
appropriate regional growth rates, as variability in
growth between regions can be substantial. For
example, a barley crop sown in South West Victoria
at the start of May would produce approximately
1200 kg/ha DM at the end of June (table 2). In
contrast, the Northern Agricultural Region of
Western Australia could produce as little as 450
kg/ha by the end of June, or as much as 1350
kg/ha, depending on the seasonal infl uence on
growth rates. Average monthly growth rates for
some regions are presented (appendix 1).
Case study 1
Grazing winter crops avoids the need to offl oad stockWayne Johnson, the Manager of
“Warrambeen” in South West Victoria,
decided to graze his winter crops for
the fi rst time in 2007. Due to the late
break and lack of suitable pasture, Wayne
was confronted with having to sell 1500
merino weaners he had fed through the
drought into a falling livestock market.
In consultation with Agronomist David
Watson, Wayne decided to graze 148
hectares (ha) of Kosiuszcko short season
triticale, followed by grazing two paddocks
of red wheat (varieties 1077 and 1078).
Grazing of the triticale commenced on
May 4 when only 430 kg of dry matter per
ha was on offer and grazing of the wheat
fi nished on August 3.
The triticale had good early
establishment and grew a bulk
of feed early which we could use
before we put the stock on the
red wheat, which was slower to
establish but grew the bulk of feed
later,” he says.
By using the triticale, then the wheat,
we were able to stagger our grazing and
graze cereals for longer.”
The merino weaners gained 12.5 kg over
this period and were sold in August for with
an added value of $26.70 to $47.50/head.
Most of the triticale crop was cut for
silage (9.2 tonnes/ha), with 40 ha taken
through for grain. The grazed crop
yielded 0.48 t/ha more grain than the
ungrazed crop. Wayne believes that
grazing delayed crop maturity by about a
week and it is thought that this reduced
the impact of frost on yield.
Page 6
Free Food Thoughtfor
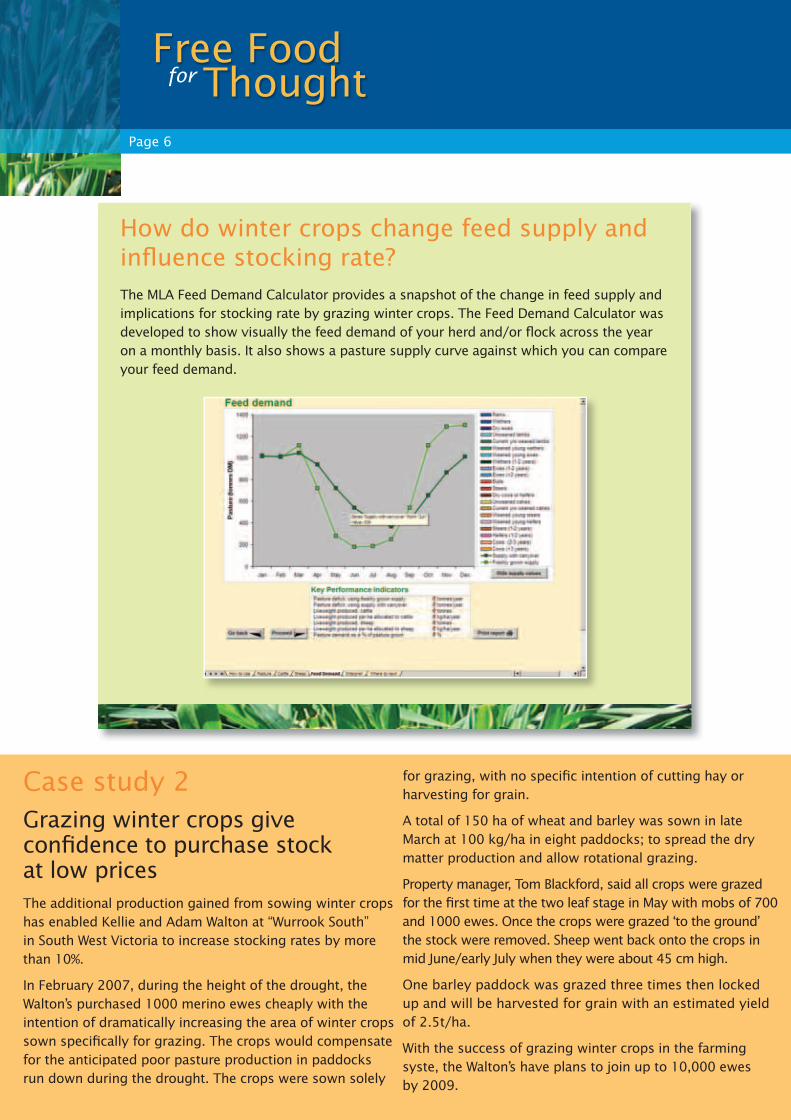
How do winter crops change feed supply and infl uence stocking rate?
The MLA Feed Demand Calculator provides a snapshot of the change in feed supply and
implications for stocking rate by grazing winter crops. The Feed Demand Calculator was
developed to show visually the feed demand of your herd and/or fl ock across the year
on a monthly basis. It also shows a pasture supply curve against which you can compare
your feed demand.
Case study 2
Grazing winter crops give confi dence to purchase stockat low pricesThe additional production gained from sowing winter crops
has enabled Kellie and Adam Walton at “Wurrook South”
in South West Victoria to increase stocking rates by more
than 10%.
In February 2007, during the height of the drought, the
Walton’s purchased 1000 merino ewes cheaply with the
intention of dramatically increasing the area of winter crops
sown specifi cally for grazing. The crops would compensate
for the anticipated poor pasture production in paddocks
run down during the drought. The crops were sown solely
for grazing, with no specifi c intention of cutting hay or
harvesting for grain.
A total of 150 ha of wheat and barley was sown in late
March at 100 kg/ha in eight paddocks; to spread the dry
matter production and allow rotational grazing.
Property manager, Tom Blackford, said all crops were grazed
for the fi rst time at the two leaf stage in May with mobs of 700
and 1000 ewes. Once the crops were grazed ‘to the ground’
the stock were removed. Sheep went back onto the crops in
mid June/early July when they were about 45 cm high.
One barley paddock was grazed three times then locked
up and will be harvested for grain with an estimated yield
of 2.5t/ha.
With the success of grazing winter crops in the farming
syste, the Walton’s have plans to join up to 10,000 ewes
by 2009.

Page 7
Grazing Winter Crops Roadshow
Workshop NotesMarch 2008
Table 2 Calculation of anticipated feed available from barley sown at the start of
May, South West Vic
Month Days in month
Estimated growth rate1
(kg DM/ha/day)
Feed on offer at end of month (kg/ha)
May 31 15 465
Jun 30 25 1215 (465 + 750)
A more comprehensive way to determine the implications of the extra feed provided
from cropping paddocks is to use the MLA Feed Demand Calculator (see How do winter
crops change feed supply and infl uence stocking rate?).1 This computer spreadsheet
enables users to construct a whole farm feed profi le, including both crops and pasture.
By choosing the crop type, area and grazing date, the impact on the monthly feed supply
across the whole farm can be calculated.
Copies of the Feed Demand Calculator can be downloaded from the MLA website
(hint: type ‘feed demand calculator’ in the search box).
1.3 How can the grazing opportunity be valued?
There are many ways to put a dollar value on the opportunity that grazing winter
crops provide. Some possible options are presented and farmers will need to decide
which option best suits their situation. These are:
Value the dry matter eaten on an energy basis and compare this to the
equivalent energy supplied through grain or hay
Value the liveweight gain achieved through the grazing period
Value the stocking rate and assign a price per head or per hectare
Value the extra pasture grown while the crop is being grazed
Conducting a whole farm examination of costs and returns.
1.3.1 Valuing the dry matter eaten
This is the simplest way of valuing the grazing but is likely to overestimate the benefi ts.
Firstly, most farmers are unlikely to feed a supplement to the equivalent energy value
as that obtained from the crop. Secondly, this method assumes there would have
been no alternative feed available for the stock when there may be pasture that can
provide part of the livestock requirements.
1 Average monthly growth rates for different crops for different regions are presented (appendix 1).
Page 8
Free Food Thoughtfor
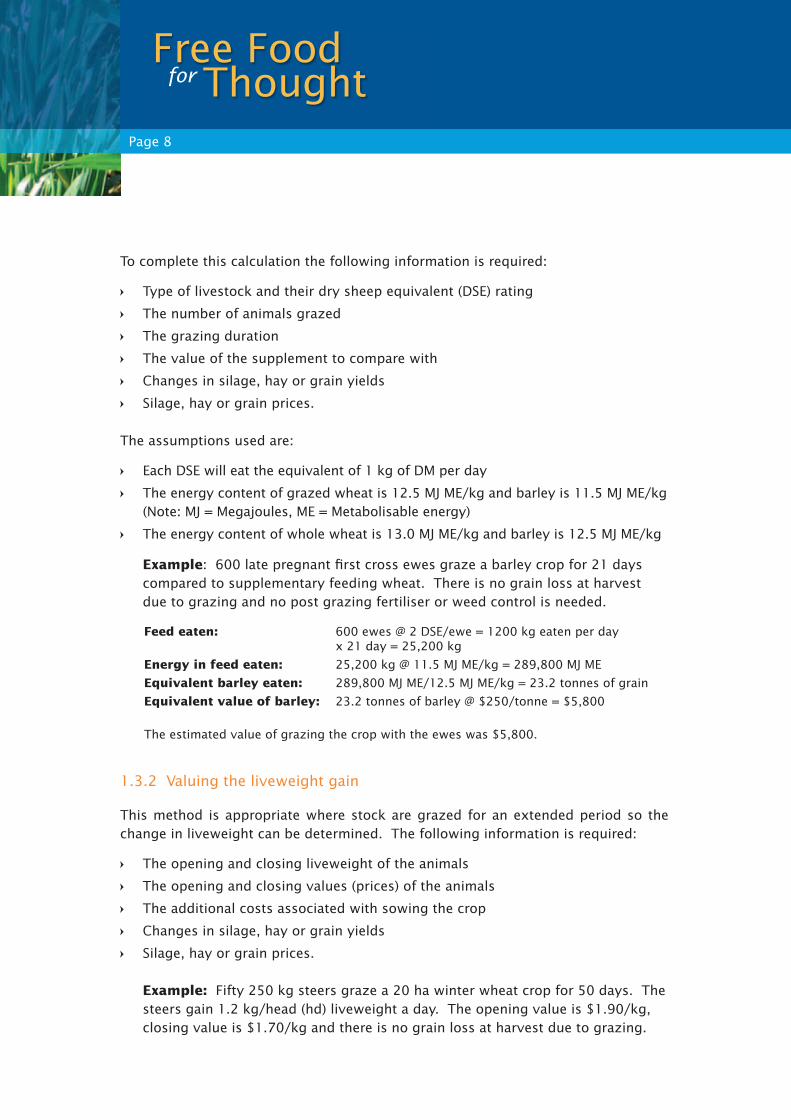
To complete this calculation the following information is required:
Type of livestock and their dry sheep equivalent (DSE) rating
The number of animals grazed
The grazing duration
The value of the supplement to compare with
Changes in silage, hay or grain yields
Silage, hay or grain prices.
The assumptions used are:
Each DSE will eat the equivalent of 1 kg of DM per day
The energy content of grazed wheat is 12.5 MJ ME/kg and barley is 11.5 MJ ME/kg
(Note: MJ = Megajoules, ME = Metabolisable energy)
The energy content of whole wheat is 13.0 MJ ME/kg and barley is 12.5 MJ ME/kg
Example: 600 late pregnant fi rst cross ewes graze a barley crop for 21 days
compared to supplementary feeding wheat. There is no grain loss at harvest
due to grazing and no post grazing fertiliser or weed control is needed.
Feed eaten: 600 ewes @ 2 DSE/ewe = 1200 kg eaten per day x 21 day = 25,200 kg
Energy in feed eaten: 25,200 kg @ 11.5 MJ ME/kg = 289,800 MJ ME
Equivalent barley eaten: 289,800 MJ ME/12.5 MJ ME/kg = 23.2 tonnes of grain
Equivalent value of barley: 23.2 tonnes of barley @ $250/tonne = $5,800
The estimated value of grazing the crop with the ewes was $5,800.
1.3.2 Valuing the liveweight gain
This method is appropriate where stock are grazed for an extended period so the
change in liveweight can be determined. The following information is required:
The opening and closing liveweight of the animals
The opening and closing values (prices) of the animals
The additional costs associated with sowing the crop
Changes in silage, hay or grain yields
Silage, hay or grain prices.
Example: Fifty 250 kg steers graze a 20 ha winter wheat crop for 50 days. The
steers gain 1.2 kg/head (hd) liveweight a day. The opening value is $1.90/kg,
closing value is $1.70/kg and there is no grain loss at harvest due to grazing.
Page 9
Grazing Winter Crops Roadshow
Workshop NotesMarch 2008
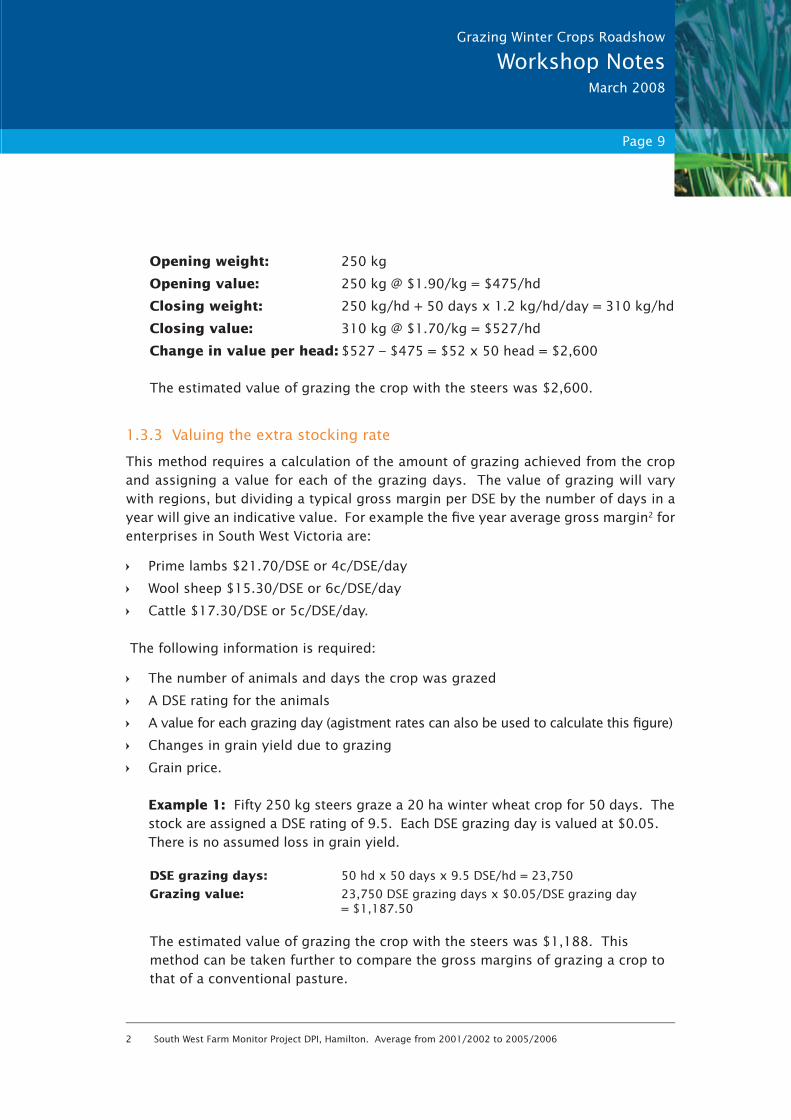
Opening weight: 250 kg
Opening value: 250 kg @ $1.90/kg = $475/hd
Closing weight: 250 kg/hd + 50 days x 1.2 kg/hd/day = 310 kg/hd
Closing value: 310 kg @ $1.70/kg = $527/hd
Change in value per head: $527 – $475 = $52 x 50 head = $2,600
The estimated value of grazing the crop with the steers was $2,600.
1.3.3 Valuing the extra stocking rate
This method requires a calculation of the amount of grazing achieved from the crop
and assigning a value for each of the grazing days. The value of grazing will vary
with regions, but dividing a typical gross margin per DSE by the number of days in a
year will give an indicative value. For example the fi ve year average gross margin2 for
enterprises in South West Victoria are:
Prime lambs $21.70/DSE or 4c/DSE/day
Wool sheep $15.30/DSE or 6c/DSE/day
Cattle $17.30/DSE or 5c/DSE/day.
The following information is required:
The number of animals and days the crop was grazed
A DSE rating for the animals
A value for each grazing day (agistment rates can also be used to calculate this fi gure)
Changes in grain yield due to grazing
Grain price.
Example 1: Fifty 250 kg steers graze a 20 ha winter wheat crop for 50 days. The
stock are assigned a DSE rating of 9.5. Each DSE grazing day is valued at $0.05.
There is no assumed loss in grain yield.
DSE grazing days: 50 hd x 50 days x 9.5 DSE/hd = 23,750
Grazing value: 23,750 DSE grazing days x $0.05/DSE grazing day = $1,187.50
The estimated value of grazing the crop with the steers was $1,188. This
method can be taken further to compare the gross margins of grazing a crop to
that of a conventional pasture.
2 South West Farm Monitor Project DPI, Hamilton. Average from 2001/2002 to 2005/2006

Page 10
Free Food Thoughtfor
Example 2: Comparison of strip grazing a paddock sown to grazing oats and
ryegrass compared to volunteer pasture (Binnu, WA, 2004. 190 mm rainfall).
Pasture Grazing methodTotal DSE grazing days/ha
DSE/ha/year
Self regenerating annual pasture Whole paddock 141 0.4
Sown ryegrass & grazing oats Strip grazing 2,617 7.2
Self regenerating annual pasture
Sown ryegrass & grazing oats
Carrying capacity 0.4 DSE/ha 7.2 DSE/ha
Income
Wool
Meat
$9.74/ha
$8.84/ha
$173.80/ha
$159.08/ha
Total income $18.58/ha $332.88/ha
Costs
Sheep
Pasture & fencing
$5.87 /ha
$10.00 /ha
$104.68 /ha
$130.86 /ha
Total costs $15.87/ha $235.54/ha
Net income $2.71/ha $97.33/ha
Page 11
Grazing Winter Crops Roadshow
Workshop NotesMarch 2008
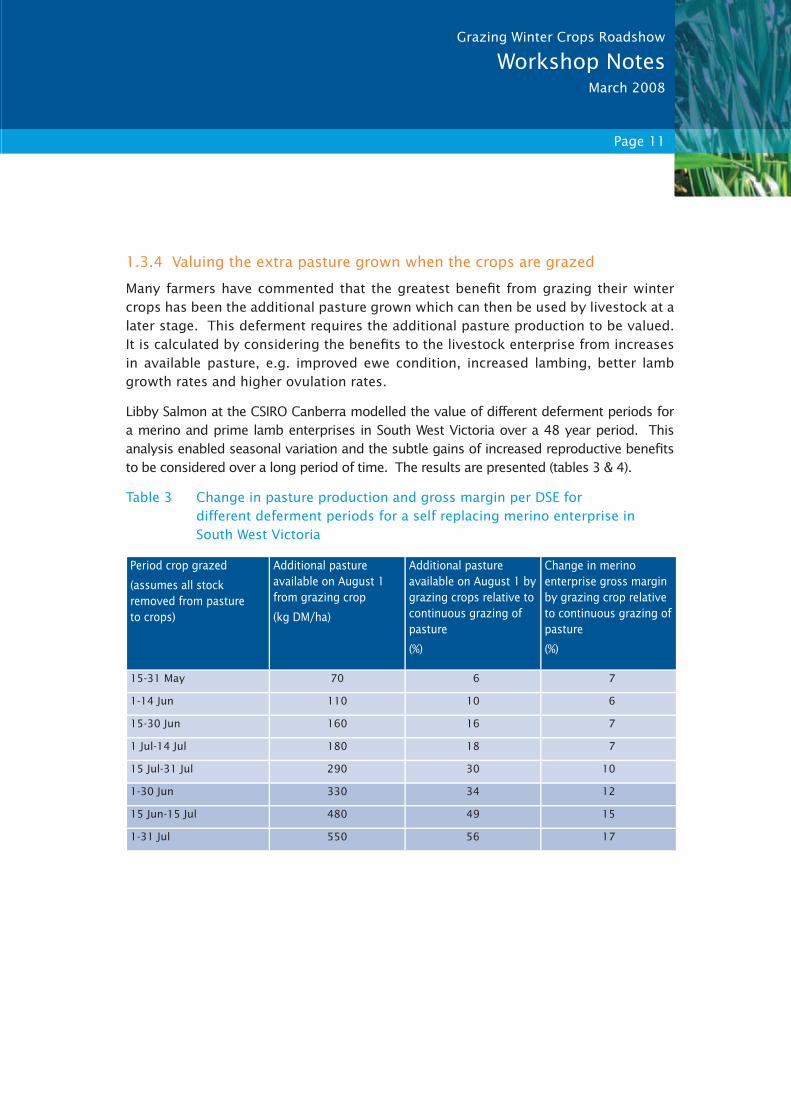
1.3.4 Valuing the extra pasture grown when the crops are grazed
Many farmers have commented that the greatest benefi t from grazing their winter
crops has been the additional pasture grown which can then be used by livestock at a
later stage. This deferment requires the additional pasture production to be valued.
It is calculated by considering the benefi ts to the livestock enterprise from increases
in available pasture, e.g. improved ewe condition, increased lambing, better lamb
growth rates and higher ovulation rates.
Libby Salmon at the CSIRO Canberra modelled the value of different deferment periods for
a merino and prime lamb enterprises in South West Victoria over a 48 year period. This
analysis enabled seasonal variation and the subtle gains of increased reproductive benefi ts
to be considered over a long period of time. The results are presented (tables 3 & 4).
Table 3 Change in pasture production and gross margin per DSE for
different deferment periods for a self replacing merino enterprise in
South West Victoria
Period crop grazed
(assumes all stock removed from pasture to crops)
Additional pasture available on August 1 from grazing crop
(kg DM/ha)
Additional pasture available on August 1 by grazing crops relative to continuous grazing of pasture
(%)
Change in merino enterprise gross margin by grazing crop relative to continuous grazing of pasture
(%)
15-31 May 70 6 7
1-14 Jun 110 10 6
15-30 Jun 160 16 7
1 Jul-14 Jul 180 18 7
15 Jul-31 Jul 290 30 10
1-30 Jun 330 34 12
15 Jun-15 Jul 480 49 15
1-31 Jul 550 56 17
Page 12
Free Food Thoughtfor
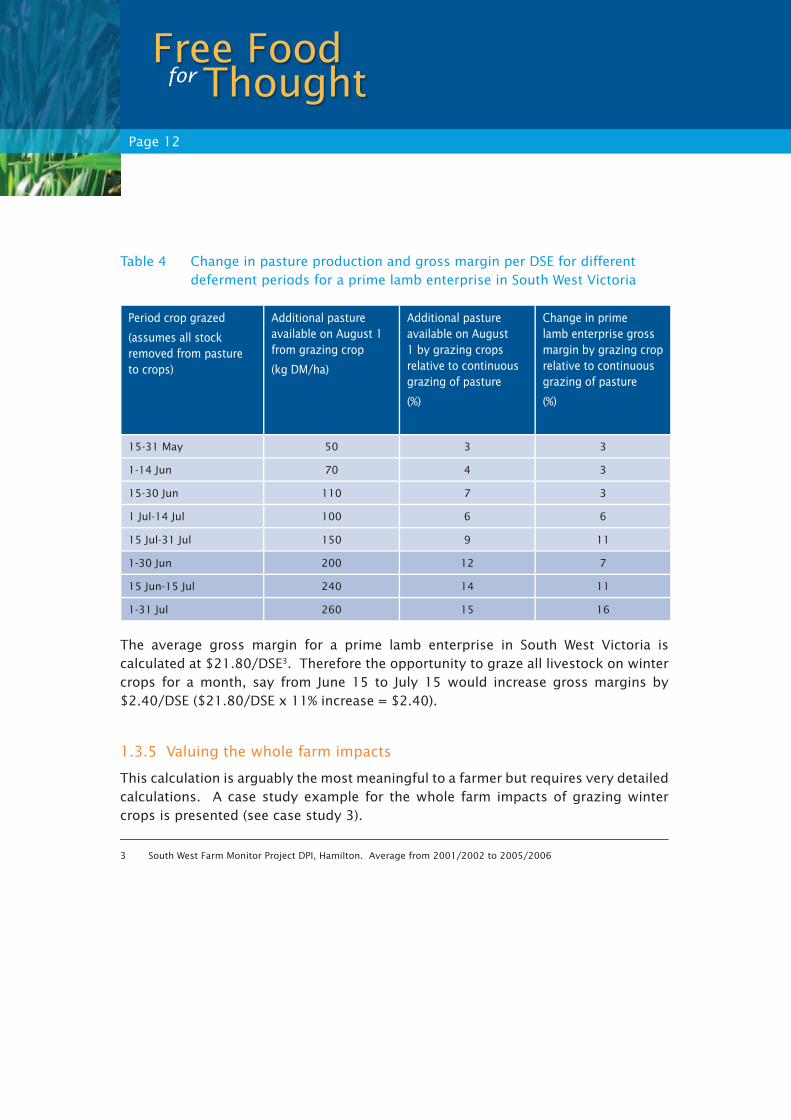
Table 4 Change in pasture production and gross margin per DSE for different
deferment periods for a prime lamb enterprise in South West Victoria
Period crop grazed
(assumes all stock removed from pasture to crops)
Additional pasture available on August 1 from grazing crop
(kg DM/ha)
Additional pasture available on August 1 by grazing crops relative to continuous grazing of pasture
(%)
Change in prime lamb enterprise gross margin by grazing crop relative to continuous grazing of pasture
(%)
15-31 May 50 3 3
1-14 Jun 70 4 3
15-30 Jun 110 7 3
1 Jul-14 Jul 100 6 6
15 Jul-31 Jul 150 9 11
1-30 Jun 200 12 7
15 Jun-15 Jul 240 14 11
1-31 Jul 260 15 16
The average gross margin for a prime lamb enterprise in South West Victoria is
calculated at $21.80/DSE3. Therefore the opportunity to graze all livestock on winter
crops for a month, say from June 15 to July 15 would increase gross margins by
$2.40/DSE ($21.80/DSE x 11% increase = $2.40).
1.3.5 Valuing the whole farm impacts
This calculation is arguably the most meaningful to a farmer but requires very detailed
calculations. A case study example for the whole farm impacts of grazing winter
crops is presented (see case study 3).
3 South West Farm Monitor Project DPI, Hamilton. Average from 2001/2002 to 2005/2006
Page 13
Grazing Winter Crops Roadshow
Workshop NotesMarch 2008
Case study 3
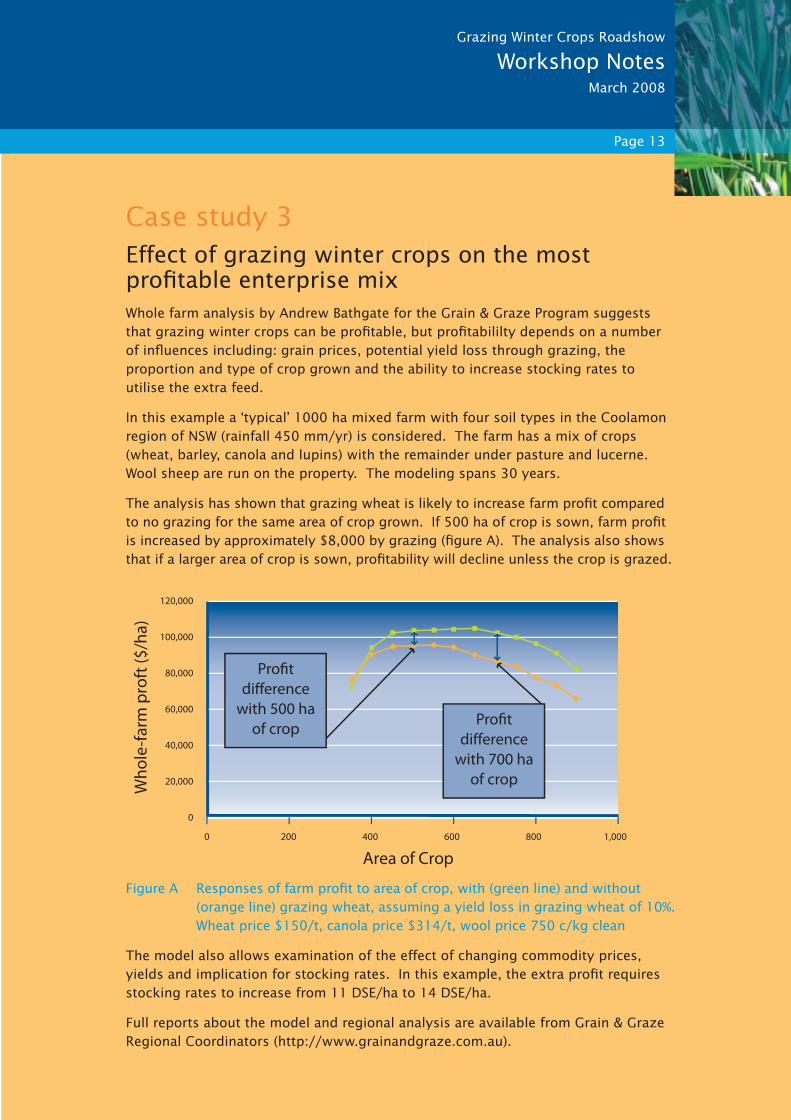
Effect of grazing winter crops on the most profi table enterprise mixWhole farm analysis by Andrew Bathgate for the Grain & Graze Program suggests
that grazing winter crops can be profi table, but profi tabililty depends on a number
of infl uences including: grain prices, potential yield loss through grazing, the
proportion and type of crop grown and the ability to increase stocking rates to
utilise the extra feed.
In this example a ‘typical’ 1000 ha mixed farm with four soil types in the Coolamon
region of NSW (rainfall 450 mm/yr) is considered. The farm has a mix of crops
(wheat, barley, canola and lupins) with the remainder under pasture and lucerne.
Wool sheep are run on the property. The modeling spans 30 years.
The analysis has shown that grazing wheat is likely to increase farm profi t compared
to no grazing for the same area of crop grown. If 500 ha of crop is sown, farm profi t
is increased by approximately $8,000 by grazing (fi gure A). The analysis also shows
that if a larger area of crop is sown, profi tability will decline unless the crop is grazed.
Figure A Responses of farm profi t to area of crop, with (green line) and without
(orange line) grazing wheat, assuming a yield loss in grazing wheat of 10%.
Wheat price $150/t, canola price $314/t, wool price 750 c/kg clean
The model also allows examination of the effect of changing commodity prices,
yields and implication for stocking rates. In this example, the extra profi t requires
stocking rates to increase from 11 DSE/ha to 14 DSE/ha.
Full reports about the model and regional analysis are available from Grain & Graze
Regional Coordinators (http://www.grainandgraze.com.au).
120,000
80,000
100,000
60,000
40,000
20,000
0
0 200 400 600 800 1,000
Area of Crop
Wh
ole
-fa
rm p
roft
($
/ha
)
Page 14
Free Food Thoughtfor
1.4 Balancing the benefi ts and the costs
Grazing winter crops can have benefi ts but they may also come at a cost. The likelihood
of the benefi ts and costs occurring will vary depending on regional characteristics,
farm history and choices made during the cropping season. For example, in a region
with a growing season that fi nishes early, the completion of grazing before stem
elongation (recommended practice) may still result in a loss of grain yield. In contrast,
a region with a good fi nish to the season may achieve an increase in grain yield, even
though the grazing decisions at the time were identical.
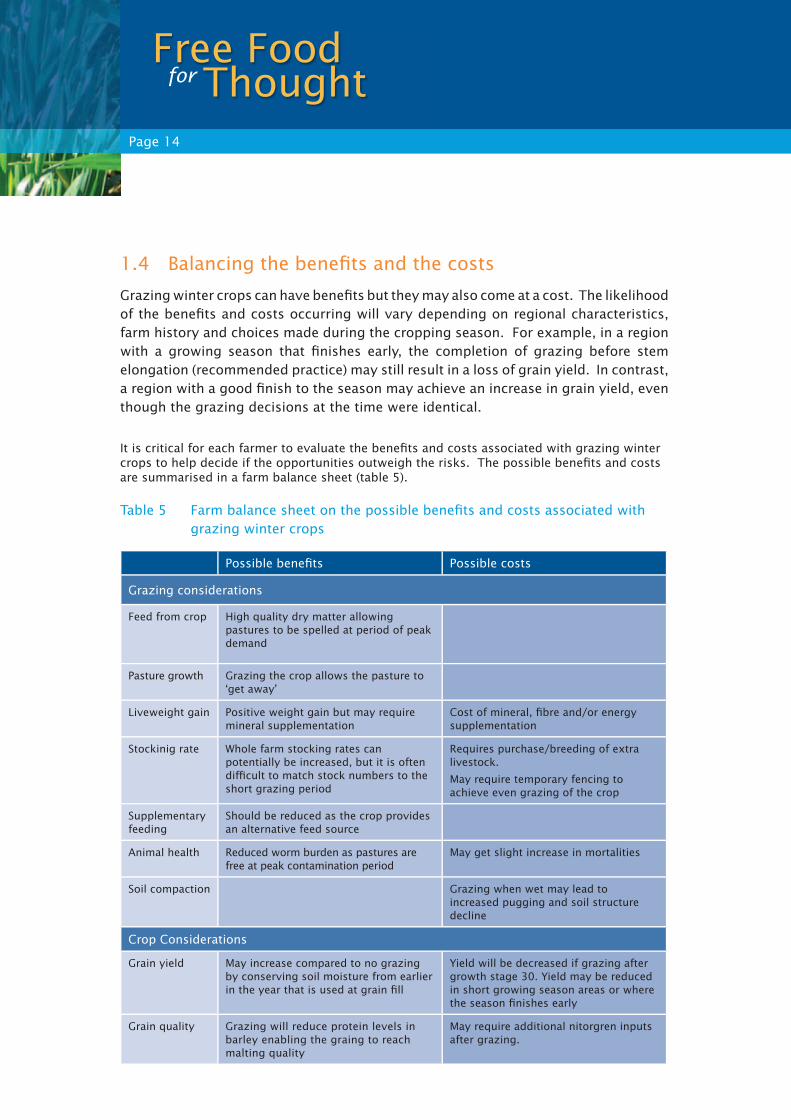
It is critical for each farmer to evaluate the benefi ts and costs associated with grazing winter crops to help decide if the opportunities outweigh the risks. The possible benefi ts and costs are summarised in a farm balance sheet (table 5).
Table 5 Farm balance sheet on the possible benefi ts and costs associated with
grazing winter crops
Possible benefi ts Possible costs
Grazing considerations
Feed from crop High quality dry matter allowing pastures to be spelled at period of peak demand
Pasture growth Grazing the crop allows the pasture to ‘get away’
Liveweight gain Positive weight gain but may require mineral supplementation
Cost of mineral, fi bre and/or energy supplementation
Stockinig rate Whole farm stocking rates can potentially be increased, but it is often diffi cult to match stock numbers to the short grazing period
Requires purchase/breeding of extra livestock.
May require temporary fencing to achieve even grazing of the crop
Supplementary feeding
Should be reduced as the crop provides an alternative feed source
Animal health Reduced worm burden as pastures are free at peak contamination period
May get slight increase in mortalities
Soil compaction Grazing when wet may lead to increased pugging and soil structure decline
Crop Considerations
Grain yield May increase compared to no grazing by conserving soil moisture from earlier in the year that is used at grain fi ll
Yield will be decreased if grazing after growth stage 30. Yield may be reduced in short growing season areas or where the season fi nishes early
Grain quality Grazing will reduce protein levels in barley enabling the graing to reach malting quality
May require additional nitorgren inputs after grazing.

Page 15
Grazing Winter Crops Roadshow
Workshop NotesMarch 2008
Possible benefi ts Possible costs
Hay / silage Will be reduced due to grazing
Stubble Stubble will be reduced which may help reduce sowing diffi culties where stubbles are not burnt
Reduces stubble if straw is to be baled. May increase soil exposure.
Crop maturity Will be delayed which may avoid exposure to late frosts and exposure to early rust infestions
Will be delayed which may expose crop to moisture stress late in the season
Fertiliser Likely to require additional fertiliser after grazing to ensure maximum grain yield
Weeds Grazing may increase the incidence of some weeds e.g. annual ryegrass
Grazing may reduce the incidence of some weeds e.g. wild radish. Slows canopy closure may advantage other weeds. Early sowing of cereals to maximis DM may reduce herbicide knockdown effi cacy.
Disease May reduce rust by reducing crop canopy and removing leaves that may cause later infections
Potential exposure to Wheat Streak Mosaic Virus.
Management considerations
Matching stock numbers to feed on offer
If well matched, will enable more stock to be run or supplements to be reduced
If poorly matched, crops may be grazed unevenly or not utilised to their full potential
Economic considerations
Management May allow for a trading operation to be conducted to help diversify
May require ‘boxing’ of mobs to obtain adequate grazing pressure
Fencing May require temporary fencing
Gross margins Increases if the grazing value outweighs silage, hay or grain reductions
Increases if a reduction in silage, hay or grain outweighs the grazing value
1.5 Grazing crops – making the decision
As you wander around this Grazing Winter Crops Roadshow, you will talk to lots of
different people, listen to speakers, read a range of materials, look at trial results. At
the end of it all you will probably ask yourself at some stage – so what? What does
all this mean? Over the last couple of years, the Grain and Graze project has talked to
lots of people about how they make decisions. Some of this research may help you
sort out what you have seen and heard during the Roadshow.

Page 16
Free Food Thoughtfor
Types of Decisions
In business there are three types of decisions – Simple, Complicated and Complex.
When you are making decisions about whether or not to introduce grazing cereals
into your farming system, you could be faced with all three types of decisions. Here
are some examples:
Simple – Are the plants big enough to be grazed? This one should be straightforward,
you fi nd out some pretty standard information and the plants are either big enough
or they aren’t. You either graze the crop or not.
Complicated – How will I balance crop yield and grazing time? Here there is a few
things to consider and you need to balance a few things. For example, what is the
grazing worth vs the potential loss in crop yield? Will the crop need more (or less)
fertiliser or weed control if it is grazed? To make a confi dent decision you need to get
more information, maybe ask an advisor or two and do a few simple sums.
Complex – If I introduce grazing cereals, should I change my farming system to get the
most out of the change? To make this decision, you need a lot of technical information
on stocking rate, crop growth rates, time of lambing or calving, animal growth rates
AND how will changing stocking rate or lambing (calving ) time affect workload, leisure
time, seasonal risk, business risk and much more. This decision is COMPLEX.
You could walk away from the day saying “This is all too hard”. Here are a few tips on
complex decision making which may help.
Firstly, you are making these decisions all the time and you are probably pretty good
at it. You just do it without thinking. Then:
Be clear on your goal. Think about WHY you want to graze crops
Gather information so you feel informed but remember, the decision is complex so
you can’t know all the information
Do a few simple sums to get some confi dence it will pay
Discuss the whole story with a range of people you trust. Story telling is very useful
for understanding “ins and outs” of complex decisions
Use a couple of advisors to make sure you understand the theory and local experience
Keep it simple – Don’t create more work and make it too complicated
Trust “gut feeling”. At the end of the day, no one can process all the information so
you have to trust what your gut tells you
Relax and be prepared to change given what you learn as you go.

Page 17
Grazing Winter Crops Roadshow
Workshop NotesMarch 2008
1.6 What is on the horizon with grazing crops?
Grazing long vegetative stage wheat crops was a widespread practice in Australia in
the 1930’s. While the practice has gone in and out of favour over the decades, the
recent interest has been led by farmers wanting to maximise the synergies between
their cropping and livestock enterprises.
Increased knowledge over this period has raised some opportunities that could be
developed and exploited in the future. These include:
Sowing the same type of crop with different maturity patterns to maximise feed
potential and grain yield (see case study 4)
Grazing canola (brassica) crops (see case study 5)
Grazing crops of low palatability by livestock which favour the grazing of weeds
(see case study 6)
Training livestock to eat weeds and not the crop (see Training stock to eat weeds
and not the crop).
Training stock to eat weeds and not the crop
Dean Revell from CSIRO, Perth, is researching the grazing behaviour of sheep. His
work is suggesting that it may be possible to control the grazing behaviour of sheep
so that they eat the weed species targeted by the farmer and avoid grazing the
favourable species.
While this work is in its infancy, research undertaken at Utah State University suggests
how stock can be trained to be weed managers. The four-step approach involves:
Knowing the nutrient and toxin content of the weeds you want removed
Choosing appropriate animals, that can train unfamiliar livestock
Ensuring animals eat fodder that provides a positive experience, as this will
broaden the types of fodder they will eat
Training the stock on small areas that contain the weeds to be controlled.
More information is available on the website: http://www.livestockforlandscapes.com

Page 18
Free Food Thoughtfor
Case study 4
Exploiting different crop growth patterns to maximise productionThe slow growth of late sown winter wheat posed an interesting challenge for
Garry Halliday, Manager of “Poligolet” in South West Victoria. In an attempt to
overcome the low winter production, it was decided to mix a shorter season, more
rapidly growing spring variety Silverstar with Amarok winter wheat. The maturity
difference between the two varieties was approximately two weeks.
It was anticipated that the short season variety would be preferentially grazed by the
sheep because of its greater height in winter. The spring wheat would also mature
quicker, so theoretically could be removed by hard grazing after stem elongation (growth
stage 31+), when the Amarok was still in the tillering phase.
It was unrealistic to expect complete removal of the Silverstar by grazing only,
however grazing would delay the maturity of the remaining spring wheat so the
ripening would be similar to the Amarok. Given that Amarok is a red feed wheat,
the addition of a small quantity of white wheat (Silverstar) to the sample would not
compromise grain quality.
The crop was sown dry on April 26 and opening rains occurred in early May. By
late July the Silverstar was about 25 cm high and had commenced stem elongation
(growth stage 32) while the Amarok was still in mid tillering (growth stage 25) and
approximately 10 cm high.
Crossbred ewes and lambs were introduced at a stocking rate of 36 DSE/ha for a
period of 38 days until late August. By that time most of the growing tips on the
Silverstar had been removed by grazing and the Amarok, which was just beginning
stem elongation, had hardly been grazed. The Amarok wheat yielded 5.5 t/ha and
the grazing value was calculated at over $200/ha.
Page 19
Grazing Winter Crops Roadshow
Workshop NotesMarch 2008
Case study 5
Grazing canola Work is currently underway to determine the grazing potential of canola. Long
season dual-purpose canola has been compared by CSIRO scientists to traditional
spring varieties and fodder brassicas. The preliminary results would suggest:
Canola can produce 2 to 4 t/ha of DM for grazing by mid August if sown in mid
April
Canola DM has a nutritive value similar to cereals
Sheep show no grazing preference between canola and forage brassicas
Weight gain of merino lambs grazing canola was 210 gm/day, with no observed
animal health issues
Both winter and spring canola can recover after grazing with no seed yield
penalty if grazing is completed when the plant is in a vegetative stage.
Like cereals, grazing later in the season (early reproductive stage) will delay
fl owering and may cause a reduction in seed yield, especially if the season
fi nishes early
Oil content was similar between grazed and ungrazed crops.
Case study 6
Exploiting grazing preference for weed controlDon Nairn in Western Australia has observed differences in different varieties of
oats which he exploits as part of his weed crop control strategy. Don has found
Pallingup oats appear unpalatable when green, whereas Tiapan and Grazer 50
grazing oats are readily eaten by stock at the same growth stage.
While more investigation needs to be carried out on the preference of stock to graze
certain varieties, it is conceivable that ‘in crop grazing’ could become a standard
part of post emergent weed control strategies.

Page 20
Free Food Thoughtfor
Page 21
Grazing Winter Crops Roadshow
Workshop NotesMarch 2008
2 What and how to do it (agronomy at the paddock scale)
Dual purpose or winter wheats immediately spring to mind when thinking about
grazing a winter crop (see Grazing crops as a drought strategy to minimise seasonal
risk in Western Australia). They can be sown early, they remain vegetative until a cold
period (which usually occurs in late winter) and they recover from grazing to produce
grain. This gives a relatively long period when grazing can occur and still provides
options as the crop matures. However, virtually all winter crops can be grazed, even
those planted at the traditional sowing times of May and June. It just means the time
available for grazing is reduced if grain is also expected. Alternatively, the crop can
be grown for the sole purpose of grazing.
If the production of grain is desired, a critical aspect of grazing winter crops is to
appreciate the importance of the change in the plant from tillering (vegetative growth)
to stem elongation (reproductive growth). This change in plant growth occurs when
the part that will produce an ear on the cereal is forming in the base of the plant.
Grazing after the plant begins stem elongation risks damaging the ear. For regions
where crops are sown purely to provide dry matter (DM) for grazing, there is no need
to worry about damaging the embryonic ear of the plant.
Unfortunately, predicting the changes in crop development cannot be determined
by a date on the calendar (although crops with a winter habit are more predictable).
Visual observation of the emerging embryo ear is the only way to accurately assign
this growth stage of a crop.
There is a common referencing system that helps describe the development of a
cereal plant from germination through to ripening. It consists of ten (10) development
phases from zero to nine (0 to 9). Within each development phase there are up to ten
(10) individual growth stages. This gives a two number code and is prefaced with the
letters GS for growth stage.
When making decisions about grazing winter crops, the change from GS 2 to GS
3 is critical. GS 2 refers to the development phase when the plant is tillering or
producing stems at each crown. GS 3 refers to the development phase when the
plant stops tillering and the embryo ear which has formed in the base of each tiller
begins to move up the tiller. This phase is also characterised by each tiller beginning
to thicken into stems, and nodes forming low down on each tiller. The key growth
stage observations to accurately determine a growth stage are described (see table 6
and How to dissect a cereal plant to determine growth stage as well as Hints on how
to pick when GS 30 is approaching).

Page 22
Free Food Thoughtfor
How to dissect a cereal plant to determine growth stage
1 2

Page 23
Grazing Winter Crops Roadshow
Workshop NotesMarch 2008
For regions where crops are sown purely to provide DM for grazing, there is no need
to worry about damaging the embryonic ear of the plant during dissection.
Pull up a plant and shake the dirt off the
roots
Pass your hand around the plant and draw
upwards to identify the tallest leaf (this will
usually be attached to the main stem of the
plant)
Peel off any dying leaves
Cut the roots from the plant at the stem
base
Cut the stem lengthwise along the stem to
expose the embryonic ear.
Want more information? Refer to the Cereal
Growth Stages booklet available from the GRDC.
It can be ordered from the GRDC website http://
www.grdc.com.au in the publications section.
3

Page 24
Free Food Thoughtfor
Table 6 Description of critical growth stages when grazing winter crops4
Development phase
Code number
Growth stage observationsCode number
Tillering
(vegetative growth)
2 Count the number of tillers excluding the main stem on each plant.
Each tiller is valued at one
1 to 94
Stem elongation
(reproductive growth)
3 The base of the main stem needs to be cut in half and the distance between the base of main stem and the ear measured.
If the ear is at 1 cm, the value is 0
If the ear is at 2 cm, there is a node forming about 1 cm above the base and the stem is hollow, the value is 1
1 to 9
A plant in vegetative growth with a main stem and four tillers would be described
as GS 24. The same plant would be described as GS 31 when the ear is about 2 cm
above the base of the plant, a hollow is forming beneath the ear and a ring or node is
forming about 1 cm above the base of the plant.
To minimise potential grain yield losses, grazing should be completed by GS 30
4 In Australia cereal plants rarely produce nine tillers before stem elongation commences
Hints on how to pick when GS 30 is approaching
When a cereal is grazed, it delays
the transition from tillering to stem
elongation by a few days. Also the
main stem of a cereal plant is usually
more advanced in its development
than the neighbouring tillers.
To gain an indication that GS 30
is approaching, monitor the main
stem on plants that have not been
grazed. When these plants begin
stem elongation, the rest of the
grazed crop will not be far behind.
Establishing an exclusion area in a paddock with weldmesh or portable sheep
yard panels can provide a point to monitor crop development.

Page 25
Grazing Winter Crops Roadshow
Workshop NotesMarch 2008
2.1 When to sow
Cereals crops with winter habit can be sown early in the year (March or April) because
they need a period of cold weather before they will run to head. This suits areas with
a long growing season and usually an early and reliable autumn break.
Crops sown in the early autumn can produce signifi cant amounts of DM before they
reach GS 30 if the seasonal conditions are favourable. This applies to the lower
rainfall areas (table 7) as well as the higher rainfall zones (table 8).
Table 7 Dry matter available for grazing from barley and wheat sown on April 18,
2007, Waikerie, SA
Crop type Days from sowing
58 86
GS 25 GS 31
Dry matter
(kg/ha)
Dry matter
(kg/ha)
Barley 2080 3490
Wheat 1480 1880
Table 8 Dry matter available for grazing at the end of August for winter wheat
sown on May 27, 2004, Marrar, NSW
Variety Dry matter (kg DM/ha)
Wylah 2360
Whistler 2850
Wedgetail 2750
Marombi 2380
Sowing crops dry is possible but relies on adequate rainfall for even germination and
further growth. Therefore, don’t sow too early.
If the anticipated break does not occur or there is no follow up to initial rains, the
amount of DM at the start of stem elongation (GS 30) may not be much higher than
later sowings (table 9).
Page 26
Free Food Thoughtfor
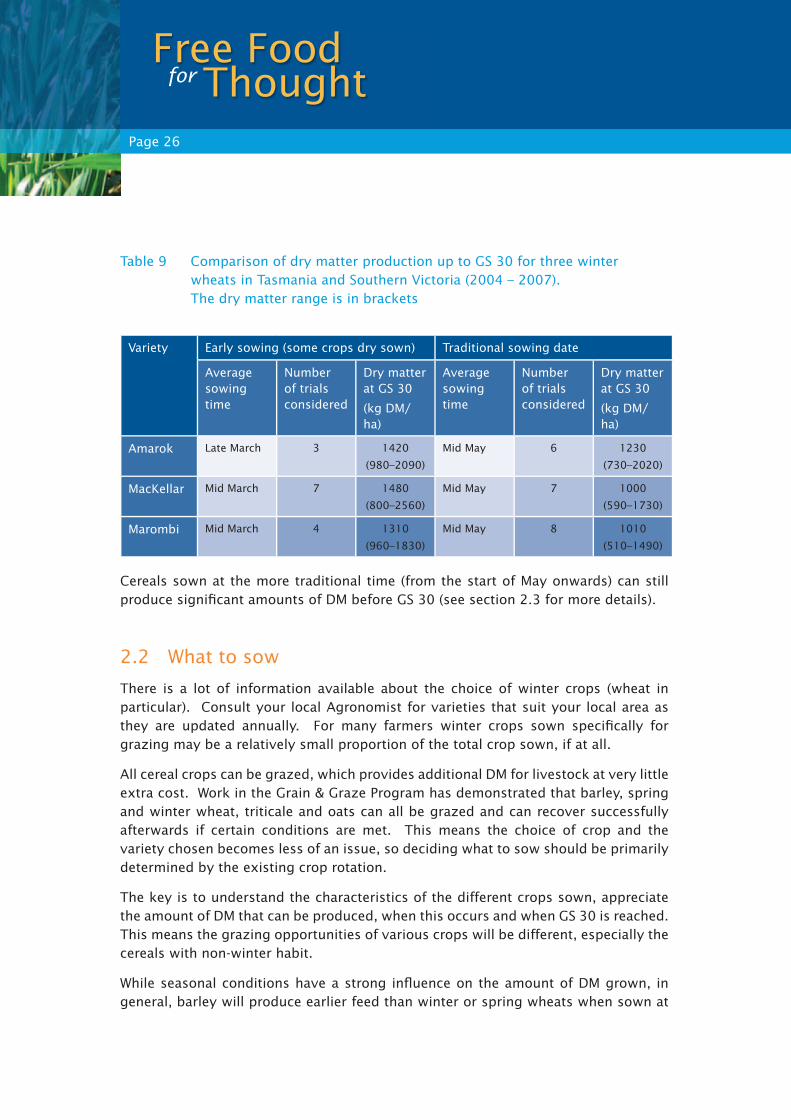
Table 9 Comparison of dry matter production up to GS 30 for three winter
wheats in Tasmania and Southern Victoria (2004 – 2007).
The dry matter range is in brackets
Variety Early sowing (some crops dry sown) Traditional sowing date
Average sowing time
Number of trials considered
Dry matter at GS 30
(kg DM/ha)
Average sowing time
Number of trials considered
Dry matter at GS 30
(kg DM/ha)
Amarok Late March 3 1420
(980–2090)
Mid May 6 1230
(730–2020)
MacKellar Mid March 7 1480
(800–2560)
Mid May 7 1000
(590–1730)
Marombi Mid March 4 1310
(960–1830)
Mid May 8 1010
(510–1490)
Cereals sown at the more traditional time (from the start of May onwards) can still
produce signifi cant amounts of DM before GS 30 (see section 2.3 for more details).
2.2 What to sow
There is a lot of information available about the choice of winter crops (wheat in
particular). Consult your local Agronomist for varieties that suit your local area as
they are updated annually. For many farmers winter crops sown specifi cally for
grazing may be a relatively small proportion of the total crop sown, if at all.
All cereal crops can be grazed, which provides additional DM for livestock at very little
extra cost. Work in the Grain & Graze Program has demonstrated that barley, spring
and winter wheat, triticale and oats can all be grazed and can recover successfully
afterwards if certain conditions are met. This means the choice of crop and the
variety chosen becomes less of an issue, so deciding what to sow should be primarily
determined by the existing crop rotation.
The key is to understand the characteristics of the different crops sown, appreciate
the amount of DM that can be produced, when this occurs and when GS 30 is reached.
This means the grazing opportunities of various crops will be different, especially the
cereals with non-winter habit.
While seasonal conditions have a strong infl uence on the amount of DM grown, in
general, barley will produce earlier feed than winter or spring wheats when sown at

Page 27
Grazing Winter Crops Roadshow
Workshop NotesMarch 2008
the same time. The amount of DM that triticale crops produce falls between barley
and wheat (see fi gures 2 & 3).
Figure 2 Dry matter production against time of sowing (post May 1) in Western
Victoria and Tasmania (2004 – 2007)
Figure 3 Dry matter production (up to GS 30) with a May 16 sowing date,
Minnipa, SA (2007)
2,000
2,500
1,500
1,000
500
0
40 50 60 80 100 110
Wheat (winter & spring) Barley
DM
(kg
/ha
)
9070
Days from sowing
2,000
2,500
1,500
1,000
500
0
40 50 60 80 100 110
Barley
DM
(kg
/ha
)
9070
Oats Trit
Days from sowing
Wheat

Page 28
Free Food Thoughtfor
Observations of stock grazing different winter crops suggest a preference to graze
some crop types over others. In Victoria, four wheat varieties were always grazed
before the triticale, with the two barley varieties being the last to be grazed. However,
in Tasmania, livestock that had been grazing wheat and were then offered a selection
of wheat, triticale and oats, grazed the wheat last.
While providing choice is unlikely in a farm situation, it is interesting to observe how
the grazing preference appears to be associated with the energy value in the various
crops at the point of grazing.
Understanding this preference may be exploited in some weed control situations (see
section 3.7).
2.3 How much dry matter is produced?
The amount of DM is determined by the climatic conditions, type of crop, sowing rate
and use of fertiliser, especially nitrogen. Once established, winter crops have growth
rates that exceed pasture growth at the same time.
The regional growth rates of different cereals are provided (appendix 1). Barley has
the most rapid growth after sowing, followed by triticale and spring wheat. Winter
wheats sown in May or June produce less DM during winter but compensate for this
lack of growth in spring. These differences are illustrated (fi gure 4).
Figure 4 Average dry matter production at 60, 90, 120 and 150 days from sowing
in Western Victoria (2004 – 2007). Calculated from 38 barley and
50 wheat trials
7,000
8,000
6,000
5,000
4,000
0
0 60 120 150
DM
(kg
/ha
)
90
Days
3,000
2,000
1,000
Wheat Barley

Page 29
Grazing Winter Crops Roadshow
Workshop NotesMarch 2008
In Victoria, with the varieties chosen, barley reached stem elongation (GS 30 to 31)
at an average of 82 days after sowing (range 62 to 91 days) compared to the wheat
with an average of 91 days (range 77 to 113 days). GS 32 was reached an average of
16 days later. In contrast, Yrambi barley, which has some winter habit, can be up to
120 days and winter wheats up to 140 days after sowing. These results highlight the
variability in timing of crop development and why calendar-based decisions on when
to cease grazing are not appropriate.
There are two methods to estimate the amount of DM available in a crop. The fi rst method
uses a simple relationship between crop height and DM (see Estimating the amount of
dry matter from crop height). A ready reckoner is also provided to convert height to DM
(appendix 2). This relationship holds in regions with plant establishment around 200
plants/m2 (sowing rate 80 to 100 kg/ha) and row spacings of between 15 and 20 cm.
In regions where row spacings are wider that 20 cm and plant establishment is more variable,
the second method should be used, where crop cuts need to be taken (see Estimating the
amount of dry matter by cutting).
Estimating the amount of dry matter fromcrop height
Measure the average height of the crop. Then refer to the following relationships
(see table).
Table B: Relationship between crop height and available DM (kg/ha) for
crops shorter than 25 cm
Crop Relationship
Wheat Each 1 cm = 60 kg DM/ha
Barley Each 1 cm = 75 kg DM/ha
Triticale Each 1 cm = 65 kg DM/ha
These relationships are based on a 20 cm (8’) row spacing sown at 100 kg/ha. Subtract
or add 10 % to the estimate for every 2.5 cm (1’) increase or decrease
in row spacing.
Page 30
Free Food Thoughtfor
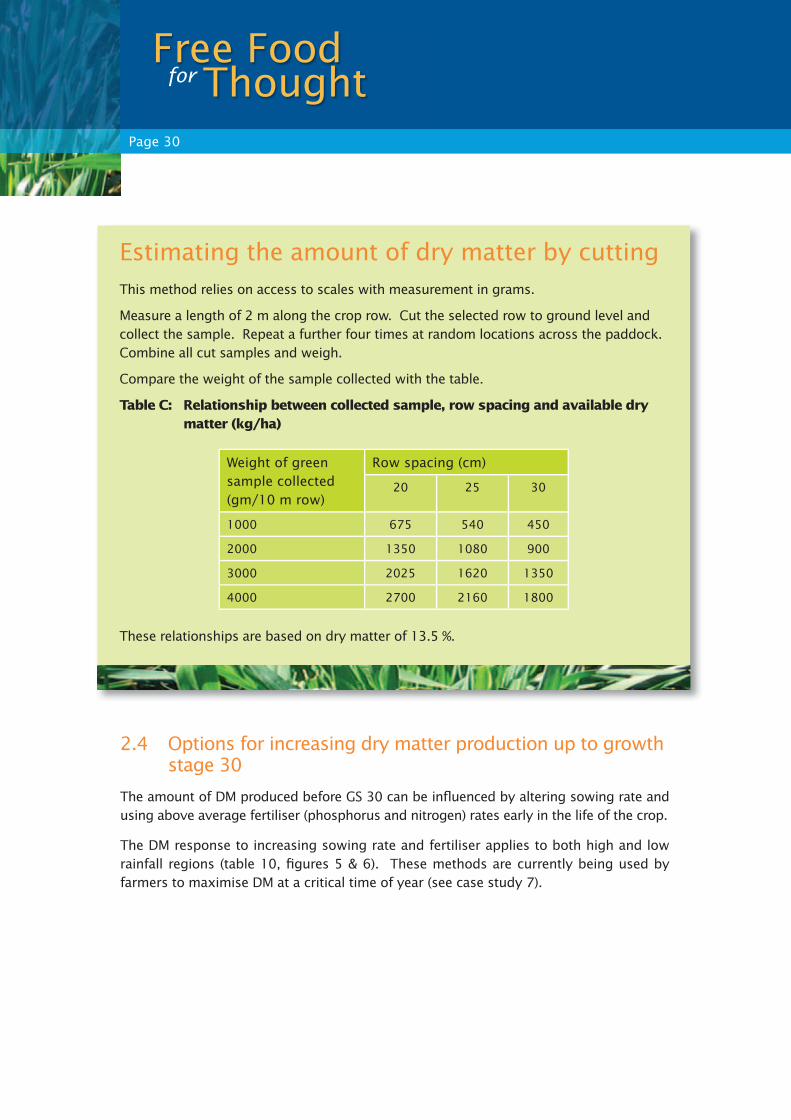
2.4 Options for increasing dry matter production up to growth stage 30
The amount of DM produced before GS 30 can be infl uenced by altering sowing rate and
using above average fertiliser (phosphorus and nitrogen) rates early in the life of the crop.
The DM response to increasing sowing rate and fertiliser applies to both high and low
rainfall regions (table 10, fi gures 5 & 6). These methods are currently being used by
farmers to maximise DM at a critical time of year (see case study 7).
Estimating the amount of dry matter by cutting
This method relies on access to scales with measurement in grams.
Measure a length of 2 m along the crop row. Cut the selected row to ground level and
collect the sample. Repeat a further four times at random locations across the paddock.
Combine all cut samples and weigh.
Compare the weight of the sample collected with the table.
Table C: Relationship between collected sample, row spacing and available dry matter (kg/ha)
Weight of green
sample collected
(gm/10 m row)
Row spacing (cm)
20 25 30
1000 675 540 450
2000 1350 1080 900
3000 2025 1620 1350
4000 2700 2160 1800
These relationships are based on dry matter of 13.5 %.
Page 31
Grazing Winter Crops Roadshow
Workshop NotesMarch 2008
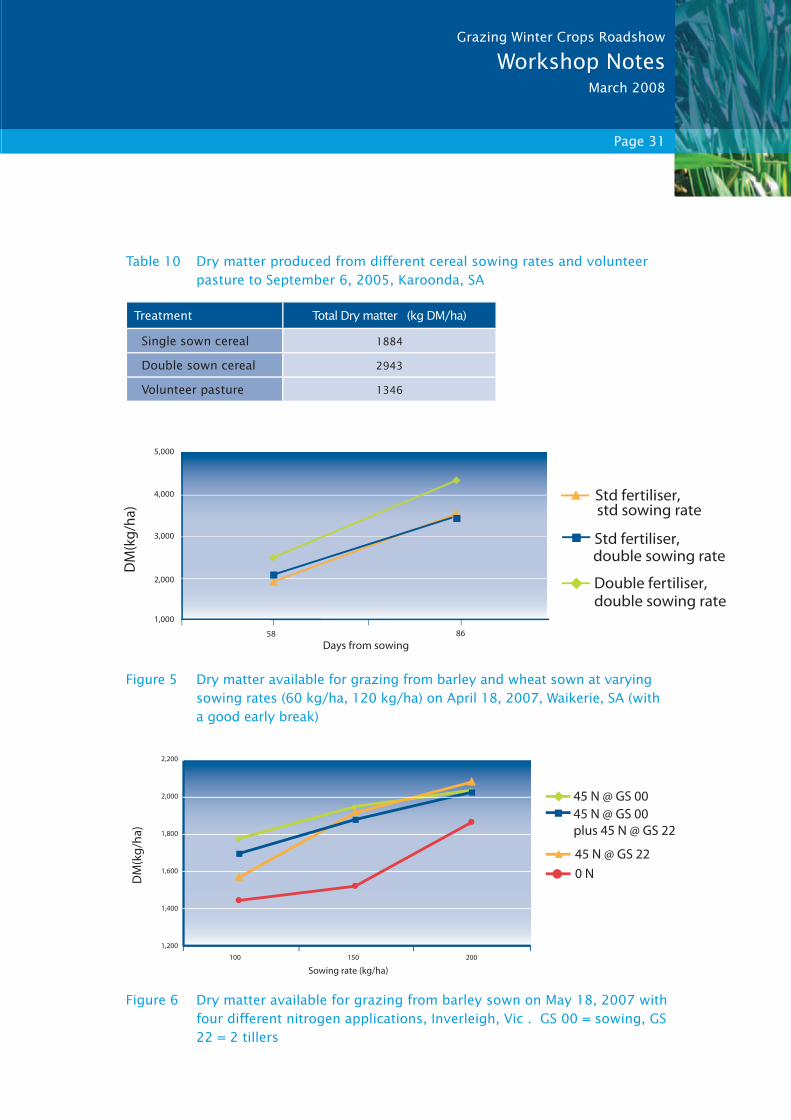
Table 10 Dry matter produced from different cereal sowing rates and volunteer
pasture to September 6, 2005, Karoonda, SA
Treatment Total Dry matter (kg DM/ha)
Single sown cereal 1884
Double sown cereal 2943
Volunteer pasture 1346
Figure 5 Dry matter available for grazing from barley and wheat sown at varying
sowing rates (60 kg/ha, 120 kg/ha) on April 18, 2007, Waikerie, SA (with
a good early break)
Figure 6 Dry matter available for grazing from barley sown on May 18, 2007 with
four different nitrogen applications, Inverleigh, Vic . GS 00 = sowing, GS
22 = 2 tillers
5,000
4,000
58
DM
(kg
/ha)
86
Days from sowing
3,000
2,000
1,000
Std fertiliser,double sowing rate
Std fertiliser,std sowing rate
Double fertiliser, double sowing rate
2,000
1,800
100
DM
(kg
/ha
)
200
Sowing rate (kg/ha)
1,600
1,400
1,200
45 N @ GS 00
plus 45 N @ GS 22
45 N @ GS 22
45 N @ GS 00
2,200
150
0 N

Page 32
Free Food Thoughtfor
Increasing sowing rate and application of extra fertiliser comes at a cost. Generally
the cost of additional fertiliser is more expensive than increasing sowing rate. To
evaluate the benefi ts of increasing DM, a simple calculation can be done where the
extra feed produced is valued and the additional costs determined (table 11).
Table 11 Additional cost of increasing sowing rate and fertiliser, Waikerie, SA
Crop Extra DM from control 58 days
after sowing (kg/ha)
Cost($/ha)
Cost per extra tonne of dry matter
($/ha)
Barley sown at 60 kg/ha with 60 kg/ha of fertiliser
0 58 0
Barley sown at 120 kg/ha with 60 kg/ha of fertiliser
160 70 75
Barley sown at 120 kg/ha with 120 kg/ha of fertiliser
570 106 84
In this example the cost of higher seeding rate produced DM that is likely to be cheaper than bought in feed such as hay.
Case study 7
Higher sowing rates to lift winter productionIan Radford from Spalding in mid north
of South Australia sowed Wedgetail
winter wheat on May 5th into a lupin
stubble following 250mm rain earlier in
the year. He sowed at 150 kg/ha with
100 kg/ha of 18:20:0, seeding rates well
above the district average.
Ian started grazing the crop 46 days
later in mid June and grazed until
early September with ewes, hoggets
and mixed sex cattle. He estimated the
crop carried 25 dse/ha from mid June
to early September, when the paddock
was closed to grazing. Importantly
during the critical feed shortage period
from mid June to end July the paddock
carried 30 dse/ha.
Growth stage 30 was reached at the end
of July, but Ian continued grazing until
fi rst heads emerged, and the paddock
still yielded 1.6 t/ha of ASW wheat. He
would have suffered a yield penalty
as the paddock was grazed later than
ideal, but Ian was prepared to accept
this penalty as a tradeoff for the extra
grazing. Nevertheless he achieved a
grain return of $600/ha.

Page 33
Grazing Winter Crops Roadshow
Workshop NotesMarch 2008
2.5 What is the quality of the dry matter?
Winter crops offer high quality feed which is consistently better than pastures at the
same time of year. Barley is generally lower in metabolisable energy than wheat or
triticale in the vegetative stage. The protein content of all three cereal crops is above
the requirements of any class of livestock and the digestible fi bre content is also
suffi cient (table 12).
Table 12 Range of dry matter quality of wheat, barley and triticale in the
vegetative stage, South West Vic (2004 – 2007) (87 observations)
Crop Energy (MJ ME/kg) Protein (%) Neutral detergent fi bre (NDF) (%)
Wheat 12.4 28.4 38.9
Barley 11.5 27.5 41.7
Triticale 12.2 27.1 41.2
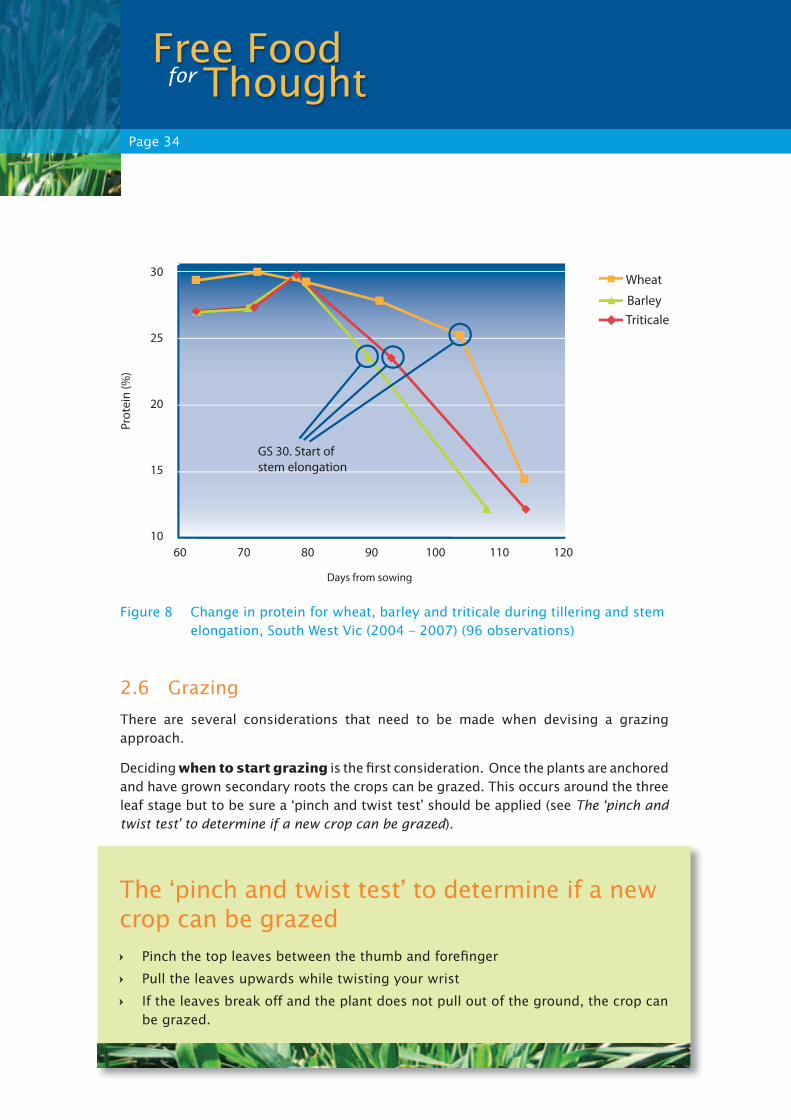
The energy and protein content of the crop changes during the tillering period,
increasing up to mid tillering and declining just before and after GS 30 is reached
(fi gures 7 and 8).
Figure 7 Change in energy for wheat, barley and triticale during tillering and
stem elongation, South West Vic (2004 – 2007) (96 observations)
Me
tab
ois
ab
le e
ne
rgy
(MJ/
kg)
9
Wheat
Barley
Triticale
9.5
10
10.5
11
11.5
12
12.5
13
60 70 80 90 100 110 120
Days from sowing
GS 30. Start of
stem elongation
Page 34
Free Food Thoughtfor
Figure 8 Change in protein for wheat, barley and triticale during tillering and stem
elongation, South West Vic (2004 – 2007) (96 observations)
2.6 Grazing
There are several considerations that need to be made when devising a grazing
approach.
Deciding when to start grazing is the fi rst consideration. Once the plants are anchored
and have grown secondary roots the crops can be grazed. This occurs around the three
leaf stage but to be sure a ‘pinch and twist test’ should be applied (see The ‘pinch and
twist test’ to determine if a new crop can be grazed).
The ‘pinch and twist test’ to determine if a new crop can be grazed
Pinch the top leaves between the thumb and forefi nger
Pull the leaves upwards while twisting your wrist
If the leaves break off and the plant does not pull out of the ground, the crop can
be grazed.
Pro
tein
(%
)
10
Wheat
Barley
Triticale
15
20
25
30
60 70 80 90 100 110 120
Days from sowing
GS 30. Start of
stem elongation

Page 35
Grazing Winter Crops Roadshow
Workshop NotesMarch 2008
Ideally there should be 800 to 1000 kg of DM per ha (1500 kg/ha for cattle) before
grazing. However, in reality most crops will not have reached this amount of growth
before grazing commences. Postponing grazing until this benchmark is reached
will limit the grazing opportunity for those who wish to minimise the impact on
subsequent grain yield.
Early grazing will encourage tillering and will keep plants vegetative because it delays
stem elongation.
Deciding how much crop to leave behind is contentious and the impact appears to be
infl uenced by the length of grazing required and the seasonal conditions after the livestock
are removed. Previous recommendations have been to not graze down ‘past the white line’
(see Grazing to the ‘white line’) but this broad recommendation needs to be qualifi ed.
The lower the crop is grazed, the slower it is to recover leaf area. The reduction in
growth rate is signifi cant for farmers who wish to graze for an extended period of
time. Grazing too low will reduce the crop canopy and its ability to intercept sunlight.
This will reduce the growth rate of the crop, which in turn will decrease the amount
Grazing can commence even at low amounts of drymatter.

Page 36
Free Food Thoughtfor
Grazing to the ‘white line’
This refers to the location on the plant
where the stems of the tillers change
colour from white to green. Allowing
stock to eat down into the white part of
the stem was considered detrimental to
plant recovery but this may not be the
case in higher rainfall areas. The ‘white line’
refers to the part
where the plant
turns from
white to green
Heavy grazing. This crop recovered to produce higher grain yield than the
ungrazed plots.
of feed available for ongoing grazing. For example in the Northern Ag Region in
Western Australia, total DM production was higher after simulated grazing (cutting)
down to 10 cm height rather than at 5 cm height (table 13). Grain yield response was
also better after being cut at 10 cm than at 5 cm.

Page 37
Grazing Winter Crops Roadshow
Workshop NotesMarch 2008
Table 13 Total dry matter production of three wheats cut to 5 cm and 10 cm
height Badgingarra, WA, 2005
Variety Cutting height (cm) Total DM (kg/ha)
Marombi10 8720
5 7130
Wylah10 9700
5 7200
Wedgetail10 8400
5 6690
Where growth rate is affected, it may require a reduction in stocking rate or removal
of stock earlier than anticipated.
In areas of shorter growing season, heavy grazing may limit the amount of time the
crop has to recover leaf before the plant produces an ear. At a lower rainfall location
on the Eyre Peninsula in 2006 (236 mm annual rainfall), crops that received repeated
grazing produced 46 % less total DM (500 kg/ha) than the ungrazed growth (933 kg/
ha). The reduction in leaf production corresponded with the crop rapidly running to
head particularly under dry conditions.
In contrast, crops in longer growing season areas appear to have time to recover and
produce suffi cient DM for successful grain fi ll despite very heavy grazing (assuming
spring weather conditions are favourable).
If grazing occurs after GS 30 is reached (stem elongation), then the recommended grazing
height must be increased if removal of the embryo ear is to be avoided (refer to start of
section 2). The recommendation is to avoid grazing below the node on the stem.

Page 38
Free Food Thoughtfor
Grazing duration is a third consideration. It is currently recommended that grazing
with sheep is completed by GS 30 if the aim is to minimise the risk of grain yield loss (see
Hints on how to pick when GS 30 is approaching, page 24 ). For cattle, grazing needs to
be completed before GS 32 is reached because they do not graze as low. Grazing can
continue after these benchmark growth stages, but a loss of grain yield will occur.
Multiple grazing can be undertaken which gives access to more DM, however, the
second and subsequent grazing are likely to occur after GS 30 has occurred. This
usually results in a loss of grain yield (table 14).
Table 14 Impact of single and double grazing on grain yield, Edillilie SA, 2006
(summary of 6 wheat and 3 barley varieties)
Crop Grazed early mid tillering, 63 days after sowing (t/ha)
Repeat grazing mid stem elongation, 84 days after sowing (t/ha)
No grazing(t/ha)
Wheat 2.00 1.20 1.92
Barley 2.72 1.81 2.65
Only long season varieties sown early provide an opportunity for multiple grazing.
Trials in the Northern Ag Region of Western Australia found that oats and wheat
produced more total DM when grazed (cut) rather than when ungrazed (uncut), with
six weekly cuts producing more total DM than four weekly cuttings. Of note was the
Graza 50 oats, that yielded 5070 kg/ha when not grazed, 7490 kg/ha when grazed
three times (four weekly) and 13,500 kg/ha when grazed twice (six weekly).
The oats also produced higher grain yields when grazed at four weekly intervals than
six weekly (however oat grain yields in this trial were very low and the varieties used
are more often used for grazing or hay production). Wheat had an increased yield
after grazing six weekly rather than four weekly.
Grazing also delays the time a crop will begin stem elongation. This is discussed in
more detail later (see section 3.2).
These three considerations (when grazing starts, the amount of crop left behind and
the duration of grazing) help calculate the intensity of grazing, or stocking rate.
Where only a small opportunity for grazing exists before GS 30 is reached, very high
stocking rates and crash grazing is appropriate. This ensures even grazing of the
crop and avoids the ‘lawn and rough’ effect that can occur when stock concentrate
grazing on a small area.
Page 39
Grazing Winter Crops Roadshow
Workshop NotesMarch 2008
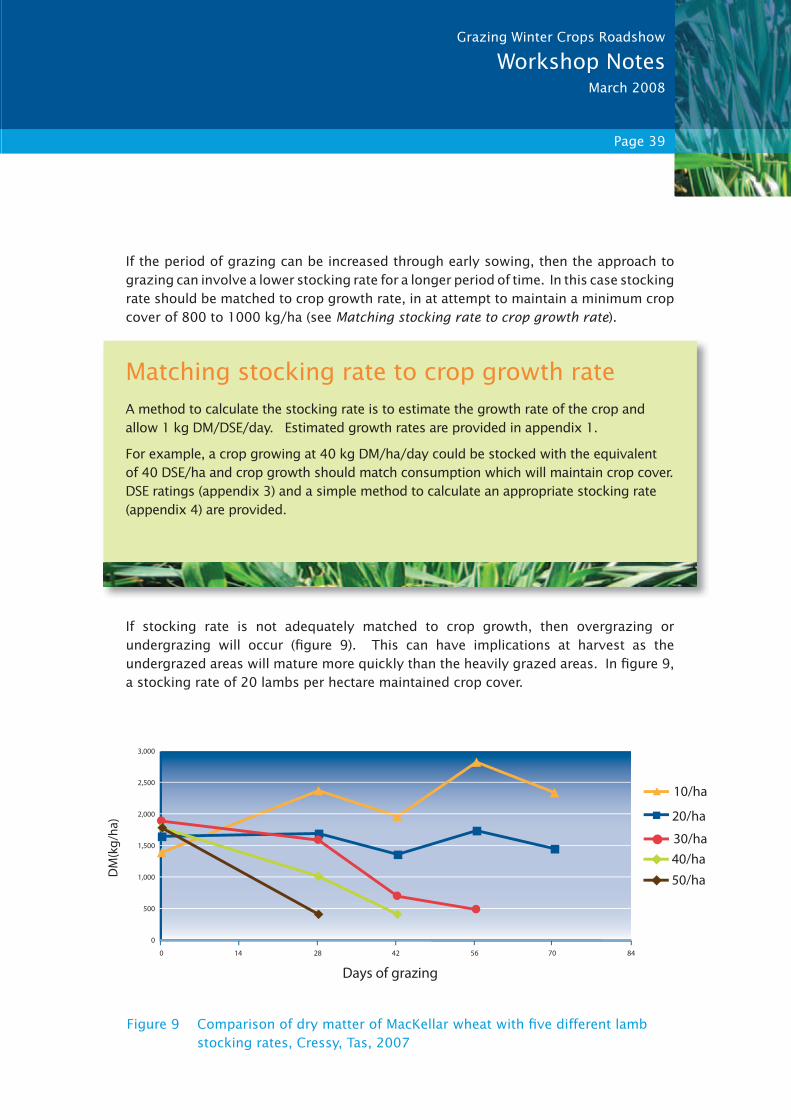
If the period of grazing can be increased through early sowing, then the approach to
grazing can involve a lower stocking rate for a longer period of time. In this case stocking
rate should be matched to crop growth rate, in at attempt to maintain a minimum crop
cover of 800 to 1000 kg/ha (see Matching stocking rate to crop growth rate).
If stocking rate is not adequately matched to crop growth, then overgrazing or
undergrazing will occur (fi gure 9). This can have implications at harvest as the
undergrazed areas will mature more quickly than the heavily grazed areas. In fi gure 9,
a stocking rate of 20 lambs per hectare maintained crop cover.
Matching stocking rate to crop growth rate
A method to calculate the stocking rate is to estimate the growth rate of the crop and
allow 1 kg DM/DSE/day. Estimated growth rates are provided in appendix 1.
For example, a crop growing at 40 kg DM/ha/day could be stocked with the equivalent
of 40 DSE/ha and crop growth should match consumption which will maintain crop cover.
DSE ratings (appendix 3) and a simple method to calculate an appropriate stocking rate
(appendix 4) are provided.
2,000
1,500
14
DM
(kg
/ha
)
84
Days of grazing
1,000
500
0
20/ha
10/ha
40/ha
2,500
42
30/ha
28 56 700
3,000
50/ha
Figure 9 Comparison of dry matter of MacKellar wheat with fi ve different lamb
stocking rates, Cressy, Tas, 2007

Page 40
Free Food Thoughtfor
Large paddocks can result in uneven grazing. Stock will concentrate on part of the
paddock (top) leaving other parts ungrazed (above).
Page 41
Grazing Winter Crops Roadshow
Workshop NotesMarch 2008
For many farmers a signifi cant challenge is to fi nd enough stock to graze the crop
evenly within the grazing window. This is especially true if the cropping paddocks
are large, sowing is late in the season or there are many crops that could be grazed
all at the one time. Soil type and the stage of crop maturity will also affect the ability
to graze evenly (see case study 8).
Temporary fencing is one way of creating smaller paddocks so that the grazing
intensity can be optimised (see case study 9).
“
”
Case study 8
Grazing preference – Rod Batson, Inverleigh, VicRod grazed 1200 young merinos on a 33 ha paddock of Amarok red wheat which
was managed in two adjoining paddocks. It was in these paddocks that Rod noticed
the fi rst evidence of preferential grazing in any of the cereals.
“Both paddocks had a mix of heavy clay soils and loamy banks,” Rod says.
“From early on it became clear that the sheep were effectively grazing to soil
type. They were preferentially grazing the heavier clay soil type bare and left
the banks alone.
It happened in both paddocks, the wheat on the clay must have been
more palatable.”

Page 42
Free Food Thoughtfor
“
Case study 9
Temporary fencing to improve the evenness of grazing – Don Nairn, Binnu, WA
In 2003, Don Nairn started grazing a 117 ha
paddock of grazing oats with 500 merino
ewes. After a few days, he noticed that the
sheep didn’t appear to be eating the oats
across the whole paddock but concentrating
on a particular section. There was also
evidence of the sheep camping on top of a
hill which was to the detriment of the oats
planted there.
To combat this affect, Don used a temporary
electric fence to divide the paddock in half.
“The sheep started to graze the oats more
evenly, however they still weren’t utilising
the feed as well as they could have been,”
Don says.
“So the next year I bought more
temporary fencing and using a rappa
system (a 4WD motorbike fi tted out to
unroll temporary fencing), divided the
paddock into seven smaller paddocks
about 15 ha in size. The smaller areas
were then strip grazed.”
Don says the difference was amazing, with
the paddocks grazed uniformly and the
regrowth was more even. It also prevented
the sheep camping in one spot.
”
Temporary sub division fencing (Don
Nairn, WA)

Page 43
Grazing Winter Crops Roadshow
Workshop NotesMarch 2008
2.8 Use of herbicides
Post emergent herbicides are commonly used in crops to control weeds. Most of these
herbicides have a withholding period from grazing after application (so do insecticides),
so the timing of the grazing and spraying operations need to be considered together.
However, grazing may improve the effi ciency of weed control. For example, the use
of grazing may enable certain broadleaf weeds to be controlled using a combination
of a lower rate of herbicide with grazing (spraygraze technique).
Many herbicides can also have a temporary stunting effect on the plants, which
reduces the amount of DM available for grazing. The impact is more pronounced
when a greater amount of DM is exposed at the time of spraying (fi gure 10).
Figure 10 Impact on dry matter after the use of Axial post emergent herbicide on
wheat (cv MacKellar), Barley (cv Gairdner) and Triticale (cv Monstress),
Inverleigh, Vic, 2007
DM
(kg
/ha
0
Mackellar
Gairdner
Monstress
1000
2000
3000
4000
5000
6000
60 70 80 90 100 110 120
Days from sowing
2.7 Suitable livestock
Sheep and cattle can graze winter crops. Farmers have successfully grazed lambs, young
sheep, pregnant ewes to ewes with lambs at foot. Cattle have also been grazing crops
with no reported detrimental effects.
The main issues identifi ed include an occasional increase in scouring and possibly a
slight increase in mortality. These are discussed in section 3.6.
Axial applied at 200 mL/ha

Page 44
Free Food Thoughtfor
A range of common herbicides used in crops post emergence, their withholding periods
and effect on crop appearance, as described on the label, is presented (table 15).
Table 15 Common post emergent crop herbicides, withholding periods and label
notice of crop injury
Common product name
Active ingredient (s)
Withholding period from grazing
Notes on potential crop injury
Affi nity carfentrazone - ethyl
14 days None noted
Ally metsulfuron - methyl
None if used as directed
Crop yellowing and plant retardation may occur if applied to stressed crop or crop under stress after application
Axial pinoxaden
Cloquintocet - mexyl
21 days Some products can results in crop yellowing or crop injury when applied with crop oils including ADIGOR
Amicide 2,4-D amine 7 days None noted
Diuron diuron None if used as directed
Heavy rain after application may cause severe crop damage
Dual Gold S-metolachlor 8 weeks Damage may occur if crop is won too shallow (less than 4 cm)
Glean chlorsulfuron Nil, but recommend 24 hrs to optimise weed control
Crop yellowing and plant retardation may occur if applied to stressed crop or crop under stress after application
Gesaprim atrazine Pre emergent application: 15 weeks
Post emergent application: 6 weeks
Use on triazine tolerant canola only.
Hoegrass diclofop - methyl
7 weeks None noted
Hussar iososulfuron-methyl-sodium
None if used as directed
None noted. Use on wheat only
Trifl ur Trifl uralin None if used as directed
None noted
MCPA MCPA 7 days None noted
Midas MCPA, Imazapic, Imazapyr
4 weeks May lead to transient crop yellowing and temporary slowing of growth. For use with CLEARFIELDS wheat only
Roundup
(pre sowing)
glyphosate None if used as directed
None noted
Select clethodim 21 days None noted. Canola only
Sprayseed
(pre sowing)
Paraquat, diquat
1 day None noted
Tigrex MCPA, Difl ufenican
7 days Some transient yellowing may occur.
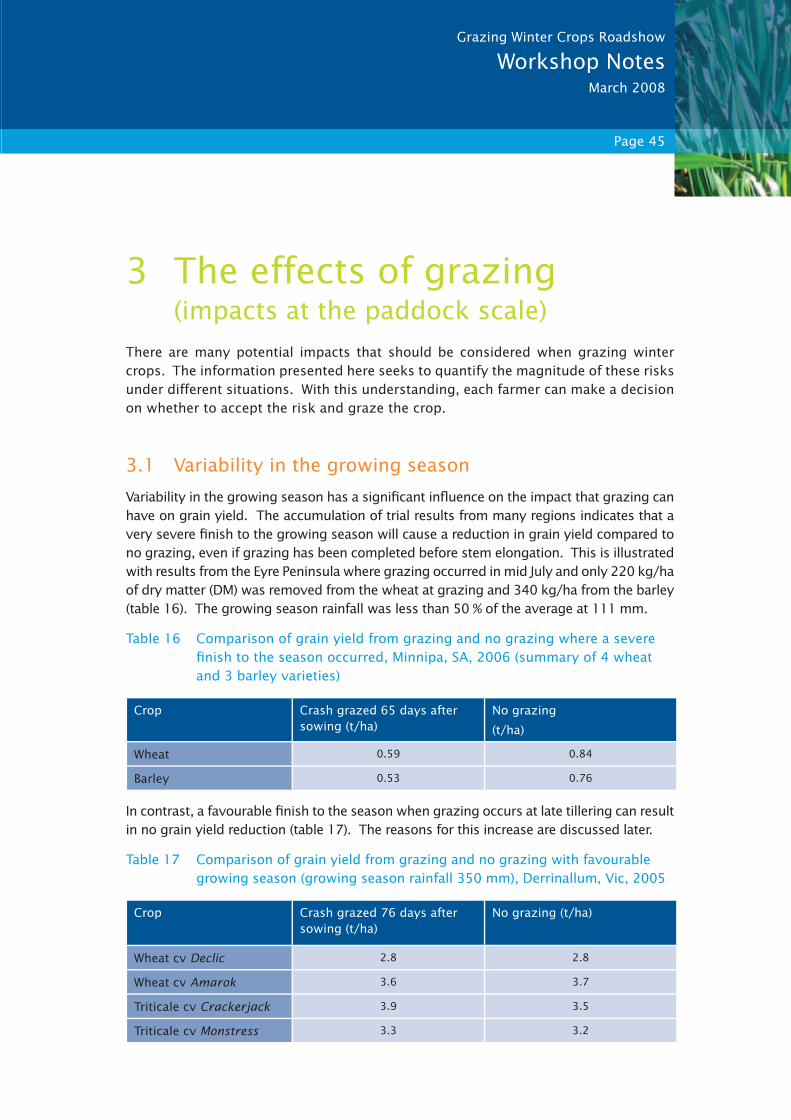
Page 45
Grazing Winter Crops Roadshow
Workshop NotesMarch 2008
3 The effects of grazing (impacts at the paddock scale)
There are many potential impacts that should be considered when grazing winter
crops. The information presented here seeks to quantify the magnitude of these risks
under different situations. With this understanding, each farmer can make a decision
on whether to accept the risk and graze the crop.
3.1 Variability in the growing season
Variability in the growing season has a signifi cant infl uence on the impact that grazing can
have on grain yield. The accumulation of trial results from many regions indicates that a
very severe fi nish to the growing season will cause a reduction in grain yield compared to
no grazing, even if grazing has been completed before stem elongation. This is illustrated
with results from the Eyre Peninsula where grazing occurred in mid July and only 220 kg/ha
of dry matter (DM) was removed from the wheat at grazing and 340 kg/ha from the barley
(table 16). The growing season rainfall was less than 50 % of the average at 111 mm.
Table 16 Comparison of grain yield from grazing and no grazing where a severe
fi nish to the season occurred, Minnipa, SA, 2006 (summary of 4 wheat
and 3 barley varieties)
Crop Crash grazed 65 days after sowing (t/ha)
No grazing
(t/ha)
Wheat 0.59 0.84
Barley 0.53 0.76
In contrast, a favourable fi nish to the season when grazing occurs at late tillering can result
in no grain yield reduction (table 17). The reasons for this increase are discussed later.
Table 17 Comparison of grain yield from grazing and no grazing with favourable
growing season (growing season rainfall 350 mm), Derrinallum, Vic, 2005
Crop Crash grazed 76 days after sowing (t/ha)
No grazing (t/ha)
Wheat cv Declic 2.8 2.8
Wheat cv Amarok 3.6 3.7
Triticale cv Crackerjack 3.9 3.5
Triticale cv Monstress 3.3 3.2
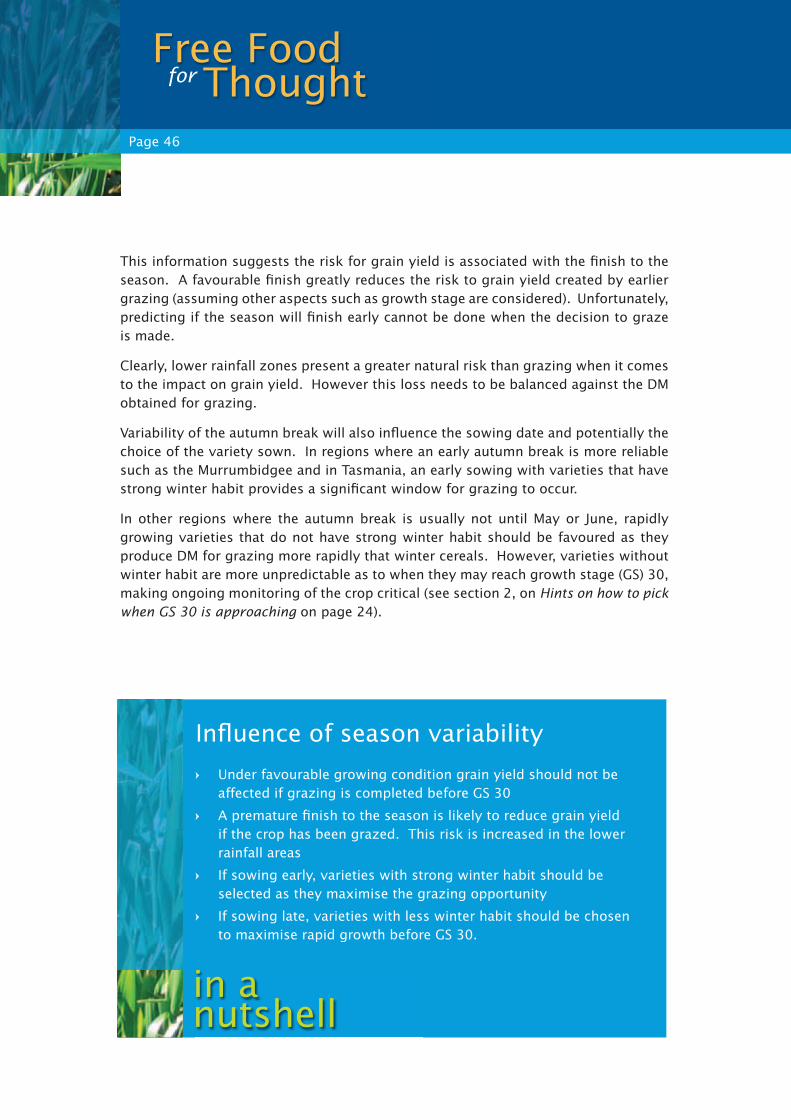
Page 46
Free Food Thoughtfor
This information suggests the risk for grain yield is associated with the fi nish to the
season. A favourable fi nish greatly reduces the risk to grain yield created by earlier
grazing (assuming other aspects such as growth stage are considered). Unfortunately,
predicting if the season will fi nish early cannot be done when the decision to graze
is made.
Clearly, lower rainfall zones present a greater natural risk than grazing when it comes
to the impact on grain yield. However this loss needs to be balanced against the DM
obtained for grazing.
Variability of the autumn break will also infl uence the sowing date and potentially the
choice of the variety sown. In regions where an early autumn break is more reliable
such as the Murrumbidgee and in Tasmania, an early sowing with varieties that have
strong winter habit provides a signifi cant window for grazing to occur.
In other regions where the autumn break is usually not until May or June, rapidly
growing varieties that do not have strong winter habit should be favoured as they
produce DM for grazing more rapidly that winter cereals. However, varieties without
winter habit are more unpredictable as to when they may reach growth stage (GS) 30,
making ongoing monitoring of the crop critical (see section 2, on Hints on how to pick
when GS 30 is approaching on page 24).
Infl uence of season variability
Under favourable growing condition grain yield should not be
affected if grazing is completed before GS 30
A premature fi nish to the season is likely to reduce grain yield
if the crop has been grazed. This risk is increased in the lower
rainfall areas
If sowing early, varieties with strong winter habit should be
selected as they maximise the grazing opportunity
If sowing late, varieties with less winter habit should be chosen
to maximise rapid growth before GS 30.
in a nutshell
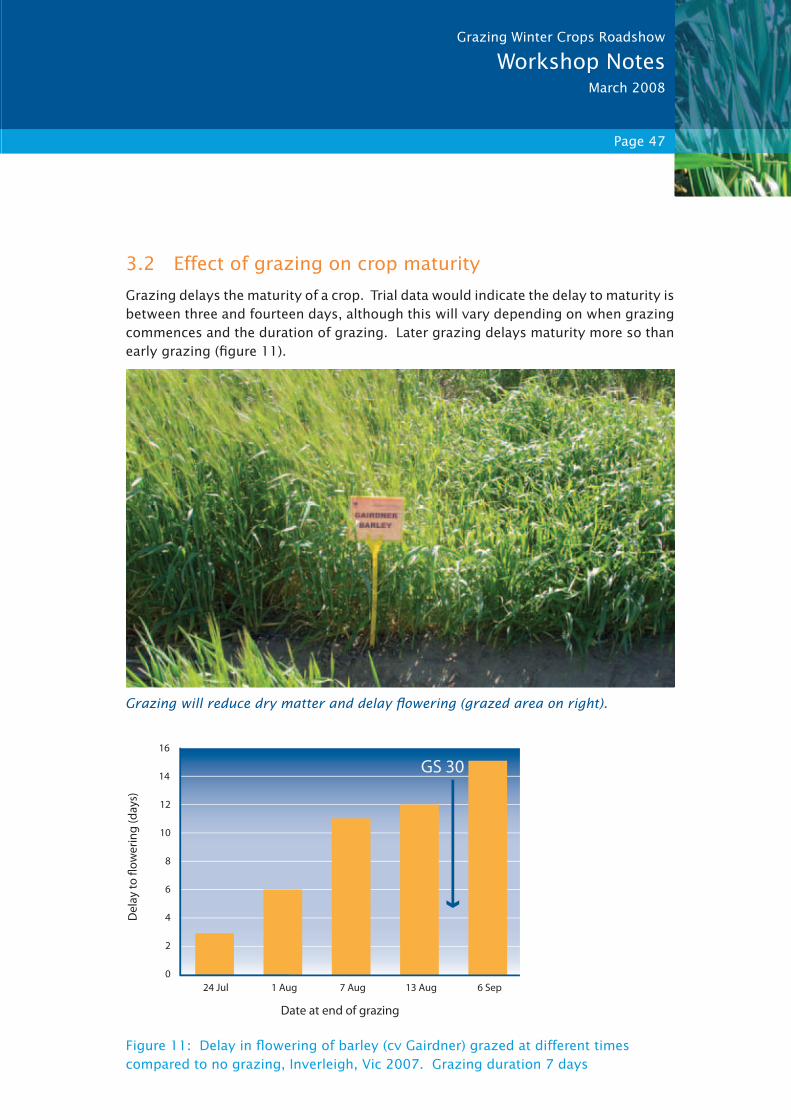
Page 47
Grazing Winter Crops Roadshow
Workshop NotesMarch 2008
3.2 Effect of grazing on crop maturity
Grazing delays the maturity of a crop. Trial data would indicate the delay to maturity is
between three and fourteen days, although this will vary depending on when grazing
commences and the duration of grazing. Later grazing delays maturity more so than
early grazing (fi gure 11).
Figure 11: Delay in fl owering of barley (cv Gairdner) grazed at different times
compared to no grazing, Inverleigh, Vic 2007. Grazing duration 7 days
Grazing will reduce dry matter and delay fl owering (grazed area on right).
0
2
4
6
8
10
12
24 Jul 1 Aug 7 Aug 13 Aug 6 Sep
Date at end of grazing
14
16
GS 30

Page 48
Free Food Thoughtfor
The same effect is seen with extended periods of grazing, where it appears the time
when grazing is completed infl uences fl owering date.
This has both positive and negative implications. If the crop cannot be grazed evenly
there will be variability in crop maturity, which may create diffi culties at harvest,
especially with barley which is prone to drop grain heads when mature. On the positive
side, grazing may be used strategically to delay fl owering that may avoid damage
caused by late frosts. Yet it may push maturity into a period of late moisture stress.
Infl uence on crop maturity
Grazing will delay fl owering by between three and fourteen days.
The earlier grazing is completed, the shorter delay to fl owering.
in a nutshell
Uneven grazing will lead to different rates of crop maturity. Three samples taken
from an unevenly grazed triticale paddock on 20/07/07. Grazed down to 10 cm
(left), grazed down to 15 cm (middle), ungrazed (right) Note position of embryo ear
along stem.

Page 49
Grazing Winter Crops Roadshow
Workshop NotesMarch 2008
3.3 Effect of grazing on grain yield
The impact of grazing on grain yield will depend on two main factors:
the seasonal conditions after grazing
when grazing is completed.
The infl uence of seasonal conditions has been discussed in section 3.1. With
unfavourable conditions grain yield will always be affected by grazing. The size of
the loss is diffi cult to predict, however the response shown in fi gure 12 illustrates
some recorded losses. While the yield reduction appears large, the unfavourable
seasonal conditions resulted in grain yields in the ungrazed plots of only 0.81 t/ha
(wheat), 0.95t/ha (barley) and 0.6 t/ha (oats).
Figure 12 Grain yield comparison of grazing against no grazing for wheat, barley
and oat crops at different growth stages, Minnipa, SA (2005 – 2007)
Gra
in y
ield
aft
er
gra
zin
g
com
pa
red
to
no
gra
zin
g (
%)
-60%
-40%
-20%
0%
20%
Growth stage
Wheat
Barley
Oats
Early vegetativegrowth
Post emergent(3 leaf )
Late vegetativegrowth
GS 30
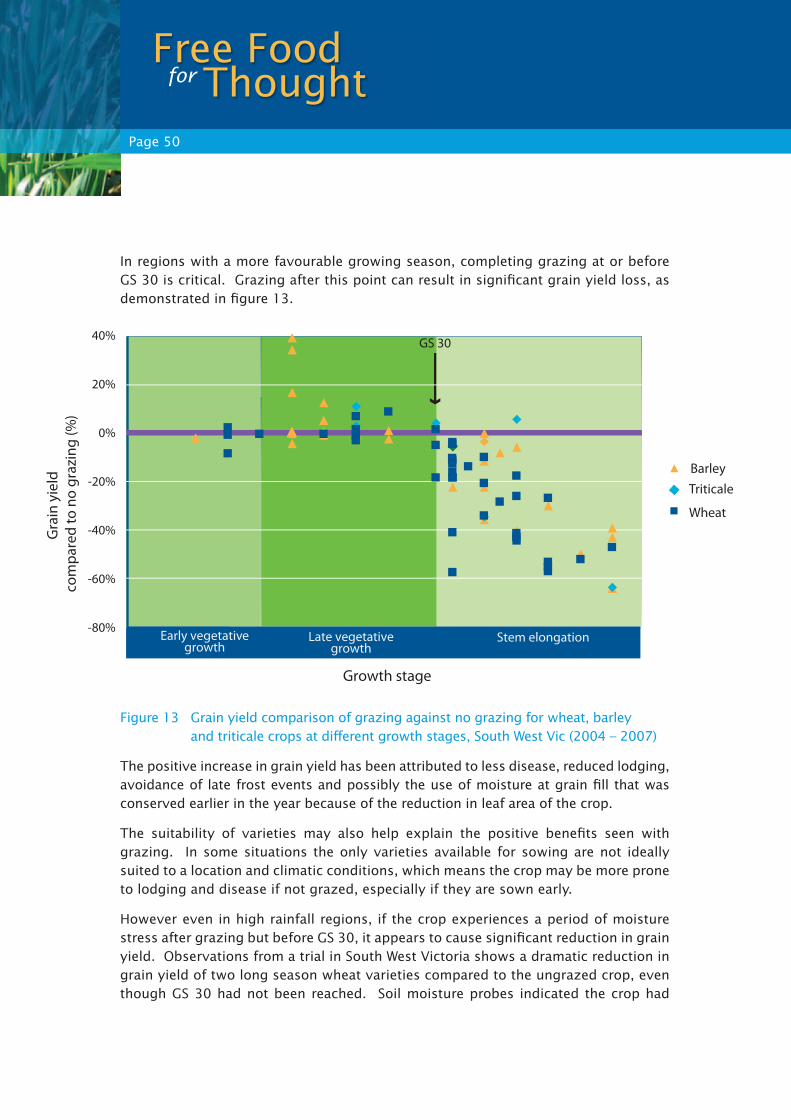
Page 50
Free Food Thoughtfor
In regions with a more favourable growing season, completing grazing at or before
GS 30 is critical. Grazing after this point can result in signifi cant grain yield loss, as
demonstrated in fi gure 13.
Figure 13 Grain yield comparison of grazing against no grazing for wheat, barley
and triticale crops at different growth stages, South West Vic (2004 – 2007)
The positive increase in grain yield has been attributed to less disease, reduced lodging,
avoidance of late frost events and possibly the use of moisture at grain fi ll that was
conserved earlier in the year because of the reduction in leaf area of the crop.
The suitability of varieties may also help explain the positive benefi ts seen with
grazing. In some situations the only varieties available for sowing are not ideally
suited to a location and climatic conditions, which means the crop may be more prone
to lodging and disease if not grazed, especially if they are sown early.
However even in high rainfall regions, if the crop experiences a period of moisture
stress after grazing but before GS 30, it appears to cause signifi cant reduction in grain
yield. Observations from a trial in South West Victoria shows a dramatic reduction in
grain yield of two long season wheat varieties compared to the ungrazed crop, even
though GS 30 had not been reached. Soil moisture probes indicated the crop had
Gra
in y
ield
com
pa
red
to
no
gra
zin
g (
%)
-60%
-40%
-20%
0%
20%
Growth stage
Wheat
Barley
Triticale
Late vegetativegrowth
Early vegetativegrowth
Stem elongation
GS 3040%
-80%

Page 51
Grazing Winter Crops Roadshow
Workshop NotesMarch 2008
reached wilting point (no soil moisture available for plant growth) during late August,
so despite grazing before GS 30, crop recovery was poor which led to lower grain
yield (fi gure 14).
Figure 14 Grain yield comparison of grazing against no grazing for long season
wheats (Marombi, MacKellar), indicating period of moisture stress,
Inverleigh, Vic, 2007
Grazing after GS combined with moisture stress can result in poor crop recovery and
grain yield.
Re
du
ctio
n in
gra
in y
ield
du
e t
o g
razi
ng
(t/
ha
)
-3.0
-2.5
-2.0
-1.5
-1.0
Date at end of grazing
-0.5
-3.5
0
0.5
16/07/07 24/07/07 01/08/07 07/08/07 13/08/07 06/09/07
Marombi
Mackellar
GS 30
Period of moisture stress

Page 52
Free Food Thoughtfor
3.4 Effect of grazing on grain quality and grain characteristics
There is limited information available on the effect of grazing on grain quality. Early
information would suggest grain protein in barley is reduced by grazing, despite signifi cant
applications of nitrogen during the growing season (fi gure 15). The effect is not as obvious
in wheat and further investigations are required before conclusions can be drawn.
Figure 15 Grain protein comparison of grazing against no grazing for Yerong barley
under different nitrogen applications, Inverleigh, Vic 2007.
Additional nitrogen applied after GS 30. GS 00 = sowing, GS 22 = 2 tillers
Infl uence on grazing on grain yield
In long growing season areas, the completion of grazing before
GS 30 should ensure no grain yield loss unless periods of
moisture stress are encountered.
In shorter growing season environments, grain yield losses will
occur due to grazing but may be reduced by early grazing.
in a nutshell
Gra
in p
rote
in (
%)
9.5
10
10.5
11
11.5
12
12.5
0 N 45 N
@ GS 00
45 N
@ GS 22
45 N
@ GS 100 plus
45 N @ GS 22Nitrogen treatment
GrazedUngrazed

Page 53
Grazing Winter Crops Roadshow
Workshop NotesMarch 2008
There is no clear conclusion as to the effect of grazing on screenings and thousand
grain weight (grain size). Results are still being analysed at the time of writing but
both increases and reductions in these grain characteristics have been measured.
3.5 Effect of grazing on silage, hay and stubble
In most cases grazing will reduce the amount of material left for silage, hay and
the stubble after harvest. For silage, there are only limited trial results to examine,
although the response of most varieties to grazing is to incur a reduction in DM
compared to no grazing (fi gure 16).
Grain quality and characteristics
The impact of grazing on grain quality remains unclear at present
except for protein.
Grain protein is reduced by grazing, expecially with barley,
irrespective of the levels of nitrogen used on the crop.
in a nutshell
Recovery of triticale for silage after grazing, spectacular but still less than the ungrazed
comparison.

Page 54
Free Food Thoughtfor
Figure 16 Percentage change in dry matter of wheat (green bars) and triticale (light
blue bars) when grazing compared to no grazing, Bairnsdale, Vic, 2006
There is no trial data on the effect grazing has on hay production compared to no
grazing but it would be fair to assume the response would be similar to silage.
Grazing will also have an effect on the amount of stubble left after grain harvest.
Grazing will reduce the amount of stubble remaining, although there is less of an effect
the earlier the crop is grazed. This is probably because there is more time for the plants
to recover before stem elongation commences (fi gure 17). There may also be a crop
type difference, with wheat appearing less affected than barley if grazed early.
DM
co
mp
are
d t
o n
o g
razi
ng
(%
)
-40%
-30%
-20%
-10%
0%
10%
Kellalac Marombi Rudd MacKellar
Variety
Amarok Monstress Kosiosko Frelon
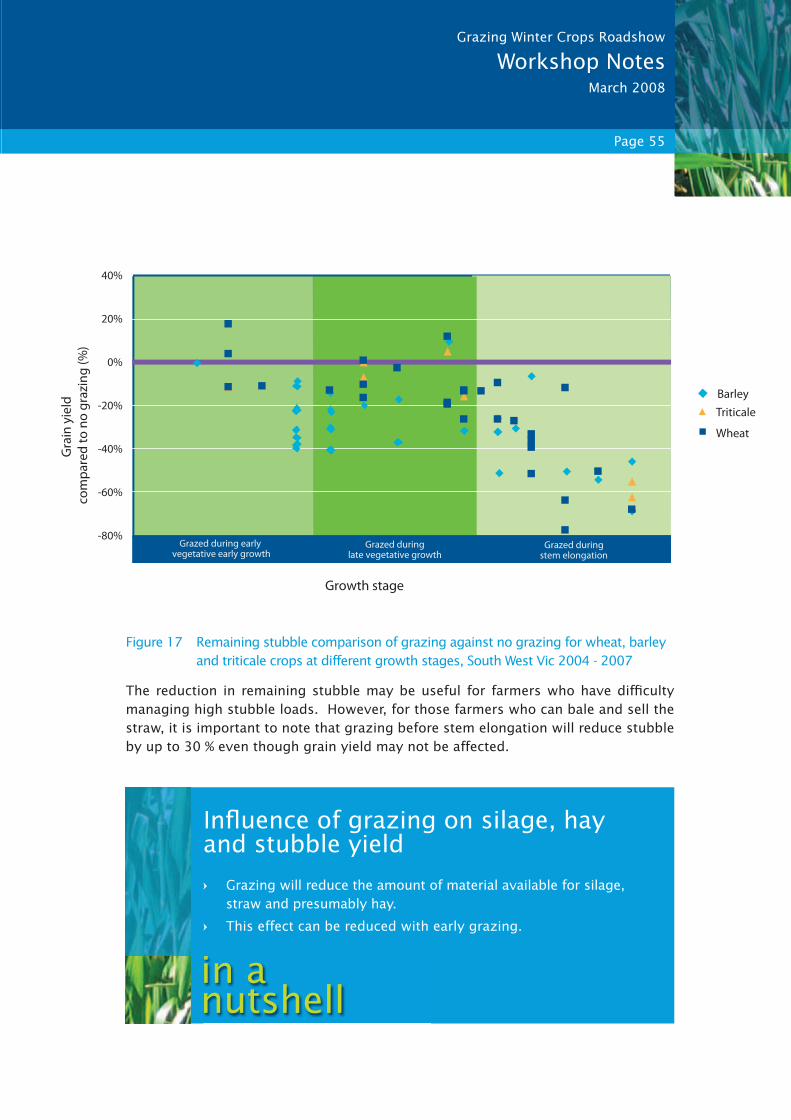
Page 55
Grazing Winter Crops Roadshow
Workshop NotesMarch 2008
Figure 17 Remaining stubble comparison of grazing against no grazing for wheat, barley
and triticale crops at different growth stages, South West Vic 2004 - 2007
The reduction in remaining stubble may be useful for farmers who have diffi culty
managing high stubble loads. However, for those farmers who can bale and sell the
straw, it is important to note that grazing before stem elongation will reduce stubble
by up to 30 % even though grain yield may not be affected.
Infl uence of grazing on silage, hay and stubble yield
Grazing will reduce the amount of material available for silage,
straw and presumably hay.
This effect can be reduced with early grazing.
in a nutshell
Gra
in y
ield
com
pa
red
to
no
gra
zin
g (
%)
-60%
-40%
-20%
0%
20%
Growth stage
Grazed duringlate vegetative growth
Grazed during early vegetative early growth
Grazed duringstem elongation
40%
-80%
Wheat
Barley
Triticale
Page 56
Free Food Thoughtfor
3.6 Livestock response to grazing (and animal health issues)
When grazed in the vegetative stage, winter crops are a high quality feed source, with
crude protein of 22 to 30 % of DM, metabolisable energy of 11 to 13 Megajoules/kg
DM and neutral detergent fi bre of 30 to 40 % (refer to section 2.5 for more details).
The plant material has a very high water content of between 80 and 90 %.
3.6.1 Liveweight
The response of livestock to grazing winter crops has been quite variable. A review
by Hugh Dove, a Chief Research Scientist with CSIRO Plant Industry, Canberra, found
that growth rates varied widely for sheep and cattle.
Low magnesium in the grazing stock has been identifi ed as a likely cause of for
the variability in growth rates. Acute magnesium defi ciencies result in grass tetany,
however more marginal defi ciencies present themselves as lower than expected
growth rates. The cause of the magnesium defi ciency is an imbalance of potassium
and sodium in the cereal the animals are grazing. Excess potassium combined with
low sodium reduces the absorption of magnesium in the rumen. This defi ciency can
be easily rectifi ed with a simple mineral lick (see Recipe for magnesium loose lick).
If no mineral defi ciencies are present and adequate feed is provided, the following
growth rates could be anticipated for winter crops (table 18).
Recipe for magnesium loose lick
Mix equal parts of Causmag (MgO), ground limestone and salt
Place in containers (drench drum cut in half) and locate in an accessible
area for livestock.

Page 57
Grazing Winter Crops Roadshow
Workshop NotesMarch 2008
Table 18: Anticipated liveweight gains for certain classes of stock
Livestock Liveweight gain (kg/hd/day)
Lambs (25 – 40 kg) 0.25 to 0.30
Hoggets (30 – 35 kg) 0.14 to 0.36
Steers (300 – 400 kg) 1.5 to 1.8
As feed becomes limiting, growth rates will be reduced. This is illustrated in fi gure
18 for a trial where crossbred wether lambs were grazing Mackellar wheat for up to
70 days at fi ve different stocking rates. Once the feed on offer fell below 1000 kg/
ha, liveweight gains were reduced. This occurred before the 70 days grazing at high
stocking rates.
Figure 18 Liveweight gain of crossbred whether lambs grazing wheat (cv Mackellar)
at fi ve different stocking rates, Cressy, Tas. Circles indicate dry mater
less than 1000 kg/ha. NB: High initial weight gain probably due to gut fi ll
Liv
ew
eig
ht
ga
in (
kg/h
ea
d/d
ay)
-0.1
20/ha
10/ha
40/ha
0
0.1
0.2
0.3
0-14 days 14-28 days 28-42 days 42-56 days 56-70 days
Period of grazing
0.4
0.5
0.6
50/ha
30/ha

Page 58
Free Food Thoughtfor
Farmers have also reported signifi cant weight gains from grazing winter crops (table 19).
Table 19 Liveweight gains recorded by farmers
Producer Location Year Crop Livestock Liveweight gain (gm/hd/day)
Shawcross Ceres, Vic 2007 Barley Crossbred ewes and lambs
337 (ewes), 296 (lambs)
Johnson Warrambeen, Vic
2007 Triticale, wheat
Merino weaners
170
3.6.2 Animal health
Farmers who have started grazing winter crops in the last few years have observed
some animal health issues. In interviews conducted with 14 farmers in South West
Victoria who were grazing winter crops, 40 % believed there were slightly higher ewe
mortalities and 30 % reported increased dags.
Stock grazing lush leafy crops under these conditions will often scour because of the
high water content in the plant material. For an animal to eat 1 kg of DM, it needs
to eat 5 to 10 kg of green feed. Not all this water can be removed in urine and the
excess will be excreted as liquid waste. From an animal health perspective this is not
a concern. Scouring may also be caused by a rapid change in diet, where the animal
has not become accustomed to the different quality feed.
The simplest way to minimise the potential scouring effect is to provide roughage just
before entry to the crop and maintain access to this material during grazing. Late pregnant
or lactating cows, or ewes, especially need good quality hay. Additional actions can
include introducing stock to the type of feed over a three or four day period or only graze
late in the afternoon for the fi rst few days (to avoid potential nitrate poisoning). Always
avoid turning hungry stock into a crop on an empty stomach (see case study 10).
Case study 10
Helping stock cope with grazing winter cropsMick Shawcross from Ceres near Geelong,
Victoria, has been grazing winter crops
for the past six years. Mick tries where
possible to introduce ewes and lambs onto
cereals gradually so they can adjust to the
change in feed. This involves grazing the
stock on an area with volunteer cereals
in pasture prior to putting the stock on
the cereal or allowing access to a pasture
paddock during the introduction period.
Hay is also used. He fi nds the stock
don’t get daggy on the cereals because
they have access to hay and have an
introduction period with cereals to help
them adapt.
Page 59
Grazing Winter Crops Roadshow
Workshop NotesMarch 2008
Canola can pose a greater risk to animal health than cereals, but this usually occurs
when animals are suddenly introduced to the crop, often combined with conditions that
make the crop stressed such as a lack of moisture, frost or herbicide application. The
potential animal health problems include pneumonia, gastroenteritis, liver damage,
photosensitisation and nitrate poisoning. Stock should be fully vaccinated against
enterotoxaemia before grazing. The recommendation when grazing canola is to offer
hay and observe the animals closely for at least the fi rst two weeks of grazing.
Recent use of nitrogen fertiliser on cereals and brassicas can also increase the risk to the
livestock, as can crops growing on very fertile soil. The risk of nitrate poisoning is higher
during dull, cloudy weather due to reduced photosynthesis in the plant. As a precaution,
it is recommended not to graze for three weeks after a nitrogen application.
3.7 Grazing and the impact on crop weeds
Some farmers have raised concerns that grazing may increase the weed density in
crops by removing competition, encouraging germination of weed seed or increasing
tillering once the weeds are grazed.
While there is very little information regarding the effect grazing has on weed status
within crops (especially cereals), some basic principles about weeds in crops are well
established:
Increased crop competition will reduce weeds. This can be achieved through:
Livestock issues
Livestock have potential to achieve high growth rates grazing cereals
Farmers have observed slight increases in mortalities and dags
when grazing cereals
Hay can be used to help reduce scouring and digestive upsets
when stock are introduced to lush cereals
Cereals are usually low in sodium and sometimes magnesium,
so a mineral lick should be offered (see Recipe for magnesium
loose lick on page 56)
Stock grazing canola crops can be exposed to additional animal
health issues and extra care is needed; especially in the fi rst
two weeks
Do not graze crops for three weeks after applying nitrogen fertiliser.
in a nutshell

“
”
Case study 12
Grazing preference – Don Nairn, Binnu, VicFor the past three years Don Nairn
has been strip grazing Pallinup
oats with merino ewes as a form
of weed control on wild radish.
He then crops his paddock the
following year for grain.
Don says, “the sheep
preferentially graze the radish
as they don’t seem to like
the taste of the Pallinup oats.
The radish will re-shoot but
the sheep just keep selecting
it. This prevents the radish
reaching the fl owering
stage and any plants that do
survive are smaller and are
much easier to control if I do
decide to spray. As herbicide
resistance to wild radish is
becoming more of a problem,
grazing can be used to
minimise the use
of herbicides.”
Strip grazing Pallinup oats to remove
wild raddish. Ungrazed on the left.
Page 60
Free Food Thoughtfor
Variety selection. The most competitive –
crop types are oats, followed by barley, then
wheat and fi nally triticale
Higher sowing rates and narrow row –
spacing have been shown to dramatically
reduce annual ryegrass seed heads. A
minimum plant density of 200 plants/m2 is
suggested to maximise competition while
minimise any potential grain yield reduction
Time of sowing, with earlier sowing –
generally favouring more vigorous cereal
plants and therefore providing greater
competition to the weeds
Adequate fertility and soil conditions are –
essential to maximise the competitive growth
rate advantage cereals have over many weeds.
The amount of weed in a crop directly
infl uences subsequent weed seed production.
Reducing the amount of weed in a crop will
reduce weed seed set.
3.7.1 So what does this mean for grazing crops?
The basic principles of weed control in crops are
complementary to the practices used in grazing winter
crops. Maximizing leaf production through high plant
density, adequate soil fertility and selection for rapid
growing crops all suit weed control strategies and DM
production for grazing. However there are some specifi c
issues related to grazing that need to be considered.
Grazing preference
Livestock often show a grazing preference for some
plants over others. This occurs in cereal crops and
with weeds in a crop. A trial in South West Victoria
comprising two barley, one triticale and four wheat
varieties grazed at six different times, demonstrated
sheep had a clear preference for the wheat varieties
over the barley varieties.
Observations of this preference difference have been
used successfully by Don Nairn in the Northern Ag
Region of Western Australia. Sheep have been used
to selectively target radish in both lupins and Pallinup
oats with great success (see case study 12).
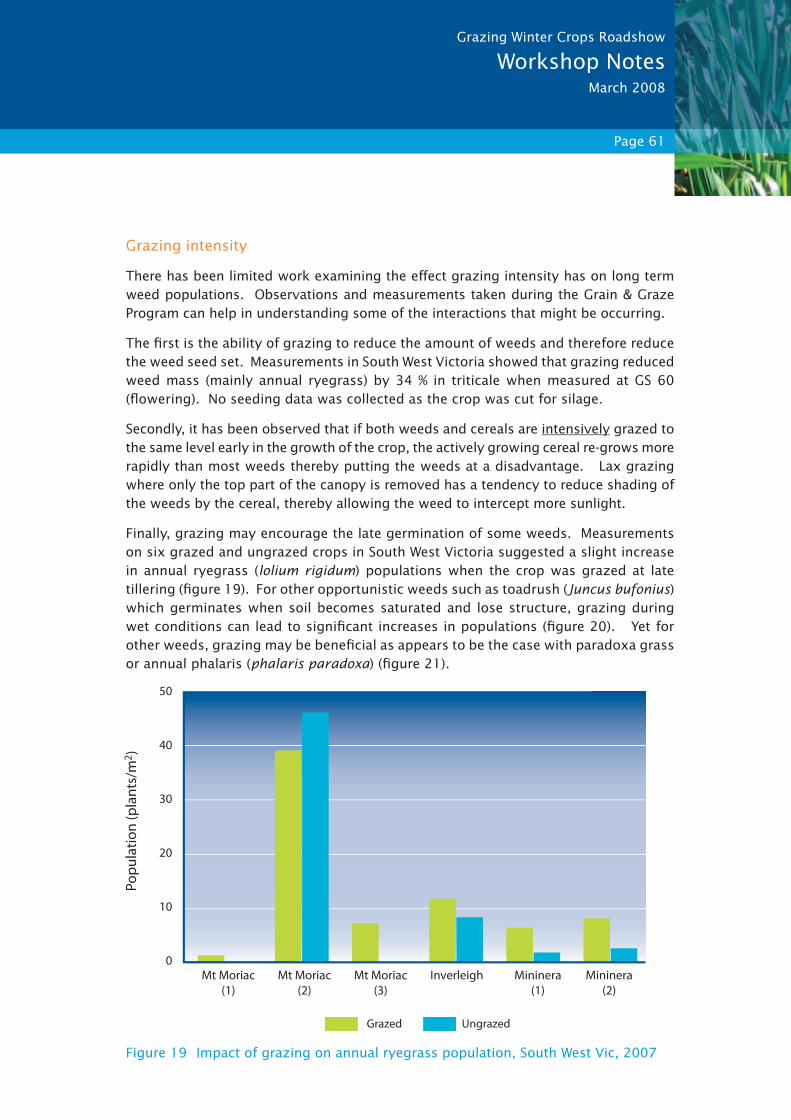
Page 61
Grazing Winter Crops Roadshow
Workshop NotesMarch 2008
Grazing intensity
There has been limited work examining the effect grazing intensity has on long term
weed populations. Observations and measurements taken during the Grain & Graze
Program can help in understanding some of the interactions that might be occurring.
The fi rst is the ability of grazing to reduce the amount of weeds and therefore reduce
the weed seed set. Measurements in South West Victoria showed that grazing reduced
weed mass (mainly annual ryegrass) by 34 % in triticale when measured at GS 60
(fl owering). No seeding data was collected as the crop was cut for silage.
Secondly, it has been observed that if both weeds and cereals are intensively grazed to
the same level early in the growth of the crop, the actively growing cereal re-grows more
rapidly than most weeds thereby putting the weeds at a disadvantage. Lax grazing
where only the top part of the canopy is removed has a tendency to reduce shading of
the weeds by the cereal, thereby allowing the weed to intercept more sunlight.
Finally, grazing may encourage the late germination of some weeds. Measurements
on six grazed and ungrazed crops in South West Victoria suggested a slight increase
in annual ryegrass (lolium rigidum) populations when the crop was grazed at late
tillering (fi gure 19). For other opportunistic weeds such as toadrush (Juncus bufonius)
which germinates when soil becomes saturated and lose structure, grazing during
wet conditions can lead to signifi cant increases in populations (fi gure 20). Yet for
other weeds, grazing may be benefi cial as appears to be the case with paradoxa grass
or annual phalaris (phalaris paradoxa) (fi gure 21).
Figure 19 Impact of grazing on annual ryegrass population, South West Vic, 2007
Po
pu
lati
on
(p
lan
ts/m
2)
0
10
20
30
40
50
Mt Moriac
(1)
Grazed Ungrazed
Mt Moriac
(2)
Mt Moriac
(3)
Inverleigh Mininera
(1)
Mininera
(2)

Page 62
Free Food Thoughtfor
Figure 20 Impact of grazing on Toadrush population, South West Vic, 2007
Figure 21 Impact of grazing on Paradoxa grass population, South West Vic, 2007
Po
pu
lati
on
(p
lan
ts/m
2)
0
20
40
60
80
100
Grazed Ungrazed
Mt Moriac
(3)
Mininera
(1)
Mininera
(2)
120
140
Po
pu
lati
on
(p
lan
ts/m
2)
0
20
40
60
Grazed Ungrazed
Mt Moriac
(2)
Inverleigh
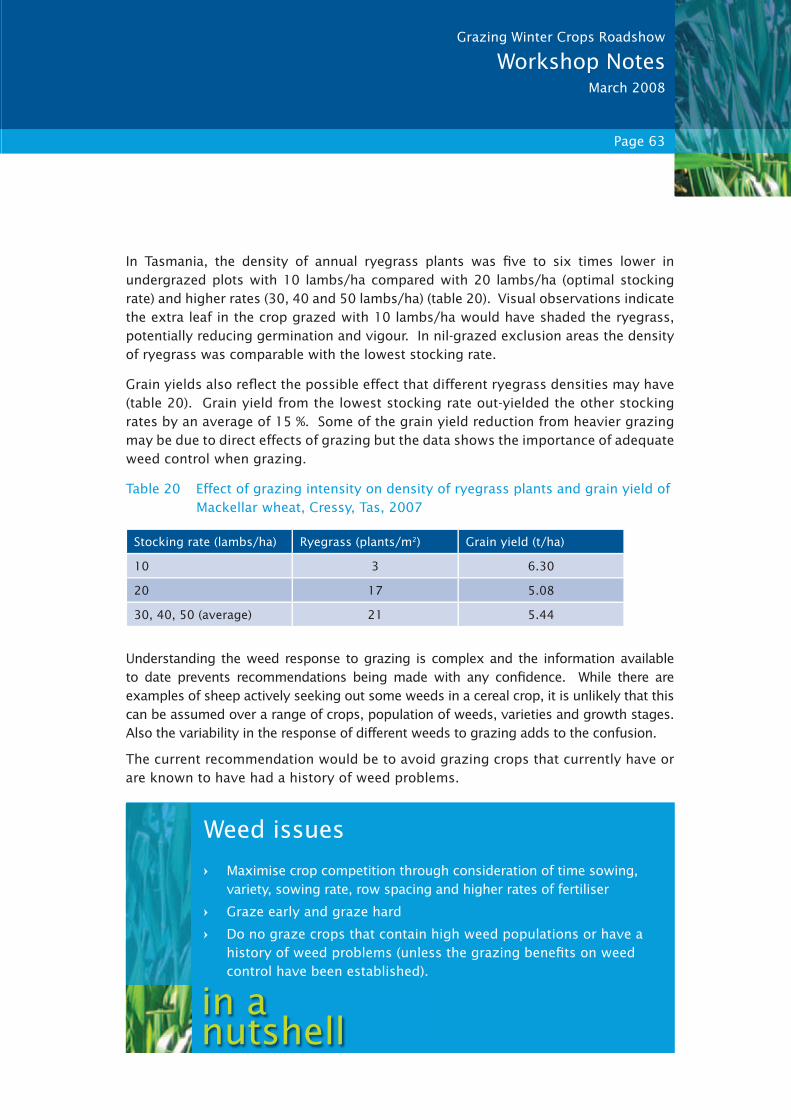
Page 63
Grazing Winter Crops Roadshow
Workshop NotesMarch 2008
In Tasmania, the density of annual ryegrass plants was fi ve to six times lower in
undergrazed plots with 10 lambs/ha compared with 20 lambs/ha (optimal stocking
rate) and higher rates (30, 40 and 50 lambs/ha) (table 20). Visual observations indicate
the extra leaf in the crop grazed with 10 lambs/ha would have shaded the ryegrass,
potentially reducing germination and vigour. In nil-grazed exclusion areas the density
of ryegrass was comparable with the lowest stocking rate.
Grain yields also refl ect the possible effect that different ryegrass densities may have
(table 20). Grain yield from the lowest stocking rate out-yielded the other stocking
rates by an average of 15 %. Some of the grain yield reduction from heavier grazing
may be due to direct effects of grazing but the data shows the importance of adequate
weed control when grazing.
Table 20 Effect of grazing intensity on density of ryegrass plants and grain yield of
Mackellar wheat, Cressy, Tas, 2007
Stocking rate (lambs/ha) Ryegrass (plants/m2) Grain yield (t/ha)
10 3 6.30
20 17 5.08
30, 40, 50 (average) 21 5.44
Understanding the weed response to grazing is complex and the information available
to date prevents recommendations being made with any confi dence. While there are
examples of sheep actively seeking out some weeds in a cereal crop, it is unlikely that this
can be assumed over a range of crops, population of weeds, varieties and growth stages.
Also the variability in the response of different weeds to grazing adds to the confusion.
The current recommendation would be to avoid grazing crops that currently have or
are known to have had a history of weed problems.
Weed issues
Maximise crop competition through consideration of time sowing,
variety, sowing rate, row spacing and higher rates of fertiliser
Graze early and graze hard
Do no graze crops that contain high weed populations or have a
history of weed problems (unless the grazing benefi ts on weed
control have been established).
in a nutshell

Page 64
Free Food Thoughtfor
3.8 Grazing and the impact on crop diseases
The emerging threat of Wheat Streak Mosaic Virus (WSMV) poses a potential challenge to
early sown cereal crops (see What is Wheat Streak Mosaic Virus?). The ability to achieve
the required break in the ‘green bridge’ may reduce the opportunity to sow crops early.
The anecdotal information on diseases in cereal crops is quite variable. Some farmers
believe grazing has reduced disease such as rust by removing the diseased leaves and
therefore the source of ongoing infection, or by reducing the canopy which improves
air circulation and creates a less favourable condition for disease build up.
What is Wheat Streak Mosaic Virus?
Wheat Streak Mosaic Virus (WSMV) is spread by the wheat curl mite and affects
wheat, barley and oats as well as other crops and grasses. The virus affects the
leaves of the plant and can result in signifi cant yield losses, especially to early sown
crops. In 2005, WSMV caused the failure of 5,000 ha of crop in NSW and a further
20,000 ha in 2006.
The mite survives from season to season by living on green plant material such as
volunteer cereals and grasses in crops as well as along the paddock boundaries. If
this ‘green bridge’ is broken, the mites will not survive.
The current recommendation is to remove all green material for two to four weeks
before sowing the crop.
Example of grazing reducing disease incidence in crop (ungrazed on left, grazed crop
on right).
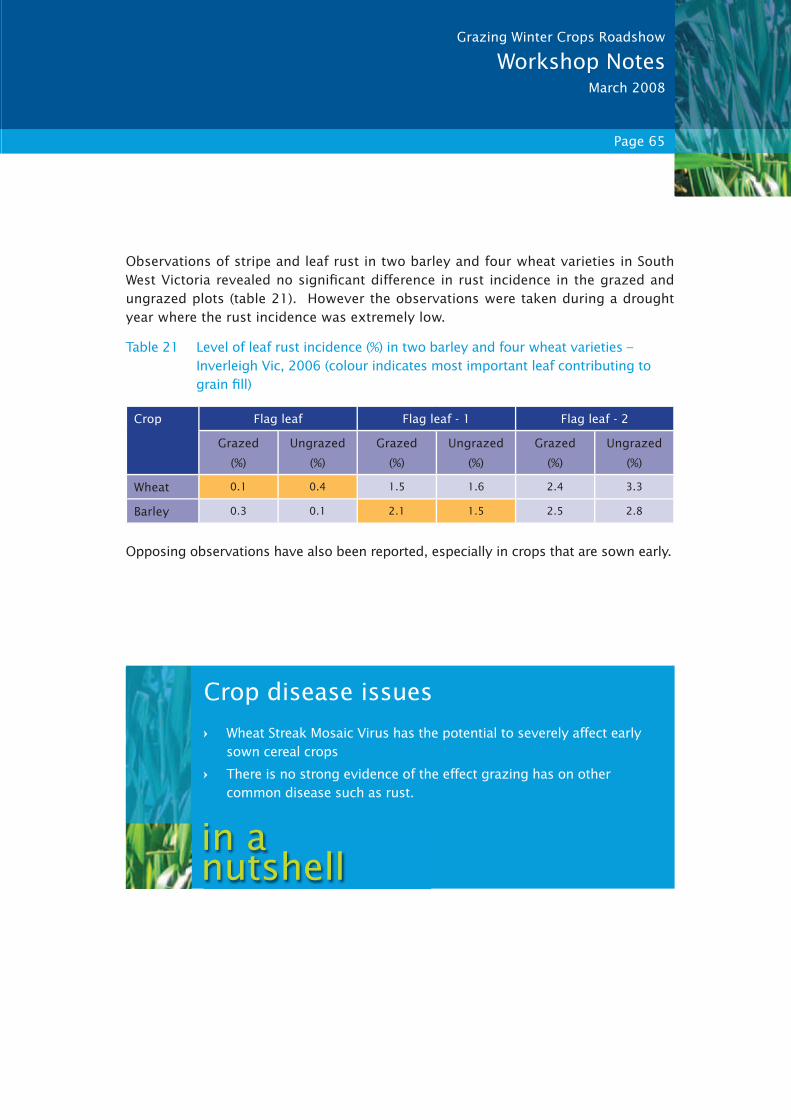
Page 65
Grazing Winter Crops Roadshow
Workshop NotesMarch 2008
Observations of stripe and leaf rust in two barley and four wheat varieties in South
West Victoria revealed no signifi cant difference in rust incidence in the grazed and
ungrazed plots (table 21). However the observations were taken during a drought
year where the rust incidence was extremely low.
Table 21 Level of leaf rust incidence (%) in two barley and four wheat varieties –
Inverleigh Vic, 2006 (colour indicates most important leaf contributing to
grain fi ll)
Crop Flag leaf Flag leaf - 1 Flag leaf - 2
Grazed
(%)
Ungrazed
(%)
Grazed
(%)
Ungrazed
(%)
Grazed
(%)
Ungrazed
(%)
Wheat 0.1 0.4 1.5 1.6 2.4 3.3
Barley 0.3 0.1 2.1 1.5 2.5 2.8
Opposing observations have also been reported, especially in crops that are sown early.
Crop disease issues
Wheat Streak Mosaic Virus has the potential to severely affect early
sown cereal crops
There is no strong evidence of the effect grazing has on other
common disease such as rust.
in a nutshell

Page 66
Free Food Thoughtfor
Appendix 1Average cereal growth rates by Grain & Graze region
NB: These are average fi gures only and are highly dependent on adequate
growth conditions
Corangamite / Glenelg Hopkins (Southern Victoria / Tasmania)
Crop scenario: Winter wheat (March sown, good break or irrigated)56
Month Growth rate (kg DM/ha/day) Grazing
Mar 5
Apr 15
May 25 Possible5
Jun 30 Yes
Jul 60 Yes
Aug Possible6
Sep
Crop scenario: Wheat (May sown)
Month Growth rate (kg DM/ha/day) Grazing
May 5
Jun 15
Jul 25 Possible7
Aug 40 Yes
Sep Possible8
Crop scenario: Barley (May sown)
Month Growth rate (kg DM/ha/day) Grazing
May 15
Jun 25 Possible9
Jul 25 Yes
Aug 100 Yes
Sep Possible10
Growth rates for May sown triticale are between wheat and barley.
5-7,9 Grazing could start if plants are well anchored8 May get grain yield loss if grazing past mid September10 Likely to get grain yield loss if grazing past early September

Page 67
Grazing Winter Crops Roadshow
Workshop NotesMarch 2008
Eyre Peninsula (South Australia)
Crop scenario: Wheat (May sown). Lower North SA7
Month Growth rate (kg DM/ha/day) Grazing
May
Jun 10 Possible11
Jul 20 Yes
Aug
Sep
Northern Ag Region (Badgingarra) WA
Crop Scenario: Winter Wheat (May sown)
Month Growth rate (kg DM/ha/day) Grazing
May 5
Jun 15 Possible
Jul 25 Yes
Aug 40 Yes
Sep
Crop Scenario: Wheat (May sown)
Month Growth rate (kg DM/ha/day) Grazing
May 5
Jun 15 Possible
Jul 25 Yes
Aug 40 Yes
Sep
Crop Scenario: Barley (May sown)
Month Growth rate (kg DM/ha/day) Grazing
May 15
Jun 20 Possible
Jul 25 Yes
Aug 40 Yes
Sep
Crop Scenario: Triticale (May sown)
Month Growth rate (kg DM/ha/day) Grazing
May 15
Jun 20 Possible
Jul 25 Yes
Aug 40 Yes
Sep
7 Grazing could start if plants are well anchored
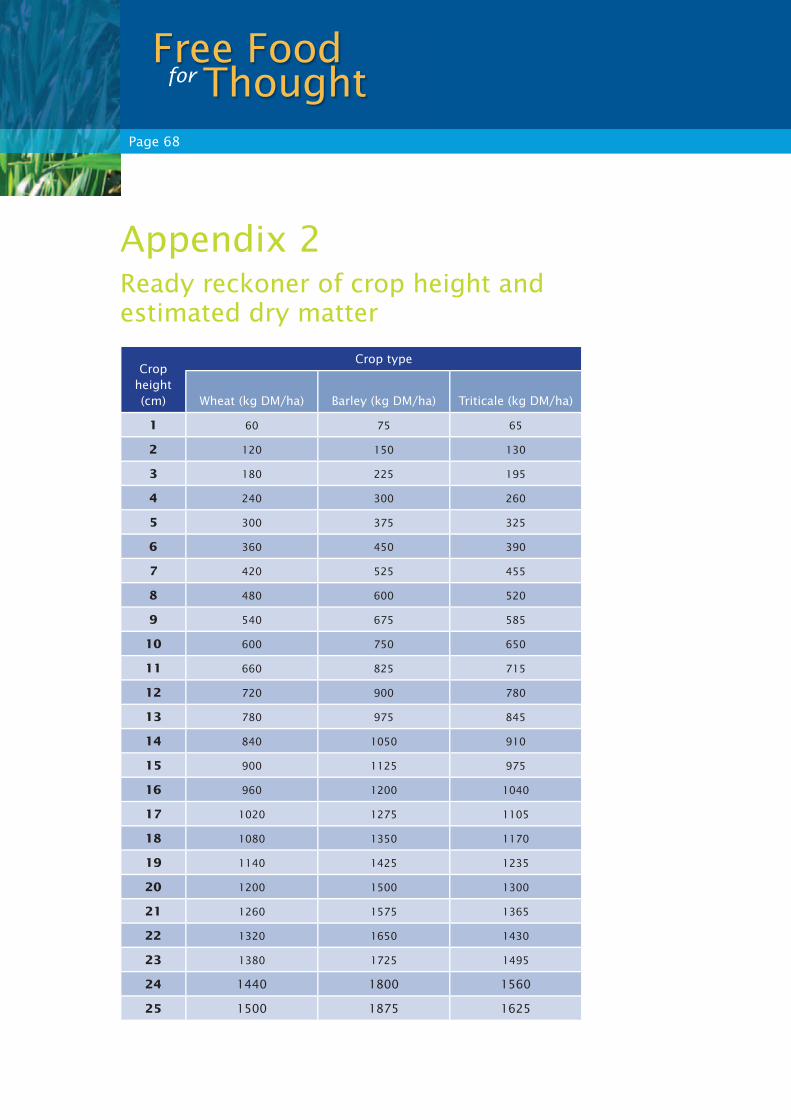
Page 68
Free Food Thoughtfor
Appendix 2 Ready reckoner of crop height and estimated dry matter
Crop height (cm)
Crop type
Wheat (kg DM/ha) Barley (kg DM/ha) Triticale (kg DM/ha)
1 60 75 65
2 120 150 130
3 180 225 195
4 240 300 260
5 300 375 325
6 360 450 390
7 420 525 455
8 480 600 520
9 540 675 585
10 600 750 650
11 660 825 715
12 720 900 780
13 780 975 845
14 840 1050 910
15 900 1125 975
16 960 1200 1040
17 1020 1275 1105
18 1080 1350 1170
19 1140 1425 1235
20 1200 1500 1300
21 1260 1575 1365
22 1320 1650 1430
23 1380 1725 1495
24 1440 1800 1560
25 1500 1875 1625

Page 69
Grazing Winter Crops Roadshow
Workshop NotesMarch 2008
Appendix 3Dry sheet equivalent (DSE) rating for different classes of livestock
Sheep
Class of livestock Bodyweight (kg)
40 50 60 70 80
Dry sheep 0.9 1.1 1.2 1.3 1.4
Pregnant ewes, last month
- singles 1.2 1.4 1.6 1.8 2.0
- twins 1.4 1.6 1.9 2.2 2.5
Lactating ewes
- singles (100%) 2.6 2.7 2.9 3.1 3.3
- twins (200%) 3.7 3.9 4.4 4.9 5.4
Weaned lambs
- Merino 20 kg 0.6 – 1.0 depending on desired rate of liveweight gain
- X bred 30 -40 kg 1.0 – 1.5 depending on desired rate of liveweight gain
Source: Prograze
Cattle
Class of livestock Bodyweight (kg)
500 550 600
Pregnant, last 3 months 11 12 13
Lactating cow & calf, 0 – 3 months 13 14 15
Lactating cow and 150 kg calf 18 19 20
Steers 200 300 400
Rate of gain
- Maintenance 4 6 7
- 0.5 kg/day 6 7 8
- 1.0 kg/day 8.5 11 13
Source: Prograze

Page 70
Free Food Thoughtfor
Appendix 4Budget sheet to calculate the number of stock needed to graze a specifi ed herbage mass over a given number of days
*1 The amount of crop DM at the start (appendix 2) minus the amount of crop you want to leave behind (refer to page 35)*2 The estimated daily crop growth rate for the paddock during the budget period (appendix 1)*3 The available crop plus the amount grown over the budget period. Column A plus (column B multiplied by column C)*4 The total DM divided by the number of days. Column D divided by column C*5 The amount of crop the average animal in the herd or fl ock will eat per day (refer to page 39 and appendix 3)*6 The pasture allowance per day divided by the amount each animal eats. Column E divided by column F.
Source: Modifi ed table from Prograze
Date Paddock AAvailable DM (kg DM/ha)*1
BCereal growth rate(kg DM/ha/day)*2
CDays in the rotation

Page 71
Grazing Winter Crops Roadshow
Workshop NotesMarch 2008
DTotal DM over the budget period (kg DM/ha)*3
ECrop allowance/day(kg DM/ha)*4
FCrop eaten/head/day*5
GStocking rate required (no of head)*6

Page 72
Free Food Thoughtfor


Page 74
Free Food Thoughtfor
Grain & Graze is a collaborative partnership between Meat & Livestock Australia (MLA), Australian Wool Innovation (AWI), the Grains Research and Development Corporation (GRDC) and Land & Water Australia (LWA). It aims to boost the profi tability of Australia’s mixed farms while simultaneously improving management of their natural resources.
The ‘free lunch’. Reduction in the
amount of dead
material at the
base of the plant
due to grazing.
Grazed plant (left),
ungrazed (right).
These two crops
yielded the same.


