46
Diversity Data Snapshots March 2014 Edition Diversity Policy and Programs

Diversity Data Snapshots
March 2014 Edition
Diversity Policy and Programs
CDC Health Disparities and Inequalities Report —United States, 2013
CDC Health Disparities and Inequalities Report — United States, 2013. (2013). Morbidity and Mortality Weekly Report (MMWR) Supplements, 62(Supplement No. 3), 1 - 187

Health Insurance Coverage —United States, 2008 and 2010
Ramal Moonesinghe, PhD1
Man-huei Chang, MPH2
Benedict I. Truman, MD3
1Office of Minority Health and Health Equity, Office of the Director, CDC
2Center for Surveillance, Epidemiology, and Laboratory Services, CDC
3National Center for HIV/AIDS, Viral Hepatitis, STD, and TB Prevention, CDC

Health Insurance Coverage — United States, 2008 and 2010
• In 2010 there was a higher percentage of uninsured males (24.1%) than females (18.8%).
• The uninsured rate for young adults aged 18–34 years (29.8%) was approximately double the uninsured rate for adults aged 45–64 years (15.4%)
• Among adults aged 18-64, 41.6% of Hispanic and 22.1% of non-Hispanic Blacks were classified as uninsured.
• In 2010, Hispanics accounted 16% of the entire population and for 29.3% of the uninsured population.
• 50.7% of uninsured adults were near poor• Uninsured rates for persons in the poor and near poor categories increased
significantly in 2008 from 37.0% and 30.5%, respectively to 41.2% and 34.2%, in 2010.
• The uninsured rate for non-Hispanic Blacks also increased significantly from 22.1% in 2008 to 26.2% in 2010.
CDC Health Disparities and Inequalities Report — United States, 2013. (2013). Morbidity and Mortality Weekly Report (MMWR) Supplements, 62(Supplement No. 3), pp.61-64.
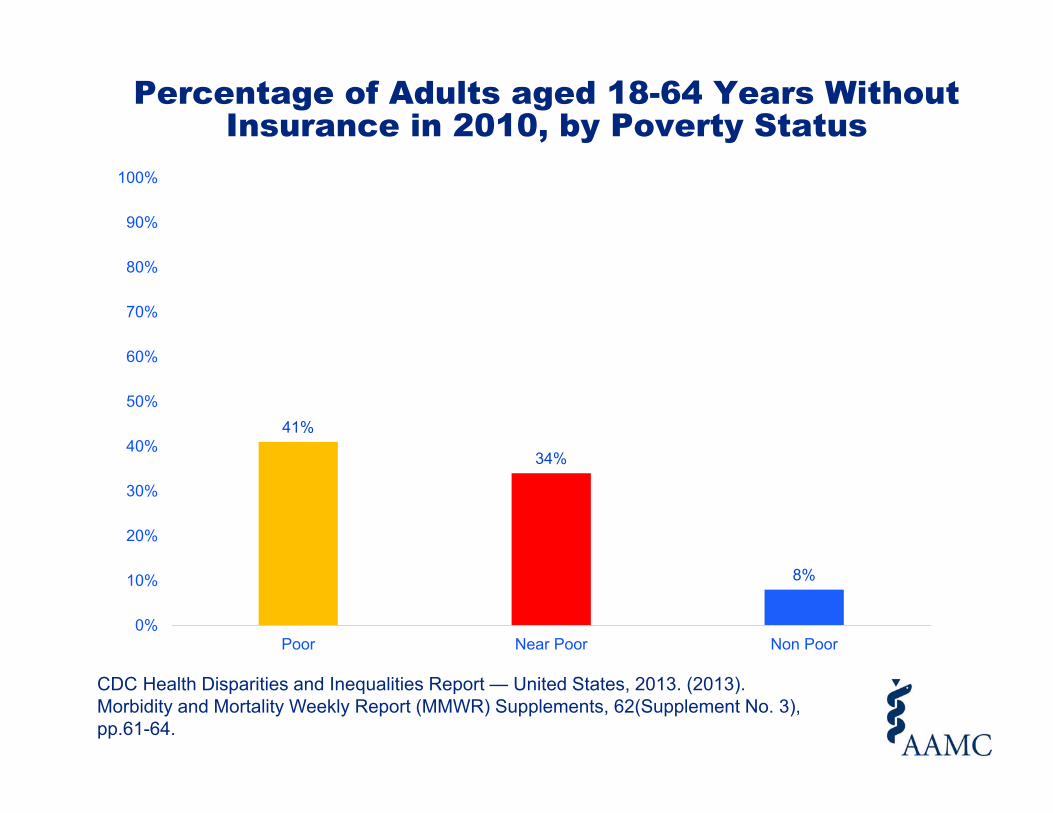
Percentage of Adults aged 18-64 Years Without Insurance in 2010, by Poverty Status
41%
34%
8%
0%
10%
20%
30%
40%
50%
60%
70%
80%
90%
100%
Poor Near Poor Non Poor
CDC Health Disparities and Inequalities Report — United States, 2013. (2013). Morbidity and Mortality Weekly Report (MMWR) Supplements, 62(Supplement No. 3), pp.61-64.

Percentage of Adults Aged 18-64 Years Without Insurance in 2010, by Educational Attainment
43%
28%
20%
8%
0%
10%
20%
30%
40%
50%
60%
70%
80%
90%
100%
Less than High School High School Graduate orEquivalent
Some College College Graduate orHigher
CDC Health Disparities and Inequalities Report — United States, 2013. (2013). Morbidity and Mortality Weekly Report (MMWR) Supplements, 62(Supplement No. 3), pp.61-64.

Percentage of Adults Aged 18-64 Years Without Insurance in 2010, by Race/Ethnicity
41%
16%
26%
17%
0%
10%
20%
30%
40%
50%
60%
70%
80%
90%
100%
Hispanic White, non-Hispanic Black, non-Hispanic Asian/Pacific Islander
CDC Health Disparities and Inequalities Report — United States, 2013. (2013). Morbidity and Mortality Weekly Report (MMWR) Supplements, 62(Supplement No. 3), pp.61-64.

Colorectal Cancer Incidence and
Screening — United States, 2008 and 2010
C. Brooke Steele, DO Sun Hee Rim, MPH
Djenaba A. Joseph, MD Jessica B. King, MPH
Laura C. Seeff, MD National Center for Chronic Disease Prevention and
Health Promotion, CDC
Colorectal Cancer Incidence and Screening — United States, 2008 and 2010
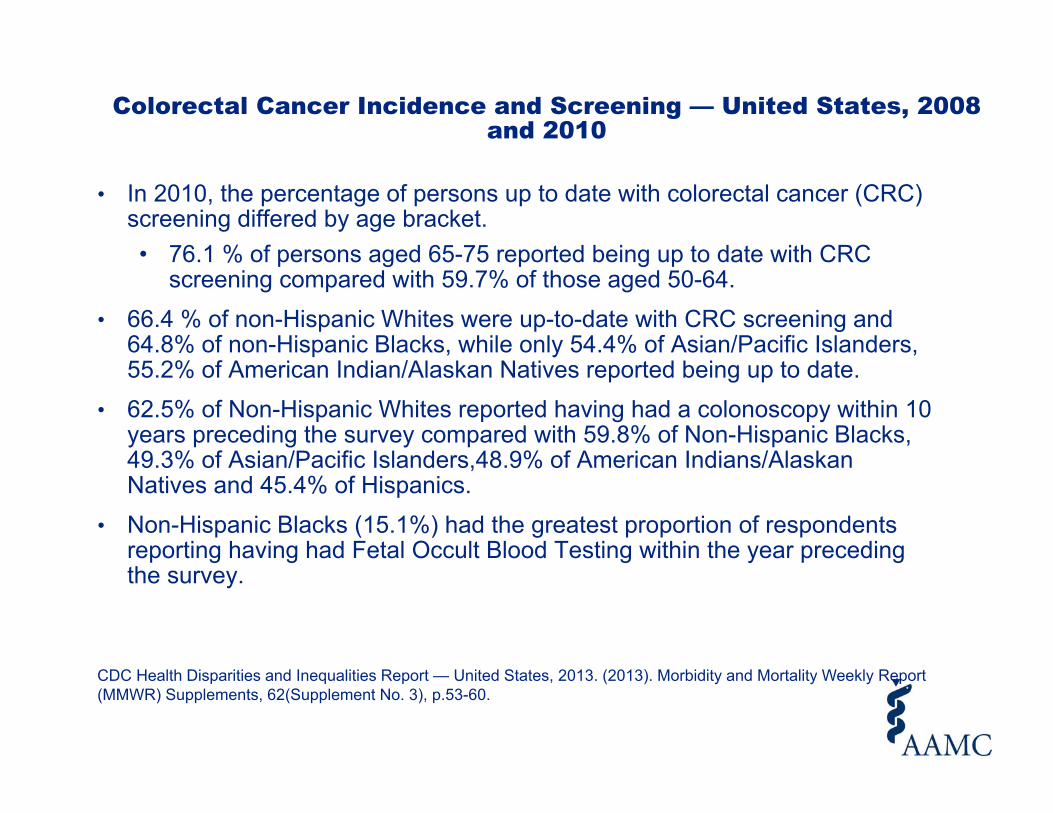
• In 2010, the percentage of persons up to date with colorectal cancer (CRC) screening differed by age bracket. • 76.1 % of persons aged 65-75 reported being up to date with CRC
screening compared with 59.7% of those aged 50-64. • 66.4 % of non-Hispanic Whites were up-to-date with CRC screening and
64.8% of non-Hispanic Blacks, while only 54.4% of Asian/Pacific Islanders, 55.2% of American Indian/Alaskan Natives reported being up to date.
• 62.5% of Non-Hispanic Whites reported having had a colonoscopy within 10 years preceding the survey compared with 59.8% of Non-Hispanic Blacks, 49.3% of Asian/Pacific Islanders,48.9% of American Indians/Alaskan Natives and 45.4% of Hispanics.
• Non-Hispanic Blacks (15.1%) had the greatest proportion of respondents reporting having had Fetal Occult Blood Testing within the year preceding the survey.
CDC Health Disparities and Inequalities Report — United States, 2013. (2013). Morbidity and Mortality Weekly Report (MMWR) Supplements, 62(Supplement No. 3), p.53-60.

• Reported rates of test use increased with increasing education level and household income,• 39.2% of respondents with less than a high school education were
screened for CRC compared to 72% of respondents with a college degree.
• 47.7% of respondents with an average annual income less than $15,000 reported being screened for CRC compared to 73.4% of respondents with an income of $75,000 or more.
CDC Health Disparities and Inequalities Report — United States, 2013. (2013). Morbidity and Mortality Weekly Report (MMWR) Supplements, 62(Supplement No. 3), p.53-60.

Colorectal Cancer Screening Rates of Adults Aged 50-75 Years by Average Annual Income in
2010
48%
56%
65%69%
73%
0%
10%
20%
30%
40%
50%
60%
70%
80%
90%
100%
< $15,000 $15,000 - $34,999 $35,000 -$49,999 $50,000- $74,999 >75,000
CDC Health Disparities and Inequalities Report — United States, 2013. (2013). Morbidity and Mortality Weekly Report (MMWR) Supplements, 62(Supplement No. 3), p.53-60.
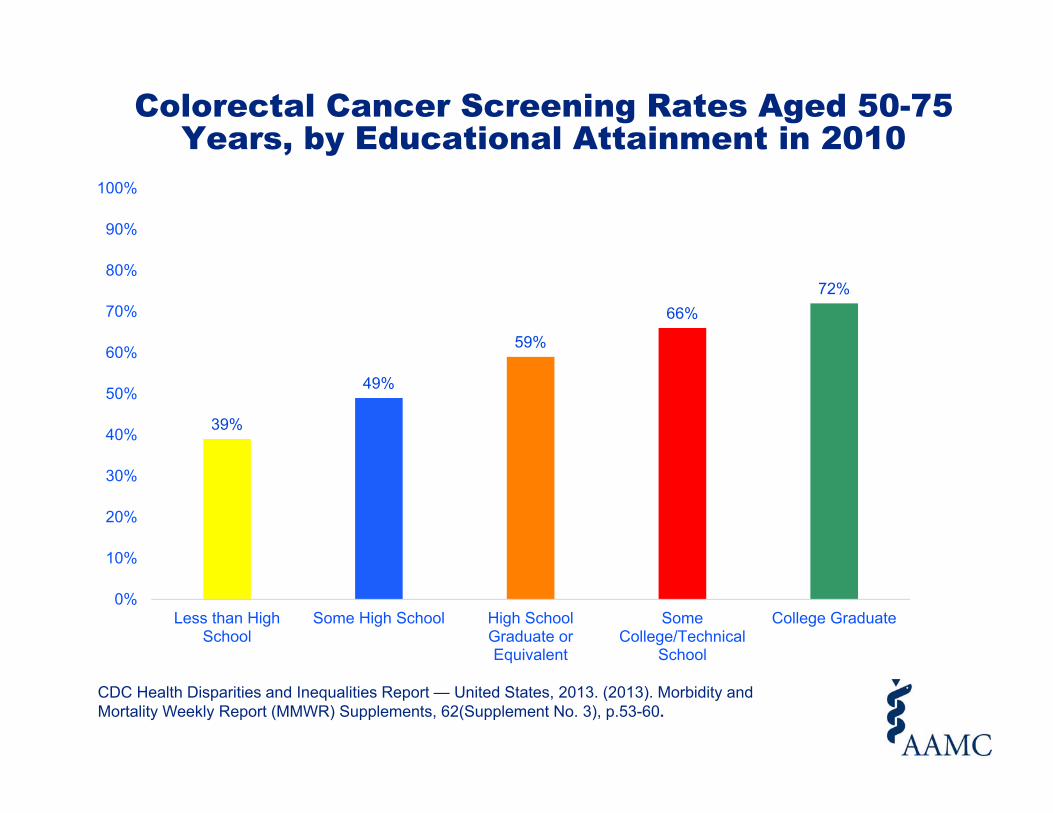
Colorectal Cancer Screening Rates Aged 50-75 Years, by Educational Attainment in 2010
39%
49%
59%
66%72%
0%
10%
20%
30%
40%
50%
60%
70%
80%
90%
100%
Less than HighSchool
Some High School High SchoolGraduate orEquivalent
SomeCollege/Technical
School
College Graduate
CDC Health Disparities and Inequalities Report — United States, 2013. (2013). Morbidity and Mortality Weekly Report (MMWR) Supplements, 62(Supplement No. 3), p.53-60.

Prevalence of Hypertension and
Controlled Hypertension — United
States, 2007–2010 Cathleen D. Gillespie, MS1
Kimberly A. Hurvitz, MHS2
1National Center for Chronic Disease Prevention and Health Promotion, CDC
2National Center for Health Statistics, CDC
Prevalence of Hypertension and Controlled Hypertension — United States, 2007–2010
CDC Health Disparities and Inequalities Report — United States, 2013. (2013). Morbidity and Mortality Weekly Report (MMWR) Supplements, 62(Supplement No. 3), p.144-148.
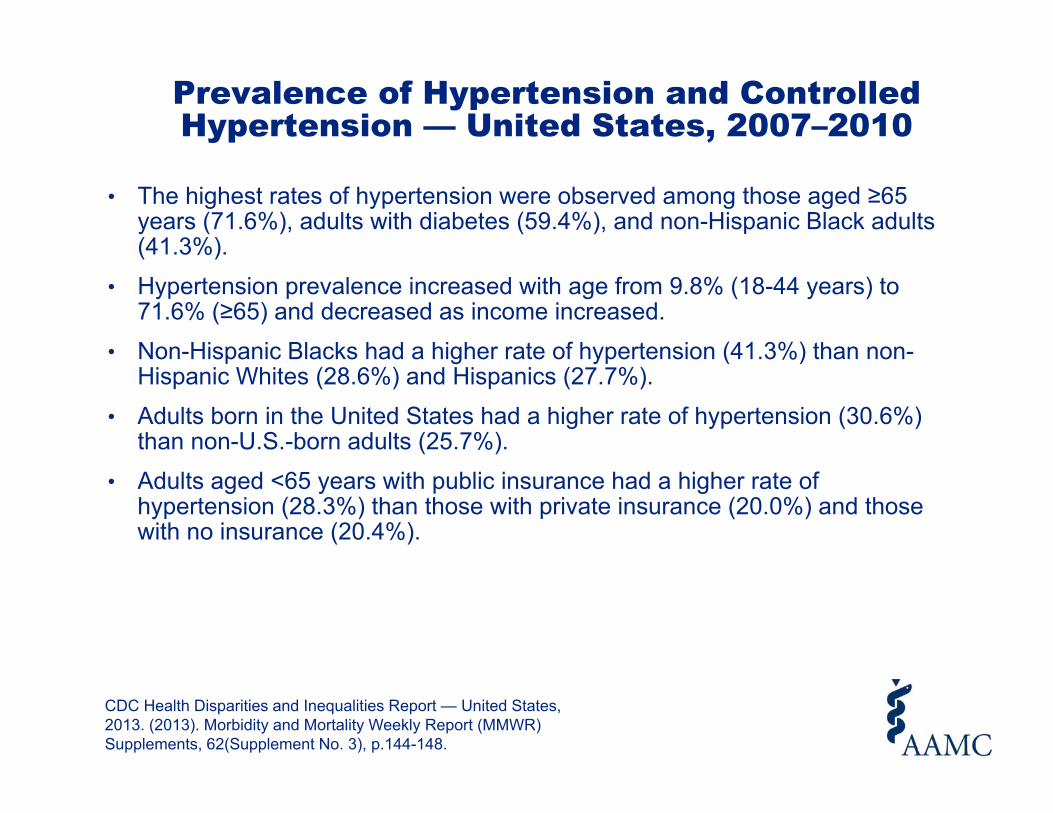
• The highest rates of hypertension were observed among those aged ≥65 years (71.6%), adults with diabetes (59.4%), and non-Hispanic Black adults (41.3%).
• Hypertension prevalence increased with age from 9.8% (18-44 years) to 71.6% (≥65) and decreased as income increased.
• Non-Hispanic Blacks had a higher rate of hypertension (41.3%) than non-Hispanic Whites (28.6%) and Hispanics (27.7%).
• Adults born in the United States had a higher rate of hypertension (30.6%) than non-U.S.-born adults (25.7%).
• Adults aged <65 years with public insurance had a higher rate of hypertension (28.3%) than those with private insurance (20.0%) and those with no insurance (20.4%).

Prevalence of Hypertension and Controlled Hypertension — United States, 2007–2010
• Persons with diabetes had a significantly higher rate of hypertension than those without diabetes (59.4% versus 27.7%),
• Those who were obese had a higher rate of hypertension compared with those who were not (40.5% versus 25.0%)
• Persons with a disability had a significantly higher rate of hypertension compared with those with no disability (40.2% versus 29.0%).
• Differences in the prevalence of blood pressure control were observed among all population groups except veteran status.
• Non-Hispanic blacks (42.5%), Hispanics (34.4%), and Mexican Americans (30.3%) had lower prevalence of blood pressure control compared with non-Hispanic Whites (52.6%).
• Persons with disabilities (59.3%), veterans (52.5%), and females (55.5%) had higher rates of blood pressure control than their counterparts.
CDC Health Disparities and Inequalities Report — United States, 2013. (2013). Morbidity and Mortality Weekly Report (MMWR) Supplements, 62(Supplement No. 3), p.144-148.

Prevalence of Hypertension and Blood Pressure Control Among Adults > 18 Years, by Country of
Birth (2007-2010)
31%
49%
26%
39%
0%
10%
20%
30%
40%
50%
60%
70%
80%
90%
100%
Hypertension Blood Pressure Control
United StatesOutside of the United States
CDC Health Disparities and Inequalities Report — United States, 2013. (2013). Morbidity and Mortality Weekly Report (MMWR) Supplements, 62(Supplement No. 3), p.144-148.

Prevalence of Hypertension and Blood Pressure Control Among Adults > 18 Years, by Health
Insurance Status (2007-2010)
20%
51%
28%
60%
20%
28%
0%
10%
20%
30%
40%
50%
60%
70%
80%
90%
100%
Hypertension Blood Pressure Control
PrivatePublicUninsured
CDC Health Disparities and Inequalities Report — United States, 2013. (2013). Morbidity and Mortality Weekly Report (MMWR) Supplements, 62(Supplement No. 3), p.144-148.
Expected Years of Life Free of Chronic Condition–Induced
Activity Limitations — United States, 1999–2008
Michael T. Molla, PhD National Center for Health Statistics, CDC
Expected Years of Life Free of Chronic Condition–Induced Activity
Limitations — United States, 1999–2008
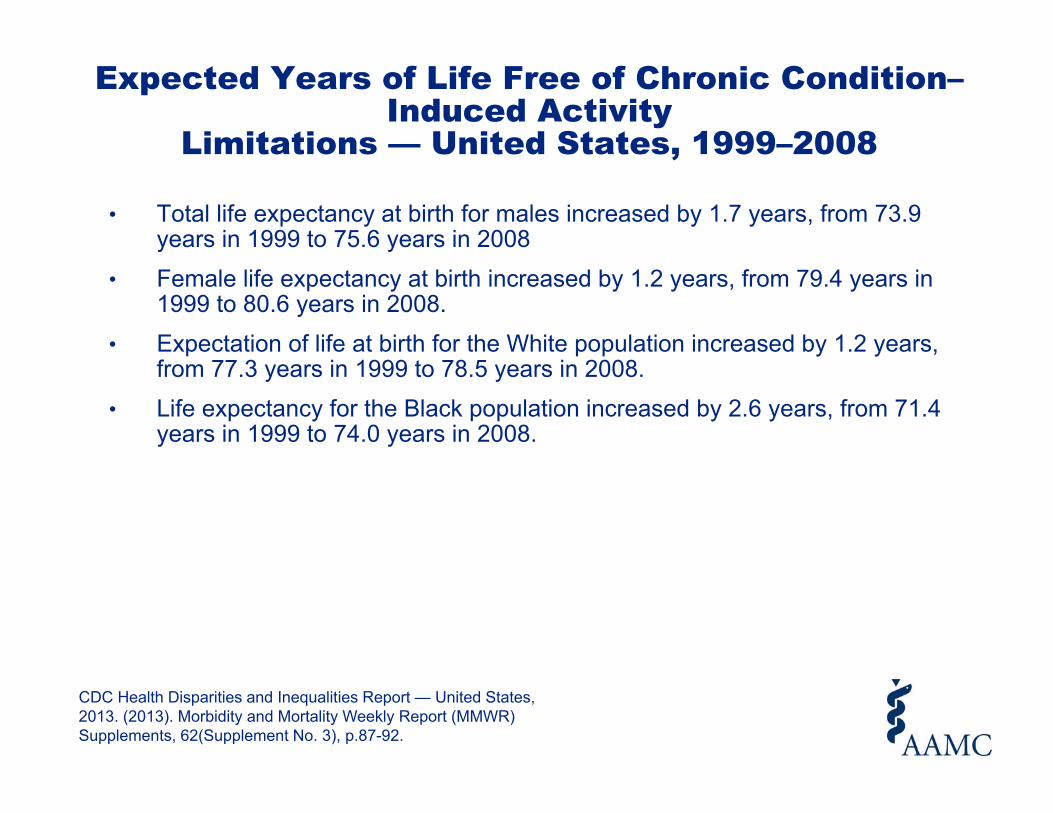
• Total life expectancy at birth for males increased by 1.7 years, from 73.9 years in 1999 to 75.6 years in 2008
• Female life expectancy at birth increased by 1.2 years, from 79.4 years in 1999 to 80.6 years in 2008.
• Expectation of life at birth for the White population increased by 1.2 years, from 77.3 years in 1999 to 78.5 years in 2008.
• Life expectancy for the Black population increased by 2.6 years, from 71.4 years in 1999 to 74.0 years in 2008.
CDC Health Disparities and Inequalities Report — United States, 2013. (2013). Morbidity and Mortality Weekly Report (MMWR) Supplements, 62(Supplement No. 3), p.87-92.

Life Expectancy at Birth by Sex from 1999-2008
73.9
75.6
79.4
80.6
70
72
74
76
78
80
82
1999 2000 2001 2002 2003 2004 2005 2006 2007 2008
MaleFemale
CDC Health Disparities and Inequalities Report — United States, 2013. (2013). Morbidity and Mortality Weekly Report (MMWR) Supplements, 62(Supplement No. 3), p.87-92.

Life Expectancy at Birth by Race from 1999-2008
77.3
78.5
71.4
74
66
68
70
72
74
76
78
80
1999 2000 2001 2002 2003 2004 2005 2006 2007 2008
Age
in y
ears
WhiteBlack
CDC Health Disparities and Inequalities Report — United States, 2013. (2013). Morbidity and Mortality Weekly Report (MMWR) Supplements, 62(Supplement No. 3), p.87-92.

Diabetes — United States, 2006 and
2010 Gloria L. Beckles, MD Chiu-Fang Chou, DrPH
Division of Diabetes Translation, National Center for Chronic Disease Prevention and Health
Promotion
Diabetes — United States, 2006 and 2010
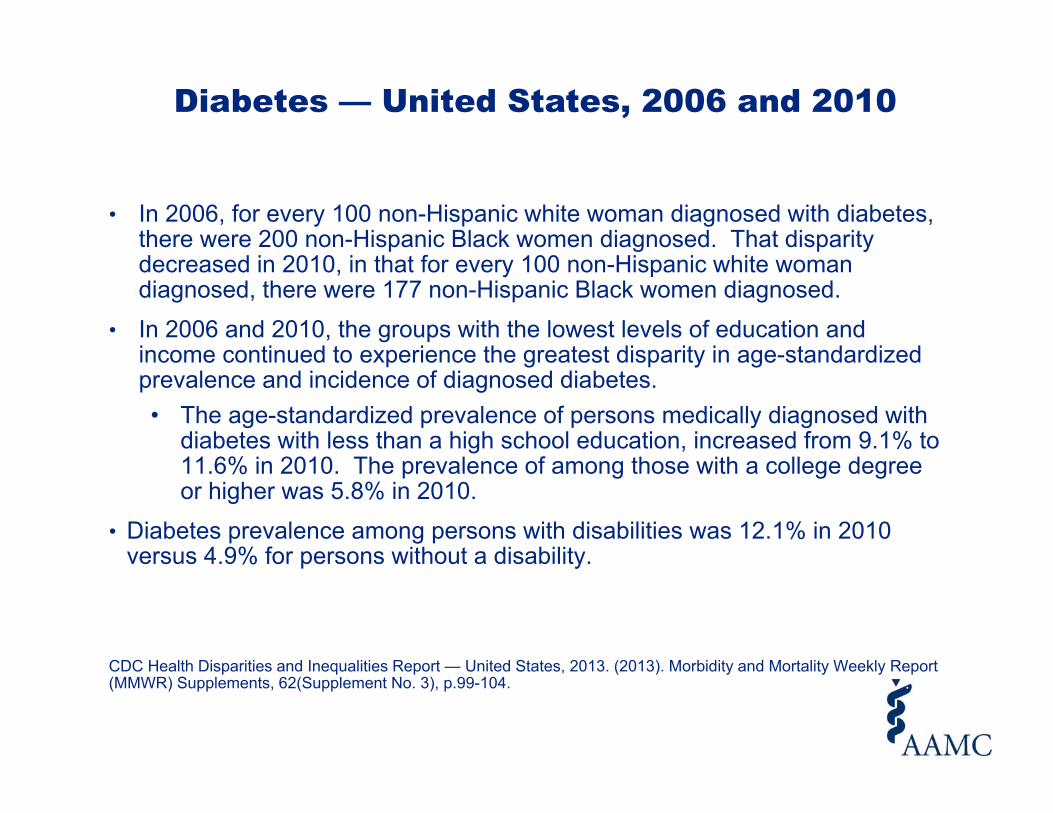
• In 2006, for every 100 non-Hispanic white woman diagnosed with diabetes, there were 200 non-Hispanic Black women diagnosed. That disparity decreased in 2010, in that for every 100 non-Hispanic white woman diagnosed, there were 177 non-Hispanic Black women diagnosed.
• In 2006 and 2010, the groups with the lowest levels of education and income continued to experience the greatest disparity in age-standardized prevalence and incidence of diagnosed diabetes. • The age-standardized prevalence of persons medically diagnosed with
diabetes with less than a high school education, increased from 9.1% to 11.6% in 2010. The prevalence of among those with a college degree or higher was 5.8% in 2010.
• Diabetes prevalence among persons with disabilities was 12.1% in 2010 versus 4.9% for persons without a disability.
CDC Health Disparities and Inequalities Report — United States, 2013. (2013). Morbidity and Mortality Weekly Report (MMWR) Supplements, 62(Supplement No. 3), p.99-104.

Age-Standardized Prevalence of Medically Diagnosed Diabetes among Adults, by
Race/Ethnicity, 2010
7%11%
8%
14% 12%
0%
10%
20%
30%
40%
50%
60%
70%
80%
90%
100%
White, non-Hispanic Black, non-Hispanic Asian Mixed race/ Other Hispanic
CDC Health Disparities and Inequalities Report — United States, 2013. (2013). Morbidity and Mortality Weekly Report (MMWR) Supplements, 62(Supplement No. 3), p.99-104.

Age-Standardized Prevalence of Medically Diagnosed Diabetes among Adults, by Disability
Status, 2006 and 2010
11% 12%
4% 5%
0%
10%
20%
30%
40%
50%
60%
70%
80%
90%
100%
2006 2010
With a DisablityWithout a Disablity
CDC Health Disparities and Inequalities Report — United States, 2013. (2013). Morbidity and Mortality Weekly Report (MMWR) Supplements, 62(Supplement No. 3), p.99-104.

Age-Standardized Prevalence of Medically Diagnosed Diabetes among Adults, by Educational
Attainment, 2010
12%9% 9%
6%
0%
10%
20%
30%
40%
50%
60%
70%
80%
90%
100%
Less than High School High School or Equivalent Some College Degree College Degree or Higher
CDC Health Disparities and Inequalities Report — United States, 2013. (2013). Morbidity and Mortality Weekly Report (MMWR) Supplements, 62(Supplement No. 3), p.99-104.

Education and Income —United States, 2009 and
2011 Gloria L. Beckles, MD1
Benedict I. Truman, MD2
1National Center for Chronic Disease Prevention and Health Promotion, CDC
2National Center for HIV/AIDS, Viral Hepatitis, STD, and TB Prevention, CDC

Education and Income — United States, 2009 and 2011
• Racial/ethnic, socioeconomic, and geographic disparities in non-completion of high school and poverty persist in the U.S. adult population• Very little evidence of improvement from 2009 to 2011.
• In 2011, among adults aged 25 years and older, 33.7 % of all foreign born adults did not complete high school vs. 8.7% of U.S.-born adults
• In 2011, disparities in poverty increased with decreasing level of educational attainment.
• 16.6% of adults classified as poor based on the U.S. Census Bureau poverty thresholds did not complete high school compared with 10.3% of those in the high income group.
• In the 2011, the non-completion rate of high school among adults > 25 was the highest among Hispanics (37.7%) compared with 11.3% of those belonging to multiple races, 18.8% of American Indians/Alaskan Natives, 12.1% of Asian/Pacific Islanders, 16.1% of non-Hispanic Blacks, and 7.3% of non-Hispanic whites.
CDC Health Disparities and Inequalities Report — United States, 2013. (2013). Morbidity and Mortality Weekly Report (MMWR) Supplements, 62(Supplement No. 3), p.9-19.

High School Non-completion Rates of Adults aged > 25 years by Race, 2009 and 2011
8%
17%13%
20%13%
40%
7%
16%12%
19%
11%
38%
0%
10%
20%
30%
40%
50%
60%
70%
80%
90%
100%
White, nonHispanic
Black, nonHispanic
Asian/PacificIslander
AmericanIndian/Alaskan
Native
Multiple Races Hispanic
2009
2011
CDC Health Disparities and Inequalities Report — United States, 2013. (2013). Morbidity and Mortality Weekly Report (MMWR) Supplements, 62(Supplement No. 3), p.9-19.

Health-Related Quality of Life — United
States, 2006 and 2010 Matthew M. Zack, MD
Division of Population Health, National Center for Chronic Disease Prevention and Health Promotion,
CDC
• In 2010,16.8% of women reported fair or poor health compared with 15.4% of men.
• In 2010, a significantly lower percentage of non- Hispanic Whites (13.3%) rated their health as fair or poor than did all other racial/ethnic groups (Black, non-Hispanic 23.3%, Hispanic 28.1%, American Indian/Alaskan Native 30.8%) except Asian/Pacific Islanders (11.9%).
• Non-Hispanic Blacks reporting fair or poor health increased from 21.3% in 2006 to 23.3% in 2008. While Hispanics reporting fair or poor health decreased from 31.1% to 28.1%.
• In 2010 38.4% of those with less than a high school education reported fair or poor health, compared with 7.3% of college graduates.
• In 2010, 39.4% of persons with a disability reported fair or poor health compared with 8.6% of persons without a disability.
Health-Related Quality of Life — United States, 2006 and 2010
CDC Health Disparities and Inequalities Report — United States, 2013. (2013). Morbidity and Mortality Weekly Report (MMWR) Supplements, 62(Supplement No. 3), p.105-111.

Estimated Percentage of Adults >18 Years Reporting Fair or Poor Health, by Educational Attainment
(2010)
38%
20%16%
7%
0%
10%
20%
30%
40%
50%
60%
70%
80%
90%
100%
Less than High School High School Graduate orEquivalent
Some College/TechnicalSchool
College Graduate
CDC Health Disparities and Inequalities Report — United States, 2013. (2013). Morbidity and Mortality Weekly Report (MMWR) Supplements, 62(Supplement No. 3), p.105-111.

Estimated Percentage of Adults >18 Years Reporting Fair or Poor Health, by Disability Status
(2006 and 2010)
39% 39%
9% 9%
0%
10%
20%
30%
40%
50%
60%
70%
80%
90%
100%
2006 2010
With Disability
Without Disability
CDC Health Disparities and Inequalities Report — United States, 2013. (2013). Morbidity and Mortality Weekly Report (MMWR) Supplements, 62(Supplement No. 3), p.105-110.

Obesity — United States, 1999–2010
Ashleigh L. May, PhD David Freedman, PhD Bettylou Sherry, PhD Heidi M. Blanck, PhD
Division of Nutrition, Physical Activity, and Obesity, National Center for Chronic Disease Prevention and
Health Promotion, CDC
Obesity — United States, 1999–2010
CDC Health Disparities and Inequalities Report — United States, 2013. (2013). Morbidity and Mortality Weekly Report (MMWR) Supplements, 62(Supplement No. 3), p.120-128.
• Between 1999–2002 and 2007–2010, the age-adjusted prevalence of obesity among adults aged ≥18 years increased from 26.5% to 33.0% among men and from 32.4% to 34.9% among women.
• Among men, there was little difference in the prevalence of obesity by race/ethnicity
• Among women, the overall (1999–2010) prevalence among non-Hispanic Blacks (51%) was 10 percentage points higher than that among Mexican-Americans (41%) and 20 percentage points higher than non-Hispanic White women (31%).
• For men, the prevalence was lowest (25%) among college graduates but highest (35%) among those who had completed some college.
• Among women, the overall prevalence of obesity among those who had completed college (24%), was 13–16 percentage points lower than in other groups.

Obesity among Adults ≥23 years, by Sex, Race/Ethnicity, and Educational Attainment (1999-2010)
CDC Health Disparities and Inequalities Report — United States, 2013. (2013). Morbidity and Mortality Weekly Report (MMWR) Supplements, 62(Supplement No. 3), p.120-128.
Access to Healthier Food Retailers — United States, 2011
Kirsten A. Grimm, MPH Latetia V. Moore, PhD Kelley S. Scanlon, PhD
National Center for Chronic Disease Prevention and Health Promotion, CDC

Access to Healthier Food Retailers — United States, 2011
• 51.5% of persons in rural census tracts lacked access to a healthier food retailer compared with 20.6% of persons residing in urban tracts.
• Census tracts where seniors comprised more than 13.6% of the population were 1.3 times as likely not to have a healthier food retailer than tracts with a lower proportion of seniors, a pattern that was similar across regions.
• Nationwide, persons in tracts with an average annual income of less than 27,269 dollars were approximately 1.2 times as likely to lack access to a healthier food retailer than people in tracts with higher income.
• In census tracts where < 27% of the population had a college education, people were significantly more likely to lack access to healthier food retailers (33.3%) than were individuals in a tract with a higher percentage of college educated persons (25.8%).
CDC Health Disparities and Inequalities Report — United States, 2013. (2013). Morbidity and Mortality Weekly Report (MMWR) Supplements, 62(Supplement No. 3), pp.20-26.

Percentage of Census tracts without at least one healthier food retailer within the tract or within ½
mile of the tract
27%
37%32%
24%
0%
10%
20%
30%
40%
50%
60%
70%
80%
90%
100%
Northeast Midwest South West
CDC Health Disparities and Inequalities Report — United States, 2013. (2013). Morbidity and Mortality Weekly Report (MMWR) Supplements, 62(Supplement No. 3), p.20-26.

Urban versus Rural Differences in Lack of Access to Healthy Food Retailers, by Region.
52% 53% 51% 50%
20%
27%
20%16%
0%
10%
20%
30%
40%
50%
60%
70%
80%
90%
100%
Northeast Midwest South West
Rural
Urban
CDC Health Disparities and Inequalities Report — United States, 2013. (2013). Morbidity and Mortality Weekly Report (MMWR) Supplements, 62(Supplement No. 3), p.20-26.
HIV Infection —United States, 2008
and 2010 Anna Satcher Johnson, MPH
Linda Beer, PhD Catlainn Sionean, PhD
Xiaohong Hu, MS Carolyn Furlow-Parmley, PhD
Binh Le, MD Jacek Skarbinski, MD
H. Irene Hall, PhD Hazel D. Dean, ScD
National Center for HIV/AIDS, Viral Hepatitis, STD, and TB Prevention, CDC

HIV Infection — United States, 2008 and 2010
• During 2010, the rate of Blacks/African Americans were diagnosed with HIV infections at the rate of 84 per 100,000, compared with 13.5 per 100,000 of American Indians/Alaskan Natives, 8.4 per 100,000 of Asians, 30.9 per 100,000 of Hispanics, 27.0 per 100,000 of Native Hawaiians/Pacific Islanders, and 9.1 per 100,000 of whites.
• The rate of HIV infection diagnoses for Black/African American males in 2010 was 128.4 per 100,000 population compared with 16.5 White males per 100,000.
• The rate of HIV infection diagnoses for Black/African American females in 2010 was 45.3 per 100,00 population compared with 2.2 White females per 100,000.
• Persons 55 years of age and above had the lowest HIV infection diagnosis rate of 5.8 per 100,000, compared with 32.3 per 100,000 of persons in the 25-39 year old age group.
CDC Health Disparities and Inequalities Report — United States, 2013. (2013). Morbidity and Mortality Weekly Report (MMWR) Supplements, 62(Supplement No. 3), p.112-119.

Estimated Rate* of HIV Infection Diagnoses among Adults ≥18 years, by Sex and
Race/Ethnicity, 2010
2015
128
50 49
16
47
73
45
105 2
11
0
20
40
60
80
100
120
140
AmericanIndian/ Alaskan
Native
Asian Black/AfricanAmerican
Hispanic/Latino NativeHawaiian/OtherPacific Islander
White Multiple Races
Rat
e pe
r 100
,000
pop
ulat
ion
Male Female
*Per 100,000 population
CDC Health Disparities and Inequalities Report — United States, 2013. (2013). Morbidity and Mortality Weekly Report (MMWR) Supplements, 62(Supplement No. 3), p.112-119.

Health Disparities Contact InformationFor more information regarding health disparities, please contact Karey Sutton:
Karey Sutton, Ph.D.Lead SpecialistHealth Equity Research and PolicyScientific AffairsAssociation of American Medical [email protected]
44

DDS Contact InformationFor more information regarding the Diversity Data Slides (DDS), please contact:
Sarah Conrad, M.S.Senior Research AnalystDiversity Policy and ProgramsAssociation of American Medical CollegesPh: [email protected]
45

©


