Page 1
CALGARY REGIONALHOUSING MARKET STATISTICS
C R E B ® C a l g a r y R e g i o n a l H o u s i n g M a r k e t S t a t i s t i c s
Page 1
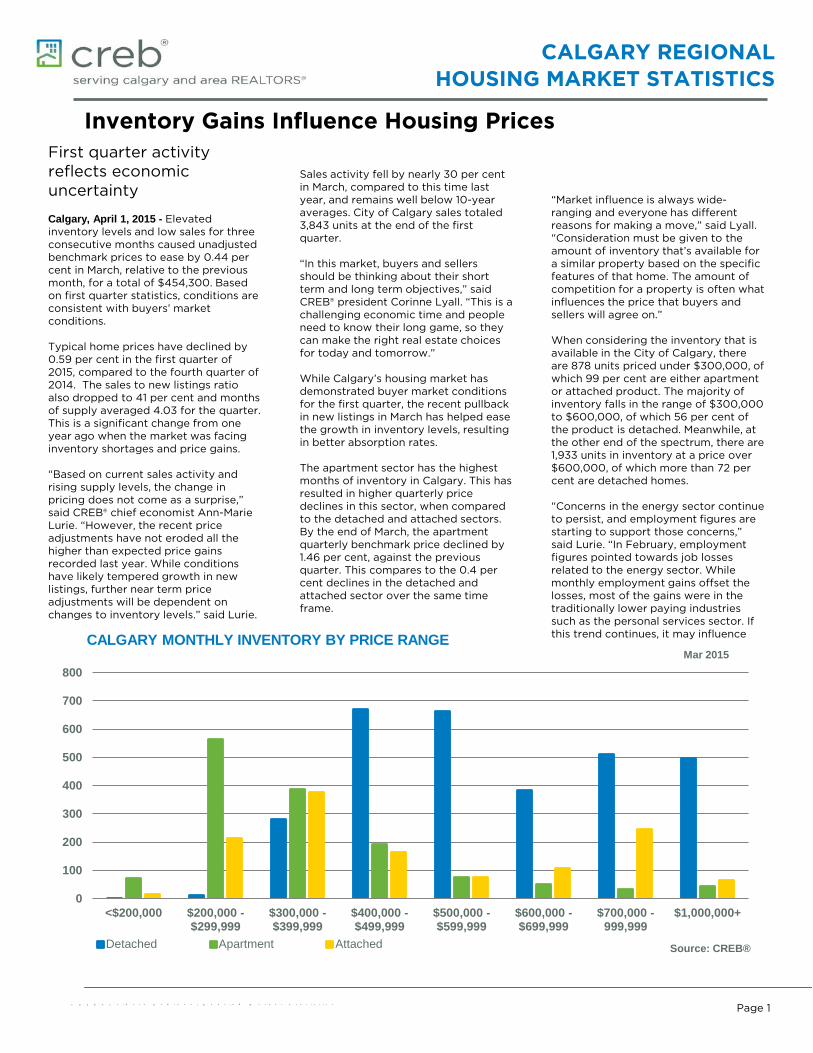
CALGARY MONTHLY INVENTORY BY PRICE RANGE
First quarter activity reflects economic uncertainty Calgary, April 1, 2015 - Elevated inventory levels and low sales for three consecutive months caused unadjusted benchmark prices to ease by 0.44 per cent in March, relative to the previous month, for a total of $454,300. Based on first quarter statistics, conditions are consistent with buyers’ market conditions. Typical home prices have declined by 0.59 per cent in the first quarter of 2015, compared to the fourth quarter of 2014. The sales to new listings ratio also dropped to 41 per cent and months of supply averaged 4.03 for the quarter. This is a significant change from one year ago when the market was facing inventory shortages and price gains. “Based on current sales activity and rising supply levels, the change in pricing does not come as a surprise,” said CREB® chief economist Ann-Marie Lurie. “However, the recent price adjustments have not eroded all the higher than expected price gains recorded last year. While conditions have likely tempered growth in new listings, further near term price adjustments will be dependent on changes to inventory levels.” said Lurie.
Sales activity fell by nearly 30 per cent in March, compared to this time last year, and remains well below 10-year averages. City of Calgary sales totaled 3,843 units at the end of the first quarter. “In this market, buyers and sellers should be thinking about their short term and long term objectives,” said CREB® president Corinne Lyall. “This is a challenging economic time and people need to know their long game, so they can make the right real estate choices for today and tomorrow.” While Calgary’s housing market has demonstrated buyer market conditions for the first quarter, the recent pullback in new listings in March has helped ease the growth in inventory levels, resulting in better absorption rates. The apartment sector has the highest months of inventory in Calgary. This has resulted in higher quarterly price declines in this sector, when compared to the detached and attached sectors. By the end of March, the apartment quarterly benchmark price declined by 1.46 per cent, against the previous quarter. This compares to the 0.4 per cent declines in the detached and attached sector over the same time frame.
“Market influence is always wide-ranging and everyone has different reasons for making a move,” said Lyall. “Consideration must be given to the amount of inventory that’s available for a similar property based on the specific features of that home. The amount of competition for a property is often what influences the price that buyers and sellers will agree on.” When considering the inventory that is available in the City of Calgary, there are 878 units priced under $300,000, of which 99 per cent are either apartment or attached product. The majority of inventory falls in the range of $300,000 to $600,000, of which 56 per cent of the product is detached. Meanwhile, at the other end of the spectrum, there are 1,933 units in inventory at a price over $600,000, of which more than 72 per cent are detached homes. “Concerns in the energy sector continue to persist, and employment figures are starting to support those concerns,” said Lurie. “In February, employment figures pointed towards job losses related to the energy sector. While monthly employment gains offset the losses, most of the gains were in the traditionally lower paying industries such as the personal services sector. If this trend continues, it may influence
Inventory Gains Influence Housing Prices
0
100
200
300
400
500
600
700
800
<$200,000 $200,000 -$299,999
$300,000 -$399,999
$400,000 -$499,999
$500,000 -$599,999
$600,000 -$699,999
$700,000 -999,999
$1,000,000+
Mar 2015
Detached Apartment Attached Source: CREB®
Page 2
Summary Stats Economic RegionTotal Residential
C R E B ® C a l g a r y R e g i o n a l H o u s i n g M a r k e t S t a t i s t i c s
Page 2
Mar-14 Mar-15 Y/Y % Change
2014 YTD 2015 YTD Y/Y % Change
CITY OF CALGARYm_CYTDTotal Sales 2,481 1,747 -29.58% 5,770 3,843 -33.40%m_CYTDTotal Sales Volume $1,202,978,758 $830,321,615 -30.98% $2,762,820,276 $1,798,046,150 -34.92%m_CYTDNew Listings 3,319 3,136 -5.51% 8,426 9,366 11.16%m_Cm_CInventory 3,067 5,693 85.62% 2,653 5,159 94.47%YTDYTDMonths of Supply 1.24 3.26 163.61% 1.38 4.03 191.98%
Sales to New Listings Ratio 0.75 0.56 -25.48% 0.68 0.41 -40.08%m_cYTDSales to List Price Ratio 98.66% 97.16% -1.52% 98.49% 97.37% -1.14%m_cYTDDays on Market 28 39 37.70% 32 38 18.75%m_cYTDBenchmark Price $437,600 $454,300 3.82% $431,767 $456,567 5.74%m_cYTDMedian Price $430,000 $420,000 -2.33% $425,000 $420,000 -1.18%m_cYTDAverage Price $484,877 $475,284 -1.98% $478,825 $467,876 -2.29%m_cYTDIndex 204 212 3.82% 201 213 5.74%
SURROUNDING AREAm_SYTDTotal Sales 536 410 -23.51% 1,179 903 -23.41%m_SYTDTotal Sales Volume $256,196,252 $185,240,079 -27.70% $552,955,388 $422,983,261 -23.50%m_SYTDNew Listings 820 844 2.93% 2,119 2,364 11.56%m_Sm_SInventory 1,455 1,953 34.23% 1,325 1,711 29.07%YTDYTDMonths of Supply 2.71 4.76 75.48% 3.37 5.68 68.53%
Sales to New Listings Ratio 0.65 0.49 -25.68% 0.56 0.38 -31.35%m_SYTDSales to List Price Ratio 97.73% 96.94% -0.80% 97.50% 96.83% -0.69%m_SYTDDays on Market 47 56 17.54% 56 58 3.57%m_SYTDBenchmark Price $405,300 $436,400 7.67% $399,133 $432,700 8.41%m_SYTDMedian Price $406,750 $400,000 -1.66% $400,000 $400,000 0.00%m_SYTDAverage Price $477,978 $451,805 -5.48% $469,004 $468,420 -0.12%m_SYTDIndex 179 193 7.66% 176 191 8.41%
CREB® ECONOMIC REGIONm_CYTDTotal Sales 3,017 2,157 -28.51% 6,949 4,746 -31.70%m_CYTDTotal Sales Volume $1,459,175,010 $1,015,561,694 -30.40% $3,315,775,664 $2,221,029,411 -33.02%m_CYTDNew Listings 4,139 3,980 -3.84% 10,545 11,730 11.24%m_Cm_CInventory 4,522 7,646 69.08% 3,978 6,869 72.68%YTDYTDMonths of Supply 1.50 3.54 136.50% 1.72 4.34 152.84%
Sales to New Listings Ratio 0.73 0.54 -25.65% 0.66 0.40 -38.60%m_ YTDSales to List Price Ratio 98.50% 97.12% -1.39% 98.33% 97.27% -1.08%m_ YTDDays on Market 31 42 32.98% 37 44 18.92%m_ YTDBenchmark Price $432,700 $450,600 4.14% $426,900 $452,233 5.93%m_ YTDMedian Price $427,000 $417,000 -2.34% $421,000 $417,250 -0.89%m_ YTDAverage Price $483,651 $470,821 -2.65% $477,159 $467,979 -1.92%m_ YTDIndex 201 209 4.13% 198 210 5.93%
For a list of definitions, see page 20.
Page 3
Summary Stats City of Calgary
C R E B ® C a l g a r y R e g i o n a l H o u s i n g M a r k e t S t a t i s t i c s
Page 3
Mar-14 Mar-15 Y/Y % Change 2014 YTD 2015 YTD Y/Y %
ChangeDETACHED
m_CYTDTotal Sales 1,506 1,061 -29.55% 3,443 2,335 -32.18%m_CYTDTotal Sales Volume $840,311,974 $580,635,404 -30.90% $1,890,407,785 $1,251,170,539 -33.81%m_CYTDNew Listings 1,963 1,776 -9.53% 4,918 5,284 7.44%m_Cm_CInventory 1,689 3,016 78.57% 1,475 2,741 85.77%YTDYTDMonths of Supply 1.12 2.84 153.46% 1.29 3.52 173.92%
Sales to New Listings Ratio 0.77 0.60 -22.13% 0.70 0.44 -36.88%m_cYTDSales to List Price Ratio 98.71% 97.12% -1.61% 98.52% 97.37% -1.17%m_cYTDDays on Market 26 37 39.53% 30 36 20.00%m_cYTDBenchmark Price $494,500 $513,800 3.90% $487,200 $516,133 5.94%m_cYTDMedian Price $492,750 $476,800 -3.24% $479,900 $475,000 -1.02%m_cYTDAverage Price $557,976 $547,253 -1.92% $549,058 $535,833 -2.41%m_cYTDIndex 205 213 3.90% 202 214 5.94%
ATTACHEDm_CYTDTotal Sales 523 387 -26.00% 1,252 839 -32.99%m_CYTDTotal Sales Volume $222,192,024 $157,958,624 -28.91% $531,276,658 $341,274,771 -35.76%m_CYTDNew Listings 685 689 0.58% 1,768 2,073 17.25%m_Cm_CInventory 599 1,258 110.02% 518 1,129 117.88%YTDYTDMonths of Supply 1.15 3.25 183.82% 1.24 4.04 225.13%
Sales to New Listings Ratio 0.76 0.56 -26.43% 0.71 0.40 -42.85%m_cYTDSales to List Price Ratio 98.70% 97.45% -1.27% 98.69% 97.63% -1.07%m_cYTDDays on Market 30 39 32.86% 32 38 18.75%m_cYTDBenchmark Price $336,700 $354,800 5.38% $334,033 $355,133 6.32%m_cYTDMedian Price $347,000 $348,000 0.29% $350,000 $345,000 -1.43%m_cYTDAverage Price $424,841 $408,162 -3.93% $424,342 $406,764 -4.14%m_cYTDIndex 197 208 5.38% 196 208 6.32%
APARTMENTm_CYTDTotal Sales 452 299 -33.85% 1,075 669 -37.77%m_CYTDTotal Sales Volume $140,474,760 $91,727,587 -34.70% $341,135,833 $205,600,840 -39.73%m_CYTDNew Listings 671 671 0.00% 1,740 2,009 15.46%m_Cm_CInventory 779 1,419 82.16% 659 1,289 95.55%YTDYTDMonths of Supply 1.72 4.75 175.37% 1.84 5.78 214.22%
Sales to New Listings Ratio 0.67 0.45 -33.85% 0.62 0.33 -46.10%m_cYTDSales to List Price Ratio 98.31% 96.93% -1.41% 98.05% 96.96% -1.11%m_cYTDDays on Market 31 43 38.65% 35 45 28.57%m_cYTDBenchmark Price $287,600 $293,300 1.98% $284,033 $296,000 4.21%m_cYTDMedian Price $285,500 $272,000 -4.73% $284,000 $270,000 -4.93%m_cYTDAverage Price $310,785 $306,781 -1.29% $317,336 $307,326 -3.15%m_cYTDIndex 201 205 1.99% 198 207 4.22%
CITY OF CALGARYm_CYTDTotal Sales 2,481 1,747 -29.58% 5,770 3,843 -33.40%m_CYTDTotal Sales Volume $1,202,978,758 $830,321,615 -30.98% $2,762,820,276 $1,798,046,150 -34.92%m_CYTDNew Listings 3,319 3,136 -5.51% 8,426 9,366 11.16%m_Cm_CInventory 3,067 5,693 85.62% 2,653 5,159 94.47%YTDYTDMonths of Supply 1.24 3.26 163.61% 1.38 4.03 191.98%
Sales to New Listings Ratio 0.75 0.56 -25.48% 0.68 0.41 -40.08%m_cYTDSales to List Price Ratio 98.66% 97.16% -1.52% 98.49% 97.37% -1.14%m_cYTDDays on Market 28 39 37.70% 32 38 18.75%m_cYTDBenchmark Price $437,600 $454,300 3.82% $431,767 $456,567 5.74%m_cYTDMedian Price $430,000 $420,000 -2.33% $425,000 $420,000 -1.18%m_cYTDAverage Price $484,877 $475,284 -1.98% $478,825 $467,876 -2.29%m_cYTDIndex 204 212 3.82% 201 213 5.74%
For a list of definitions, see page 20.
Page 4
Summary Stats Census Metropolitan AreaTotal Residential
C R E B ® C a l g a r y R e g i o n a l H o u s i n g M a r k e t S t a t i s t i c s
Page 4
Mar-14 Mar-15 Y/Y % Change 2014 YTD 2015 YTD Y/Y %
ChangeCITY OF CALGARY
m_CYTDTotal Sales 2,481 1,747 -29.58% 5,770 3,843 -33.40%m_CYTDTotal Sales Volume $1,202,978,758 $830,321,615 -30.98% $2,762,820,276 $1,798,046,150 -34.92%m_CYTDNew Listings 3,319 3,136 -5.51% 8,426 9,366 11.16%m_Cm_CInventory 3,067 5,693 85.62% 2,653 5,159 94.47%YTDYTDMonths of Supply 1.24 3.26 163.61% 1.38 4.03 191.98%
Sales to New Listings Ratio 0.75 0.56 -25.48% 0.68 0.41 -40.08%m_cYTDSales to List Price Ratio 98.66% 97.16% -1.52% 98.49% 97.37% -1.14%m_cYTDDays on Market 28 39 37.70% 32 38 18.75%m_cYTDBenchmark Price $437,600 $454,300 3.82% $431,767 $456,567 5.74%m_cYTDMedian Price $430,000 $420,000 -2.33% $425,000 $420,000 -1.18%m_cYTDAverage Price $484,877 $475,284 -1.98% $478,825 $467,876 -2.29%m_cYTDIndex 204 212 3.82% 201 213 5.74%
AIRDRIEm_a YTDTotal Sales 162 136 -16.05% 336 300 -10.71%m_a YTDTotal Sales Volume $63,302,200 $51,462,830 -18.70% $130,140,292 $115,481,796 -11.26%m_a YTDNew Listings 200 194 -3.00% 474 649 36.92%m_a m_aInventory 151 360 138.41% 130 323 147.57%YTDYTDMonths of Supply 0.93 2.65 183.99% 1.16 3.23 177.28%
Sales to New Listings Ratio 0.81 0.70 -13.45% 0.71 0.46 -34.79%m_aYTDSales to List Price Ratio 98.83% 97.90% -0.95% 98.65% 98.21% -0.45%m_aYTDDays on Market 26 39 49.02% 32 39 21.88%m_aYTDBenchmark Price $350,900 $376,100 7.18% $346,600 $377,167 8.82%m_aYTDMedian Price $387,750 $384,000 -0.97% $385,000 $389,800 1.25%m_aYTDAverage Price $390,754 $378,403 -3.16% $387,322 $384,939 -0.62%m_aYTDIndex 185 199 7.18% 183 199 8.82%
ROCKYVIEWm_MYTDTotal Sales 198 118 -40.40% 437 275 -37.07%m_MYTDTotal Sales Volume $118,606,435 $71,428,899 -39.78% $254,073,955 $171,762,625 -32.40%m_MYTDNew Listings 327 316 -3.36% 861 861 0.00%m_Mm_MInventory 665 798 20.00% 621 712 14.65%YTDYTDMonths of Supply 3.36 6.76 101.36% 4.27 7.77 82.18%
Sales to New Listings Ratio 0.61 0.37 -38.33% 0.51 0.32 -37.07%m_ YTDSales to List Price Ratio 97.14% 96.06% -1.11% 96.84% 95.84% -1.03%m_ YTDDays on Market 55 60 9.61% 65 64 -1.54%m_ YTDBenchmark Price $521,000 $572,300 9.85% $513,600 $561,800 9.38%m_ YTDMedian Price $485,000 $487,250 0.46% $477,500 $487,500 2.09%m_ YTDAverage Price $599,022 $605,330 1.05% $581,405 $624,591 7.43%m_ YTDIndex 169 185 9.85% 166 182 9.39%
CALGARY CMAm_CYTDTotal Sales 2,679 1,865 -30.38% 6,207 4,118 -33.66%m_CYTDTotal Sales Volume $1,321,585,193 $901,750,514 -31.77% $3,016,894,231 $1,969,808,775 -34.71%m_CYTDNew Listings 3,646 3,452 -5.32% 9,287 10,227 10.12%m_Cm_CInventory 4,092 6,851 67.42% 3,634 6,231 71.46%YTDYTDMonths of Supply 1.53 3.67 140.50% 1.76 4.54 158.45%
Sales to New Listings Ratio 0.73 0.54 -26.47% 0.67 0.40 -39.75%m_ YTDSales to List Price Ratio 98.52% 97.08% -1.47% 98.35% 97.24% -1.13%m_ YTDDays on Market 30 40 33.15% 34 40 17.65%m_ YTDBenchmark Price $436,700 $454,900 4.17% $431,033 $456,767 5.97%m_ YTDMedian Price $435,600 $425,000 -2.43% $425,000 $420,000 -1.18%m_ YTDAverage Price $493,313 $483,512 -1.99% $486,047 $478,341 -1.59%m_ YTDIndex 202 210 4.16% 199 211 5.97%
For a list of definitions, see page 20.
Page 5
Summary Stats Surrounding AreaTotal Residential
C R E B ® C a l g a r y R e g i o n a l H o u s i n g M a r k e t S t a t i s t i c s
Page 5
Mar-14 Mar-15 Y/Y % Change 2014 YTD 2015 YTD Y/Y % Change
ROCKYVIEW REGIONm_mYTDTotal Sales 198 118 -40.40% 437 275 -37.07%m_mYTDTotal Sales Volume $118,606,435 $71,428,899 -39.78% $254,073,955 $171,762,625 -32.40%m_mYTDNew Listings 327 316 -3.36% 861 861 0.00%m_mm_mInventory 665 798 20.00% 621 712 14.65%YTDYTDMonths of Supply 3.36 6.76 101.36% 4.27 7.77 82.18%
Sales to New Listings Ratio 0.61 0.37 -38.33% 0.51 0.32 -37.07%m_ YTDSales to List Price Ratio 97.14% 96.06% -1.11% 96.84% 95.84% -1.03%m_ YTDDays on Market 55 60 9.61% 65 64 -1.54%m_ YTDBenchmark Price $521,000 $572,300 9.85% $513,600 $561,800 9.38%m_ YTDMedian Price $485,000 $487,250 0.46% $477,500 $487,500 2.09%m_ YTDAverage Price $599,022 $605,330 1.05% $581,405 $624,591 7.43%m_ YTDIndex 169 185 9.85% 166 182 9.39%
FOOTHILLS REGIONm_mYTDTotal Sales 112 109 -2.68% 271 232 -14.39%m_mYTDTotal Sales Volume $55,108,617 $48,374,730 -12.22% $129,143,791 $107,085,670 -17.08%m_mYTDNew Listings 200 236 18.00% 552 624 13.04%m_mm_mInventory 439 582 32.57% 393 497 26.27%YTDYTDMonths of Supply 3.92 5.34 36.22% 4.35 6.42 47.50%
Sales to New Listings Ratio 0.56 0.46 -17.52% 0.49 0.37 -24.27%m_ YTDSales to List Price Ratio 97.98% 97.09% -0.90% 97.78% 96.87% -0.93%m_ YTDDays on Market 47 66 41.30% 58 73 25.86%m_ YTDBenchmark Price $378,900 $404,300 6.70% $371,033 $397,433 7.12%m_ YTDMedian Price $412,000 $400,000 -2.91% $401,000 $385,000 -3.99%m_ YTDAverage Price $492,041 $443,805 -9.80% $476,545 $461,576 -3.14%m_ YTDIndex 176 188 6.70% 172 185 7.12%
AIRDRIEm_a YTDTotal Sales 162 136 -16.05% 336 300 -10.71%m_a YTDTotal Sales Volume $63,302,200 $51,462,830 -18.70% $130,140,292 $115,481,796 -11.26%m_a YTDNew Listings 200 194 -3.00% 474 649 36.92%m_a m_aInventory 151 360 138.41% 130 323 147.57%YTDYTDMonths of Supply 0.93 2.65 183.99% 1.16 3.23 177.28%
Sales to New Listings Ratio 0.81 0.70 -13.45% 0.71 0.46 -34.79%m_aYTDSales to List Price Ratio 98.83% 97.90% -0.95% 98.65% 98.21% -0.45%m_aYTDDays on Market 26 39 49.02% 32 39 21.88%m_aYTDBenchmark Price $350,900 $376,100 7.18% $346,600 $377,167 8.82%m_aYTDMedian Price $387,750 $384,000 -0.97% $385,000 $389,800 1.25%m_aYTDAverage Price $390,754 $378,403 -3.16% $387,322 $384,939 -0.62%m_aYTDIndex 185 199 7.18% 183 199 8.82%
OTHER ACTIVE AREASm_OYTDTotal Sales 64 47 -26.56% 135 96 -28.89%m_OYTDTotal Sales Volume $19,179,000 $13,973,620 -27.14% $39,597,350 $28,653,170 -27.64%m_OYTDNew Listings 93 98 5.38% 232 230 -0.86%m_Om_OInventory 200 213 6.50% 180 179 -0.74%YTDYTDMonths of Supply 3.13 4.53 45.02% 4.01 5.59 39.59%
Sales to New Listings Ratio 0.69 0.48 -30.31% 0.58 0.42 -28.27%m_OYTDSales to List Price Ratio 97.08% 97.51% 0.45% 97.12% 97.20% 0.08%m_OYTDDays on Market 79 68 -13.65% #N/A #N/A #N/Am_OYTDMedian Price $310,500 $286,000 -7.89% #N/A #N/A #N/Am_OYTDAverage Price $299,672 $297,311 -0.79% $293,314 $298,471 1.76%
SURROUNDING AREAm_SYTDTotal Sales 536 410 -23.51% 1,179 903 -23.41%m_SYTDTotal Sales Volume $256,196,252 $185,240,079 -27.70% $552,955,388 $422,983,261 -23.50%m_SYTDNew Listings 820 844 2.93% 2,119 2,364 11.56%m_Sm_SInventory 1,455 1,953 34.23% 1,325 1,711 29.07%YTDYTDMonths of Supply 2.71 4.76 75.48% 3.37 5.68 0.69
Sales to New Listings Ratio 0.65 0.49 -25.68% 0.56 0.38 -31.35%m_SYTDSales to List Price Ratio 97.73% 96.94% -0.80% 97.50% 96.83% -0.69%m_SYTDDays on Market 47 56 17.54% 56 58 3.57%m_SYTDBenchmark Price $405,300 $436,400 7.67% $399,133 $432,700 8.41%m_SYTDMedian Price $406,750 $400,000 -1.66% $400,000 $400,000 0.00%m_SYTDAverage Price $477,978 $451,805 -5.48% $469,004 $468,420 -0.12%m_SYTDIndex 179 193 7.66% 176 191 8.41%
For a list of definitions, see page 20.
Page 6
Price Comparisons
C R E B ® C a l g a r y R e g i o n a l H o u s i n g M a r k e t S t a t i s t i c s
Page 6
TYPICAL HOME ATTRIBUTES - DETACHED HOMES
City of Calgary
City of Airdrie
Rockyview Region
Foothills Region
Surrounding Area
Gross Living Area (Above Ground) 1296 1449 1743 1403 1426Lot Size 4868 4665 6061 5597 5481Above Ground Bedrooms 3 3 4 3 3Year Built 1991 2002 1999 1999 1999Covered Parking Spaces 2 2 2 2 2Full Bathrooms 2 2 2 2 2Half Bathrooms 1 1 1 1 1
-
100,000
200,000
300,000
400,000
500,000
600,000
700,000
Detached Attached Apartment Total Residential
BENCHMARK PRICE - MARCH
CREB® Economic Region City of Calgary CREB® Surrounding Area Airdrie Rockyview FoothillsSource: CREB®
0%2%4%6%8%
10%12%14%16%
Detached Attached Apartment Total Residential
YEAR OVER YEAR PRICE GROWTH COMPARISON - MARCH
CREB® Economic Region City of Calgary CREB® Surrounding Area Airdrie Rockyview FoothillsSource: CREB®
Page 7
Area Comparisons
C R E B ® C a l g a r y R e g i o n a l H o u s i n g M a r k e t S t a t i s t i c s
Page 7
-
1.0
2.0
3.0
4.0
5.0
6.0
7.0
8.0
Detached Attached Apartment
MONTHS OF SUPPLY - MARCH
CREB® Economic Region City of Calgary CREB® Surrounding Area Airdrie Rockyview Foothills Source: CREB®
63% 61% 71% 68% 74% 77%
22% 22% 22% 23% 20% 17%
15% 17% 7% 10% 6% 6%
0%
20%
40%
60%
80%
100%
120%
CREB® EconomicRegion
City of Calgary CREB®Surrounding Area
Airdrie Rockyview Foothills
SALES DISTRIBUTION - MARCH
Detached Attached Apartment Source: CREB®
0
200
400
600
800
1,000
1,200
1,400
<$200,000 $200,000 -$299,999
$300,000 -$399,999
$400,000 -$499,999
$500,000 -$599,999
$600,000 -$699,999
$700,000 -999,999
$1,000,000+
INVENTORY BY PRICE RANGE - MARCH
City of Calgary Airdrie Rockyview Foothills Other Active AreasSource: CREB®
Page 8
City of CalgaryTotal Residential
C R E B ® C a l g a r y R e g i o n a l H o u s i n g M a r k e t S t a t i s t i c s
Page 8
Jan. Feb. Mar. Apr. May Jun. Jul. Aug. Sept. Oct. Nov. Dec.2014 01/01/14 02/01/14 03/01/14 04/01/14 05/01/14 06/01/14 07/01/14 08/01/14 09/01/14 10/01/14 11/01/14 12/01/14
m_CM_RSales 1,439 1,850 2,481 2,540 2,945 2,665 2,330 2,263 2,146 2,145 1,779 1,082 m_CM_RNew Listings 2,396 2,711 3,319 3,755 4,328 3,818 3,220 3,148 3,259 2,919 2,093 1,380 m_Cm_CInventory 2,216 2,675 3,067 3,855 4,564 4,794 4,712 4,743 4,559 4,162 3,826 3,213 m_cm_Days on Market 40 30 28 27 27 29 33 35 36 37 38 43 m_cm_Benchmark Price 426,300 431,400 437,600 443,400 449,800 454,800 456,100 456,700 457,300 458,400 459,900 459,500 m_cm_Median Price 417,500 424,900 430,000 429,000 435,000 428,000 425,700 423,000 425,000 431,250 429,000 417,250 m_cm_Average Price 463,303 482,783 484,877 478,759 486,481 492,147 482,464 477,101 487,211 488,706 486,431 475,193 m_cm_Index 199 201 204 207 210 212 213 213 213 214 215 214
2015 01/01/15 02/01/15 03/01/15 04/01/15 05/01/15 06/01/15 07/01/15 08/01/15 09/01/15 10/01/15 11/01/15 12/01/15m_CM_RSales 879 1,217 1,747 m_CM_RNew Listings 3,285 2,945 3,136 m_Cm_CInventory 4,454 5,329 5,693 m_cm_Days on Market 41 35 39 m_cm_Benchmark Price 459,100 456,300 454,300 m_cm_Median Price 422,000 420,000 420,000 m_cm_Average Price 460,930 462,257 475,284 m_cm_Index 214 213 212
Mar-14 Mar-15 YTD2014 YTD2015CALGARY TOTAL SALES 03/01/14 03/01/15 03/01/14 03/01/15
m_Cytd_ >$100,000 1 - 1 - m_Cytd_ $100,000 - $199,999 46 43 123 99 m_Cytd_ $200,000 - $299,999 368 267 885 596 m_Cytd_ $300,000 -$ 349,999 309 199 733 432 m_Cytd_ $350,000 - $399,999 320 240 782 522 m_Cytd_ $400,000 - $449,999 320 254 724 559 m_Cytd_ $450,000 - $499,999 250 183 587 417 m_Cytd_ $500,000 - $549,999 200 137 483 313 m_Cytd_ $550,000 - $599,999 148 110 322 241 m_Cytd_ $600,000 - $649,999 111 69 240 145 m_Cytd_ $650,000 - $699,999 85 54 202 124 m_Cytd_ $700,000 - $799,999 127 81 260 172 m_Cytd_ $800,000 - $899,999 75 36 160 78 m_Cytd_ $900,000 - $999,999 42 25 81 45 m_Cytd_ $1,000,000 - $1,249,999 38 17 87 45 m_Cytd_ $1,250,000 - $1,499,999 22 12 44 25 m_Cytd_ $1,500,000 - $1,749,999 7 10 22 15 m_Cytd_ $1,750,000 - $1,999,999 4 4 14 6 m_Cytd_ $2,000,000 - $2,499,999 6 2 13 4 m_Cytd_ $2,500,000 - $2,999,999 1 2 3 2 m_Cytd_ $3,000,000 - $3,499,999 - 1 1 1 m_Cytd_ $3,500,000 - $3,999,999 - - 2 1 m_Cytd_ $4,000,000 + 1 1 1 1
2,481 1,747 5,770 3,843
0%
5%
10%
15%
20%
25%
30%
35%
<$200,000 $200,000 -$299,999
$300,000 -$399,999
$400,000 -$499,999
$500,000 -$599,999
$600,000 -$699,999
$700,000 -999,999
$1,000,000+
YTD MARCH CITY OF CALGARY SALES BY PRICE RANGE
YTD 2012 YTD 2013 YTD 2014 YTD 2015 Source: CREB®
Page 9
City of CalgaryTotal Residential
C R E B ® C a l g a r y R e g i o n a l H o u s i n g M a r k e t S t a t i s t i c s
Page 9
0
1,000
2,000
3,000
4,000
5,000
6,000
7,000
8,000
9,000
YTD2005
YTD2006
YTD2007
YTD2008
YTD2009
YTD2010
YTD2011
YTD2012
YTD2013
YTD2014
YTD2015
YTD MARCH
CITY OF CALGARY TOTAL SALES
Detached Apartment
Attached 10 Year Average Source: CREB®
0
2,000
4,000
6,000
8,000
10,000
12,000
14,000
16,000
YTD2005
YTD2006
YTD2007
YTD2008
YTD2009
YTD2010
YTD2011
YTD2012
YTD2013
YTD2014
YTD2015
YTD MARCH CITY OF CALGARY TOTAL NEW LISTINGS
Detached Apartment
Attached 10 Year Average Source: CREB®
425,000
430,000
435,000
440,000
445,000
450,000
455,000
460,000
465,000
-
1,000
2,000
3,000
4,000
5,000
6,000
Mar.'14
Apr.'14
May.'14
Jun.'14
Jul.'14
Aug.'14
Sep.'14
Oct.'14
Nov.'14
Dec.'14
Jan.'15
Feb.'15
Mar.'15
CITY OF CALGARY INVENTORY AND SALES
Inventory Sales Benchmark Price Source: CREB®
-
1
2
3
4
5
6
Mar.'10
Aug.'10
Jan.'11
Jun.'11
Nov.'11
Apr.'12
Sep.'12
Feb.'13
Jul.'13
Dec.'13
May.'14
Oct.'14
Mar.'15
CITY OF CALGARY MONTHS OF INVENTORY
Source: CREB®
-6%-4%-2%0%2%4%6%8%
10%12%14%
Mar.'10
Aug.'10
Jan.'11
Jun.'11
Nov.'11
Apr.'12
Sep.'12
Feb.'13
Jul.'13
Dec.'13
May.'14
Oct.'14
Mar.'15
CITY OF CALGARY PRICE CHANGE
Average Price Y/Y% Change Y/Y Median Price Change
Benchmark Y/Y% Change Source: CREB®
320,000340,000360,000380,000400,000420,000440,000460,000480,000500,000520,000
Mar.'10
Aug.'10
Jan.'11
Jun.'11
Nov.'11
Apr.'12
Sep.'12
Feb.'13
Jul.'13
Dec.'13
May.'14
Oct.'14
Mar.'15
CITY OF CALGARY PRICES
Average Price Median Price Benchmark Price Source: CREB®
Page 10
City of CalgaryDetached
C R E B ® C a l g a r y R e g i o n a l H o u s i n g M a r k e t S t a t i s t i c s
Page 10
Jan. Feb. Mar. Apr. May Jun. Jul. Aug. Sept. Oct. Nov. Dec.2014 01/01/14 02/01/14 03/01/14 04/01/14 05/01/14 06/01/14 07/01/14 08/01/14 09/01/14 10/01/14 11/01/14 12/01/14
m_CM_d Sales 857 1,080 1,506 1,533 1,774 1,550 1,364 1,278 1,224 1,290 1,033 607 m_CM_d New Listings 1,399 1,556 1,963 2,254 2,576 2,281 1,862 1,793 1,868 1,626 1,126 762 m_Cm_CInventory 1,254 1,483 1,689 2,170 2,570 2,752 2,688 2,692 2,571 2,205 2,015 1,687 m_cm_Days on Market 40 29 26 25 25 27 32 33 35 36 38 41 m_cm_Benchmark Price 480,300 486,800 494,500 500,800 508,300 513,600 515,700 516,000 516,000 517,200 518,600 518,600 m_cm_Median Price 462,000 480,000 492,750 487,500 497,000 493,500 488,750 480,000 495,000 493,500 483,786 477,000 m_cm_Average Price 527,799 553,493 557,976 549,883 561,081 566,233 559,445 548,516 573,864 559,956 564,300 553,840 m_cm_Index 199 202 205 208 211 213 214 214 214 214 215 215
2015 01/01/15 02/01/15 03/01/15 04/01/15 05/01/15 06/01/15 07/01/15 08/01/15 09/01/15 10/01/15 11/01/15 12/01/15m_CM_d Sales 534 740 1,061 m_CM_d New Listings 1,836 1,672 1,776 m_Cm_CInventory 2,363 2,843 3,016 m_cm_Days on Market 37 34 37 m_cm_Benchmark Price 518,600 516,000 513,800 m_cm_Median Price 481,500 470,000 476,800 m_cm_Average Price 526,394 526,271 547,253 m_cm_Index 215 214 213
Mar-14 Mar-15 YTD2014 YTD2015CALGARY TOTAL SALES 03/01/14 03/01/15 03/01/14 03/01/15
m_Cytd_ >$100,000 - - - - m_Cytd_ $100,000 - $199,999 - 1 1 2 m_Cytd_ $200,000 - $299,999 22 16 79 39 m_Cytd_ $300,000 -$ 349,999 119 60 275 140 m_Cytd_ $350,000 - $399,999 195 159 500 327 m_Cytd_ $400,000 - $449,999 239 209 547 464 m_Cytd_ $450,000 - $499,999 206 152 488 357 m_Cytd_ $500,000 - $549,999 179 122 419 277 m_Cytd_ $550,000 - $599,999 130 99 275 222 m_Cytd_ $600,000 - $649,999 101 59 195 120 m_Cytd_ $650,000 - $699,999 71 41 159 93 m_Cytd_ $700,000 - $799,999 90 57 176 122 m_Cytd_ $800,000 - $899,999 54 24 106 53 m_Cytd_ $900,000 - $999,999 31 18 59 32 m_Cytd_ $1,000,000 - $1,249,999 29 14 68 39 m_Cytd_ $1,250,000 - $1,499,999 21 11 41 20 m_Cytd_ $1,500,000 - $1,749,999 7 9 22 14 m_Cytd_ $1,750,000 - $1,999,999 4 4 13 5 m_Cytd_ $2,000,000 - $2,499,999 6 2 13 4 m_Cytd_ $2,500,000 - $2,999,999 1 2 3 2 m_Cytd_ $3,000,000 - $3,499,999 - 1 1 1 m_Cytd_ $3,500,000 - $3,999,999 - - 2 1 m_Cytd_ $4,000,000 + 1 1 1 1
1,506 1,061 3,443 2,335
0%
5%
10%
15%
20%
25%
30%
35%
40%
<$200,000 $200,000 -$299,999
$300,000 -$399,999
$400,000 -$499,999
$500,000 -$599,999
$600,000 -$699,999
$700,000 -999,999
$1,000,000+
YTD MARCH CALGARY DETACHED SALES BY PRICE RANGE
YTD 2012 YTD 2013 YTD 2014 YTD 2015 Source: CREB®
Page 11
City of CalgaryDetached
C R E B ® C a l g a r y R e g i o n a l H o u s i n g M a r k e t S t a t i s t i c s
Page 11
0
1,000
2,000
3,000
4,000
5,000
6,000
YTD2005
YTD2006
YTD2007
YTD2008
YTD2009
YTD2010
YTD2011
YTD2012
YTD2013
YTD2014
YTD2015
YTD MARCH
CALGARY DETACHED TOTAL SALES
Detached 10 Year AverageSource: CREB®
0
1,000
2,000
3,000
4,000
5,000
6,000
7,000
8,000
9,000
YTD2005
YTD2006
YTD2007
YTD2008
YTD2009
YTD2010
YTD2011
YTD2012
YTD2013
YTD2014
YTD2015
YTD MARCH CALGARY DETACHED TOTAL NEW LISTINGS
Detached 10 Year AverageSource: CREB®
480,000
485,000
490,000
495,000
500,000
505,000
510,000
515,000
520,000
525,000
-
500
1,000
1,500
2,000
2,500
3,000
3,500
Mar.'14
Apr.'14
May.'14
Jun.'14
Jul.'14
Aug.'14
Sep.'14
Oct.'14
Nov.'14
Dec.'14
Jan.'15
Feb.'15
Mar.'15
CALGARY DETACHED INVENTORY AND SALES
Inventory Sales Benchmark Price Source: CREB®
-
1
2
3
4
5
6
Mar.'10
Aug.'10
Jan.'11
Jun.'11
Nov.'11
Apr.'12
Sep.'12
Feb.'13
Jul.'13
Dec.'13
May.'14
Oct.'14
Mar.'15
CALGARY DETACHED MONTHS OF INVENTORY
Source: CREB®
-10%
-5%
0%
5%
10%
15%
Mar.'10
Aug.'10
Jan.'11
Jun.'11
Nov.'11
Apr.'12
Sep.'12
Feb.'13
Jul.'13
Dec.'13
May.'14
Oct.'14
Mar.'15
CALGARY DETACHED PRICE CHANGE
Average Y/Y% Change Median Y/Y% change
Benchmark Y/Y% Change Source: CREB®
320,000
370,000
420,000
470,000
520,000
570,000
620,000
Mar.'10
Sep.'10
Mar.'11
Sep.'11
Mar.'12
Sep.'12
Mar.'13
Sep.'13
Mar.'14
Sep.'14
Mar.'15
CALGARY DETACHED PRICES
Average Price Median Price Benchmark Price Source: CREB®
Page 12
City of CalgaryAttached
C R E B ® C a l g a r y R e g i o n a l H o u s i n g M a r k e t S t a t i s t i c s
Page 12
Jan. Feb. Mar. Apr. May Jun. Jul. Aug. Sept. Oct. Nov. Dec.2014 01/01/14 02/01/14 03/01/14 04/01/14 05/01/14 06/01/14 07/01/14 08/01/14 09/01/14 10/01/14 11/01/14 12/01/14
m_CM_ASales 319 410 523 553 656 635 518 529 487 466 419 253 m_CM_ANew Listings 507 576 685 807 934 816 695 699 699 671 491 315 m_Cm_CInventory 432 524 599 750 893 917 917 922 910 918 845 711 m_cm_Days on Market 40 30 30 26 28 28 32 34 34 38 36 45 m_cm_Benchmark Price 331,100 334,300 336,700 341,800 347,800 351,400 352,600 355,000 356,400 356,200 357,600 356,200 m_cm_Median Price 347,000 353,500 347,000 346,500 350,000 343,500 357,500 357,000 352,000 354,500 360,000 350,000 m_cm_Average Price 412,325 433,056 424,841 412,402 418,700 417,420 418,118 431,626 413,328 429,255 422,907 423,865 m_cm_Index 194 196 197 200 204 206 207 208 209 209 209 209
2015 01/01/15 02/01/15 03/01/15 04/01/15 05/01/15 06/01/15 07/01/15 08/01/15 09/01/15 10/01/15 11/01/15 12/01/15m_CM_ASales 191 261 387 m_CM_ANew Listings 704 680 689 m_Cm_CInventory 948 1,182 1,258 m_cm_Days on Market 41 34 39 m_cm_Benchmark Price 356,000 354,600 354,800 m_cm_Median Price 341,700 347,900 348,000 m_cm_Average Price 403,246 407,265 408,162 m_cm_Index 209 208 208
Mar-14 Mar-15 YTD2014 YTD2015CALGARY TOTAL SALES 03/01/14 03/01/15 03/01/14 03/01/15
m_Cytd_ >$100,000 - - - - m_Cytd_ $100,000 - $199,999 11 8 31 19 m_Cytd_ $200,000 - $299,999 127 99 292 219 m_Cytd_ $300,000 -$ 349,999 124 91 300 196 m_Cytd_ $350,000 - $399,999 67 61 159 141 m_Cytd_ $400,000 - $449,999 49 27 106 52 m_Cytd_ $450,000 - $499,999 29 20 67 39 m_Cytd_ $500,000 - $549,999 11 10 31 23 m_Cytd_ $550,000 - $599,999 11 9 31 15 m_Cytd_ $600,000 - $649,999 7 8 36 20 m_Cytd_ $650,000 - $699,999 14 13 39 29 m_Cytd_ $700,000 - $799,999 33 21 76 44 m_Cytd_ $800,000 - $899,999 21 12 47 23 m_Cytd_ $900,000 - $999,999 9 6 16 12 m_Cytd_ $1,000,000 - $1,249,999 9 1 18 3 m_Cytd_ $1,250,000 - $1,499,999 1 1 3 4 m_Cytd_ $1,500,000 - $1,749,999 - - - - m_Cytd_ $1,750,000 - $1,999,999 - - - - m_Cytd_ $2,000,000 - $2,499,999 - - - - m_Cytd_ $2,500,000 - $2,999,999 - - - - m_Cytd_ $3,000,000 - $3,499,999 - - - - m_Cytd_ $3,500,000 - $3,999,999 - - - - m_Cytd_ $4,000,000 + - - - -
523 387 1,252 839
0%
5%
10%
15%
20%
25%
30%
35%
40%
45%
<$200,000 $200,000 -$299,999
$300,000 -$399,999
$400,000 -$499,999
$500,000 -$599,999
$600,000 -$699,999
$700,000 -999,999
$1,000,000+
YTD MARCH CALGARY ATTACHED SALES BY PRICE RANGE
YTD 2012 YTD 2013 YTD 2014 YTD 2015 Source: CREB®
Page 13
City of CalgaryAttached
C R E B ® C a l g a r y R e g i o n a l H o u s i n g M a r k e t S t a t i s t i c s
Page 13
0
200
400
600
800
1,000
1,200
1,400
1,600
1,800
YTD2005
YTD2006
YTD2007
YTD2008
YTD2009
YTD2010
YTD2011
YTD2012
YTD2013
YTD2014
YTD2015
YTD MARCH
CALGARY ATTACHED TOTAL SALES
Attached 10 Year AverageSource: CREB®
0
500
1,000
1,500
2,000
2,500
3,000
YTD2005
YTD2006
YTD2007
YTD2008
YTD2009
YTD2010
YTD2011
YTD2012
YTD2013
YTD2014
YTD2015
YTD MARCH CALGARY ATTACHED TOTAL NEW LISTINGS
Attached 10 Year AverageSource: CREB®
325,000
330,000
335,000
340,000
345,000
350,000
355,000
360,000
-
200
400
600
800
1,000
1,200
1,400
Mar.'14
Apr.'14
May.'14
Jun.'14
Jul.'14
Aug.'14
Sep.'14
Oct.'14
Nov.'14
Dec.'14
Jan.'15
Feb.'15
Mar.'15
CALGARY ATTACHED INVENTORY AND SALES
Inventory Sales Benchmark Price Source: CREB®
-
1
2
3
4
5
6
Mar.'10
Aug.'10
Jan.'11
Jun.'11
Nov.'11
Apr.'12
Sep.'12
Feb.'13
Jul.'13
Dec.'13
May.'14
Oct.'14
Mar.'15
CALGARY ATTACHED MONTHS OF INVENTORY
Source: CREB®
-10%
-5%
0%
5%
10%
15%
20%
25%
Mar.'10
Aug.'10
Jan.'11
Jun.'11
Nov.'11
Apr.'12
Sep.'12
Feb.'13
Jul.'13
Dec.'13
May.'14
Oct.'14
Mar.'15
CALGARY ATTACHED PRICE CHANGE
Average Y/Y% Change Median Y/Y% change
Benchmark Y/Y% Change Source: CREB®
250,000270,000290,000310,000330,000350,000370,000390,000410,000430,000450,000
Mar.'10
Sep.'10
Mar.'11
Sep.'11
Mar.'12
Sep.'12
Mar.'13
Sep.'13
Mar.'14
Sep.'14
Mar.'15
CALGARY ATTACHED PRICES
Average Price Median Price Benchmark Price Source: CREB®
Page 14
City of CalgaryApartment
C R E B ® C a l g a r y R e g i o n a l H o u s i n g M a r k e t S t a t i s t i c s
Page 14
Jan. Feb. Mar. Apr. May Jun. Jul. Aug. Sept. Oct. Nov. Dec.2014 01/01/14 02/01/14 03/01/14 04/01/14 05/01/14 06/01/14 07/01/14 08/01/14 09/01/14 10/01/14 11/01/14 12/01/14
m_CM_a Sales 263 360 452 454 515 480 448 456 435 389 327 222 m_CM_a New Listings 490 579 671 694 818 721 663 656 692 622 476 303 m_Cm_CInventory 530 668 779 935 1,101 1,125 1,107 1,129 1,078 1,039 966 815 m_cm_Days on Market 43 33 31 34 33 37 40 40 39 41 41 46 m_cm_Benchmark Price 280,800 283,700 287,600 291,800 295,400 299,700 298,100 298,400 298,700 300,100 300,700 300,400 m_cm_Median Price 277,000 289,950 285,500 282,750 284,000 282,750 284,223 287,750 294,500 284,300 290,000 288,900 m_cm_Average Price 314,971 327,288 310,785 319,428 315,845 351,770 322,486 329,704 326,100 323,646 321,836 318,652 m_cm_Index 196 198 201 204 206 209 208 209 209 210 210 210
2015 01/01/15 02/01/15 03/01/15 04/01/15 05/01/15 06/01/15 07/01/15 08/01/15 09/01/15 10/01/15 11/01/15 12/01/15m_CM_a Sales 154 216 299 m_CM_a New Listings 745 593 671 m_Cm_CInventory 1,143 1,304 1,419 m_cm_Days on Market 55 40 43 m_cm_Benchmark Price 298,700 296,000 293,300 m_cm_Median Price 268,875 267,500 272,000 m_cm_Average Price 305,473 309,400 306,781 m_cm_Index 209 207 205
Mar-14 Mar-15 YTD2014 YTD2015CALGARY TOTAL SALES 03/01/14 03/01/15 03/01/14 03/01/15
m_Cytd_ >$100,000 1 - 1 - m_Cytd_ $100,000 - $199,999 35 34 91 78 m_Cytd_ $200,000 - $299,999 219 152 514 338 m_Cytd_ $300,000 -$ 349,999 66 48 158 96 m_Cytd_ $350,000 - $399,999 58 20 123 54 m_Cytd_ $400,000 - $449,999 32 18 71 43 m_Cytd_ $450,000 - $499,999 15 11 32 21 m_Cytd_ $500,000 - $549,999 10 5 33 13 m_Cytd_ $550,000 - $599,999 7 2 16 4 m_Cytd_ $600,000 - $649,999 3 2 9 5 m_Cytd_ $650,000 - $699,999 - - 4 2 m_Cytd_ $700,000 - $799,999 4 3 8 6 m_Cytd_ $800,000 - $899,999 - - 7 2 m_Cytd_ $900,000 - $999,999 2 1 6 1 m_Cytd_ $1,000,000 - $1,249,999 - 2 1 3 m_Cytd_ $1,250,000 - $1,499,999 - - - 1 m_Cytd_ $1,500,000 - $1,749,999 - 1 - 1 m_Cytd_ $1,750,000 - $1,999,999 - - 1 1 m_Cytd_ $2,000,000 - $2,499,999 - - - - m_Cytd_ $2,500,000 - $2,999,999 - - - - m_Cytd_ $3,000,000 - $3,499,999 - - - - m_Cytd_ $3,500,000 - $3,999,999 - - - - m_Cytd_ $4,000,000 + - - - -
452 299 1,075 669
0%
10%
20%
30%
40%
50%
60%
<$200,000 $200,000 -$299,999
$300,000 -$399,999
$400,000 -$499,999
$500,000 -$599,999
$600,000 -$699,999
$700,000 -999,999
$1,000,000+
YTD MARCH CALGARY APPARTMENT SALES BY PRICE RANGE
YTD 2012 YTD 2013 YTD 2014 YTD 2015 Source: CREB®
Page 15
City of CalgaryApartment
C R E B ® C a l g a r y R e g i o n a l H o u s i n g M a r k e t S t a t i s t i c s
Page 15
0
200
400
600
800
1,000
1,200
1,400
1,600
1,800
YTD2005
YTD2006
YTD2007
YTD2008
YTD2009
YTD2010
YTD2011
YTD2012
YTD2013
YTD2014
YTD2015
YTD MARCH
CALGARY APARTMENT TOTAL SALES
Apartment 10 Year AverageSource: CREB®
0
500
1,000
1,500
2,000
2,500
3,000
YTD2005
YTD2006
YTD2007
YTD2008
YTD2009
YTD2010
YTD2011
YTD2012
YTD2013
YTD2014
YTD2015
YTD MARCH CALGARY APARTMENT TOTAL NEW LISTINGS
Apartment 10 Year AverageSource: CREB®
280,000
285,000
290,000
295,000
300,000
305,000
-
200
400
600
800
1,000
1,200
1,400
1,600
Mar.'14
Apr.'14
May.'14
Jun.'14
Jul.'14
Aug.'14
Sep.'14
Oct.'14
Nov.'14
Dec.'14
Jan.'15
Feb.'15
Mar.'15
CALGARY APARTMENT INVENTORY AND SALES
inventory Sales Benchmark Price Source: CREB®
-
1
2
3
4
5
6
7
Mar.'10
Aug.'10
Jan.'11
Jun.'11
Nov.'11
Apr.'12
Sep.'12
Feb.'13
Jul.'13
Dec.'13
May.'14
Oct.'14
Mar.'15
CALGARY APARTMENT MONTHS OF INVENTORY
Source: CREB®
-20%
-15%
-10%
-5%
0%
5%
10%
15%
20%
25%
Mar.'10
Aug.'10
Jan.'11
Jun.'11
Nov.'11
Apr.'12
Sep.'12
Feb.'13
Jul.'13
Dec.'13
May.'14
Oct.'14
Mar.'15
CALGARY APARTMENT PRICE CHANGE
Average Y/Y% Change Median Y/Y% change
Benchmark Y/Y% Change Source: CREB®
200,000
220,000
240,000
260,000
280,000
300,000
320,000
340,000
360,000
Mar.'10
Sep.'10
Mar.'11
Sep.'11
Mar.'12
Sep.'12
Mar.'13
Sep.'13
Mar.'14
Sep.'14
Mar.'15
CALGARY APARTMENT PRICES
Average Price Median Price Benchmark Price Source: CREB®
Page 16
AirdrieTotal Residential
C R E B ® C a l g a r y R e g i o n a l H o u s i n g M a r k e t S t a t i s t i c s
Page 16
Jan. Feb. Mar. Apr. May Jun. Jul. Aug. Sept. Oct. Nov. Dec.2014 01/01/14 02/01/14 03/01/14 04/01/14 05/01/14 06/01/14 07/01/14 08/01/14 09/01/14 10/01/14 11/01/14 12/01/14
m_AIR_RSales 67 107 162 169 197 197 182 133 140 160 117 64 m_AIR_RNew Listings 125 149 200 219 289 254 209 187 178 183 115 80 m_Am_AInventory 110 130 151 186 249 268 258 275 240 193 177 169 m_AIR_Days on Market 42 33 26 26 27 30 32 32 41 42 38 45 m_AIR_Benchmark Price 343,300 345,600 350,900 356,200 361,500 364,500 366,800 369,800 371,900 373,200 375,900 376,600 m_AIR_Median Price 385,500 378,750 387,750 390,000 395,000 390,000 388,300 372,400 381,750 388,250 392,000 400,000 m_AIR_Average Price 384,409 383,951 390,754 390,878 398,571 384,237 384,658 364,498 393,210 387,240 383,670 396,018 m_AIR_Index 181 182 185 188 191 192 194 195 196 197 198 199
2015 01/01/15 02/01/15 03/01/15 04/01/15 05/01/15 06/01/15 07/01/15 08/01/15 09/01/15 10/01/15 11/01/15 12/01/15m_AIR_RSales 66 98 136 m_AIR_RNew Listings 224 231 194 m_Am_AInventory 259 349 360 m_AIR_Days on Market 44 35 39 m_AIR_Benchmark Price 377,400 378,000 376,100 m_AIR_Median Price 376,491 400,000 384,000 m_AIR_Average Price 376,290 399,835 378,403 m_AIR_Index 199 200 199
Mar-14 Mar-15 YTD2014 YTD2015AIRDRIE TOTAL SALES 03/01/14 03/01/15 03/01/14 03/01/15
m_Aytd_ >$100,000 - - - - m_Aytd_ $100,000 - $199,999 12 8 20 15 m_Aytd_ $200,000 - $299,999 27 22 55 58 m_Aytd_ $300,000 -$ 349,999 17 16 40 31 m_Aytd_ $350,000 - $399,999 34 35 79 65 m_Aytd_ $400,000 - $449,999 29 26 62 56 m_Aytd_ $450,000 - $499,999 12 16 33 40 m_Aytd_ $500,000 - $549,999 15 8 20 17 m_Aytd_ $550,000 - $599,999 10 1 13 8 m_Aytd_ $600,000 - $649,999 2 2 8 7 m_Aytd_ $650,000 - $699,999 2 - 3 - m_Aytd_ $700,000 - $799,999 1 - 1 - m_Aytd_ $800,000 - $899,999 - 1 - 1 m_Aytd_ $900,000 - $999,999 - 1 - 1 m_Aytd_ $1,000,000 - $1,249,999 1 - 1 1 m_Aytd_ $1,250,000 - $1,499,999 - - 1 - m_Aytd_ $1,500,000 - $1,749,999 - - - - m_Aytd_ $1,750,000 - $1,999,999 - - - - m_Aytd_ $2,000,000 - $2,499,999 - - - - m_Aytd_ $2,500,000 - $2,999,999 - - - - m_Aytd_ $3,000,000 - $3,499,999 - - - - m_Aytd_ $3,500,000 - $3,999,999 - - - - m_Aytd_ $4,000,000 + - - - -
162 136 336 300
0%
5%
10%
15%
20%
25%
30%
35%
40%
45%
50%
<$200,000 $200,000 -$299,999
$300,000 -$399,999
$400,000 -$499,999
$500,000 -$599,999
$600,000 -$699,999
$700,000 -999,999
$1,000,000+
YTD MARCH AIRDRIE SALES BY PRICE RANGE
YTD 2012 YTD 2013 YTD 2014 YTD 2015 Source: CREB®
Page 17
Region of RockyviewTotal Residential
C R E B ® C a l g a r y R e g i o n a l H o u s i n g M a r k e t S t a t i s t i c s
Page 18
Jan. Feb. Mar. Apr. May Jun. Jul. Aug. Sept. Oct. Nov. Dec.2014 01/01/14 02/01/14 03/01/14 04/01/14 05/01/14 06/01/14 07/01/14 08/01/14 09/01/14 10/01/14 11/01/14 12/01/14
m_mdrv_Sales 98 141 198 228 224 194 186 171 179 152 108 74 m_mdrv_New Listings 256 278 327 331 353 360 289 264 256 237 196 127 m_mm_mInventory 569 630 665 702 735 772 763 742 694 670 612 522 m_mdrvDays on Market 76 73 55 49 54 57 63 58 58 69 54 70 m_mdrvBenchmark Price 506,500 513,300 521,000 526,000 535,200 532,800 539,000 545,100 546,400 551,900 547,900 554,700 m_mdrvMedian Price 475,500 470,000 485,000 495,500 524,000 475,000 490,000 521,000 505,000 520,000 435,000 475,000 m_mdrvAverage Price 537,753 587,005 599,022 599,400 649,548 578,289 618,967 636,616 623,188 671,762 504,264 557,609 m_mdrvIndex 164 166 169 170 173 172 174 176 177 179 177 180
2015 01/01/15 02/01/15 03/01/15 04/01/15 05/01/15 06/01/15 07/01/15 08/01/15 09/01/15 10/01/15 11/01/15 12/01/15m_mdrv_Sales 78 79 118 m_mdrv_New Listings 289 256 316 m_mm_mInventory 621 718 798 m_mdrvDays on Market 76 56 60 m_mdrvBenchmark Price 554,700 558,400 572,300 m_mdrvMedian Price 478,750 500,000 487,250 m_mdrvAverage Price 625,531 652,434 605,330 m_mdrvIndex 180 181 185
Mar-14 Mar-15 YTD2014 YTD2015ROCKYVIEW TOTAL SALE 03/01/14 03/01/15 03/01/14 03/01/15
m_mytd_ >$100,000 - - 1 - m_mytd_ $100,000 - $199,999 4 1 12 2 m_mytd_ $200,000 - $299,999 22 10 48 32 m_mytd_ $300,000 -$ 349,999 14 8 33 15 m_mytd_ $350,000 - $399,999 20 10 48 25 m_mytd_ $400,000 - $449,999 20 18 46 37 m_mytd_ $450,000 - $499,999 27 15 57 35 m_mytd_ $500,000 - $549,999 14 13 30 24 m_mytd_ $550,000 - $599,999 13 4 28 14 m_mytd_ $600,000 - $649,999 5 1 17 7 m_mytd_ $650,000 - $699,999 9 5 16 11 m_mytd_ $700,000 - $799,999 9 10 21 16 m_mytd_ $800,000 - $899,999 9 3 20 15 m_mytd_ $900,000 - $999,999 6 3 13 6 m_mytd_ $1,000,000 - $1,249,999 13 10 24 18 m_mytd_ $1,250,000 - $1,499,999 4 3 7 7 m_mytd_ $1,500,000 - $1,749,999 7 3 8 4 m_mytd_ $1,750,000 - $1,999,999 1 1 4 1 m_mytd_ $2,000,000 - $2,499,999 1 - 2 3 m_mytd_ $2,500,000 - $2,999,999 - - 2 - m_mytd_ $3,000,000 - $3,499,999 - - - 3 m_mytd_ $3,500,000 - $3,999,999 - - - - m_mytd_ $4,000,000 + - - - -
198 118 437 275
0%
5%
10%
15%
20%
25%
30%
<$200,000 $200,000 -$299,999
$300,000 -$399,999
$400,000 -$499,999
$500,000 -$599,999
$600,000 -$699,999
$700,000 -999,999
$1,000,000+
YTD MARCH ROCKYVIEW SALES BY PRICE RANGE
YTD 2012 YTD 2013 YTD 2014 YTD 2015 Source: CREB®
Page 18
Region of FoothillsTotal Residential
C R E B ® C a l g a r y R e g i o n a l H o u s i n g M a r k e t S t a t i s t i c s
Page 20
Jan. Feb. Mar. Apr. May Jun. Jul. Aug. Sept. Oct. Nov. Dec.2014 01/01/14 02/01/14 03/01/14 04/01/14 05/01/14 06/01/14 07/01/14 08/01/14 09/01/14 10/01/14 11/01/14 12/01/14
m_mdFHSales 70 89 112 157 171 164 151 135 124 139 97 60 m_mdFHNew Listings 182 170 200 233 272 243 243 216 219 173 127 81 m_mm_mInventory 349 392 439 478 532 532 550 590 552 483 454 367 m_mdFDays on Market 73 60 47 60 51 49 53 51 57 59 58 73 m_mdFBenchmark Price 364,300 369,900 378,900 384,500 386,700 385,200 387,300 388,800 392,500 390,300 393,300 393,600 m_mdFMedian Price 427,837 390,900 412,000 430,000 438,500 432,500 407,000 410,000 402,500 409,500 424,900 393,500 m_mdFAverage Price 473,452 459,478 492,041 504,194 530,346 529,946 504,947 517,009 495,263 491,495 476,317 509,881 m_mdFIndex 169 172 176 179 180 179 180 181 182 181 183 183
2015 01/01/15 02/01/15 03/01/15 04/01/15 05/01/15 06/01/15 07/01/15 08/01/15 09/01/15 10/01/15 11/01/15 12/01/15m_mdFHSales 56 67 109 m_mdFHNew Listings 191 197 236 m_mm_mInventory 411 497 582 m_mdFDays on Market 85 71 66 m_mdFBenchmark Price 394,400 393,600 404,300 m_mdFMedian Price 384,870 383,000 400,000 m_mdFAverage Price 457,085 494,242 443,805 m_mdFIndex 183 183 188
Mar-14 Mar-15 YTD2014 YTD2015FOOTHILLS TOTAL SALES 03/01/14 03/01/15 03/01/14 03/01/15
m_mytd_ >$100,000 - 1 - 2 m_mytd_ $100,000 - $199,999 6 8 10 15 m_mytd_ $200,000 - $299,999 17 19 53 44 m_mytd_ $300,000 -$ 349,999 12 16 26 35 m_mytd_ $350,000 - $399,999 15 10 42 26 m_mytd_ $400,000 - $449,999 16 14 33 22 m_mytd_ $450,000 - $499,999 12 14 27 22 m_mytd_ $500,000 - $549,999 3 6 13 12 m_mytd_ $550,000 - $599,999 4 8 7 11 m_mytd_ $600,000 - $649,999 - 1 5 2 m_mytd_ $650,000 - $699,999 5 1 10 4 m_mytd_ $700,000 - $799,999 4 2 12 9 m_mytd_ $800,000 - $899,999 7 1 10 12 m_mytd_ $900,000 - $999,999 4 2 8 2 m_mytd_ $1,000,000 - $1,249,999 6 3 10 7 m_mytd_ $1,250,000 - $1,499,999 - 3 3 6 m_mytd_ $1,500,000 - $1,749,999 1 - 2 - m_mytd_ $1,750,000 - $1,999,999 - - - 1 m_mytd_ $2,000,000 - $2,499,999 - - - - m_mytd_ $2,500,000 - $2,999,999 - - - - m_mytd_ $3,000,000 - $3,499,999 - - - - m_mytd_ $3,500,000 - $3,999,999 - - - - m_mytd_ $4,000,000 + - - - -
112 109 271 232
0%
5%
10%
15%
20%
25%
30%
35%
40%
<$200,000 $200,000 -$299,999
$300,000 -$399,999
$400,000 -$499,999
$500,000 -$599,999
$600,000 -$699,999
$700,000 -999,999
$1,000,000+
YTD MARCH FOOTHILLS SALES BY PRICE RANGE
YTD 2012 YTD 2013 YTD 2014 YTD 2015 Source: CREB®
Page 19
Surrounding AreaTotal Residential
C R E B ® C a l g a r y R e g i o n a l H o u s i n g M a r k e t S t a t i s t i c s
Page 22
Jan. Feb. Mar. Apr. May Jun. Jul. Aug. Sept. Oct. Nov. Dec.2014 01/01/14 02/01/14 03/01/14 04/01/14 05/01/14 06/01/14 07/01/14 08/01/14 09/01/14 10/01/14 11/01/14 12/01/14
m_SA_R Sales 269 374 536 637 684 646 586 499 511 513 361 221 m_SA_R New Listings 631 668 820 882 1,047 958 833 747 725 666 491 303 m_Sm_SInventory 1,187 1,334 1,455 1,570 1,740 1,786 1,772 1,796 1,647 1,508 1,395 1,177 m_SA_Days on Market 68 60 47 48 46 47 50 48 54 57 49 62 m_SA_Benchmark Price 394,000 398,100 405,300 411,000 416,900 417,800 421,400 423,900 426,200 427,300 428,400 430,000 m_SA_Median Price 400,000 389,900 406,750 415,000 422,750 404,500 409,419 415,000 410,000 410,000 392,928 400,500 m_SA_Average Price 452,018 468,359 477,978 480,402 502,112 469,549 480,548 494,082 488,171 491,609 434,052 472,555 m_SA_Index 174 176 179 181 184 184 186 187 188 189 189 190
2015 01/01/15 02/01/15 03/01/15 04/01/15 05/01/15 06/01/15 07/01/15 08/01/15 09/01/15 10/01/15 11/01/15 12/01/15m_SA_R Sales 222 271 410 m_SA_R New Listings 770 750 844 m_Sm_SInventory 1,443 1,736 1,953 m_SA_Days on Market 68 53 56 m_SA_Benchmark Price 430,500 431,200 436,400 m_SA_Median Price 399,950 405,000 400,000 m_SA_Average Price 475,997 487,350 451,805 m_SA_Index 190 190 193
Mar-14 Mar-15 YTD2014 YTD2015SURROUNDING AREA SA 03/01/14 03/01/15 03/01/14 03/01/15
m_Sytd_ >$100,000 - 1 2 3 m_Sytd_ $100,000 - $199,999 32 22 65 45 m_Sytd_ $200,000 - $299,999 86 72 201 173 m_Sytd_ $300,000 -$ 349,999 58 48 127 92 m_Sytd_ $350,000 - $399,999 83 60 194 133 m_Sytd_ $400,000 - $449,999 68 65 149 125 m_Sytd_ $450,000 - $499,999 53 46 119 100 m_Sytd_ $500,000 - $549,999 32 27 65 54 m_Sytd_ $550,000 - $599,999 27 13 48 33 m_Sytd_ $600,000 - $649,999 7 4 30 17 m_Sytd_ $650,000 - $699,999 16 6 30 15 m_Sytd_ $700,000 - $799,999 14 12 34 25 m_Sytd_ $800,000 - $899,999 16 5 30 28 m_Sytd_ $900,000 - $999,999 10 6 21 9 m_Sytd_ $1,000,000 - $1,249,999 20 13 35 26 m_Sytd_ $1,250,000 - $1,499,999 4 6 11 13 m_Sytd_ $1,500,000 - $1,749,999 8 3 10 4 m_Sytd_ $1,750,000 - $1,999,999 1 1 4 2 m_Sytd_ $2,000,000 - $2,499,999 1 - 2 3 m_Sytd_ $2,500,000 - $2,999,999 - - 2 - m_Sytd_ $3,000,000 - $3,499,999 - - - 3 m_Sytd_ $3,500,000 - $3,999,999 - - - - m_Sytd_ $4,000,000 + - - - -
536 410 1,179 903
0%
5%
10%
15%
20%
25%
30%
35%
40%
<$200,000 $200,000 -$299,999
$300,000 -$399,999
$400,000 -$499,999
$500,000 -$599,999
$600,000 -$699,999
$700,000 -999,999
$1,000,000+
YTD MARCH SURROUNDING AREA SALES BY PRICE RANGE
YTD 2012 YTD 2013 YTD 2014 YTD 2015 Source: CREB®
Page 20
Surrounding AreaTotal Residential
C R E B ® C a l g a r y R e g i o n a l H o u s i n g M a r k e t S t a t i s t i c s
Page 23
0
200
400
600
800
1,000
1,200
1,400
1,600
YTD2005
YTD2006
YTD2007
YTD2008
YTD2009
YTD2010
YTD2011
YTD2012
YTD2013
YTD2014
YTD2015
YTD MARCH
SURROUNDING AREA SALES
Total Residential 10 Year AverageSource: CREB®
0
500
1,000
1,500
2,000
2,500
3,000
YTD2005
YTD2006
YTD2007
YTD2008
YTD2009
YTD2010
YTD2011
YTD2012
YTD2013
YTD2014
YTD2015
YTD MARCH SURROUNDING AREA NEW LISTINGS
Total Residential 10 Year AverageSource: CREB®
385,000 390,000 395,000 400,000 405,000 410,000 415,000 420,000 425,000 430,000 435,000 440,000
-
500
1,000
1,500
2,000
2,500
Mar.'14
Apr.'14
May.'14
Jun.'14
Jul.'14
Aug.'14
Sep.'14
Oct.'14
Nov.'14
Dec.'14
Jan.'15
Feb.'15
Mar.'15
SURROUNDING AREA INVENTORY AND SALES
inventory Sales Benchmark Price Source: CREB®
-
1
2
3
4
5
6
7
8
9
10
Mar.'10
Aug.'10
Jan.'11
Jun.'11
Nov.'11
Apr.'12
Sep.'12
Feb.'13
Jul.'13
Dec.'13
May.'14
Oct.'14
Mar.'15
SURROUNDING AREA MONTHS OF INVENTORY
Source: CREB®
-20%
-15%
-10%
-5%
0%
5%
10%
15%
20%
25%
Mar.'10
Aug.'10
Jan.'11
Jun.'11
Nov.'11
Apr.'12
Sep.'12
Feb.'13
Jul.'13
Dec.'13
May.'14
Oct.'14
Mar.'15
SURROUNDING AREA PRICE CHANGE
Average Y/Y% Change Median Y/Y% change
Benchmark Y/Y% Change Source: CREB®
250,000
300,000
350,000
400,000
450,000
500,000
550,000
Mar.'10
Sep.'10
Mar.'11
Sep.'11
Mar.'12
Sep.'12
Mar.'13
Sep.'13
Mar.'14
Sep.'14
Mar.'15
SURROUNDING AREA PRICES
Average Price Median Price Benchmark Price Source: CREB®
Page 21
Economic RegionTotal Residential
C R E B ® C a l g a r y R e g i o n a l H o u s i n g M a r k e t S t a t i s t i c s
Page 24
Jan. Feb. Mar. Apr. May Jun. Jul. Aug. Sept. Oct. Nov. Dec.2014 01/01/14 02/01/14 03/01/14 04/01/14 05/01/14 06/01/14 07/01/14 08/01/14 09/01/14 10/01/14 11/01/14 12/01/14
m_CREBSales 1,708 2,224 3,017 3,177 3,629 3,311 2,916 2,762 2,657 2,658 2,140 1,303 m_CREBNew Listings 3,027 3,379 4,139 4,637 5,375 4,776 4,053 3,895 3,984 3,585 2,584 1,683 m_Cm_CInventory 3,403 4,009 4,522 5,425 6,304 6,580 6,484 6,548 6,216 5,679 5,230 4,398 m_CREDays on Market 45 35 31 31 31 33 37 37 39 41 40 46 m_CREBenchmark Price 421,500 426,500 432,700 438,500 445,000 449,300 450,800 451,600 452,500 453,600 454,900 454,400 m_CREMedian Price 415,000 417,700 427,000 426,000 430,000 424,900 424,000 420,000 423,000 427,750 422,000 415,000 m_CREAverage Price 461,526 480,357 483,651 479,089 489,427 487,738 482,079 480,168 487,396 489,266 477,595 474,746 m_CREIndex 196 198 201 204 207 209 209 210 210 211 211 211
2015 01/01/15 02/01/15 03/01/15 04/01/15 05/01/15 06/01/15 07/01/15 08/01/15 09/01/15 10/01/15 11/01/15 12/01/15m_CREBSales 1,101 1,488 2,157 m_CREBNew Listings 4,055 3,695 3,980 m_Cm_CInventory 5,897 7,065 7,646 m_CREDays on Market 47 39 42 m_CREBenchmark Price 454,200 451,900 450,600 m_CREMedian Price 416,000 418,450 417,000 m_CREAverage Price 463,968 466,827 470,821 m_CREIndex 211 210 209
Mar-14 Mar-15 YTD2014 YTD2015CREB® SALES 03/01/14 03/01/15 03/01/14 03/01/15
m_Cytd_ >$100,000 1 1 3 3 m_Cytd_ $100,000 - $199,999 78 65 188 144 m_Cytd_ $200,000 - $299,999 454 339 1,086 769 m_Cytd_ $300,000 -$ 349,999 367 247 860 524 m_Cytd_ $350,000 - $399,999 403 300 976 655 m_Cytd_ $400,000 - $449,999 388 319 873 684 m_Cytd_ $450,000 - $499,999 303 229 706 517 m_Cytd_ $500,000 - $549,999 232 164 548 367 m_Cytd_ $550,000 - $599,999 175 123 370 274 m_Cytd_ $600,000 - $649,999 118 73 270 162 m_Cytd_ $650,000 - $699,999 101 60 232 139 m_Cytd_ $700,000 - $799,999 141 93 294 197 m_Cytd_ $800,000 - $899,999 91 41 190 106 m_Cytd_ $900,000 - $999,999 52 31 102 54 m_Cytd_ $1,000,000 - $1,249,999 58 30 122 71 m_Cytd_ $1,250,000 - $1,499,999 26 18 55 38 m_Cytd_ $1,500,000 - $1,749,999 15 13 32 19 m_Cytd_ $1,750,000 - $1,999,999 5 5 18 8 m_Cytd_ $2,000,000 - $2,499,999 7 2 15 7 m_Cytd_ $2,500,000 - $2,999,999 1 2 5 2 m_Cytd_ $3,000,000 - $3,499,999 - 1 1 4 m_Cytd_ $3,500,000 - $3,999,999 - - 2 1 m_Cytd_ $4,000,000 + 1 1 1 1
3,017 2,157 6,949 4,746
0%
5%
10%
15%
20%
25%
30%
35%
<$200,000 $200,000 -$299,999
$300,000 -$399,999
$400,000 -$499,999
$500,000 -$599,999
$600,000 -$699,999
$700,000 -999,999
$1,000,000+
YTD MARCH CREB® SALES BY PRICE RANGE
YTD 2012 YTD 2013 YTD 2014 YTD 2015 Source: CREB®
Page 22
Economic RegionTotal Residential
C R E B ® C a l g a r y R e g i o n a l H o u s i n g M a r k e t S t a t i s t i c s
Page 25
0
2,000
4,000
6,000
8,000
10,000
12,000
YTD2005
YTD2006
YTD2007
YTD2008
YTD2009
YTD2010
YTD2011
YTD2012
YTD2013
YTD2014
YTD2015
YTD MARCH
CREB® SALES
Total Residential 10 Year AverageSource: CREB®
0
2,000
4,000
6,000
8,000
10,000
12,000
14,000
16,000
18,000
YTD2005
YTD2006
YTD2007
YTD2008
YTD2009
YTD2010
YTD2011
YTD2012
YTD2013
YTD2014
YTD2015
YTD MARCH CREB® NEW LISTINGS
Total Residential 10 Year AverageSource: CREB®
420,000
425,000
430,000
435,000
440,000
445,000
450,000
455,000
460,000
-
1,000
2,000
3,000
4,000
5,000
6,000
7,000
8,000
9,000
Mar.'14
Apr.'14
May.'14
Jun.'14
Jul.'14
Aug.'14
Sep.'14
Oct.'14
Nov.'14
Dec.'14
Jan.'15
Feb.'15
Mar.'15
CREB® INVENTORY AND SALES
inventory Sales Benchmark Price Source: CREB®
-
1
2
3
4
5
6
7
Mar.'10
Aug.'10
Jan.'11
Jun.'11
Nov.'11
Apr.'12
Sep.'12
Feb.'13
Jul.'13
Dec.'13
May.'14
Oct.'14
Mar.'15
CREB® MONTHS OF INVENTORY
Source: CREB®
-6%
-4%
-2%
0%
2%
4%
6%
8%
10%
12%
Mar.'10
Aug.'10
Jan.'11
Jun.'11
Nov.'11
Apr.'12
Sep.'12
Feb.'13
Jul.'13
Dec.'13
May.'14
Oct.'14
Mar.'15
CREB® PRICE CHANGE
Average Y/Y% Change Median Y/Y% change
Benchmark Y/Y% Change Source: CREB®
250,000
300,000
350,000
400,000
450,000
500,000
550,000
Mar.'10
Sep.'10
Mar.'11
Sep.'11
Mar.'12
Sep.'12
Mar.'13
Sep.'13
Mar.'14
Sep.'14
Mar.'15
CREB® PRICES
Average Price Median Price Benchmark Price Source: CREB®
Page 23
Caglary CMATotal Residential
C R E B ® C a l g a r y R e g i o n a l H o u s i n g M a r k e t S t a t i s t i c s
Page 26
Jan. Feb. Mar. Apr. May Jun. Jul. Aug. Sept. Oct. Nov. Dec.2014 01/01/14 02/01/14 03/01/14 04/01/14 05/01/14 06/01/14 07/01/14 08/01/14 09/01/14 10/01/14 11/01/14 12/01/14
m_Cma_Sales 1,537 1,991 2,679 2,768 3,169 2,859 2,516 2,434 2,325 2,297 1,887 1,156 m_Cma_New Listings 2,652 2,989 3,646 4,086 4,681 4,178 3,509 3,412 3,515 3,156 2,289 1,507 m_Cm_CInventory 3,145 3,665 4,092 4,917 5,659 5,926 5,835 5,769 5,503 5,034 4,624 3,912 m_CmaDays on Market 43 33 30 29 29 31 36 37 37 39 39 44 m_CmaBenchmark Price 425,700 430,700 436,700 442,600 449,300 453,800 455,300 456,200 456,800 458,100 459,400 459,200 m_CmaMedian Price 419,000 427,000 435,600 435,000 440,000 430,000 432,000 429,250 430,000 437,000 429,000 419,700 m_CmaAverage Price 468,050 490,164 493,313 488,697 498,007 497,993 492,555 488,307 497,680 500,819 487,452 480,469 m_CmaIndex 197 199 202 205 208 210 211 211 211 212 213 212
2015 01/01/15 02/01/15 03/01/15 04/01/15 05/01/15 06/01/15 07/01/15 08/01/15 09/01/15 10/01/15 11/01/15 12/01/15m_Cma_Sales 957 1,296 1,865 m_Cma_New Listings 3,574 3,201 3,452 m_Cm_CInventory 5,435 6,407 6,851 m_CmaDays on Market 44 37 40 m_CmaBenchmark Price 458,800 456,600 454,900 m_CmaMedian Price 425,000 425,000 425,000 m_CmaAverage Price 474,346 473,850 483,512 m_CmaIndex 212 211 210
Mar-14 Mar-15 YTD2014 YTD2015CALGARY CMA SALES 03/01/14 03/01/15 03/01/14 03/01/15
m_Cytd_ >$100,000 1 - 2 - m_Cytd_ $100,000 - $199,999 50 44 135 101 m_Cytd_ $200,000 - $299,999 390 277 933 628 m_Cytd_ $300,000 -$ 349,999 323 207 766 447 m_Cytd_ $350,000 - $399,999 340 250 830 547 m_Cytd_ $400,000 - $449,999 340 272 770 596 m_Cytd_ $450,000 - $499,999 277 198 644 452 m_Cytd_ $500,000 - $549,999 214 150 513 337 m_Cytd_ $550,000 - $599,999 161 114 350 255 m_Cytd_ $600,000 - $649,999 116 70 257 152 m_Cytd_ $650,000 - $699,999 94 59 218 135 m_Cytd_ $700,000 - $799,999 136 91 281 188 m_Cytd_ $800,000 - $899,999 84 39 180 93 m_Cytd_ $900,000 - $999,999 48 28 94 51 m_Cytd_ $1,000,000 - $1,249,999 51 27 111 63 m_Cytd_ $1,250,000 - $1,499,999 26 15 51 32 m_Cytd_ $1,500,000 - $1,749,999 14 13 30 19 m_Cytd_ $1,750,000 - $1,999,999 5 5 18 7 m_Cytd_ $2,000,000 - $2,499,999 7 2 15 7 m_Cytd_ $2,500,000 - $2,999,999 1 2 5 2 m_Cytd_ $3,000,000 - $3,499,999 - 1 1 4 m_Cytd_ $3,500,000 - $3,999,999 - - 2 1 m_Cytd_ $4,000,000 + 1 1 1 1
2,679 1,865 6,207 4,118
0%
5%
10%
15%
20%
25%
30%
35%
<$200,000 $200,000 -$299,999
$300,000 -$399,999
$400,000 -$499,999
$500,000 -$599,999
$600,000 -$699,999
$700,000 -999,999
$1,000,000+
YTD MARCH CALGARY CMA SALES BY PRICE RANGE
YTD 2012 YTD 2013 YTD 2014 YTD 2015 Source: CREB®
Page 24
C R E B ® C a l g a r y R e g i o n a l H o u s i n g M a r k e t S t a t i s t i c s
Page 28
DEFINITIONS
Total Residential - includes detached, attached and apartment style properties.Active Listings - Actual figures were used as of January 2015, previous figures represent estimated figures.Benchmark Price - Represent the monthly price of the typical home based on it's attributes, providing the best measure of price trends.MLS® Home Price Index – changes in home prices by comparing current price levels relative to January 2005 price level. Exclusions – Data included in this package do not include activity related to rental, land or leased properties.Detached - A unit that is not attached to any other unit.Attached - A unit that is attached to another unit by at least one common wall.Apartment - An attached unit that has connecting enclosed hallways.
ABOUT CREB®
CREB® is a professional body of more than 5,100 licensed brokers and registered associates, representing 245 member offices. CREB® is dedicated to enhancing the value, integrity and expertise of its REALTOR® members. Our REALTORS® are committed to a high standard of professional conduct, ongoing education, and a strict Code of Ethics and standards of business practice. For Calgary Metro, CREB® statistics include only Zone A, B, C and D for properties located in Calgary. Furthermore, all historical data has been adjusted to the most current information. Any use or reference to CREB® data and statistics must acknowledge CREB® as the source. The board does not generate statistics or analysis of any individual member or company’s market share. All MLS® active listings for Calgary and area may be found on the board’s website at www.creb.com. CREB® is a registered trademark of the Calgary Real Estate Board Cooperative. The trademarks MLS® and Multiple Listing
Calgary CMA - includes City of Calgary, Airdrie and the Region of Rockyview Rockyview - includes all activity in the geographical area excluding Airdire City of Calgary - includes all residential activity within city limits Foothills - includes all residential activity within the Foothills area border Other Active Areas - includes Didsbury, Cremona, Carstairs, Strathmore, Vulcan