29
March 2016 Monthly Complaint Report Vol. 9
March 2016
Monthly Complaint Report Vol. 9

1 MONTHLY COMPLAINT REPORT: MARCH 2016
Table of contents Table of contents ......................................................................................................... 1
1. Complaint volume ................................................................................................. 2
1.1 Complaint volume by product .................................................................. 3
1.2 Complaint volume by state ....................................................................... 7
1.3 Complaint volume by company ................................................................ 9
2. Product spotlight: Debt collection .................................................................... 11
2.1 Debt collection complaints by type.......................................................... 11
2.2 Debt collection complaints by state ........................................................ 14
2.3 Debt collection complaints by company ................................................. 16
3. Geographic spotlight: Florida ........................................................................... 19
3.1 Florida complaints by product ............................................................... 20
3.2 Florida complaints over time .................................................................. 21
3.3 Florida complaints by company ............................................................. 22
Appendix A: ............................................................................................................... 23

2 MONTHLY COMPLAINT REPORT: MARCH 2016
1. Complaint volume The Consumer Financial Protection Bureau (CFPB) is the first federal agency solely focused on
consumer financial protection,1 and consumer complaints2 are an integral part of that work. The
CFPB’s Office of Consumer Response hears directly from consumers about the challenges they
face in the marketplace, brings their concerns to the attention of companies, and assists in
addressing their complaints. This Monthly Complaint Report provides a high-level snapshot of
trends in consumer complaints.
The Monthly Complaint Report uses a three-month rolling average, comparing the current
average to the same period in the prior year where appropriate, to account for monthly and
seasonal fluctuations. In some cases, we use month-to-month comparisons to highlight more
immediate trends. For company-level complaint data, we use a three-month rolling average of
complaints sent to companies for response. This company-level complaint data lags other
complaint data in this report by two months to reflect the 60 days companies have to respond to
complaints, confirming a commercial relationship with the consumer. This is consistent with
complaints found in the public Consumer Complaint Database.3
1 The Dodd-Frank Wall Street Reform and Consumer Protection Act of 2010, Pub. L. No. 111-203 (“Dodd-Frank Act”) created the CFPB to protect consumers of financial products or services and to encourage the fair and competitive operation of consumer financial markets.
2 Consumer complaints are submissions that express dissatisfaction with, or communicate suspicion of wrongful conduct by, an identifiable entity related to a consumer’s personal experience with a financial product or service.
3 This report is based on dynamic data and may slightly differ from other public reports. Company-level information should be considered in context of company size and/or market share. Complaints referred to other regulators, such as complaints about depository institutions with less than $10 billion in assets, are not published in the Consumer Complaint Database.

3 MONTHLY COMPLAINT REPORT: MARCH 2016
Visit consumerfinance.gov/complaint to learn about how we handle complaints or to submit a
complaint. Visit our Consumer Complaint Database at consumerfinance.gov/complaintdatabase
to search, sort, filter, and export complaints.
1.1 Complaint volume by product As of March 1, 2016, the CFPB has handled approximately 834,400 complaints, including
approximately 22,800 complaints in February 2016. Table 1 shows the percentage change in
complaint volume by product from December 2014 to February 2015 to December 2015 to
February 2016.4
TABLE 1: CHANGE IN COMPLAINT VOLUME
4 Complaint totals include all complaints with product breakdowns focusing on the most-complained-about consumer financial products and services.
% change 3 month average:Dec 2014 - Feb 2015
3 month average:Dec 2015 - Feb 2016
Other financial services
Money transfer
Prepaid
Bank account or services
Credit card
Consumer loan
Mortgage
Debt collection
Student loans
Credit reporting
Payday loan
Total
-10%
-14%
66%
39%
35%
34%
26%
18%
18%
10%
-3%
6%
19,733
466
3,959
573
6,496
3,571
990
1,586
1,512
164
149
104
21,619
401
3,556
558
6,856
4,211
1,168
1,995
2,021
221
207
173
4 MONTHLY COMPLAINT REPORT: MARCH 2016
Other financial services complaints, which include complaints about check cashing,
credit repair, debt settlement, foreign exchange services, traveler’s checks, tax refund
anticipation checks, and money order providers, showed the greatest percentage increase
from December 2014 to February 2015 (104 complaints) to December 2015 to February
2016 (173 complaints), representing about a 66 percent increase.
Payday loan complaints showed the greatest percentage decrease from December 2014
to February 2015 (466 complaints) to December 2015 to February 2016 (401
complaints), representing about a 14 percent decline.
Table 2 shows the complaint volume this month by product. The graphic at the end of each row
under the heading “Monthly complaints” shows the volume trend from when the CFPB began
accepting complaints about that product (green dot) to the current month (blue dot). The
monthly average reflects complaints handled per month since we began accepting those
complaints.5
5 The CFPB has used a phased-in approach to expand its complaint handling over time to include multiple products and services under its authority. Complaint-handling capacity was expanded as follows: credit card complaints on July 21, 2011, mortgage complaints on December 1, 2011, bank accounts and services, private student loans, and consumer loans on March 1, 2012, credit reporting on October 22, 2012, money transfers on April 4, 2013, debt collection on July 10, 2013, payday loans on November 6, 2013, prepaid cards, credit repair, debt settlement, and pawn and title loans on July 19, 2014, and virtual currency on August 11, 2014. See Table 2.

5 MONTHLY COMPLAINT REPORT: MARCH 2016
TABLE 2: MONTHLY PRODUCT TRENDS6
6 Gray bars show +/- 1 standard deviation for monthly complaints since we began accepting those complaints. Total complaints column includes 5,487 complaints where no specific consumer financial product was selected by consumers.

6 MONTHLY COMPLAINT REPORT: MARCH 2016
As of March 1 2016, debt collection represented 26 percent of total cumulative
complaints, surpassing mortgage as the most-complained-about product. Debt collection
complaints represented about 32 percent of complaints submitted in February 2016.
Credit reporting complaints showed the greatest month-over-month percentage increase
(13 percent).
Bank account or services complaints showed the greatest month-over-month percentage
decrease (-13 percent).
Debt collection, mortgage, and credit reporting complaints continue to be the top three
most-complained-about consumer financial products and services, collectively
representing about 69 percent of complaints submitted in February 2016.

7 MONTHLY COMPLAINT REPORT: MARCH 2016
1.2 Complaint volume by state TABLE 3: CHANGE IN COMPLAINT VOLUME BY STATE
8 MONTHLY COMPLAINT REPORT: MARCH 2016
Connecticut (31 percent), Kansas (30 percent), and Georgia (25 percent) experienced the
greatest complaint volume percentage increase from December 2014 to February 2015 to
December 2015 to February 2016.
Hawaii (-25 percent), Maine (-19 percent), South Dakota (-14 percent) experienced the
greatest complaint volume percentage decrease from December 2014 to February 2015
to December 2015 to February 2016.7
Of the five most populated states, New York (12 percent) experienced the greatest
complaint volume percentage increase, and Texas (-8 percent) experienced the greatest
complaint volume percentage decrease from December 2014 to February 2015 to
December 2015 to February 2016.
7 Complaints per 100k population are defined as cumulative complaints divided by Census estimated 2015 population.
Census population data source: http://www.census.gov/popest/data/state/totals/2015/index.html

9 MONTHLY COMPLAINT REPORT: MARCH 2016
1.3 Complaint volume by company Complaint data in this section lags other complaint data by two months to reflect the 60 days
companies have to respond to complaints, confirming a commercial relationship with the
consumer. Figure 1 and Table 4 show the top 10 most-complained-about companies for October
- December 2015. Figure 1 also shows which products consumers complained about for each
company. The “Other” category includes consumer loans, student loans, money transfers,
payday loans, prepaid cards, and other financial service complaints. Complaints sent to these
companies account for 46 percent of all complaints sent to companies over this period.
Company-level information should be considered in context of company size and/or market
share.
FIGURE 1: TOP 10 MOST-COMPLAINED-ABOUT COMPANIES
% changevs. 3
monthperiod
last year
NA17%-21%17%10%-2%16%30%13%32%
Equifax Experian TransUnion WellsFargo
Bank ofAmerica
JPMorganChase
Citibank Ocwen CapitalOne
Empower-ment
Ventures..
0
200
400
600
800
1,000
Oct
ober
- D
ecem
ber
2015
ave
rage
mon
thly
com
plai
nts 988
841810
764 749
645
520
345302 290
ProductsBank acct/servicesCredit card
Credit reportingDebt collection
MortgageOther
10 MONTHLY COMPLAINT REPORT: MARCH 2016
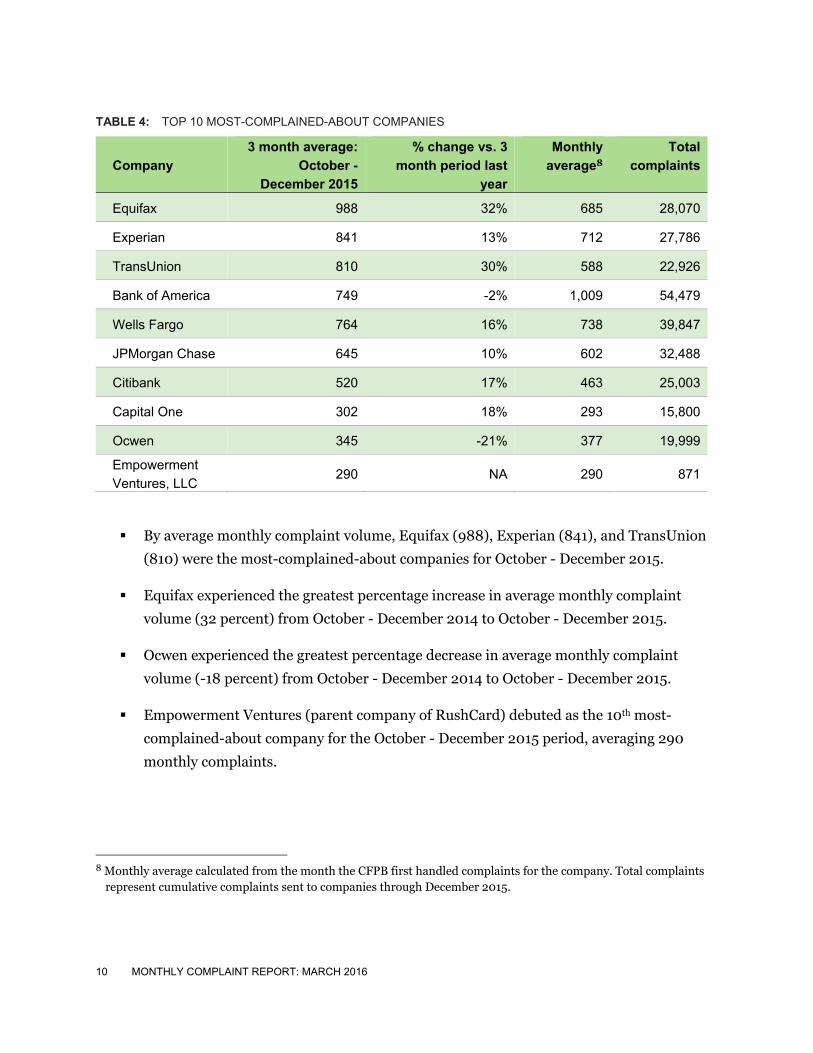
TABLE 4: TOP 10 MOST-COMPLAINED-ABOUT COMPANIES
Company
3 month average:
October -
December 2015
% change vs. 3
month period last
year
Monthly
average8
Total
complaints
Equifax 988 32% 685 28,070
Experian 841 13% 712 27,786
TransUnion 810 30% 588 22,926
Bank of America 749 -2% 1,009 54,479
Wells Fargo 764 16% 738 39,847
JPMorgan Chase 645 10% 602 32,488
Citibank 520 17% 463 25,003
Capital One 302 18% 293 15,800
Ocwen 345 -21% 377 19,999
Empowerment
Ventures, LLC 290 NA 290 871
By average monthly complaint volume, Equifax (988), Experian (841), and TransUnion
(810) were the most-complained-about companies for October - December 2015.
Equifax experienced the greatest percentage increase in average monthly complaint
volume (32 percent) from October - December 2014 to October - December 2015.
Ocwen experienced the greatest percentage decrease in average monthly complaint
volume (-18 percent) from October - December 2014 to October - December 2015.
Empowerment Ventures (parent company of RushCard) debuted as the 10th most-
complained-about company for the October - December 2015 period, averaging 290
monthly complaints.
8 Monthly average calculated from the month the CFPB first handled complaints for the company. Total complaints
represent cumulative complaints sent to companies through December 2015.
11 MONTHLY COMPLAINT REPORT: MARCH 2016
2. Product spotlight: Debt collection The CFPB has handled approximately 219,200 debt collection complaints since July 21, 2011. In
February 2016, debt collection represented about 26.3 percent of total cumulative complaints,
surpassing mortgage (26.2 percent) as the most-complained-about product. The CFPB began
accepting mortgage complaints in December 2011 and debt collection complaints in July 2013.
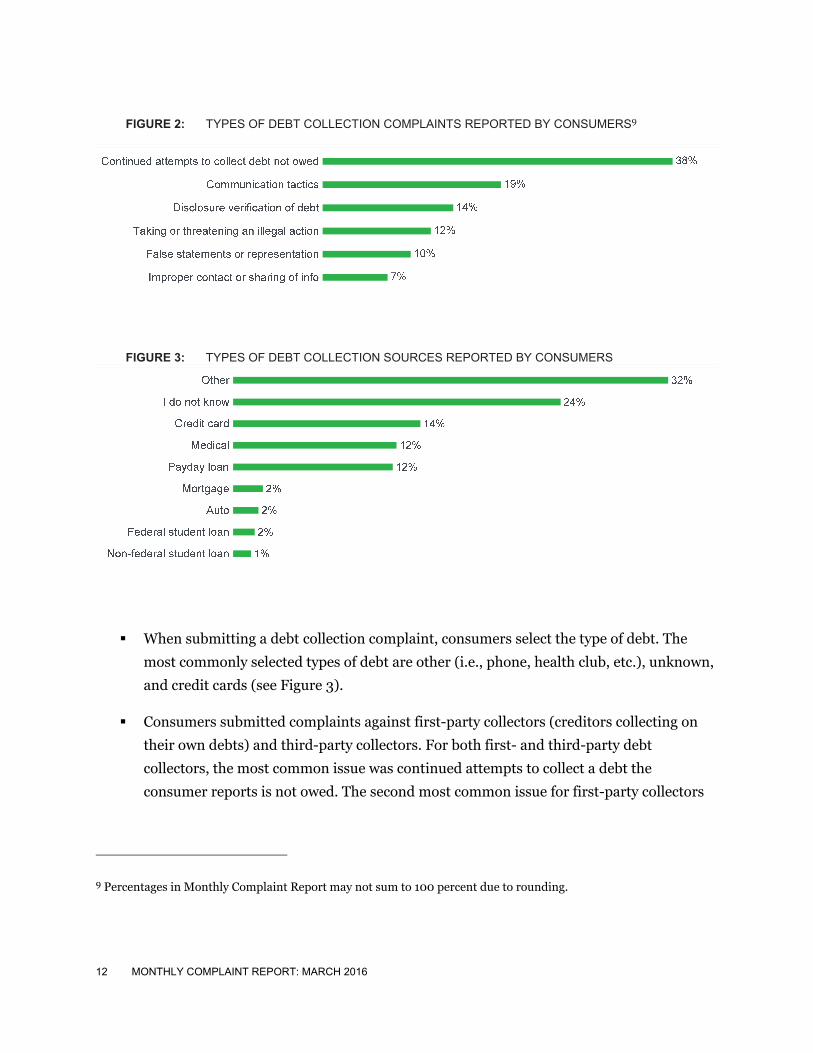
2.1 Debt collection complaints by type Figures 2 and 3 shows the types of debt collection complaints consumers submitted as a
percentage of all debt collection complaints handled. The most common issues identified by
consumers are ‘Continued attempts to collect debt not owed’ (38 percent) and ‘Communication
tactics’ (19 percent).
12 MONTHLY COMPLAINT REPORT: MARCH 2016
FIGURE 2: TYPES OF DEBT COLLECTION COMPLAINTS REPORTED BY CONSUMERS9
FIGURE 3: TYPES OF DEBT COLLECTION SOURCES REPORTED BY CONSUMERS
When submitting a debt collection complaint, consumers select the type of debt. The
most commonly selected types of debt are other (i.e., phone, health club, etc.), unknown,
and credit cards (see Figure 3).
Consumers submitted complaints against first-party collectors (creditors collecting on
their own debts) and third-party collectors. For both first- and third-party debt
collectors, the most common issue was continued attempts to collect a debt the
consumer reports is not owed. The second most common issue for first-party collectors
9 Percentages in Monthly Complaint Report may not sum to 100 percent due to rounding.
13 MONTHLY COMPLAINT REPORT: MARCH 2016
was communication tactics, whereas the second most common issue for third-party
collectors was disclosure/verification of debt.
Consumers complained about frequent or repeated calls from debt collectors. These
consumers reported that they receive multiple calls weekly or even daily. In complaints
submitted against first-party collectors, some consumers reported that they receive
repeated calls early in their delinquency or during grace periods.
Workplace phone calls are also a concern for consumers. In these complaints, some
consumers reported that they are not allowed to receive calls at work, while others said
their debt was disclosed to a supervisor or other third-party. Some consumers reported
that collectors made in-person visits to their workplace.
According to many complaints, requests to cease communications were not honored. For
both first- and third-party collectors, consumers reported continued communications
following an oral or written request to cease communications.
Consumers reported that they were not given enough information to verify a debt. In
complaints submitted against third-party collectors especially, some consumers reported
that they do not have enough information to verify medical debt—often stating that they
believed their health insurance covered the expenses.
In response to consumer complaints, third-party collectors often closed and returned the
account to their clients. First-party collectors often reported informing the consumer
about the current status of their account and making attempts to contact the consumer
to reach a resolution.

14 MONTHLY COMPLAINT REPORT: MARCH 2016
2.2 Debt collection complaints by state Table 5 shows the debt collection complaint volume percentage change by state.10 Some of the
highlights include:
Indiana (38 percent), Arizona (27 percent), and New Hampshire (26 percent)
experienced the greatest percentage increase in debt collection complaints from
December 2014 - February 2015 to December 2015 - February 2016.
Maine (-34 percent), Wyoming (-26 percent), and North Dakota (-23 percent)
experienced the greatest percentage decrease in debt collection complaints from
December 2014 - February 2015 to December 2015 - February 2016.
Of the five most populated states, California (10 percent) experienced the greatest
percentage increase and Illinois (-4 percent) experienced the greatest percentage
decrease in debt collection complaints from December 2014 - February 2015 to
December 2015 - February 2016.
10 Three-month averages are rounded, and percentage changes are based on non-rounded averages.

15 MONTHLY COMPLAINT REPORT: MARCH 2016
TABLE 5: PREPAID COMPLAINT VOLUME PERCENT CHANGE BY STATE

16 MONTHLY COMPLAINT REPORT: MARCH 2016
2.3 Debt collection complaints by company Each month, this product section highlights the most-complained-about companies to which we
sent complaints.
Companies are expected to respond to complaints sent to them within 15 days. If a complaint
cannot be closed within 15 days, the company may indicate that its work on the complaint is “In
progress” and provide a final response within 60 days. Company responses provided outside of
those windows are considered untimely.
The top 36 most-complained-about companies received about 40 percent of all debt collection
complaints sent to companies for response in October - December 2015. Highlighted in Tables
6-8 are the top 20 most-complained-about companies (see Table 11 in Appendix A for the full
list). Company-level information should be considered in context of company size and/or
market share.
17 MONTHLY COMPLAINT REPORT: MARCH 2016
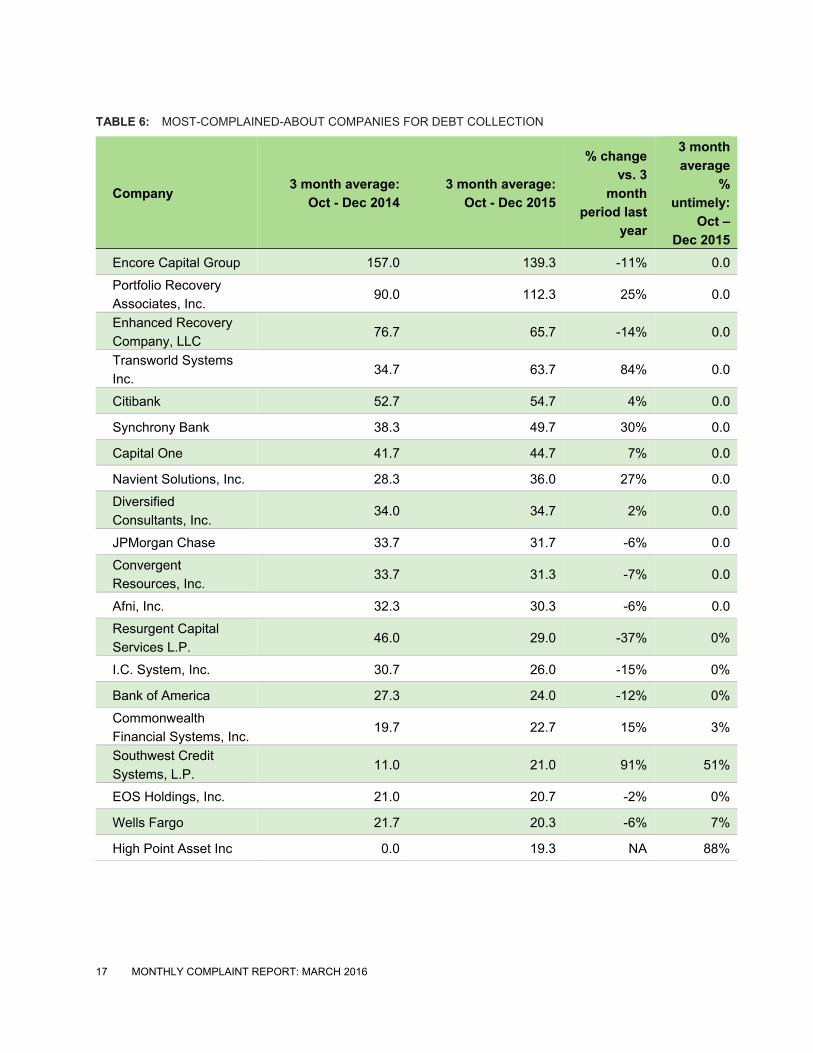
TABLE 6: MOST-COMPLAINED-ABOUT COMPANIES FOR DEBT COLLECTION
Company 3 month average:
Oct - Dec 2014
3 month average:
Oct - Dec 2015
% change
vs. 3
month
period last
year
3 month
average
%
untimely:
Oct –
Dec 2015
Encore Capital Group 157.0 139.3 -11% 0.0
Portfolio Recovery
Associates, Inc. 90.0 112.3 25% 0.0
Enhanced Recovery
Company, LLC 76.7 65.7 -14% 0.0
Transworld Systems
Inc. 34.7 63.7 84% 0.0
Citibank 52.7 54.7 4% 0.0
Synchrony Bank 38.3 49.7 30% 0.0
Capital One 41.7 44.7 7% 0.0
Navient Solutions, Inc. 28.3 36.0 27% 0.0
Diversified
Consultants, Inc. 34.0 34.7 2% 0.0
JPMorgan Chase 33.7 31.7 -6% 0.0
Convergent
Resources, Inc. 33.7 31.3 -7% 0.0
Afni, Inc. 32.3 30.3 -6% 0.0
Resurgent Capital
Services L.P. 46.0 29.0 -37% 0%
I.C. System, Inc. 30.7 26.0 -15% 0%
Bank of America 27.3 24.0 -12% 0%
Commonwealth
Financial Systems, Inc. 19.7 22.7 15% 3%
Southwest Credit
Systems, L.P. 11.0 21.0 91% 51%
EOS Holdings, Inc. 21.0 20.7 -2% 0%
Wells Fargo 21.7 20.3 -6% 7%
High Point Asset Inc 0.0 19.3 NA 88%

18 MONTHLY COMPLAINT REPORT: MARCH 2016
TABLE 7: COMPANIES WITH THE LARGEST PERCENT INCREASE IN DEBT COLLECTION COMPLAINTS
Name
% change
vs. 3 month
period last
year
3 month average:
Oct - Dec 2014
3 month average:
Oct - Dec 2015
Southwest Credit Systems, L.P. 91% 11.0 21.0
Transworld Systems Inc. 84% 34.7 63.7
Focus Holding Company 78% 7.7 13.7
Dynamic Recovery Solutions, LLC 68% 11.3 19.0
CMRE Financial Services, Inc. 31% 13.0 17.0
TABLE 8: COMPANIES WITH THE LARGEST PERCENT DECREASE IN DEBT COLLECTION COMPLAINTS
Name
% change
vs. 3 month
period last
year
3 month average:
Oct - Dec 2014
3 month average:
Oct - Dec 2015
Allied Interstate LLC -42% 30.7 17.7
CCS Financial Services, Inc. -41% 23.7 14.0
Resurgent Capital Services L.P. -37% 46.0 29.0
Cavalry Investments, LLC -36% 23.0 14.7
Hunter Warfield, Inc. -34% 21.3 14.0
Of these companies, Southwest Credit Systems, L.P. saw the greatest percentage increase
in debt collection complaints (91 percent) from October - December 2014 to October -
December 2015.
Of these companies, Allied Insterstate LLC saw the greatest percentage decrease in debt
collection complaints (-42 percent) during the same period.

19 MONTHLY COMPLAINT REPORT: MARCH 2016
3. Geographic spotlight: Florida Each month we spotlight the complaints from one part of the country. This month we are
highlighting complaint trends in Florida. As of March 1, 2016, about 80,200 complaints were
from Florida consumers, of which about 27,600 (34 percent), 10,400 (13 percent), and 9,700 (12
percent) were from Miami, Tampa, and Orlando, respectively. 11
11 The Miami, Tampa, and Orlando metro area is defined as zip codes from the Miami-Fort Lauderdale-Pompano Beach, FL, Tampa-St. Petersburg-Clearwater, FL, and Orlando-Kissimmee, FL Core-Based Statistical Areas (CBSA). http://www.census.gov/population/metro/files/zip07_cbsa06.zip. Complaint counts are based on consumer-provided ZIP code and unless otherwise noted the geographic spotlight section reflects cumulative complaint data since July 21, 2011.

20 MONTHLY COMPLAINT REPORT: MARCH 2016
3.1 Florida complaints by product Figure 3 shows the distribution of complaints by product for Miami, Florida, and the United
States as a whole.
FIGURE 4: MIAMI VS. FLORIDA AND NATIONAL SHARE OF COMPLAINTS BY PRODUCT
Consumers in Miami and Florida most often submitted mortgage complaints. These
made up 36 percent and 30 percent, respectively, of all complaints submitted from these
consumers, which was higher than the 26 percent national average.

21 MONTHLY COMPLAINT REPORT: MARCH 2016
Consumers in Miami and Florida complained about debt collection (21 percent and 24
percent respectively) at a lower percentage than the 26 percent national average.
3.2 Florida complaints over time Complaints from consumers in Florida have generally followed the national trend. Average
monthly complaints increased 9 percent from 2014 (2,000 complaints per month) to 2015
(2,200 complaints per month), similar to the national rate of 8 percent.
FIGURE 5: FLORIDA MONTHLY COMPLAINT VOLUME TREND
22 MONTHLY COMPLAINT REPORT: MARCH 2016
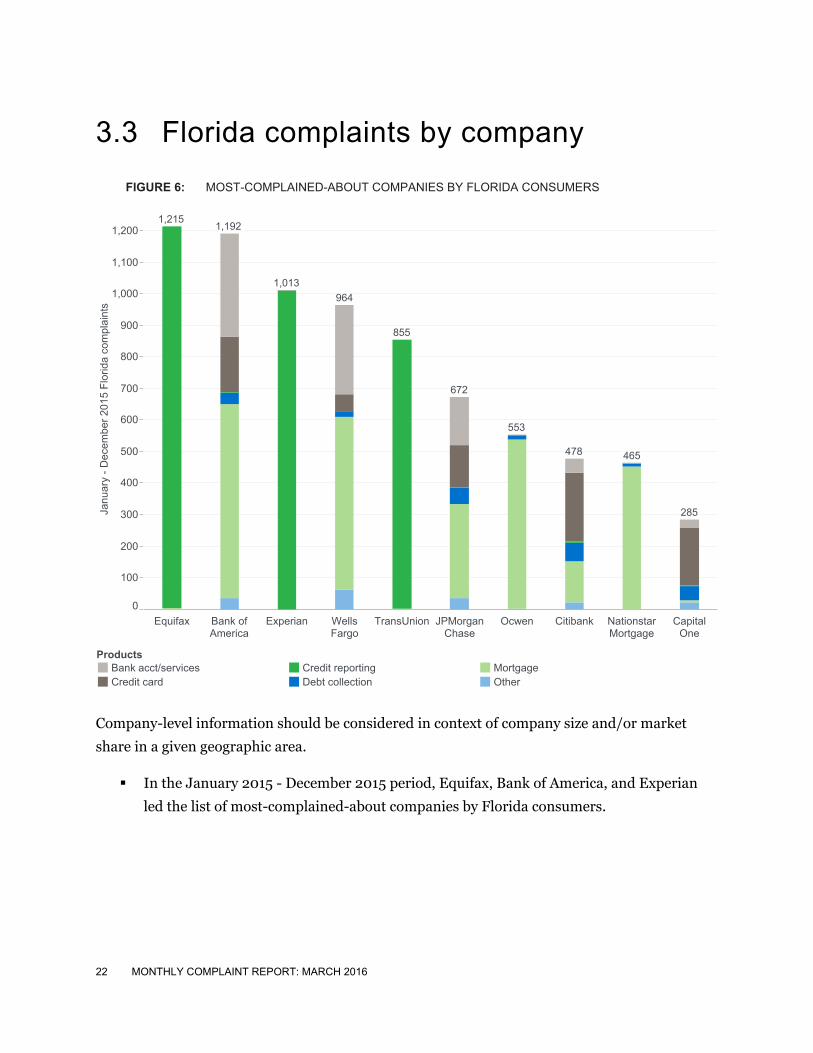
3.3 Florida complaints by company
FIGURE 6: MOST-COMPLAINED-ABOUT COMPANIES BY FLORIDA CONSUMERS
Company-level information should be considered in context of company size and/or market
share in a given geographic area.
In the January 2015 - December 2015 period, Equifax, Bank of America, and Experian
led the list of most-complained-about companies by Florida consumers.
Equifax Bank ofAmerica
Experian WellsFargo
TransUnion JPMorganChase
Ocwen Citibank NationstarMortgage
CapitalOne
0
100
200
300
400
500
600
700
800
900
1,000
1,100
1,200
Janu
ary
- D
ecem
ber
201
5 F
lorid
a co
mpl
aint
s
1,2151,192
1,013
964
855
672
553
478 465
285
ProductsBank acct/servicesCredit card
Credit reportingDebt collection
MortgageOther

23 MONTHLY COMPLAINT REPORT: MARCH 2016
APPENDIX A:
TABLE 9: TOTAL COMPLAINTS BY MONTH AND PRODUCT
Ban
k ac
cou
nt
or
serv
ices
Co
ns
um
er
loan
Cre
dit
car
d
Cre
dit
re
po
rtin
g
Deb
t co
llect
ion
Mo
ney
tr
ansf
er
Mo
rtg
ag
e
Oth
er
fin
anci
al
serv
ices
Pay
day
lo
an
Pre
pai
d
Stu
de
nt
loan
s
To
tal
11-Jul 13 3 519 2 4 0 14 4 0 2 2 566
11-Aug 140 27 1,840 12 6 1 128 9 0 5 5 2,191
11-Sep 193 45 1,732 18 17 2 179 28 4 7 3 2,249
11-Oct 159 26 1,755 11 8 3 178 24 0 7 4 2,195
11-Nov 199 40 1,749 5 9 1 276 17 1 0 5 2,323
11-Dec 206 29 1,620 8 6 2 1,700 0 0 14 4 3,604
12-Jan 191 30 1,455 4 4 0 2,513 1 3 6 11 4,241
12-Feb 215 37 1,439 10 12 2 2,721 0 0 5 8 4,468
12-Mar 1,464 219 1,624 12 32 7 3,464 6 7 18 666 7,561
12-Apr 1,500 250 1,353 13 31 3 3,396 2 8 13 316 6,901
12-May 1,971 366 1,667 19 36 5 4,698 3 8 12 241 9,095
12-Jun 1,698 341 1,979 12 34 2 4,666 7 6 10 757 9,567
12-Jul 1,618 327 1,796 32 32 3 4,160 6 4 5 317 8,341
12-Aug 1,590 361 1,581 33 25 0 4,632 8 3 6 297 8,570
12-Sep 1,360 304 1,257 21 17 0 3,661 11 4 12 260 6,929
12-Oct 1,559 379 1,695 537 18 2 4,011 6 6 7 398 8,649
12-Nov 1,249 328 1,394 1,259 24 1 3,519 4 1 4 331 8,145
12-Dec 1,231 340 1,309 1,373 62 1 3,722 4 14 8 274 8,386
13-Jan 1,643 393 1,437 1,557 94 3 7,155 6 9 4 379 12,775
13-Feb 1,447 346 1,442 1,712 111 11 5,703 11 16 9 335 11,238
13-Mar 1,700 440 1,615 1,734 155 6 5,693 3 15 18 372 11,906
13-Apr 1,421 453 1,507 1,900 179 77 5,628 3 16 16 373 11,700
13-May 1,416 447 1,368 1,880 111 60 5,258 2 26 16 302 10,982
13-Jun 1,488 426 1,311 2,042 108 93 5,251 4 22 5 286 11,090
13-Jul 1,655 444 1,276 2,234 2,427 99 5,233 2 17 11 341 13,767
13-Aug 1,665 518 1,347 2,256 4,161 91 4,957 2 40 8 349 15,429
13-Sep 1,668 606 1,347 2,327 6,285 120 4,339 3 36 5 372 17,142
13-Oct 1,800 541 1,383 2,271 4,852 155 3,866 4 35 5 419 15,377
13-Nov 1,566 473 1,245 2,343 6,685 169 3,486 1 396 3 345 16,757
13-Dec 1,540 504 1,326 1,944 5,993 134 3,418 3 386 4 413 15,694
14-Jan 1,825 584 1,539 3,223 8,123 165 4,238 0 437 8 485 20,663
14-Feb 1,829 584 1,631 3,515 7,824 145 4,593 2 374 3 499 21,019
14-Mar 2,052 662 1,666 3,562 8,422 170 4,917 3 411 6 584 22,483
14-Apr 1,986 688 1,665 3,855 8,317 171 4,771 8 407 1 540 22,437

24 MONTHLY COMPLAINT REPORT: MARCH 2016
Ban
k ac
cou
nt
or
serv
ices
Co
ns
um
er
loan
Cre
dit
car
d
Cre
dit
re
po
rtin
g
Deb
t co
llect
ion
Mo
ney
tr
ansf
er
Mo
rtg
ag
e
Oth
er
fin
anci
al
serv
ices
Pay
day
lo
an
Pre
pai
d
Stu
de
nt
loan
s
To
tal
14-May 1,960 594 1,504 3,400 7,378 176 4,108 2 325 5 545 20,032
14-Jun 1,943 692 1,498 3,455 7,734 184 4,131 4 344 5 583 20,589
14-Jul 2,025 867 1,569 3,821 8,011 154 4,410 62 586 92 577 22,278
14-Aug 1,565 1,011 1,694 4,653 7,240 151 4,362 104 648 140 631 22,394
14-Sep 1,593 969 1,550 4,377 6,349 164 4,100 110 586 150 594 20,748
14-Oct 1,625 1,036 1,435 3,561 6,712 132 4,490 124 534 137 652 20,632
14-Nov 1,393 911 1,359 3,570 6,131 122 3,500 102 477 133 548 18,403
14-Dec 1,459 977 1,456 3,691 6,080 161 3,586 92 468 144 546 18,851
15-Jan 1,621 1,003 1,519 4,161 6,541 144 3,522 107 457 165 575 19,968
15-Feb 1,456 989 1,782 4,024 6,866 141 3,604 113 474 182 599 20,380
15-Mar 1,724 1,091 1,894 4,816 7,961 195 4,276 157 538 199 720 23,743
15-Apr 1,745 943 1,758 4,736 7,203 190 4,239 147 480 191 686 22,512
15-May 1,705 1,027 1,825 4,490 7,176 208 4,271 156 417 177 649 22,301
15-Jun 1,968 1,096 1,881 4,272 7,437 211 4,665 166 460 197 621 23,180
15-Jul 1,998 1,347 1,975 6,556 8,196 235 4,479 202 479 188 648 26,485
15-Aug 2,042 1,341 1,930 5,600 7,558 217 4,937 196 446 178 657 25,308
15-Sep 1,911 1,245 1,946 4,678 6,713 198 4,568 149 447 180 608 22,855
15-Oct 2,247 1,299 1,963 4,447 6,859 229 4,447 160 510 891 574 23,884
15-Nov 1,981 1,088 1,819 3,720 6,291 190 3,934 191 419 257 453 20,566
15-Dec 1,992 1,044 1,888 3,429 6,407 193 3,821 162 385 229 471 20,281
16-Jan 2,175 1,192 2,064 3,406 6,802 223 4,284 182 423 229 581 21,787
16-Feb 1,896 1,269 2,033 3,832 7,360 205 4,529 174 394 206 623 22,788
Total12 83,281 34,592 89,211 134,431 219,229 5,727 218,407 3,059 13,009 4,538 23,434 834,405
12 Total column includes approximately 5,487 complaints where no specific consumer financial product was selected by consumers.
25 MONTHLY COMPLAINT REPORT: MARCH 2016
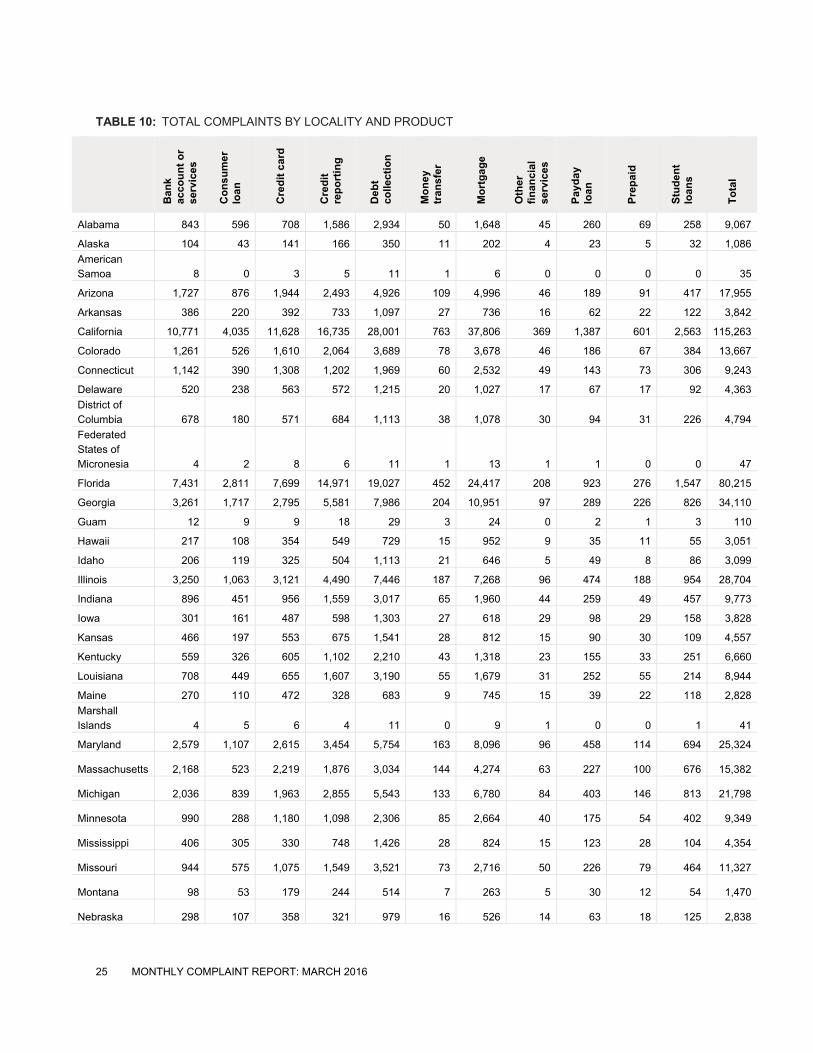
TABLE 10: TOTAL COMPLAINTS BY LOCALITY AND PRODUCT
Ban
k ac
cou
nt
or
serv
ices
Co
ns
um
er
loan
Cre
dit
car
d
Cre
dit
re
po
rtin
g
Deb
t co
llect
ion
Mo
ney
tr
ansf
er
Mo
rtg
ag
e
Oth
er
fin
anci
al
serv
ices
Pay
day
lo
an
Pre
pai
d
Stu
de
nt
loan
s
To
tal
Alabama 843 596 708 1,586 2,934 50 1,648 45 260 69 258 9,067
Alaska 104 43 141 166 350 11 202 4 23 5 32 1,086
American Samoa 8 0 3 5 11 1 6 0 0 0 0 35
Arizona 1,727 876 1,944 2,493 4,926 109 4,996 46 189 91 417 17,955
Arkansas 386 220 392 733 1,097 27 736 16 62 22 122 3,842
California 10,771 4,035 11,628 16,735 28,001 763 37,806 369 1,387 601 2,563 115,263
Colorado 1,261 526 1,610 2,064 3,689 78 3,678 46 186 67 384 13,667
Connecticut 1,142 390 1,308 1,202 1,969 60 2,532 49 143 73 306 9,243
Delaware 520 238 563 572 1,215 20 1,027 17 67 17 92 4,363
District of Columbia 678 180 571 684 1,113 38 1,078 30 94 31 226 4,794
Federated States of Micronesia 4 2 8 6 11 1 13 1 1 0 0 47
Florida 7,431 2,811 7,699 14,971 19,027 452 24,417 208 923 276 1,547 80,215
Georgia 3,261 1,717 2,795 5,581 7,986 204 10,951 97 289 226 826 34,110
Guam 12 9 9 18 29 3 24 0 2 1 3 110
Hawaii 217 108 354 549 729 15 952 9 35 11 55 3,051
Idaho 206 119 325 504 1,113 21 646 5 49 8 86 3,099
Illinois 3,250 1,063 3,121 4,490 7,446 187 7,268 96 474 188 954 28,704
Indiana 896 451 956 1,559 3,017 65 1,960 44 259 49 457 9,773
Iowa 301 161 487 598 1,303 27 618 29 98 29 158 3,828
Kansas 466 197 553 675 1,541 28 812 15 90 30 109 4,557
Kentucky 559 326 605 1,102 2,210 43 1,318 23 155 33 251 6,660
Louisiana 708 449 655 1,607 3,190 55 1,679 31 252 55 214 8,944
Maine 270 110 472 328 683 9 745 15 39 22 118 2,828
Marshall Islands 4 5 6 4 11 0 9 1 0 0 1 41
Maryland 2,579 1,107 2,615 3,454 5,754 163 8,096 96 458 114 694 25,324
Massachusetts 2,168 523 2,219 1,876 3,034 144 4,274 63 227 100 676 15,382
Michigan 2,036 839 1,963 2,855 5,543 133 6,780 84 403 146 813 21,798
Minnesota 990 288 1,180 1,098 2,306 85 2,664 40 175 54 402 9,349
Mississippi 406 305 330 748 1,426 28 824 15 123 28 104 4,354
Missouri 944 575 1,075 1,549 3,521 73 2,716 50 226 79 464 11,327
Montana 98 53 179 244 514 7 263 5 30 12 54 1,470
Nebraska 298 107 358 321 979 16 526 14 63 18 125 2,838

26 MONTHLY COMPLAINT REPORT: MARCH 2016
Ban
k ac
cou
nt
or
serv
ices
Co
ns
um
er
loan
Cre
dit
car
d
Cre
dit
re
po
rtin
g
Deb
t co
llect
ion
Mo
ney
tr
ansf
er
Mo
rtg
ag
e
Oth
er
fin
anci
al
serv
ices
Pay
day
lo
an
Pre
pai
d
Stu
de
nt
loan
s
To
tal
Nevada 952 407 957 1,799 2,903 63 2,482 26 193 65 193 10,126
New Hampshire 332 117 397 423 796 15 1,445 14 53 17 155 3,791
New Jersey 3,681 1,157 3,708 4,514 6,767 195 9,517 115 538 179 895 31,454
New Mexico 397 219 407 754 1,350 40 853 12 92 20 115 4,296
New York 6,808 1,747 7,824 9,015 11,096 442 13,183 245 408 307 1,836 53,209
North Carolina 2,227 1,205 2,435 3,704 5,600 150 6,283 98 382 120 513 22,862
North Dakota 58 34 88 172 296 2 106 6 8 3 31 809
Northern Mariana Islands 6 0 3 5 5 0 4 0 0 0 1 24
Ohio 2,531 1,257 3,038 3,347 7,470 153 6,037 90 490 151 1,037 25,755
Oklahoma 473 350 583 988 2,167 45 1,044 19 188 34 167 6,106
Oregon 987 330 1,053 1,224 2,671 47 2,596 46 131 59 310 9,521
Palau 1 1 1 3 1 0 4 0 0 0 0 11
Pennsylvania 3,568 1,258 3,349 4,447 7,703 187 6,915 120 514 154 1,285 29,649
Puerto Rico 278 97 290 551 412 10 374 7 4 6 30 2,090
Rhode Island 372 125 364 340 697 23 627 12 79 13 83 2,747
South Carolina 840 668 917 1,978 3,404 72 2,475 33 206 64 282 10,997
South Dakota 111 76 177 160 461 14 194 7 27 2 43 1,281
Tennessee 1,267 751 1,274 1,991 4,392 68 2,751 63 318 87 400 13,429
Texas 5,180 3,150 5,530 15,729 21,318 407 10,389 194 1,161 312 1,230 64,922
Utah 332 200 456 724 1,587 27 1,150 12 92 22 124 4,762
Vermont 170 68 201 185 288 10 356 5 18 12 67 1,386
Virgin Islands 30 6 35 44 43 3 44 2 4 1 2 215
Virginia 2,448 1,137 2,934 4,432 6,656 190 6,643 89 388 153 714 25,938
Washington 1,427 544 1,728 2,610 4,583 110 4,891 54 185 101 515 16,836
West Virginia 233 111 265 500 662 19 393 19 16 15 106 2,369
Wisconsin 848 415 1,322 1,160 2,920 69 2,285 36 225 87 362 9,795
Wyoming 54 48 80 154 315 5 170 4 26 2 35 903
U.S. Armed Forces – Americas 12 1 5 0 23 1 6 2 1 2 2 57
U.S. Armed Forces – Europe 30 20 30 58 64 3 68 3 0 2 16 295
U.S. Armed Forces – Pacific 15 12 31 34 81 1 46 0 1 0 7 228
Unspecified 3,069 652 2,897 3,009 5,820 440 3,812 163 479 93 367 21,418
Total 83,281 34,592 89,211 134,431 219,229 5,727 218,407 3,059 13,009 4,538 23,434 834,405

27 MONTHLY COMPLAINT REPORT: MARCH 2016
TABLE 11: MOST-COMPLAINED-ABOUT COMPANIES FOR DEBT COLLECTION
Company
3 month
average:
Oct - Dec
2014
3 month
average:
Oct - Dec
2015
% change
vs. 3 month
period last
year
3 month
average %
untimely:
Oct – Dec
2015
Encore Capital Group 157.0 139.3 -11% 0.0
Portfolio Recovery Associates,
Inc. 90.0 112.3 25% 0.0
Enhanced Recovery
Company, LLC 76.7 65.7 -14% 0.0
Transworld Systems Inc. 34.7 63.7 84% 0.0
Citibank 52.7 54.7 4% 0.0
Synchrony Bank 38.3 49.7 30% 0.0
Capital One 41.7 44.7 7% 0.0
Navient Solutions, Inc. 28.3 36.0 27% 0.0
Diversified Consultants, Inc. 34.0 34.7 2% 0.0
JPMorgan Chase 33.7 31.7 -6% 0.0
Convergent Resources, Inc. 33.7 31.3 -7% 0.0
Afni, Inc. 32.3 30.3 -6% 0.0
Resurgent Capital Services
L.P. 46.0 29.0 -37% 0%
I.C. System, Inc. 30.7 26.0 -15% 0%
Bank of America 27.3 24.0 -12% 0%
Commonwealth Financial
Systems, Inc. 19.7 22.7 15% 3%
Southwest Credit Systems,
L.P. 11.0 21.0 91% 51%
EOS Holdings, Inc. 21.0 20.7 -2% 0%
Wells Fargo 21.7 20.3 -6% 7%
High Point Asset Inc 0.0 19.3 NA 88%
Dynamic Recovery Solutions,
LLC 11.3 19.0 68% 9%
Receivables Performance
Management LLC 23.7 18.7 -21% 2%
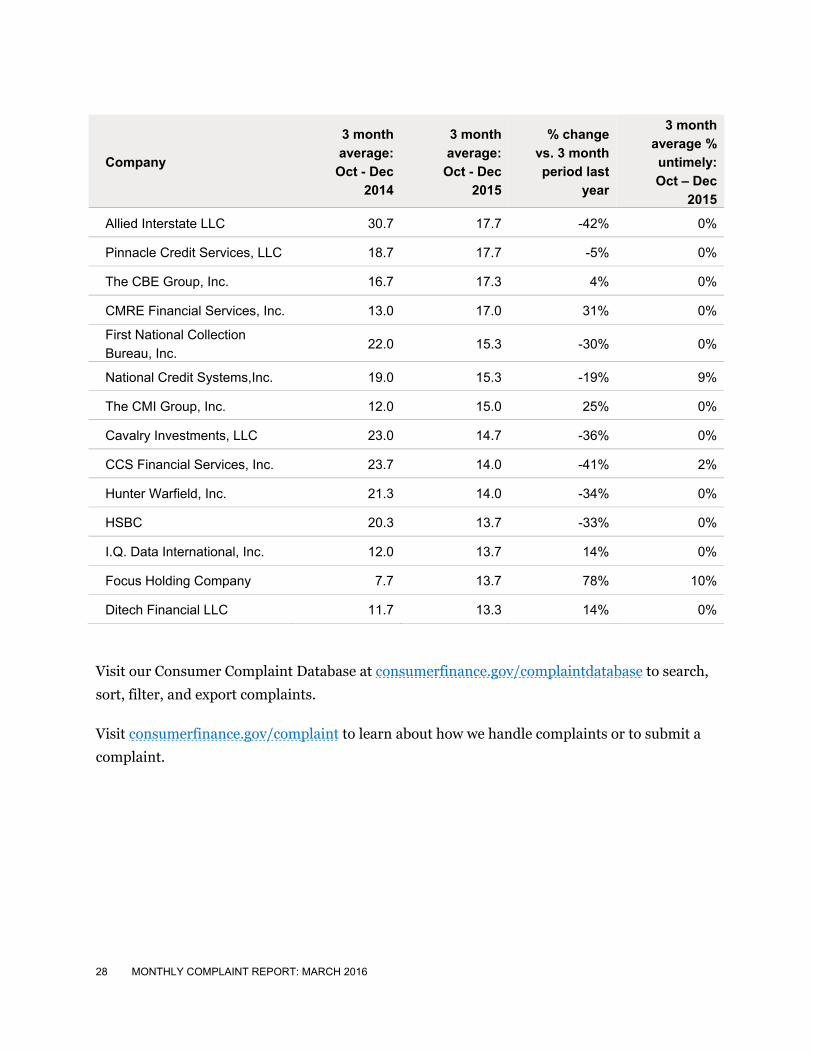
28 MONTHLY COMPLAINT REPORT: MARCH 2016
Company
3 month
average:
Oct - Dec
2014
3 month
average:
Oct - Dec
2015
% change
vs. 3 month
period last
year
3 month
average %
untimely:
Oct – Dec
2015
Allied Interstate LLC 30.7 17.7 -42% 0%
Pinnacle Credit Services, LLC 18.7 17.7 -5% 0%
The CBE Group, Inc. 16.7 17.3 4% 0%
CMRE Financial Services, Inc. 13.0 17.0 31% 0%
First National Collection
Bureau, Inc. 22.0 15.3 -30% 0%
National Credit Systems,Inc. 19.0 15.3 -19% 9%
The CMI Group, Inc. 12.0 15.0 25% 0%
Cavalry Investments, LLC 23.0 14.7 -36% 0%
CCS Financial Services, Inc. 23.7 14.0 -41% 2%
Hunter Warfield, Inc. 21.3 14.0 -34% 0%
HSBC 20.3 13.7 -33% 0%
I.Q. Data International, Inc. 12.0 13.7 14% 0%
Focus Holding Company 7.7 13.7 78% 10%
Ditech Financial LLC 11.7 13.3 14% 0%
Visit our Consumer Complaint Database at consumerfinance.gov/complaintdatabase to search,
sort, filter, and export complaints.
Visit consumerfinance.gov/complaint to learn about how we handle complaints or to submit a
complaint.


