23
2 ALASKA ECONOMIC TRENDSMARCH 2018
MARCH 2018Volume 38 Number 3
ISSN 0160-3345
Alaska Economic Trends is a monthly publica on meant to objec vely inform the public about a variety of economic issues in the state. Trends is funded by the Employment and Training Services Division of the Alaska Department of Labor and Workforce Development and is published by the department’s Research and Analysis Sec on. Material in this publica on is public informa on, and with appropriate credit may be reproduced without permission.
Sam DapcevichCover Ar st
Sara WhitneyEditor
To sign up for a free electronic subscrip on, read past issues online, or purchase a print subscrip on, visitlabor.alaska.gov/trends. Contact the editor at (907) 465-6561 or [email protected].
Dan RobinsonChief, Research and Analysis
Bill WalkerGovernor
Heidi DrygasCommissioner
ON THE COVER: Alaska Marine Highway voyage, photo by Flickr user Mr Hicks46. h ps://crea vecommons.org/licenses/by-nc-sa/4.0/legalcode
ON PAGE 4: Origami birds, h ps://www.freevector.com/paper-birds
ALASKA DEPARTMENTof LABOR
and WORKFORCEDEVELOPMENT
MIGRATION in ALASKAPAGE 4
By ERIC SANDBERGHow migra on has shaped us and how we compare to other states
GAUGING ALASKA’S ECONOMY PAGE 18
POPULATION ESTIMATES for 2017PAGE 14
By EDDIE HUNSINGERSmall decline is the fi rst since the late 1980s

3ALASKA ECONOMIC TRENDS MARCH 2018
Heidi DrygasCommissioner
Follow the Alaska Department of Labor and Workforce Development on Facebook (facebook.com/alaskalabor) and Twi er (twi er.com/alaskalabor) for the latest news about jobs, workplace safety, and workforce development.
It’s me to boost Alaska Hire in the oil industryLast month, the department released the 2016 Nonresidents Working in Alaska re-port. Overall, 21.5 percent of workers in Alaska are nonresidents, which is a slight drop from the previous year and the fi rst time the rate has decreased since 2009.
Many industries employ large numbers of outside workers over Alaskans. The sea-food processing industry again had the highest rate of nonresident employment at just over 75 percent. Other industries, such as mining and tourism, have high percentages of nonresident workers as well. However, nonresident hire in the oil and gas industry represents the largest percentage of lost wages for our state.
In Alaska’s oil and gas industry, data show nonresident hire has grown to 37.1 percent. This is particularly troubling because the wages and benefi ts in this sector are high and Alaska has a ready supply of skilled workers able to perform this work. Oil producers and their sup-port contractors should act now to in-crease Alaska Hire and invest in the state that has produced billions of dollars of revenue for their shareholders.
It is important to look at this issue with historical perspective. Most oil-rich states and nations have not succeeded in translating oil wealth into wealth for their communities. Venezuela, Nigeria, Mex-ico, and Louisiana are just a few of the places that have high rates of poverty and inequality despite lucrative oil wealth and are the source of what economists call the “resource curse.” In contrast, Norway and Alaska (and certainly the North Slope Borough) have been more successful at keeping some of our oil wealth in our communities, using a range of policies from tax rates to the Perma-nent Fund. Looking back at the history, one lesson is clear: Without active inter-vention by policymakers, oil wealth will largely disappear from the state or com-munity in which it is extracted.
Under Governor Walker’s direction with Administrative Order 278, the Depart-ment of Natural Resources has begun implementing innovative leasing incen-tives to reward oil companies that use ap-prenticeship on projects. Apprentices are almost always Alaska residents, and this is a natural way to boost Alaska Hire in the oil industry.
In 2015, Governor Walker and I rein-stated the Alaska Hire requirement that Alaska residents hold 90 percent of jobs in public construction projects. While it will take several years to fully realize the results of these policies, they are impor-tant steps and should be sustained and expanded by future administrations.
Alaskans should demand that oil com-panies take leadership on this issue and enact similar policies to increase Alaska Hire. When they profi t from Alaska, they should demonstrate loyalty to our state by making every effort to ensure these lucra-tive jobs go to Alaskans. Unlike the state, oil companies can and should require Alaska Hire when they issue contracts to oilfi eld service companies. I suggest they implement the same Alaska Hire require-ment of 90 percent that the State of Alaska mandates for its own construction proj-ects. As members of the Alaskan commu-nity, these companies have a responsibility to not just pay lip service to Alaska Hire but to use their contracting and person-nel policies to require Alaska Hire both within their companies and within their service contractors.
History shows that without concerted action, too much of our oil wealth will leave Alaska, including the billions of dollars in wages we’re losing to nonresi-dent workers. During a time of rising unemployment, it is unacceptable for oil companies to continue hiring outsiders instead of skilled, experienced Alaskans. Let’s make it clear to producers and sup-port contractors that they must do better.
4 ALASKA ECONOMIC TRENDSMARCH 2018
By ERIC SANDBERG
Mig ationMig ation in in AlaskaAlaska
1 1947 2017Alaska’s Historical Net Migra on
Source: Alaska Department of Labor and Workforce Development, Research and Analysis Sec on
-30,000
-20,000
-10,000
0
+10,000
+20,000
+30,000
+40,000
1995 2015
Korean War
Vietnam War
Pipelinecompleted
Oil bust
Base closures
1989-1991recovery
U.S. GreatRecession
Alaskarecession
1950 1955 1960 1965 1970 1975 1980 1985 1990 2000 2005 2010
Oil boom
Pipeline
How migra on has shaped us and how we compare to other states
Alaska has the highest popu-la on turnover of any state, with large numbers of
people moving both in and out each year regardless of economic condi ons. Although the percent-age of residents born in Alaska has risen over me — 41 percent today versus 32 percent in 1980 — Alaska’s popula on remains highly migratory compared to the rest of the U.S.
Two measuresof migra onMigra on sounds like a mass of people moving in one direc on, but it’s more of a two-way street with traffi c fl owing in both lanes. One lane might have more traffi c, but cars are always moving both direc ons.
Gross migra on is the sum of a place’s in-migra on and out-migra on. In other words, it’s the total num-ber of moves associated with that place in a year, which shows how much of the popula on turned over due to migra on. So if fi ve people le a town in a year and two moved in, that town’s gross migra on would be seven. The measure is generally consistent
for Alaska, at 80,000 to 100,000 total moves each year — typically 40,000 to 50,000 moving in each di-rec on.
Net migra on, or in-migra on minus out-migra on, is the overall number of people a popula on gained or lost through migra on. Posi ve net migra on means more people are moving to a loca on than leaving it,

5ALASKA ECONOMIC TRENDS MARCH 2018
Mig ation in Alaska 2 1990 2016Average Annual Gross and Net Migra on Rates by State
Source: Alaska Department of Labor and Workforce Development, Research and Analysis Sec on
-2%
0%
2%
4%
6%
8%
10%
12%
14%Al
aska
Nev
ada
Wyo
min
gHa
wai
iN
ew M
exico
Ariz
ona
Colo
rado
Idah
oVi
rgin
iaM
onta
naN
orth
Dak
ota
Dela
war
eKa
nsas
New
Ham
pshi
reGe
orgi
aFl
orid
aSo
uth
Dako
taSo
uth
Caro
lina
Was
hing
ton
Ore
gon
Nor
th C
arol
ina
Okl
ahom
aM
aryl
and
Uta
hVe
rmon
tAr
kans
asTe
nnes
see
Rhod
e isl
and
Mis
sissip
piN
ebra
ska
Kent
ucky
Mis
sour
iW
est V
irgin
iaAl
abam
aCo
nnec
cut
Loui
siana
Mai
neTe
xas
Iow
aN
ew Je
rsey
Mas
sach
use
sIn
dian
aIll
inoi
sN
ew Y
ork
Min
neso
taPe
nnsy
lvan
iaW
iscon
sinCa
lifor
nia
Ohi
oM
ichi
gan
Gross migra on(Total, in plus out)
Net migra on(In minus out)
Source: Internal Revenue Service Tax Sta s cs
and nega ve net migra on is the opposite.
Net migra on is one of the two ways a place’s popula- on count can change. The other is natural increase,
or births minus deaths. (For more on natural increase and an overview of Alaska’s 2017 popula on es -mates, see page 14.)
While gross migra on is fairly consistent, net migra- on can swing wildly between posi ve and nega ve
depending on economic condi ons in Alaska and out-side — although in recent decades the swings have been more moderate than during earlier periods in Alaska history.
For the past fi ve years, Alaska’s net migra on has been nega ve. This represents the longest streak of Alaska losing more migrants than it gains since World War II, when yearly numbers fi rst became available. Since 2012, nearly 29,000 more people have le Alas-ka than arrived. That’s a smaller loss than during the oil bust years of the late 1980s, but the sustained net loss is a sure indicator of tough economic mes. (See Exhibit 1.)
Migra on shaped Alaska historyLarge migra ons have been a major part of Alaska’s history, star ng with the peopling of the Americas by movement across the Bering Land Bridge from Asia during the last Ice Age. In modern mes, warfare and economic booms and busts have spurred the largest fl ows of movers.
Two par cularly large migra ons in the fi rst half of the 20th century shaped modern Alaska. The fi rst fol-lowed gold strikes on the Klondike and the Seward Peninsula around the turn of the century. For the fi rst me, large numbers of outsiders moved into the territory and Alaska’s economic poten al came into view. The second was World War II. The infl ux of mili-tary personnel produced a boom in construc on of housing, roads, and airfi elds while realigning Alaska’s popula on geography to make Anchorage and Fair-banks the largest ci es. Both events about doubled the state’s popula on over 10 years.
A er WWII, it seemed possible that Alaska would return to its pre-war popula on with troop demobi-

6 ALASKA ECONOMIC TRENDSMARCH 2018
3 Y , 2000 2016Alaska Exchanges Most Movers with Close or Populous States
Source: Internal Revenue Service Tax Sta s cs
WA2,778
(3,620)ME148
(153)
VT60
(70)NH88
(87)MA213
(200)
RI40
(36)
NY589
(574)
CT98
(81)NJ197
(203)
PA411
(381)
MD307
(347)DC40
(50)
VA773
(877)
OH464
(438)
MI571
(479)
WI386
(338)
WV80
(84)
DE68
(59)
NC1,001(980)
SC388
(414)
FL1,444
(1,561)
GA953
(968)
AL428
(453)MS225
(200)
LA380
(402)
AR256
(293)
TN416
(496)
KY359
(331)
IN253
(247)
IL456
(420)
MN496
(460)
IA164
(171)
MO488
(513)
TX2,398
(2,750)
OK570
(556)
KS381
(386)
NE197
(189)
SD174
(205)
ND181
(241)
MT583
(596)
WY244
(249)
ID678
(870)
OR1,317
(1,626)
NV564
(794)
NM396
(507)
CO1,062
(1,190)
UT581
(580)
AZ1,013
(1,379)
CA2,731
(2,555)
HI653
(669)
0 to 20 20 to 40 40 to 60 60 to 80 80 and above
Gross Migration with Alaska per 100,000 people
FOREIGN1,373
(1,079)
STATEMigration to Alaska
(Migration from Alaska)
liza on, but the onset of the Cold War and a perma-nent military popula on ensured that didn’t happen. Between 1945 and 1970, most migra on infl ows came from military buildups. The two largest were due to the Korean and Vietnam Wars. Military buildup for the Korean War ne ed more than 40,000 people between 1950 and 1952. Given Alaska’s popula on at the me, this has been the largest post-WWII net increase by percentage. The late-1960s increase from the Vietnam War was smaller.
The arrival of the oil economy in the 1970s and 1980s brought in swaths of newcomers and large swings in net migra on. As construc on started on the Trans-Alaska Pipeline, Alaska recorded its highest one-year net migra on increase of more than 30,000 between 1974 and 1975. The net infl ow con nued un l the pipeline’s comple on in 1977, when net migra on turned nega ve for the rest of the decade.
High oil prices, a housing boom, and a recession in the rest of the country spurred Alaska’s highest sustained net migra on infl ow in the early 1980s. Between 1980 and 1985, Alaska ne ed 75,000 people through migra on alone. Then, the subsequent oil bust in the late ‘80s brought on the state’s steepest migra on decline: a net ou low of about 44,000 people from 1985 to 1989.
These swings so ened between 1990 and 2012, when net migra on typically produced less popula on change than natural increase. Net fl ow was nega ve in seven out of eight years star ng with base closures in the mid-1990s and las ng un l 2001, but natural in-crease kept Alaska’s popula on growing.
A er the quiet 2000s, at least in terms of net migra- on, the Great Recession in the Lower 48 brought an
infl ux of newcomers to Alaska, where the economy

7ALASKA ECONOMIC TRENDS MARCH 2018
4 A ’ , 2010 2015Young to Middle-Age Adults Move the Most
Source: Alaska Department of Labor and Workforce Development, Research and Analysis Sec on
0
10,000
20,000
30,000
40,000
50,000
60,000
0
1,000
2,000
3,000
4,000
5,000
6,000
7,000
0-4 5-9 10-14 15-19 20-24 25-29 30-34 35-39 40-44 45-49 50-54 55-59 60-64 65-69 70-74 75-79 80-84 85-89 90+
Tota
l Num
ber o
f Peo
ple
Num
ber o
f Mig
rant
s
Age
In-migra on Out-migra on
by age group
largely weathered the na onal storm. But since 2012, Alaska’s net migra on has been consistently nega ve, breaking the past quarter-century’s pa ern. The loss-es picked up steam as the state’s economy worsened while condi ons improved elsewhere in the country.
That steady net ou low fi rst slowed and then ended the state’s long streak of total popula on growth. Through the 1990s and 2000s, Alaska’s popula on grew at a rate above 1 percent, which fell to half a percent during the 2010s. The net loss of 8,900 peo-ple in 2017, the largest single-year ou low since 1988, caused Alaska’s total popula on to decline for the fi rst me in decades.
Highest turnover amongstates through migra onExpressing migra on as rates — percent of the popu-la on turned over in a year for gross migra on and percent change from net migra on — allows compari-sons between places of varying size.
Exhibit 2 shows the average annual gross migra on and net migra on rates for all 50 states from 1990 to 2016. Alaska’s gross migra on rate was the highest, with just over 12 percent of the popula on turning over through migra on each year. That was more than twice the average na onal rate of 5 percent.
Nevada, whose housing boomed for much of that period, ranked second at about 11 percent. Either Alaska or Nevada has ranked fi rst for gross migra on every year since 1990. Through the 1990s and early 2000s, the two states o en traded places for the top slot. Nevada fell several spots below Alaska a er the 2008 housing collapse, but remains in second for the en re period.
While Alaska is s ll the top state for popula on turnover through migra on, the gap has steadily nar-rowed. In the early 1990s, Alaska’s gross migra on rate was over 16 percent a year, a 10 percentage point gap over the na onal average of 6 percent. The na onal rate has stayed about the same, dropping just one percentage point in 2016, while Alaska’s fell to 11 percent the same year.
Average annual net migra on rates across all states tend to be between -1 percent and 1 percent. Just two states, Nevada and Arizona, have averaged above 1 percent since 1990.
States with high turnover tend to also gain popula on through migra on while low turnover states usually see losses, but Alaska and Hawaii have high gross mi-gra on without high net migra on. Of the 10 states with the highest average annual gross migra on rates since 1990, Alaska and Hawaii are the only states with nega ve net migra on rates.
8 ALASKA ECONOMIC TRENDSMARCH 2018
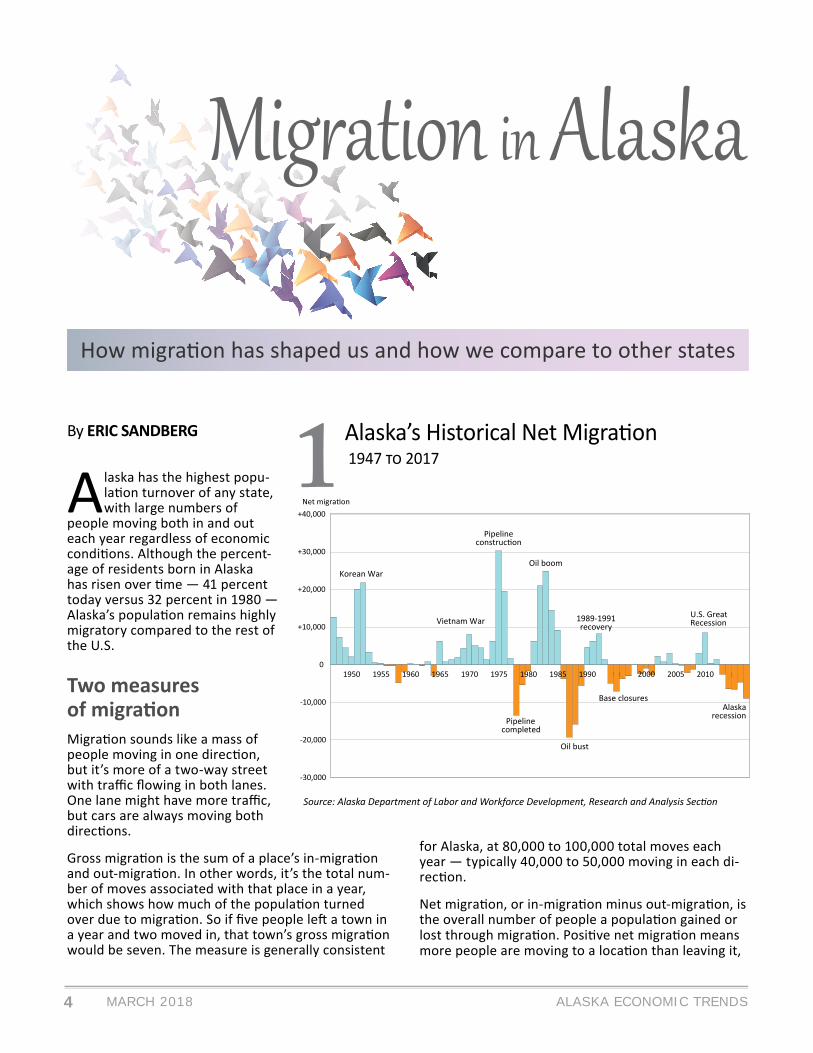
5 A , 2005 2010 2010 2015Net Migra on Has Dropped Across All Ages
Source: Alaska Department of Labor and Workforce Development, Research and Analysis Sec on
-1,000
-800
-600
-400
-200
0
200
400
600
800
1,000
0-4 5-9 10-14 15-19 20-24 25-29 30-34 35-39 40-44 45-49 50-54 55-59 60-64 65-69 70-74 75-79 80-84 85-89 90+
2005-2010 2010-2015
Washington top source, des na onProximity and large popula ons largely explain where people leaving Alaska go, and vice versa. Exhibit 3 shows Alaska’s average yearly migra on exchanges with the rest of the country and abroad from 2000 through 2016. Average yearly infl ow to Alaska is un-der each state’s ini als, and ou low from Alaska to that state is in parentheses. Color coding shows each state’s yearly gross migra on exchanges with Alaska per 100,000 people.
In addi on to proximity, Washington and Alaska share historical, cultural, and transporta on links. Washington is the largest source of Alaska’s incoming migrants by a small margin, and it’s by far the most common des na on for people leaving Alaska. About one in nine people who leave Alaska move to Wash-ington.
A er Washington are some of the most populous states. California is close behind Washington as a source of in-migrants, followed by Texas and Florida. For people leaving Alaska, Texas is the second largest des na on, followed by California.
Average yearly gross migra on each state has with Alaska, adjusted for popula on, shows a strong geo-graphic component. States in the Northwest, along with Hawaii, have the largest adjusted migrant fl ows with Alaska. Montana’s gross migra on rate with Alaska is the highest (155 people per 100,000), fol-lowed by Idaho (131), Hawaii (125), and Washington
(122). Other western states also rank higher than average in gross migra on with Alaska. The excep on is California, which has a gross migra on rate much lower than surrounding states despite ranking high in total number of migrants to and from Alaska. This is because California has such a large popula on that even big numbers of movers each year are low in per-cent terms.
The states with the lowest migra on with Alaska, both in terms of numbers and gross migra on rate, are primarily in the Northeast. Less populous states in the region and the District of Columbia send few people to Alaska and few Alaskans move there. New Jersey has the lowest rate at 5.6 people exchanged per 100,000, followed by Connec cut (6.3) and New York (7.8).
Younger adults, mentend to move more o enExhibit 4 shows Alaska’s average yearly in-migra on and out-migra on by fi ve-year age groups for 2010 through 2015. For reference, the total number of Alaskans by age is the do ed line, with corresponding numbers on the right axis.
Young people move far more o en than older people. This pa ern is not unique to Alaska but it’s more pro-nounced because the state’s popula on is young. Migra- on peaks among people in their 20s and falls off quick-
9ALASKA ECONOMIC TRENDS MARCH 2018
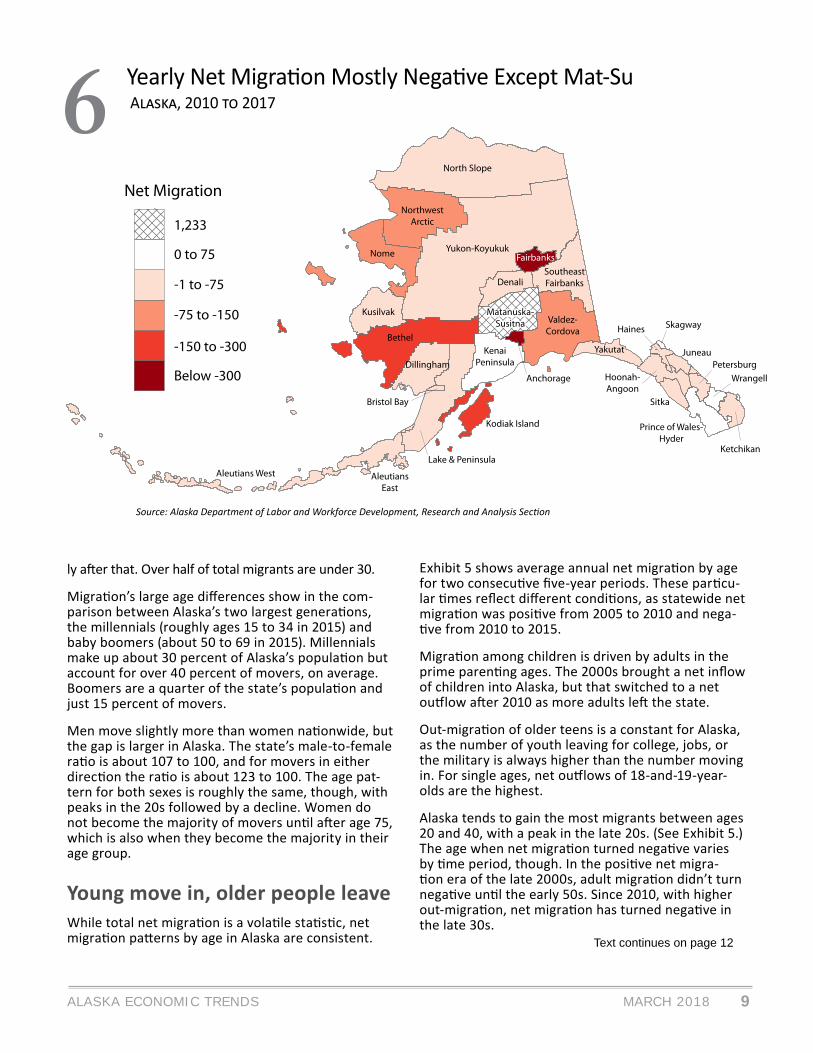
6 A , 2010 2017Yearly Net Migra on Mostly Nega ve Except Mat-Su
Source: Alaska Department of Labor and Workforce Development, Research and Analysis Sec on
North Slope
NorthwestArctic
Nome
Kusilvak
Bethel
Yukon-Koyukuk
Dillingham
Aleutians West AleutiansEast
Bristol Bay
Lake & Peninsula
Kodiak Island
KenaiPeninsula
Matanuska-Susitna
Matanuska-Susitna
Denali
Valdez-Cordova
SoutheastFairbanks
Fairbanks
Yakutat
Anchorage Hoonah-Angoon
Sitka
Prince of Wales-Hyder
Haines Skagway
Juneau
Ketchikan
PetersburgWrangell
0 to 75
-1 to -75
-75 to -150
-150 to -300
Net Migration
1,233
Below -300
ly a er that. Over half of total migrants are under 30.
Migra on’s large age diff erences show in the com-parison between Alaska’s two largest genera ons, the millennials (roughly ages 15 to 34 in 2015) and baby boomers (about 50 to 69 in 2015). Millennials make up about 30 percent of Alaska’s popula on but account for over 40 percent of movers, on average. Boomers are a quarter of the state’s popula on and just 15 percent of movers.
Men move slightly more than women na onwide, but the gap is larger in Alaska. The state’s male-to-female ra o is about 107 to 100, and for movers in either direc on the ra o is about 123 to 100. The age pat-tern for both sexes is roughly the same, though, with peaks in the 20s followed by a decline. Women do not become the majority of movers un l a er age 75, which is also when they become the majority in their age group.
Young move in, older people leaveWhile total net migra on is a vola le sta s c, net migra on pa erns by age in Alaska are consistent.
Exhibit 5 shows average annual net migra on by age for two consecu ve fi ve-year periods. These par cu-lar mes refl ect diff erent condi ons, as statewide net migra on was posi ve from 2005 to 2010 and nega- ve from 2010 to 2015.
Migra on among children is driven by adults in the prime paren ng ages. The 2000s brought a net infl ow of children into Alaska, but that switched to a net ou low a er 2010 as more adults le the state.
Out-migra on of older teens is a constant for Alaska, as the number of youth leaving for college, jobs, or the military is always higher than the number moving in. For single ages, net ou lows of 18-and-19-year-olds are the highest.
Alaska tends to gain the most migrants between ages 20 and 40, with a peak in the late 20s. (See Exhibit 5.) The age when net migra on turned nega ve varies by me period, though. In the posi ve net migra- on era of the late 2000s, adult migra on didn’t turn
nega ve un l the early 50s. Since 2010, with higher out-migra on, net migra on has turned nega ve in the late 30s.
Text continues on page 12
10 ALASKA ECONOMIC TRENDSMARCH 2018
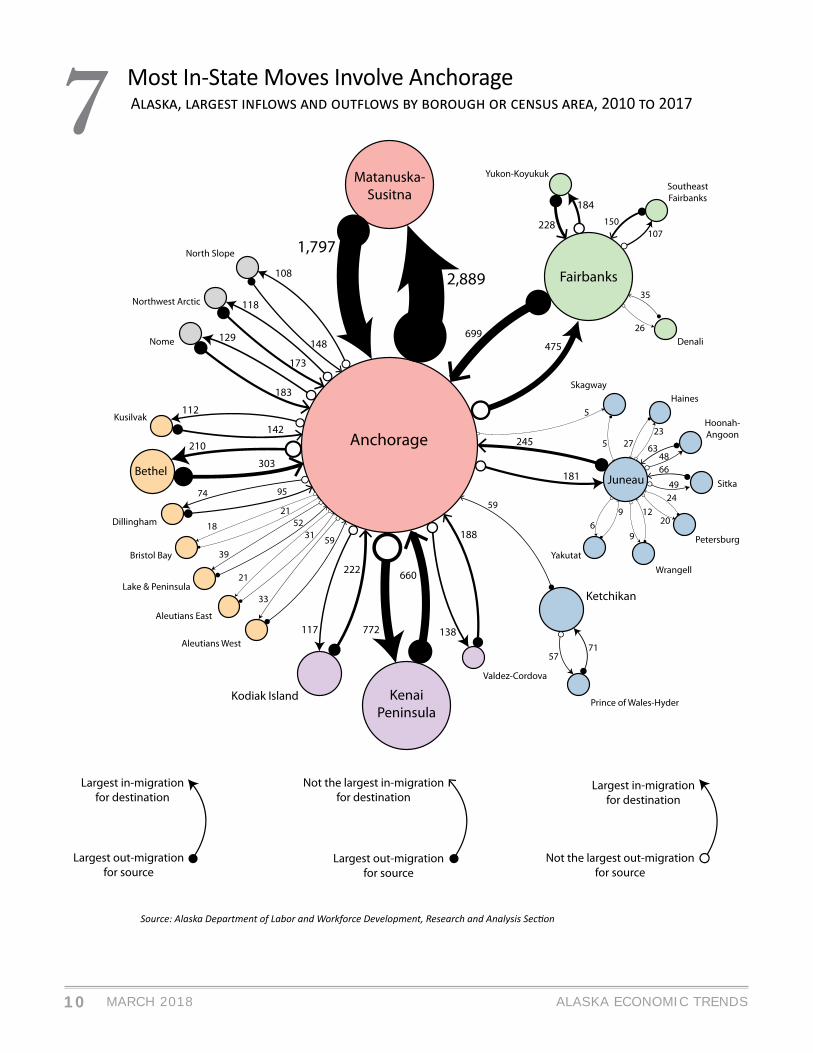
7 A , , 2010 2017Most In-State Moves Involve Anchorage
Source: Alaska Department of Labor and Workforce Development, Research and Analysis Sec on
Anchorage
Matanuska-Susitna
KenaiPeninsula
Fairbanks
Yukon-Koyukuk SoutheastFairbanks
Denali
SkagwayHaines
Hoonah-Angoon
Sitka
Petersburg
WrangellYakutat
Ketchikan
Juneau
Prince of Wales-Hyder
Valdez-Cordova
Kodiak Island
Bethel
North Slope
Northwest Arctic
Nome
Kusilvak
Dillingham
Bristol Bay
Lake & Peninsula
Aleutians East
Aleutians West
2,889
1,797108
148
118
173
129
183
112
142
210
31
21
33
59
52
39
21
18
303
74 95
222
117 772
660
138
188
5771
59
181
245
5
5 27 23
634866
4924
2012
9
96
699475
228
184
107150
35
26
Largest out-migrationfor source
Not the largest in-migrationfor destination
Not the largest out-migrationfor source
Largest in-migrationfor destination
Largest out-migrationfor source
Largest in-migrationfor destination
11ALASKA ECONOMIC TRENDS MARCH 2018
8
, 2010 2017
In-State Movem
ents for Ci es and Villages
#*#*
#*#*
#*
#*
#*
#*
#*
#*
")!(
#*#*
!(
!(
!(
#*!(
#*
#*
#*
#*
#*
#*
#*
#*
#*
#*
!(
#*#*
!(
!( !(
!(
#*
#*
#*
#*#*
#*
!(
#*
")
")")
")
")
!(#*
#*
!(
!(
!(
!(#*
#*#*
#*
!(
#*
!(!(
#*
!( !(
!(!(
#*
!(!(
!(
'!( ")
!(
!(
#*
!(
#*
!(
!(!(
#*
#*!(
!(!(
!(
!(
#*
!(
")
")!(")
")
!(!(
!(
#*
#*
#*!(
#*
")
#*
")")
#*
")
#*
!(
!(
!(
")
")
")
")
#* #*
#*
")")
#*
")
#*
#*
!(
!(
!(
!(!( !(
!(!(!(
#*
!(
!(
!(
!(
!(
!(
")
#*
#*
'
#*
!(")
!(
'!('
!(
!(")
!( !(!(
!(!(
#*
!(
!(
'
!(#*
")
#*
#*
#*
#*#*
#*
#*
'
#*
")!(
#*
!(
!(!(
")
")
!(!(
!(
!(!(
!(!(
!(
!(!(!( !(
!(!(!(!(
!( !(
")
!(
#*
")
!(
''!(
!(!(!(
!(
!(
#*#*
#*
#*
'
!( !(#* !(
#*#*
'
#*
#*
!(
!(
#*
#*
!(#*
!( '
#*
!(
!(!( !(
#*!(
!(!(!(
!(
!(
!(
#*
!(!(!( !(
#*
!(!( !(#*
!(!(
!(
!(
!(
!(#*!(
!(
")
")")
")
")")
")
!(
")
")
")")
")
")
'
")
'
!( !(!(
!(
!(!(
")
!(!(
!(
!(
!(
!(
")
!(
!(
!(
!(
!( !(#*
!(
")
") !(!(
!(
#*#*#*
!(
#* !(#*#*
!(
#*
!(
!(!(
!(
#*!(
!(
!(#*#*
!(
!(
!(#*
Nom
e
Utqiaġvik (Barrow
)
Bethel
Kodiak
Juneau
Sitka
Ketchikan
Anchorage
Valdez
Cordova
Fairbanks
Kotzebue
Unalaska
Tok
Hom
er
Kenai
AnchorageM
at-Su
Gulf Coast
Southeast
Southwest
Interior
Northern
King Salmon
Fort Yukon
McG
rath
Galena
!(")#*'
Within borough/census area
Outside borough/census area, w
ithin economic region
Outside econom
ic region
Even/no largest group
Largest In-State Gross M
igration
Source: Alaska Department of Labor and W
orkforce Development, Research and Analysis Sec
on

12 ALASKA ECONOMIC TRENDSMARCH 2018
Every age group above 50 has more out-migra on from Alaska, with both periods showing out-migra- on peaks in the early 60s. From 2010 to 2015, an
average of 800 more people between 60 and 64 le the state than moved in, more than twice the average from 2005 to 2010 and a refl ec on of the downward shi across all age groups. The nega ve shi for people under 30 was bigger in both periods than for those over 50, however.
Mat-Su has big net gains whilemost other areas are nega veMost boroughs and census areas have sustained net migra on losses in recent years, losing people to other places in the state as well as outside. Exhibit 6 shows average annual net migra on between 2010 and 2017, which was posi ve for just fi ve of the 29 boroughs and census areas. Three in Southeast aver-aged a migra on gain of less than 10 people per year. The Kenai Peninsula’s gain was around 50 per year.
The Matanuska-Susitna Borough stands out for its large net infl ows, averaging more than 1,200 people per year, even in a decade when most of the state’s net migra on has been nega ve. (For more on Mat-Su’s popula on pa erns, see page 16.)
Anchorage’s and Fairbanks’ net losses have been sharpest, averaging -2,200 and -1,200 a year, respec- vely.
Of the 24 areas with net migra on losses since 2010, half s ll grew overall through natural increase. Seven of these are in Western and Northern Alaska, where birth rates are high (North Slope, Northwest Arc c, Nome, Kusilvak, Bethel, Dillingham, and Lake and Peninsula), while most of the others have larger pop-ula ons (Anchorage, Fairbanks, Juneau, Ketchikan, and Denali).
Anchorage is involvedin most in-state movesAlaskans o en move within the state as well as leave it. Exhibit 7 shows average yearly in-state migra on pa erns for 2010 to 2017. The lines represent either the largest source of in-migrants or the largest des -na on for out-migrants for each borough and census area. For out-migra on, fi lled circles indicate the larg-est ou low while open circles mean that ou low isn’t the area’s largest. For in-migra on, a large black ar-rowhead denotes the area’s largest infl ow and a sim-pler arrow marks a smaller infl ow. The lines in Exhibit 7 represent around 70 percent of all in-state migra- on. (For complete numbers, see Exhibit 9.)
Most in-state migra on that crosses borough and census area boundaries involves Anchorage. The state’s largest city, which has around 40 percent of Alaska’s popula on, is either the source or des na- on for 64 percent of cross-borough moves.
Gross migra on with Anchorage is the largest for ev-ery area in the Gulf Coast, Northern, and Southwest regions. But despite Anchorage’s net gain from all areas in these regions except Kenai Peninsula, its in-state net migra on is usually nega ve because of its massive ou low to Mat-Su.
The situa on diff ers in the Interior and Southeast, as Fairbanks and Juneau serve as regional migra on hubs for most of their smaller boroughs and census areas but share their own largest migra on move-ments with Anchorage. The excep on is Prince of Wales-Hyder, at the southern end of the panhandle, which interacts most with Ketchikan.
Continued on page 22
Tracking requires several sourcesThere is no complete system for tracking migration within Alaska or the United States, so this article uses a variety of data sources as migration indicators, each with different strengths and weaknesses.
Permanent Fund Dividend applications: We com-pared the physical address applicants used one year to the year before, which provided a broad look at in-state migration trends as well as age and sex data. One drawback is that someone who moves to Alaska isn’t eligible to apply until living here a full calendar year, and another is this source requires adjustments for births and deaths.
Internal Revenue Service migration data: IRS mi-gration data come from address changes reported on federal income tax returns. The IRS creates counts by borough or census area and for the state by tabulating exemptions (fi lers and their dependents) on the return and checking for a change in address from the previous year. This provides data on movement between states and county equivalents, but it covers only those who are included in returns.
American Community Survey: The U.S. Census Bu-reau conducts an ongoing survey of American house-holds that gives more extensive demographic infor-mation on movers than other sources. However, the survey sample is small and has large margins of error, and for most parts of Alaska, data are only available in fi ve-year averages.

13ALASKA ECONOMIC TRENDS MARCH 2018
9A
, 2010 2017
Average Annual In-State Migra
on by Borough or Census Area
Source Borough/C
ensus Area
Aleutians East
Aleutians West
Anchorage
Bethel
Bristol Bay
Denali
Dillingham
FairbanksNorth Star
Haines
Hoonah-Angoon
Juneau
KenaiPeninsula
KetchikanGateway
Kodiak Island
Kusilvak
Lake andPeninsula
Matanuska-Susitna
Nome
North Slope
Northwest Arctic
Petersburg
Prince ofWales-Hyder
Sitka
Skagway
SE Fairbanks
Valdez-Cordova
Wrangell
Yakutat
Yukon-Koyukuk
Destination Borough/Census Area
Aleutians East
—1
210
10
01
00
12
12
02
62
00
01
00
12
00
1A
leutians West
1—
331
10
02
01
43
12
10
51
10
00
00
02
00
0A
nchorage31
59—
30321
1595
69912
11245
66059
222142
521,797
183148
17311
2353
354
1886
964
Bethel
00
210—
00
2226
10
423
26
891
429
23
00
10
23
01
4B
ristol Bay
11
181
—0
22
00
02
01
08
51
01
01
00
01
00
0D
enali0
017
00
—0
260
12
41
10
012
20
10
10
02
00
05
Dillingham
01
7416
30
—5
00
29
02
512
143
23
11
10
12
00
2Fairbanks N
orth Star3
6475
401
3510
—7
451
10112
2416
1182
3259
324
713
1150
461
3228
Haines
00
111
00
04
—7
232
21
00
70
10
12
22
11
11
0H
oonah-Angoon
10
111
01
07
4—
482
31
10
41
02
12
71
01
00
0Juneau
14
1818
10
359
2763
—24
5314
10
455
52
2435
665
39
129
1K
enai Peninsula6
10722
437
813
1204
229
—14
4815
14254
2311
132
912
112
423
115
Ketchikan G
ateway
13
402
00
012
33
4712
—4
00
142
21
571
122
25
101
1K
odiak Island2
6117
61
14
110
08
276
—4
226
21
10
28
01
60
10
Kusilvak
02
11287
00
414
00
28
03
—2
1614
22
02
10
10
00
2Lake and Peninsula
30
392
60
92
00
08
05
2—
81
00
00
00
01
00
1M
atanuska-Susitna3
202,889
6810
1323
2497
468
25424
5124
11—
3828
423
613
252
926
321
Nom
e1
1129
121
03
200
03
180
116
124
—5
190
13
01
10
13
North Slope
00
1084
00
439
01
26
11
31
124
—14
01
20
13
00
4N
orthwest A
rctic0
1118
70
02
220
13
80
14
026
1610
—0
02
01
20
03
Petersburg1
09
10
00
43
120
36
00
04
10
0—
64
00
23
00
Prince of Wales-H
yder0
127
20
03
61
434
757
22
09
11
36
—14
00
27
01
Sitka1
138
50
11
124
749
912
82
011
31
25
18—
01
33
31
Skagway
00
50
00
02
20
41
10
00
21
10
00
0—
10
00
0Southeast Fairbanks
00
444
01
0107
11
914
21
10
361
12
10
10
—9
10
6Valdez-C
ordova3
2138
31
11
410
17
285
103
157
32
41
44
113
—2
27
Wrangell
00
70
10
02
11
93
81
00
60
11
56
60
02
—0
0Yakutat
00
50
00
02
01
61
00
00
21
00
00
10
00
0—
0Yukon-K
oyukuk1
052
61
40
1842
12
91
14
114
55
30
21
04
31
0—
Source: Alaska Department of Labor and W
orkforce Development, Research and Analysis Sec
on
FRO
M
TO
14 ALASKA ECONOMIC TRENDSMARCH 2018
Small decline is the fi rst since the late 1980s
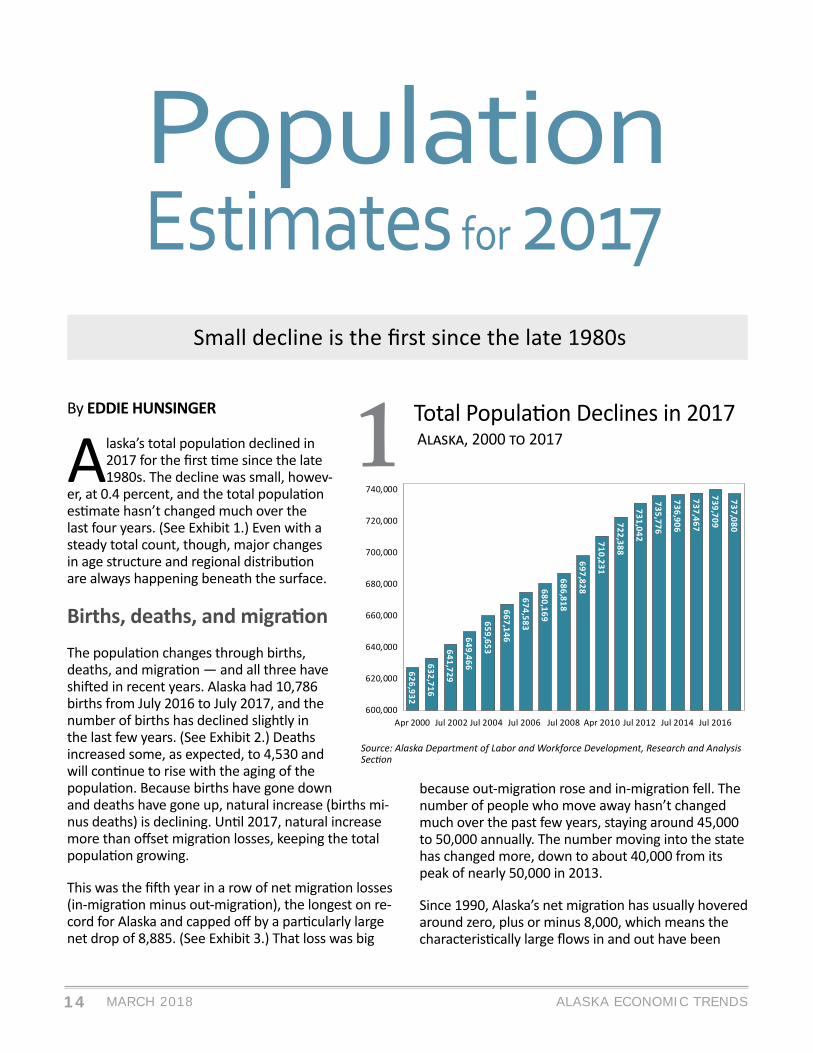
By EDDIE HUNSINGER 1 A , 2000 2017Total Popula on Declines in 2017
Source: Alaska Department of Labor and Workforce Development, Research and Analysis Sec on
626,932
632,716
641,729
649,466
659,653
667,146
674,583
680,169
686,818
697,828
710,231
722,388
731,042
735,776
736,906
737,467
739,709
737,080
600,000
620,000
640,000
660,000
680,000
700,000
720,000
740,000
Apr 2000 Jul 2002 Jul 2004 Jul 2006 Jul 2008 Apr 2010 Jul 2012 Jul 2014 Jul 2016
Alaska’s total popula on declined in 2017 for the fi rst me since the late 1980s. The decline was small, howev-
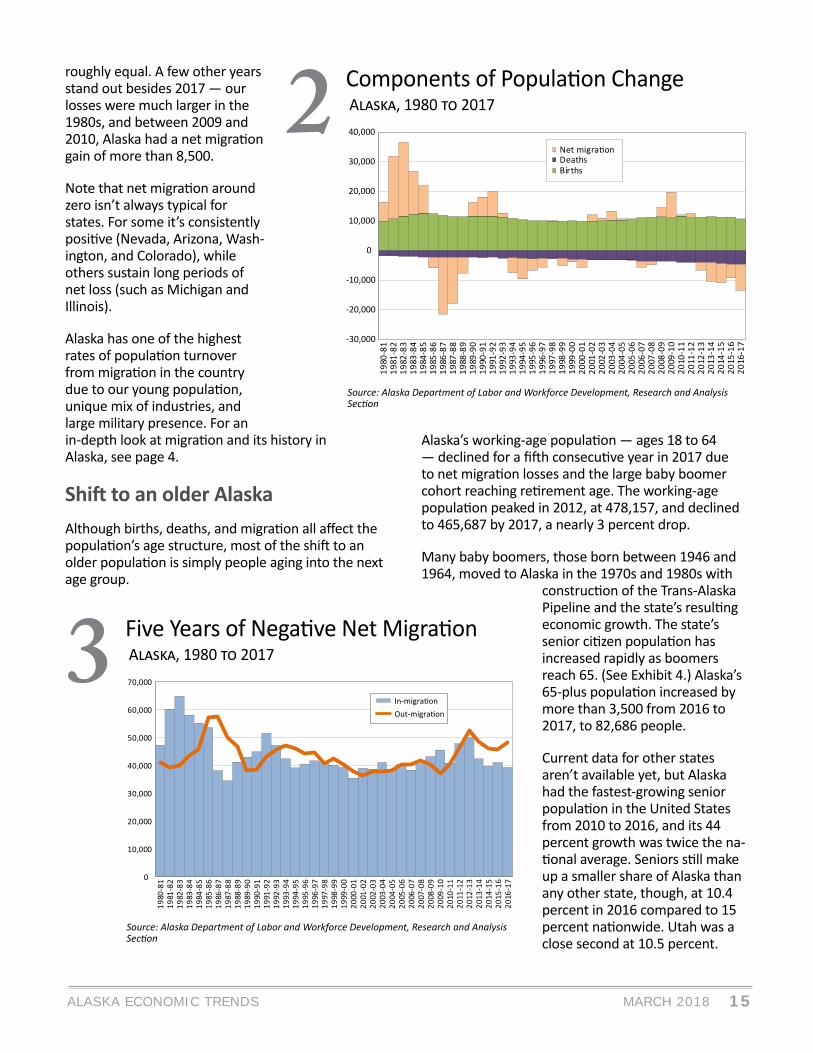
er, at 0.4 percent, and the total popula on es mate hasn’t changed much over the last four years. (See Exhibit 1.) Even with a steady total count, though, major changes in age structure and regional distribu on are always happening beneath the surface.
Births, deaths, and migra onThe popula on changes through births, deaths, and migra on — and all three have shi ed in recent years. Alaska had 10,786 births from July 2016 to July 2017, and the number of births has declined slightly in the last few years. (See Exhibit 2.) Deaths increased some, as expected, to 4,530 and will con nue to rise with the aging of the popula on. Because births have gone down and deaths have gone up, natural increase (births mi-nus deaths) is declining. Un l 2017, natural increase more than off set migra on losses, keeping the total popula on growing.
This was the fi h year in a row of net migra on losses (in-migra on minus out-migra on), the longest on re-cord for Alaska and capped off by a par cularly large net drop of 8,885. (See Exhibit 3.) That loss was big
because out-migra on rose and in-migra on fell. The number of people who move away hasn’t changed much over the past few years, staying around 45,000 to 50,000 annually. The number moving into the state has changed more, down to about 40,000 from its peak of nearly 50,000 in 2013.
Since 1990, Alaska’s net migra on has usually hovered around zero, plus or minus 8,000, which means the characteris cally large fl ows in and out have been
PopulationPopulationEstimatesEstimates for for 20172017
15ALASKA ECONOMIC TRENDS MARCH 2018
2 A , 1980 2017Components of Popula on Change
Source: Alaska Department of Labor and Workforce Development, Research and Analysis Sec on
-30,000
-20,000
-10,000
0
10,000
20,000
30,000
40,000
1980
-81
1981
-82
1982
-83
1983
-84
1984
-85
1985
-86
1986
-87
1987
-88
1988
-89
1989
-90
1990
-91
1991
-92
1992
-93
1993
-94
1994
-95
1995
-96
1996
-97
1997
-98
1998
-99
1999
-00
2000
-01
2001
-02
2002
-03
2003
-04
2004
-05
2005
-06
2006
-07
2007
-08
2008
-09
2009
-10
2010
-11
2011
-12
2012
-13
2013
-14
2014
-15
2015
-16
2016
-17
Net migra onDeathsBirths
3 A , 1980 2017Five Years of Nega ve Net Migra on
Source: Alaska Department of Labor and Workforce Development, Research and Analysis Sec on
0
10,000
20,000
30,000
40,000
50,000
60,000
70,000
1980
-81
1981
-82
1982
-83
1983
-84
1984
-85
1985
-86
1986
-87
1987
-88
1988
-89
1989
-90
1990
-91
1991
-92
1992
-93
1993
-94
1994
-95
1995
-96
1996
-97
1997
-98
1998
-99
1999
-00
2000
-01
2001
-02
2002
-03
2003
-04
2004
-05
2005
-06
2006
-07
2007
-08
2008
-09
2009
-10
2010
-11
2011
-12
2012
-13
2013
-14
2014
-15
2015
-16
2016
-17
roughly equal. A few other years stand out besides 2017 — our losses were much larger in the 1980s, and between 2009 and 2010, Alaska had a net migra on gain of more than 8,500.
Note that net migra on around zero isn’t always typical for states. For some it’s consistently posi ve (Nevada, Arizona, Wash-ington, and Colorado), while others sustain long periods of net loss (such as Michigan and Illinois).
Alaska has one of the highest rates of popula on turnover from migra on in the country due to our young popula on, unique mix of industries, and large military presence. For an in-depth look at migra on and its history in Alaska, see page 4.
Shi to an older AlaskaAlthough births, deaths, and migra on all aff ect the popula on’s age structure, most of the shi to an older popula on is simply people aging into the next age group.
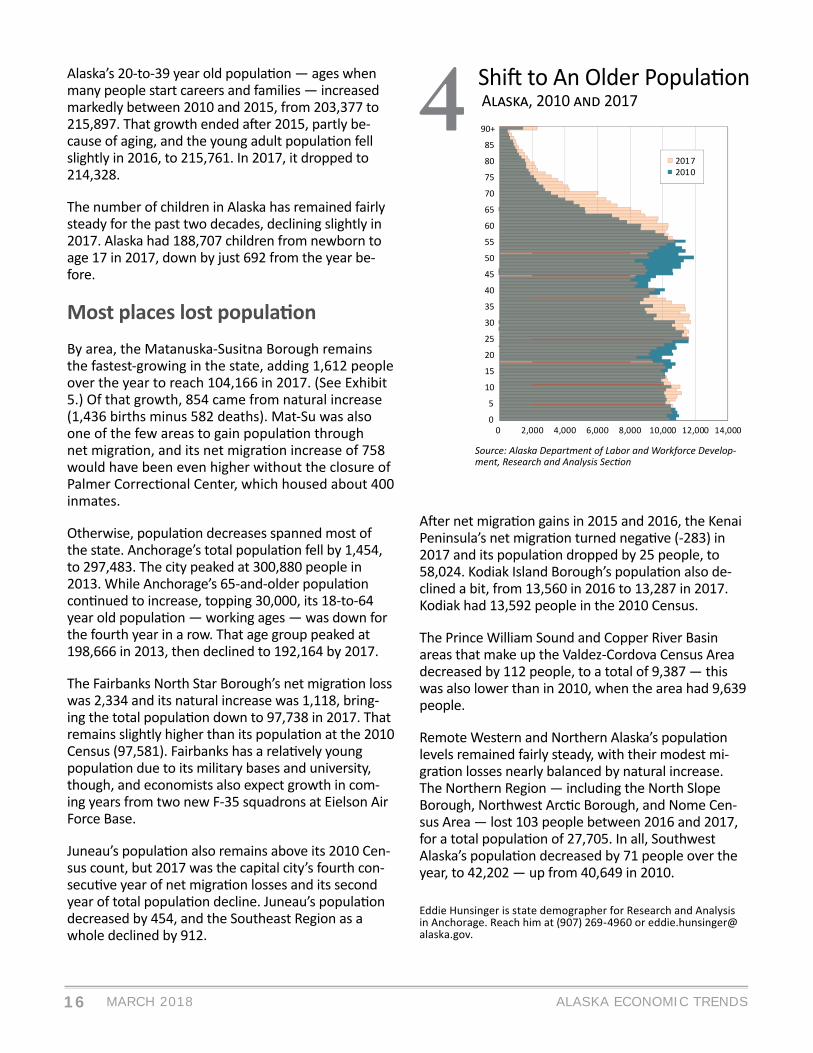
Alaska’s working-age popula on — ages 18 to 64 — declined for a fi h consecu ve year in 2017 due to net migra on losses and the large baby boomer cohort reaching re rement age. The working-age popula on peaked in 2012, at 478,157, and declined to 465,687 by 2017, a nearly 3 percent drop.
Many baby boomers, those born between 1946 and 1964, moved to Alaska in the 1970s and 1980s with
construc on of the Trans-Alaska Pipeline and the state’s resul ng economic growth. The state’s senior ci zen popula on has increased rapidly as boomers reach 65. (See Exhibit 4.) Alaska’s 65-plus popula on increased by more than 3,500 from 2016 to 2017, to 82,686 people.
Current data for other states aren’t available yet, but Alaska had the fastest-growing senior popula on in the United States from 2010 to 2016, and its 44 percent growth was twice the na- onal average. Seniors s ll make
up a smaller share of Alaska than any other state, though, at 10.4 percent in 2016 compared to 15 percent na onwide. Utah was a close second at 10.5 percent.
PopulationEstimates for 2017
16 ALASKA ECONOMIC TRENDSMARCH 2018
4 A , 2010 2017Shi to An Older Popula on
Source: Alaska Department of Labor and Workforce Develop-ment, Research and Analysis Sec on
0 2,000 4,000 6,000 8,000 10,000 12,000 14,0000
5
10
15
20
25
30
35
40
45
50
55
60
65
70
75
80
85
90+
20172010
Alaska’s 20-to-39 year old popula on — ages when many people start careers and families — increased markedly between 2010 and 2015, from 203,377 to 215,897. That growth ended a er 2015, partly be-cause of aging, and the young adult popula on fell slightly in 2016, to 215,761. In 2017, it dropped to 214,328.
The number of children in Alaska has remained fairly steady for the past two decades, declining slightly in 2017. Alaska had 188,707 children from newborn to age 17 in 2017, down by just 692 from the year be-fore.
Most places lost popula onBy area, the Matanuska-Susitna Borough remains the fastest-growing in the state, adding 1,612 people over the year to reach 104,166 in 2017. (See Exhibit 5.) Of that growth, 854 came from natural increase (1,436 births minus 582 deaths). Mat-Su was also one of the few areas to gain popula on through net migra on, and its net migra on increase of 758 would have been even higher without the closure of Palmer Correc onal Center, which housed about 400 inmates.
Otherwise, popula on decreases spanned most of the state. Anchorage’s total popula on fell by 1,454, to 297,483. The city peaked at 300,880 people in 2013. While Anchorage’s 65-and-older popula on con nued to increase, topping 30,000, its 18-to-64 year old popula on — working ages — was down for the fourth year in a row. That age group peaked at 198,666 in 2013, then declined to 192,164 by 2017.
The Fairbanks North Star Borough’s net migra on loss was 2,334 and its natural increase was 1,118, bring-ing the total popula on down to 97,738 in 2017. That remains slightly higher than its popula on at the 2010 Census (97,581). Fairbanks has a rela vely young popula on due to its military bases and university, though, and economists also expect growth in com-ing years from two new F-35 squadrons at Eielson Air Force Base.
Juneau’s popula on also remains above its 2010 Cen-sus count, but 2017 was the capital city’s fourth con-secu ve year of net migra on losses and its second year of total popula on decline. Juneau’s popula on decreased by 454, and the Southeast Region as a whole declined by 912.
A er net migra on gains in 2015 and 2016, the Kenai Peninsula’s net migra on turned nega ve (-283) in 2017 and its popula on dropped by 25 people, to 58,024. Kodiak Island Borough’s popula on also de-clined a bit, from 13,560 in 2016 to 13,287 in 2017. Kodiak had 13,592 people in the 2010 Census.
The Prince William Sound and Copper River Basin areas that make up the Valdez-Cordova Census Area decreased by 112 people, to a total of 9,387 — this was also lower than in 2010, when the area had 9,639 people.
Remote Western and Northern Alaska’s popula on levels remained fairly steady, with their modest mi-gra on losses nearly balanced by natural increase. The Northern Region — including the North Slope Borough, Northwest Arc c Borough, and Nome Cen-sus Area — lost 103 people between 2016 and 2017, for a total popula on of 27,705. In all, Southwest Alaska’s popula on decreased by 71 people over the year, to 42,202 — up from 40,649 in 2010.
Eddie Hunsinger is state demographer for Research and Analysis in Anchorage. Reach him at (907) 269-4960 or [email protected].

17ALASKA ECONOMIC TRENDS MARCH 2018
52010
2017Popula
on of Alaska by Region, Borough and Census Area
Census
Estimate
Estimate
Estimate
Estimate
Estimate
Estimate
Estimate
Natural Increase*
Net M
igration*Pop C
hangeG
rowth R
ate (%)
Area
April 2010
July 2011July 2012
July 2013July 2014
July 2015July 2016
July 20172010-17
2016-172010-17
2016-172010-17
2016-172010-17
2016-17
Alaska
710,231722,388
731,042735,776
736,906737,467
739,709737,080
51,9496,256
-25,100-8,885
26,849-2,629
0.51-0.36
Anchorage/M
at-Su380,821
387,399391,986
396,689398,351
398,768401,491
401,64928,196
3,359-7,368
-3,20120,828
1580.73
0.04 A
nchorage291,826
295,719298,334
300,880300,197
298,799298,937
297,48321,964
2,505-16,307
-3,9595,657
-1,4540.26
-0.49 M
atanuska-Susitna
88,99591,680
93,65295,809
98,15499,969
102,554104,166
6,232854
8,939758
15,1711,612
2.171.56
Gulf C
oast78,631
80,21680,576
80,47980,863
81,03881,108
80,6983,878
457-1,811
-8672,067
-4100.36
-0.51 K
enai Peninsula
55,40056,530
56,63356,850
57,43157,707
58,04958,024
2,245258
379-283
2,624-25
0.64-0.04
Kodiak Island
13,59213,848
13,99313,810
13,82713,795
13,56013,287
1,144134
-1,449-407
-305-273
-0.31-2.03
Valdez-Cordova
9,6399,838
9,9509,819
9,6059,536
9,4999,387
48965
-741-177
-252-112
-0.37-1.19
Interior112,021
112,835115,397
114,515113,067
112,905113,202
111,9119,624
1,191-9,734
-2,482-110
-1,291-0.01
-1.15 D
enali1,826
1,8361,856
1,7981,789
1,7901,883
1,84982
4-59
-3823
-340.17
-1.82 Fairbanks N
Star
97,58198,234
100,66499,985
98,77998,727
98,95497,738
8,8681,118
-8,711-2,334
157-1,216
0.02-1.24
SE
Fairbanks7,026
7,1077,200
7,0856,983
6,8976,921
6,973472
50-525
2-53
52-0.10
0.75 Yukon-K
oyukuk5,588
5,6585,677
5,6475,516
5,4915,444
5,351202
19-439
-112-237
-93-0.60
-1.72
Northern
26,44526,930
27,27427,541
27,52827,828
27,80827,705
3,046386
-1,786-489
1,260-103
0.64-0.37
Nom
e9,492
9,7189,852
9,8699,986
10,05810,070
10,0061,157
149-643
-213514
-640.73
-0.64 N
orth Slope
9,4309,575
9,7109,864
9,7329,887
9,8019,849
879100
-460-52
41948
0.600.49
Northw
est Arctic
7,5237,637
7,7127,808
7,8107,883
7,9377,850
1,010137
-683-224
327-87
0.59-1.10
Southeast71,664
73,58274,168
74,29774,518
74,37173,827
72,9152,788
276-1,537
-1,1881,251
-9120.24
-1.24 H
aines2,508
2,6102,607
2,5342,550
2,4932,466
2,4597
4-56
-11-49
-7-0.27
-0.28 H
oonah-Angoon
2,1492,149
2,2002,179
2,1412,177
2,1882,122
5312
-80-78
-27-66
-0.17-3.06
Juneau31,275
32,32832,689
32,91533,020
33,14532,723
32,2691,495
170-501
-624994
-4540.43
-1.40 K
etchikan Gatew
ay13,477
13,72013,878
13,82613,872
13,81313,749
13,754554
35-277
-30277
50.28
0.04 P
etersburg3,203
3,2903,251
3,1983,207
3,1853,177
3,147134
17-190
-47-56
-30-0.24
-0.95 P of W
ales-Hyder
6,1726,449
6,4566,540
6,5586,536
6,4916,390
2154
3-105
218-101
0.48-1.57
Sitka
8,8819,023
9,0659,051
9,0858,922
8,9148,748
22822
-361-188
-133-166
-0.21-1.88
Skagw
ay968
964957
9811,038
1,0451,069
1,08751
1068
8119
181.60
1.67 W
rangell2,369
2,4082,444
2,4552,415
2,4452,456
2,38713
-45
-6518
-690.10
-2.85 Yakutat
662641
621618
632610
594552
386
-148-48
-110-42
-2.50-7.33
Southwest
40,64941,426
41,64142,255
42,57942,557
42,27342,202
4,417587
-2,864-658
1,553-71
0.52-0.17
Aleutians E
ast3,141
3,1463,146
3,1483,093
3,0472,999
2,97755
6-219
-28-164
-22-0.74
-0.74 A
leutians West
5,5615,529
5,6225,645
5,6165,534
5,4815,357
13617
-340-141
-204-124
-0.52-2.29
Bethel
17,01317,442
17,56017,865
18,08418,198
18,12118,127
2,336306
-1,222-300
1,1146
0.870.03
Bristol B
ay997
1,024984
933944
887876
88724
1-134
10-110
11-1.61
1.25 D
illingham4,847
4,9334,974
5,0225,070
5,0104,954
4,925492
70-414
-9978
-290.22
-0.59 K
usilvak7,459
7,6757,675
7,9428,085
8,2048,200
8,2081,242
165-493
-157749
81.32
0.10 Lake and P
eninsula1,631
1,6771,680
1,7001,687
1,6771,642
1,721132
22-42
5790
790.74
4.70
Note: Vintage 2017. All num
bers are based on 2017 geography.*N
atural increase equals births minus deaths, and net m
igra on equals in-m
igrants minus out-m
igrants.Source: Alaska Departm
ent of Labor and Workforce Developm
ent, Research and Analysis Sec on

18 ALASKA ECONOMIC TRENDSMARCH 2018
Gauging Alaska’s Economy
19ALASKA ECONOMIC TRENDS MARCH 2018
Four-week moving average ending with the specifi ed week
Gauging Alaska’s Economy
20 ALASKA ECONOMIC TRENDSMARCH 2018
Seasonally adjusted
Prelim. Revised12/17 11/17 12/16
Interior Region 7.5 7.3 6.6 Denali Borough 20.6 20.2 18.2 Fairbanks N Star Borough 6.6 6.3 5.7 Southeast Fairbanks Census Area
10.8 10.9 9.8
Yukon-Koyukuk Census Area
18.0 17.6 16.8
Northern Region 10.8 11.2 10.4 Nome Census Area 12.2 12.0 11.4 North Slope Borough 6.3 7.0 5.9 Northwest Arc c Borough 14.5 15.6 15.5
Anchorage/Mat-Su Region 6.4 6.3 5.7 Anchorage, Municipality 5.7 5.7 5.1 Mat-Su Borough 8.7 8.3 8.0
Prelim. Revised12/17 11/17 12/16
Southeast Region 7.2 6.9 6.4 Haines Borough 13.4 12.7 11.1 Hoonah-Angoon Census Area
18.7 16.6 14.0
Juneau, City and Borough 5.1 4.9 4.5 Ketchikan Gateway Borough
7.0 7.0 6.4
Petersburg Borough 10.1 9.2 9.8 Prince of Wales-Hyder Census Area
12.3 11.7 11.6
Sitka, City and Borough 5.0 4.7 4.2 Skagway, Municipality 20.0 21.2 20.6 Wrangell, City and Borough 8.8 8.6 7.7 Yakutat, City and Borough 11.0 11.4 9.0
Prelim. Revised12/17 11/17 12/16
United States 4.1 4.1 4.7Alaska 7.3 7.2 6.6
Prelim. Revised12/17 11/17 12/16
Southwest Region 12.3 11.4 11.2 Aleu ans East Borough 5.9 4.3 4.7 Aleu ans West Census Area
5.4 4.4 4.6
Bethel Census Area 13.2 13.0 12.2 Bristol Bay Borough 14.3 11.4 13.3 Dillingham Census Area 11.1 10.4 11.4 Kusilvak Census Area 19.8 19.4 18.0 Lake and Peninsula Borough
15.4 15.1 12.7
Gulf Coast Region 8.8 8.2 8.0 Kenai Peninsula Borough 8.9 8.7 8.0 Kodiak Island Borough 7.3 4.8 6.7 Valdez-Cordova Census Area
9.9 9.5 9.3
Prelim. Revised12/17 11/17 12/16
United States 3.9 3.9 4.5Alaska 7.3 7.1 6.6
Regional, not seasonally adjusted
Not seasonally adjustedUnemployment Rates
Northern Region
Anchorage/Mat-SuRegion
Bristol Bay
InteriorRegion
Kodiak Island
KenaiPeninsula
Matanuska-Susitna
Anchorage
Valdez-Cordova
SoutheastFairbanksDenali
FairbanksYukon-Koyukuk
North Slope
NorthwestArctic
Nome
Kusilvak
Bethel
Dillingham
AleutiansEast
AleutiansWest
Lake &Peninsula
SouthwestRegion Gulf Coast
Region
Yakutat
Sitka
Hoonah-
Prince of Wales-Hyder
Haines Skagway
Juneau
Ketchikan
Petersburg
Wrangell
SoutheastRegion
- 5.6%
-1.2%+1.1%
-1.9%
- 0.9%
-1.2%Anchorage/
Mat-Su
-1.0%Statewide
Percent changein jobs, Dec 2016 to Dec 2017
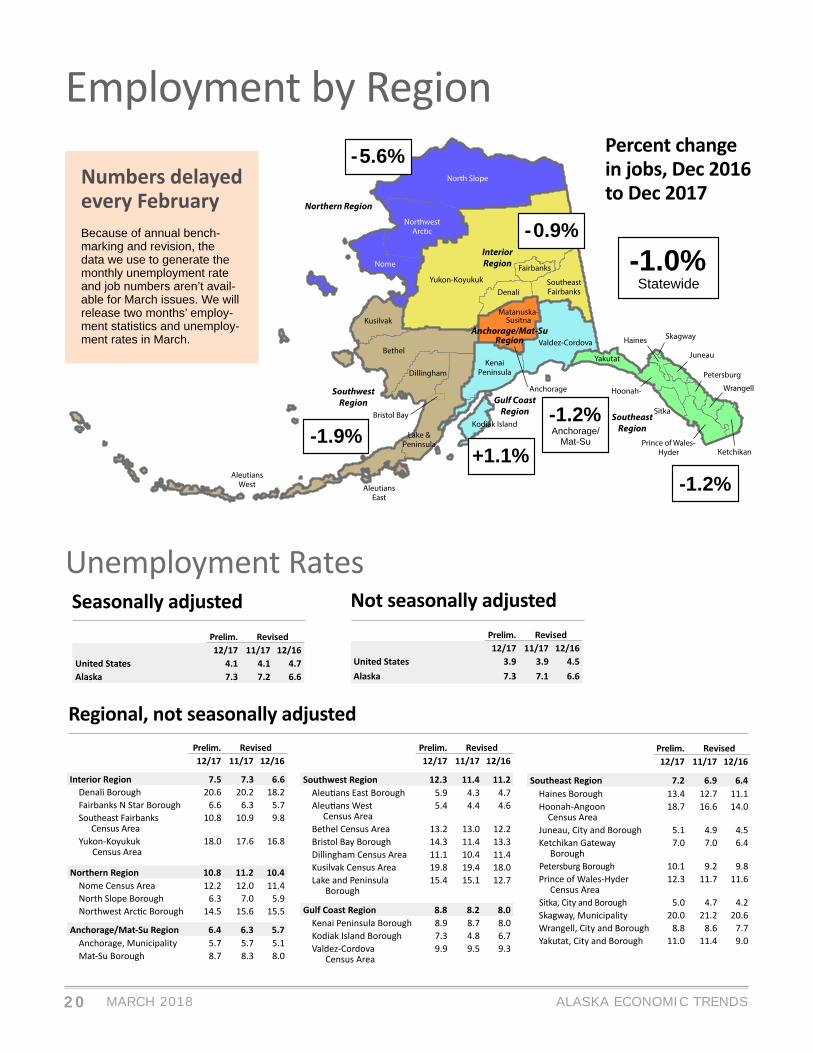
Numbers delayedevery FebruaryBecause of annual bench-marking and revision, the data we use to generate the monthly unemployment rate and job numbers aren’t avail-able for March issues. We will release two months’ employ-ment statistics and unemploy-ment rates in March.
Employment by Region
21ALASKA ECONOMIC TRENDS MARCH 2018
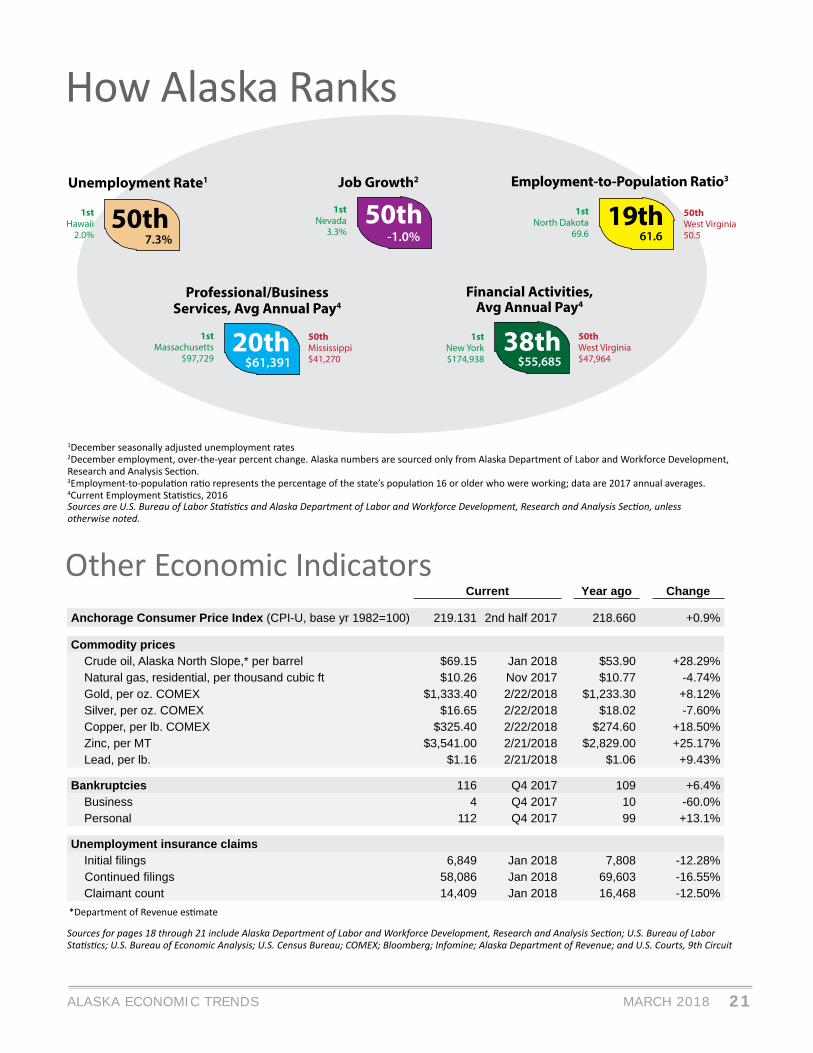
1December seasonally adjusted unemployment rates2December employment, over-the-year percent change. Alaska numbers are sourced only from Alaska Department of Labor and Workforce Development, Research and Analysis Sec on.3Employment-to-popula on ra o represents the percentage of the state’s popula on 16 or older who were working; data are 2017 annual averages.4Current Employment Sta s cs, 2016Sources are U.S. Bureau of Labor Sta s cs and Alaska Department of Labor and Workforce Development, Research and Analysis Sec on, unlessotherwise noted.
Current Year ago Change
Anchorage Consumer Price Index (CPI-U, base yr 1982=100) 219.131 2nd half 2017 218.660 +0.9%
Commodity prices Crude oil, Alaska North Slope,* per barrel $69.15 Jan 2018 $53.90 +28.29% Natural gas, residential, per thousand cubic ft $10.26 Nov 2017 $10.77 -4.74% Gold, per oz. COMEX $1,333.40 2/22/2018 $1,233.30 +8.12% Silver, per oz. COMEX $16.65 2/22/2018 $18.02 -7.60% Copper, per lb. COMEX $325.40 2/22/2018 $274.60 +18.50% Zinc, per MT $3,541.00 2/21/2018 $2,829.00 +25.17% Lead, per lb. $1.16 2/21/2018 $1.06 +9.43%
Bankruptcies 116 Q4 2017 109 +6.4% Business 4 Q4 2017 10 -60.0% Personal 112 Q4 2017 99 +13.1%
Unemployment insurance claims Initial fi lings 6,849 Jan 2018 7,808 -12.28% Continued fi lings 58,086 Jan 2018 69,603 -16.55% Claimant count 14,409 Jan 2018 16,468 -12.50%
Other Economic Indicators
*Department of Revenue es mate
Sources for pages 18 through 21 include Alaska Department of Labor and Workforce Development, Research and Analysis Sec on; U.S. Bureau of Labor Sta s cs; U.S. Bureau of Economic Analysis; U.S. Census Bureau; COMEX; Bloomberg; Infomine; Alaska Department of Revenue; and U.S. Courts, 9th Circuit
How Alaska Ranks
50th1stHawaii
2.0%
Unemployment Rate1
7.3%
20th$61,391
50thJob Growth2
-1.0%
1stNevada
3.3%
Professional/BusinessServices, Avg Annual Pay4
19th1stNorth Dakota
69.6
Employment-to-Population Ratio3
61.6
1stMassachusetts
$97,729 38th1st
New York$174,938
Financial Activities,Avg Annual Pay4
$55,685
50thWest Virginia$47,964
50thWest Virginia50.5
50thMississippi$41,270
22 ALASKA ECONOMIC TRENDSMARCH 2018
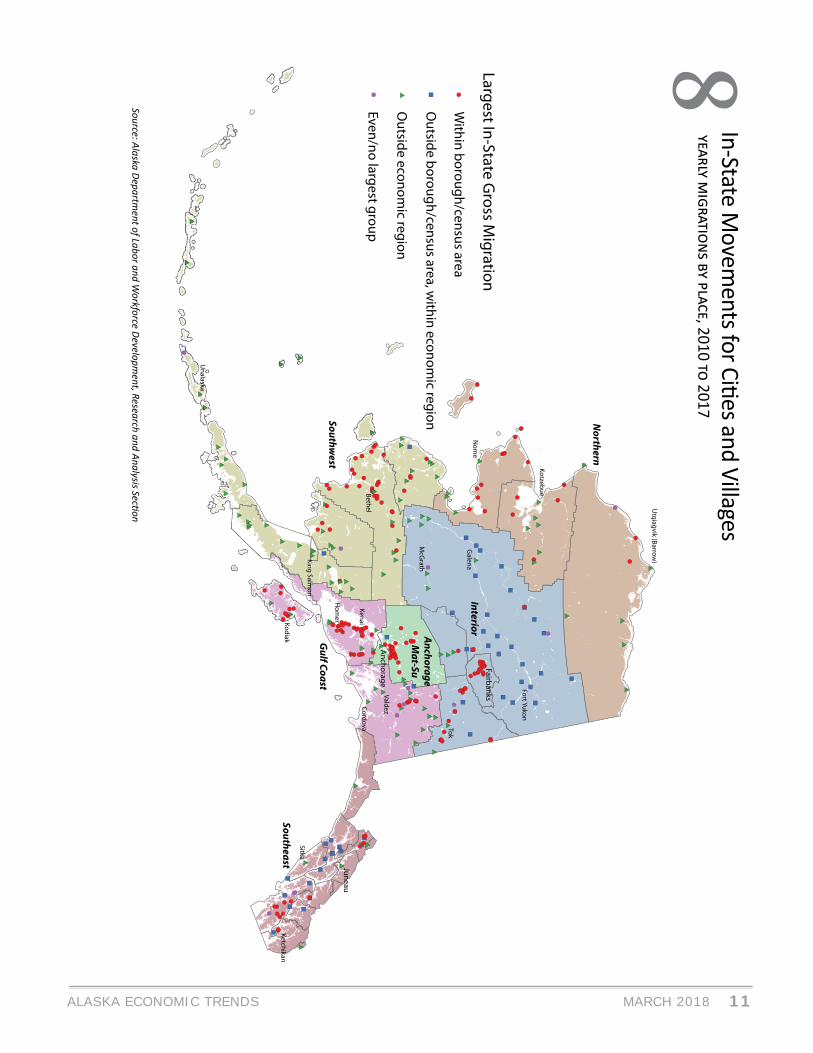
Place-level migra onreveals regional hubsMigra on data for communi es are limited, as they don’t show place-to-place movements but rather how many of a place’s moves were within the same area, the same region, or the state. (See Exhibit 8 on page 11.)
Most places send and receive the most migrants within the same borough/census area. (This category doesn’t include unifi ed city-boroughs such as Anchor-age and Juneau.) This applies not just to large bor-oughs like Mat-Su and Fairbanks, but also to villages in Western Alaska that surround larger hubs such as Bethel, Nome, and Kotzebue.
Fairbanks and Juneau’s primacy within their regions, shown in Exhibit 7, is also clear in place-level migra- on. Fairbanks is center for much of the Interior’s
migra on. Nearly all villages in the Upper Yukon Basin and along the Koyukuk River share their highest gross migra on within the region, and presumably with Fairbanks. Juneau serves a similar func on for most of Southeast.
Places whose primary in-state migra on is outside their regions are spread across the state, and they interact mostly with Anchorage. This category in-cludes most large hub ci es in Western and Northern Alaska, such as Bethel and Utqiagvik, as well as larger places on the road system, such as Valdez and Tok.
Many smaller villages’ primary in-state migra on is outside their region instead of with a nearby hub. This category includes nearly all of the Alaska Penin-sula and the Aleu ans as well as villages in the Lower Yukon and Arc c.
Eric Sandberg is a demographer for Research and Analysis in Ju-neau. Reach him at (907) 465-2437 or [email protected].
MIGRATIONContinued from page 12

23ALASKA ECONOMIC TRENDS MARCH 2018
Employer Resources
Business Employment Services TeamEmployment First Job Fair
University Center MallFriday, March 3010 a.m. to 2 p.m.
Employers, let BEST help you fi nd excellent employees at the Employment First Job Fair. For more information,contact the Anchorage Midtown Business Connection at (907) 269-4777 or [email protected].
• Open to all employers and the public
• Free employer booths• Meet hundreds of job
seekers• Federal contractors can
fi nd qualifi ed veterans and individuals with disabili es
Register online for the fair using Eventbrite.com:g
Safety Minute
The Alaska Safety Advisory Council will hold the 37th An-nual Governors Safety and Health Conference on April 3 and 4. This year’s conference will be at the Egan Center in downtown Anchorage.
The Safety and Health Conference gives employers and safety and health professionals the opportunity to hear about what has changed in occupational safety and health
and to learn about potential solutions and new products.
For more information about the ASAC and the conference, please visit http://labor.alaska.gov/lss/asac.htm.
Safety Minute is wri en by the Labor Standards and Safety Division of the Alaska Department of Labor and Workforce Development.
Safety and health conference scheduled for April 3-4


![& 3 # ] F + @ , · Ø é&»6Î ã Û- &¿4ø Ò á & é # ] F + @ , Á Ò ù Ô !c º ã$T$) é ( æ _ K _ é Â7²2 * !¢!¥ Ô Â Ò ¿1 : Ç ù ù Ô](https://static.documents.pub/doc/80x56/5c0c424709d3f208568bd7e3/-3-f-o-e6i-a-u-4o-o-a-e-f-a-o-u-o.jpg)


![º 0 Ù ò î È Ã Ì ¿ È Ã v ¡ ù ñ 8 · º v ;o; g v $ vplqswivplqswivplqswivplqswivplqswivplqswivplqswi ,] ¡ r 2!v v v v v v v](https://static.documents.pub/doc/80x56/60039e165cfb340fe8695115/-0-f-oe-f-v-8-v-o-g-v-vplqswivplqswivplqswivplqswivplqswivplqswivplqswi.jpg)


![Q - Cryptology ePrint Archive · Ù ÚPÏ Íè_Î Ú ÊnÚ_ίã ØÊ Ô Î ÖµÍè ٠ͧÙ]ãPÙ ØĮ́ßlÕ Ó Ù Ø ã ØÊ Í ÊºßàÊnÓ³Ê ãDÎlØjÙ ÍÌ Ú_þÌ](https://static.documents.pub/doc/80x56/5e32f5ef63ac500cbb4ffa04/q-cryptology-eprint-archive-p-n-.jpg)


