MARCO Research and Innovation Action (RIA) This project has received funding from the European Union's Horizon 2020 research and innovation programme under grant agreement No 730272. Start date : 2016-11-01 Duration : 24 Months Interim definition, taxonomy and report Authors : Mr. Steve HOWARD (KMatrix), Sarah Howard (kMatrix) MARCO - D2.2 - Issued on 2018-08-10 14:34:46 by KMatrix
Transcript
MARCOResearch and Innovation Action (RIA)
This project has received funding from the EuropeanUnion's Horizon 2020 research and innovation programme
under grant agreement No 730272.
Start date : 2016-11-01 Duration : 24 Months
Interim definition, taxonomy and report
Authors : Mr. Steve HOWARD (KMatrix), Sarah Howard (kMatrix)
MARCO - D2.2 - Issued on 2018-08-10 14:34:46 by KMatrix
MARCO - D2.2 - Issued on 2018-08-10 14:34:46 by KMatrix
MARCO - Contract Number: 730272MArket Research for a Climate Services Observatory
Document title Interim definition, taxonomy and report
Author(s) Mr. Steve HOWARD, Sarah Howard (kMatrix)
Number of pages 402
Document type Deliverable
Work Package WP2
Document number D2.2
Issued by KMatrix
Date of completion 2018-08-10 14:34:46
Dissemination level Public
Summary
D2.2 Interim definition, taxonomy and report. It includes 3 new industries and the "Mixed" platform. The taxonomy has beenmapped to NACE Codes allowing reporting through NACE Codes alongside industry reporting. Import and Export data hasbeen included.
Approval
Date By
2018-08-13 11:04:31 Dr. Joerg CORTEKAR (HGF/HZG)
2018-08-20 09:10:46 Dr. Gabor SZENDRO (LGI)
MARCO - D2.2 - Issued on 2018-08-10 14:34:46 by KMatrix
Interim Definition, Taxonomy and Report
This project has received funding from the European Union’s Horizon 2020 research and innovation programme under grant agreement No 730272. The content in this document reflects only the views of
the authors. The European Commission is not responsible for any use that may be made of the information it contains.
Introductory Notes to this Report This report is submitted as a deliverable for the MARCO project - to provide an update of the 2015/16 data submitted in D2.1, to focus on the Climate Services market, but with reference to Weather Services and to incorporated changes to the taxonomy and updated metrics determined through the project. As in the previous 2015/16 market report (D2.1), the data in this report is based on transactional information and only commercial services. This report provides an updated Baseline for the Climate Services market, in line with the new definitions which have been determined during the MARCO project. The CS market has been re-defined during the project in collaboration with MARCO partners. As outlined in D4.3, we have added a further 3 end-user industry sectors (Processing Industries, Civil Engineering and “Not Elsewhere Classified”), 380 applications and a “Mixed Services” data platform. In line with D4.5, we have mapped the data to NACE codes, which allows for reporting through both the taxonomy Industries and NACE codes. This is important as it enables full flexibility in the data, being accessible to governments and other users who work with NACE codes, but also to individual companies who categorise themselves differently. Ultimately the goal would be to map to a lower level of NACE code, which should be achievable as the market matures and data is more readily available at more in-depth NACE code level. At present we have mapped to 17 top line NACE codes. The new taxonomy reflects the new research into the quantifiable market for Climate Services and has been retro-fit to previous years. This new format will be used to provide an updated report for the 2017/18 financial year, to be delivered as D2.3.
Notes related to kMatrix data:
This report is a Market Assessment of the Weather & Climate Services market and the Climate Services market. It is a market data report and contains no non-market mapping or documentation. kMatrix Data Services Ltd is a private commercial company from the U.K. who specialise in providing market data (Sales figures, employment, companies, growth and other metrics) to National and Regional Governments, major research institutions, major corporates, investors and others worldwide. All sales figures relate to the private sector and not the public sector. All figures are for the Total Market and not a sample of the market. All figures are produced by the kMatrix proprietary process, which is unique in its field. The process itself will not the published, but ancillary methodology is available in the D2.1 report in section 2 and appendix J. In all kMatrix reports, “Demand and Supply” refers to commissioned projects and sales where there is a monetary transaction. Disclaimer: The content in this report reflects only the views of the authors. The European Commission is not responsible for any use that may be made of the information it contains.
Interim Definition, Taxonomy and Report
April 2018 Page 2 of 402
Industry Glossary
This Glossary relates to the 27 economic/industrial sectors that have been identified as users of Weather and Climate Services. It describes briefly what aspects of each sector have been included in the research. Agriculture
Provision of Weather and Climate Services to the farming (both
arable and livestock) and other agriculture sector activities.
Biotech
Provision of Weather and Climate Services to the manufacturing and research functions of the bio-tech sector
Built Environment
Provision of Weather and Climate Services to the construction sector, includes the civil engineering (small-scale) and engineering & project management sectors.
Business Services
Provision of Weather and Climate Services to the general business services sector i.e. advertising, marketing, consultancy etc.
Communications
Provision of Weather and Climate Services to the communications sector which includes both the equipment and service provision for all electronic communications.
Defence
Provision of Weather and Climate Services to the defence sector which includes army, air force, navy and central command and control. In addition, this covers border protection and other defence- related activities.
Education & Training
Provision of Weather and Climate Services to the education and training sector which includes schools, universities and other learning environments, as well as commercial, educational and training services to the public and private sectors.
Exploration
Refers to the provision of Weather and Climate Services to Oil & Gas exploration (not the utility for supply) and to Mining and Quarrying.
Food & Drink
Provision of Weather and Climate Services to the food and drink sector, which includes all elements from post- agriculture to retail sales
Forestry & Timber
Provision of Weather and Climate Services to the forestry and timber sector which includes timber processing.
Health Care
Provision of Weather and Climate Services to the healthcare and hospitals sector, which includes both public and the private healthcare delivery.
Interim Definition, Taxonomy and Report
April 2018 Page 3 of 402
Hospitality
Provision of Weather and Climate Services to the hospitality market which includes hotels and restaurants
Legal & Financial
Provision of Weather and Climate Services to the following sub
sectors: general business and private insurance sector; the re-
insurance sector; the financial investments sector; the legal sector
and the banking sector.
Logistics
Provision of Weather and Climate Services to the Logistics sector defined as: Air Travel - Air Travel industry which includes airport management and operations, people and goods but not storage as this is covered within “large vehicles & Storage.” Land Travel - Land Travel industry which includes highway and roadway management and operations, people and goods but not storage as this is covered within “large vehicles & Storage.” Sea Travel - Sea Travel industry which includes port management and operations, people and goods but not storage as this is covered within “large vehicles & Storage”.
Manufacturing
Provision of Weather and Climate Services to the Manufacturing sector, excluding food and drink, pharmaceuticals, bio-tech, chemicals processing and project orientated engineering- all of which are included separately.
News Publishing & Journalism
Provision of Weather and Climate Services to the news,
publishing and journalism sector.
Operational Services
Provision of Weather and Climate- related Services to the operational services sector which, in turn, provides services to industry, airports and call centres.
Pharmaceuticals
Provision of Weather and Climate Services to the research and manufacturing functions of the pharmaceuticals sector.
Public & Charitable Bodies
Public Sector
Provision of Weather and Climate Services to the public sector
which includes, central, regional, and local government and public
services.
Charitable bodies
Provision of Weather and Climate Services to the charitable bodies sector, including non- government organisations (NGOs).
Renewable Energy
Provision of Weather and Climate Services to the renewable energies market, which includes photovoltaic, geothermal and wind.
Interim Definition, Taxonomy and Report
April 2018 Page 4 of 402
Research & Development
Provision of Weather and Climate Services to the research and development sector- i.e. research into the effects of climate change on both food and non- food crops as growing conditions change.
Retailing & Wholesale
Provision of Weather and Climate Services to the retailing and wholesale sector
Tourism & Leisure
Provision of Weather and Climate Services to the tourism and leisure sector, but excludes hospitality.
Utilities Processing Industry Not Elsewhere Classified Civil Engineering Sector Not Elsewhere Classified “Not Elsewhere Classified”
Provision of Weather and Climate Services to the utilities sector,
which includes nuclear and non- nuclear power generation and
distribution, distribution of natural gas and the distribution and
recycling of water.
Provision of Weather and Climate Services to the processing
industry, defined as industrial processing of substances and
materials both solid and liquid. These products range from paints
through to road surfaces.
Provision of Weather and Climate Services to large civil
engineering projects including the assembly and construction of
bridges, roads and other major, load carrying structures.
Provision of Weather and Climate Services to any industries not
elsewhere classified.
Interim Definition, Taxonomy and Report
April 2018 Page 5 of 402
Markets Glossary The 27 economic/industry sectors identified above are divided into 138 distinctive markets. A full list of Industries and Markets are found in Appendix A. These markets are based upon the limitations and differentiations in the source materials available (i.e. we report what we find rather than what we would like to find) and, therefore, may not always correspond to how an industry would typically divide or define its activities. Most of the titles describing these markets are self-evident or self-explanatory. But some are not and so they are included below. Where an industry is defined as "Manufacturing" markets are denoted by different manufacturing processes that may have different Climate Services needs i.e. Aerospace is represented as Aerospace Batch Manufacture, Aerospace Manufacturing Assembly and Aerospace Project Orientated Production. These processes are defined below. Batch Production
Process that, for example, produces vehicle trailers in batches of twenty units to order rather than in a continuous production.
In-Line Process Manufacture
Continuous inline process manufacture, for example, continuous chemicals processing of orientated polymers for the packaging sector.
Manufacturing Assembly
Manufacturing assembly, for example, the assembly of white goods.
Project Orientated Production
Project orientated production, typically of much large products or infrastructure i.e. shipbuilding.
Other markets that may need further definition or clarification are shown below. High End Engineering
High end engineering sector includes, electronics, precision engineering and high value electrical engineering installation and maintenance.
High-Tech based Services (Emergent)
These are predominantly new high tech based services across all industrial sectors. These are new emergent technologies such as artificial photosynthesis, genetic engineering and neuro-informatics.
Industrial Services and Servicing
Industrial services and servicing sector includes large engineering maintenance providers, large industrial catering providers and large supply chain management houses.
Local Government
Where national, regional and local government combine to address issues like long term climate change, through the provision of information to local businesses and residents and by the planning and provision of services like waste management, flood abatement and town and country planning.
Interim Definition, Taxonomy and Report
April 2018 Page 6 of 402
Other Defence Services Providers
Provision of Weather and Climate Services to the other defence services providers not included in the main defence category i.e. providers of non-battle theatre products and services such as home based construction services.
Other Financial Services
Provision of Weather and Climate Services to other financial services not elsewhere covered i.e. Pension funds and private equity funds.
Other Professional Business Services
Provision of Weather and Climate Services to the other professional business services not elsewhere covered for i.e. personnel recruitment agencies.
Other Publications
Provision of Weather and Climate Services to the news, publishing and journalism functions not elsewhere covered i.e. educational publications for academia.
Public Services
Provision of Weather and Climate Services to publicly funded services like Police, Fire, Ambulance and coastal protection.
Interim Definition, Taxonomy and Report
April 2018 Page 7 of 402
Table of Contents Section
Contents
Page
1
Introduction 10-16
2
Methodology and Measures 17-21
3
Uses for Weather and Climate Services 21-23
4
Global Weather and Climate Services 24-56
5
International Weather and Climate Services 57-73
6
Discussion 74-76
Appendix A
Appendix B
Appendix C
Appendix D
Appendix E
Appendix F
Appendix G
Appendix H
Appendix I
Appendix J
Appendix K
Appendix L
Industry Markets
NACE Code Markets
Selected Sources
Confidence Levels
Global Industry Analysis for Climate Services
Global Market Values by Industry and NACE Code
Global NACE Code Analysis for Climate Services
Industries and NACE Code by Platform & Services for
Climate Services
Global Country Analysis for Climate Services
EU Country Dashboards for Climate Services
EU Country Tables for Climate Services
Methodology for Import/Export Data
77-79
80-82
83-87
88-90
91-144
145-152
153-186
187-190
191-195
196-335
336-391
392-402
Interim Definition, Taxonomy and Report
April 2018 Page 8 of 402
List of Figures Page
Figure 1: Confidence Levels for Platform by Key Measure 20 Figure 2: Confidence Levels for Service by Key Measure 20 Figure 3: Confidence Levels for Industry by Key Measure 20 Figure 4: Frequency of Climate Service Uses 22 Figure 5: Weather & Climate Services €m 24 Figure 6: Weather Services €m 24 Figure 7: Climate Services €m 24 Figure 8: Value by Data Platform €m 25 Figure 9: Transaction Volume by Data Platform 26 Figure 10: Value by Service Type Climate and Weather Services €m 26 Figure 11: Value by Service Type CS and WS Transactions 27 Figure 12: Climate Services Historical Growth Trend for Service Types €m 27 Figure 13: Climate and Weather Services by Industry End-User €m 29 Figure 14: Climate and Weather Services by Industry End-User % 30 Figure 15: Industrial split by Climate and Weather Services 32 Figure 16: Historical Climate Services Sales by Industry €m 33 Figure 17: Top 10 Industries for CS split by Market €m 2016/17 34 Figure 18: Top 10 Industries for WS split by Market €m 2016/17 36 Figure 19: Climate and Weather Services by NACE Code End-User €m 39 Figure 20: Climate and Weather Services by NACE End-User % 40 Figure 21: NACE Code split by Climate and Weather Services 42 Figure 22: Historical Climate Services Sales by NACE Code €m 43 Figure 23: Top 10 NACE Codes for CS split by Market €m 2016/17 44 Figure 24: Top 10 NACE Codes for WS split by Market €m 2016/17 46 Figure 25: Top 10 Industries by Service Type for CS 2016/17 (%) 49 Figure 26: Top 10 Industries by Service Type for WS 2015/ 16 (%) 51 Figure 27: Top 10 NACE Codes by Service Type for CS 2016/17 (%) 53 Figure 28: Top 10 NACE Codes by Service Type for WS 2015/ 16 (%) 55 Figure 29: Forecast Global Annual Growth in W&CS (%) to 2024/25 56 Figure 30: Forecast Global Annual Growth in CS and WS (%) to 2024/25 56 Figure 31: Weather & Climate Services Sales by Global Region 2016/17 57 Figure 32: CS and WS Sales Compared by Global Region 2016/17 57 Figure 33: Top 15 Countries for Climate Services 2016/17 €m 58 Figure 34: Top 15 Countries for Weather Services 2016/17 €m 59 Figure 35: Top 15 Countries for CS Imports and Exports 2016/17 €m 60 Figure 36: Top 15 Countries for WS Imports and Exports 2016/17 €m 61 Figure 37: EU 28 Countries for Climate and Weather Services 2016/17 €m 62 Figure 38: EU 28 Countries for CS and WS 2016/17 Imports and Exports €m 62 Figure 39: EU 28 Countries for CS and WS by Platform 2016/17 €m 63 Figure 40: EU 28 Countries Import/Export Data for CS by Platform 2016/17 €m 63 Figure 41: EU 28 Countries Import/Export Data for WS by Platform 2016/17 €m 64 Figure 42: EU 28 Countries for CS and WS by Service 2016/17 €m 64 Figure 43: EU 28 Countries for CS and WS by Service 2016/17 Transactions 65 Figure 44: EU 28 Countries Import/Export Data for CS by Service 2016/17 €m 66 Figure 45: EU 28 Countries Import/Export Data for WS by Service 2016/17 €m 66 Figure 46: EU 28 Countries for CS and WS by Industry 2016/17 €m 67 Figure 47: EU 28 Countries Import/Export Data for CS by Industry 2016/17 €m 68 Figure 48: EU 28 Countries Import/Export Data for CS by Industry 2016/17 €m 69 Figure 49: EU 28 Countries for CS and WS by NACE Code 2016/17 €m 70 Figure 50: EU 28 Countries Import/Export Data for CS by NACE Code 2016/17 €m 71
Interim Definition, Taxonomy and Report
April 2018 Page 9 of 402
Figure 51: EU 28 Countries Import/Export Data for WS by NACE Code 2016/17 €m 72
List of Tables Page
Table 1: Markets with the Broadest Range of Climate Services Needs 23 Table 2: Top 20 Global Climate Services Markets 2016/17 €m 35 Table 3: Top 20 Global Weather Services Markets 2016/17 €m 37 Table 4: Top 20 Global Climate Services Markets 2016/17 €m 45 Table 5: Top 20 Global Weather Services Markets 2016/17 €m 47 Table 6: Industry by Service Type for Climate Services 2016/17 €m 48 Table 7: Industry by Service Type for Weather Services 2016/17 €m 50 Table 8: NACE Code by Service Type for Climate Services 2016/17 €m 52 Table 9: NACE Code by Service Type for Weather Services 2016/17 €m 54 Table 10: Summary Table 28 EU Countries 2016/17 73
Interim Definition, Taxonomy and Report
April 2018 Page 10 of 402
1.0 Introduction Deliverable 2.2 (revised annual baseline for Climate Services 2016/17) updates the previous report D2.1 relating to Climate AND Weather Services in 2015/16. D2.2 will include:
• Updated market values due to changes in taxonomy: new end-user sectors and market applications listed in D4.3
• Filtered results that exclude inappropriate applications like Cladding and Under- Pinning
• Adoption of NACE codes for reporting purposes • Data updated to 2016/17 (also shared with D4.5 on EU NUTS 2 Analysis) • New metrics that include national imports/exports.
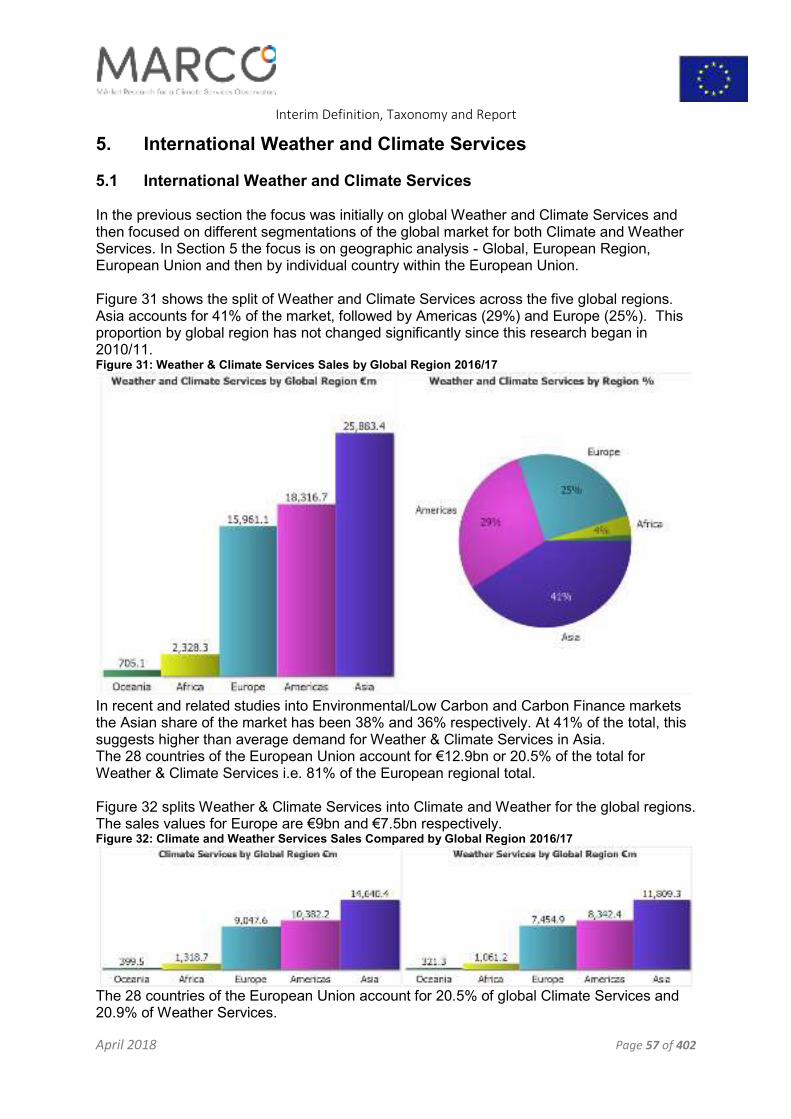
Following on from a previous debate, we will also include references to Weather Services (WS) and calculate the total Weather and Climate Services (W&CS) market (showing CS as a % of the total). But the main focus will be on Climate Services (CS).
1.1 Research Objectives This report has been prepared for the MARCO project as an update to deliverable 2.1, which was itself an update of the original research in 2011 conducted on behalf of the UK Space Agency, the Met Office, the Natural Environment Research Council (NERC) and its industrial partners. This report updates the information from D2.1, with an additional 3 industries and 24 markets. Imports and Exports (values in €m) have been calculated for all industries and markets and are presented throughout the report. Data has been updated to 2016/17 figures, with growth figures for the new taxonomy being calculated retrospectively for previous years. It provides global information on the Weather and Climate Services, Weather Services and Climate Services markets for various measures. It also looks specifically at the 28 countries of the European Union (EU) within a global marketplace. The original research objectives have been maintained for this update/upgrade and were to:
• Measure the global Weather and Climate Services market in its entirety (not just for earth observation data from Space, although this is an important component)
• Identify how market needs are currently being met in terms of data platforms and services
• Identify which industries are driving the demand for Weather and Climate Services
This study measures the global commercial markets for data, information and software services that help to mitigate or manage risks arising from existing climate conditions or from possible climate change. These services range from proactive forecasting to preventive planning to disaster response activities and can be either short term (e.g. weather forecasting), long term (e.g. population displacement due to flooding or desertification) or both (e.g. planning for renewable energy infrastructure).
Interim Definition, Taxonomy and Report
April 2018 Page 11 of 402
This study distinguishes between commercial and non-commercial Weather and Climate Services. Governments invest significantly in the infrastructure and research necessary to provide Weather and Climate Services and in return receive data and services from a range of non-commercial bodies possessing in-house, value-adding expertise. Many of these services are then freely shared with other public and private sector organisations. But this public investment in infrastructure and research also supports a commercial aftermarket for Weather and Climate Services that extends the uses of, and adds value to, the freely available data and analysis. This is where new or bespoke needs arise, where external verification rather that internal opinion is required or where the internal expertise does not exist to process and apply the available data or analysis. There is an increasing pressure on public service providers to justify public investment. There is also increasing pressure to engage users and develop and deliver new and relevant services, which include external verification. This leads to a need for better understanding of the balance between private and publicly available services and the differentiated nature of that balance within Europe and beyond. So, while the original research was motivated by an interest in the exploration of commercial after-markets for data derived from earth observation satellites, the context for the research required a comprehensive analysis of all complementary and competing sources of data for Weather and Climate Services markets. This report starts by analyzing the Weather & Climate Services sector as defined by the MARCO project and then focuses upon a deeper analysis of Climate Services and an ongoing comparison with Weather Services, with the inclusion of Import and Export data.
1.2 Defining the Weather & Climate Services Sector The original research focused on Weather and Climate Services and while the debate has progressed and Climate Services is now a focus for European Research, the context of the research still remains largely unchanged. Weather Services are the better known of the two and the difference between them is still much debated. In its simplest form, the difference between the two relates to the duration of time the data and service relates to i.e. a short-term solution (e.g. do I irrigate my crops this week?) relies on weather forecasting while a solution set further into the future (e.g. what is the likelihood of persistent crop failure leading to food shortages?) relies on longer term climate data. In reality, Weather Services and Climate Services are two points on a single continuum and many organisations require both sets of information, although (as Section 4 demonstrates) different industries use both Weather Services and Climate Services in different proportions. At different points in Sections 4 and 5 of this report the terms Weather & Climate Services sector (the totality), Weather Services and Climate Services will be used. While Climate Services is the focus of interest for MARCO, comparison with Weather Services is critical to understanding the context within which needs are defined and purchases are undertaken.
Interim Definition, Taxonomy and Report
April 2018 Page 12 of 402
From the user’s perspective weather services and climate services are a single continuum of services, with both types of service being required by many (if not most) users. The decision-making perspective makes this situation even more obvious, where there is a need to deal with the existing adaptation deficit and current climate variability and change (including extremes) through to the implications of a changing climate. The user’s perspective of a single continuum of services also reflects the implications of mainstreaming adaptation. Weather services and Climate services are being separated because market evidence shows that weather services are often procured as a separate item, if not an initial item before the procurement of climate services. This is partly due to much procurement in this sector being driven by corporate governance in major corporates for example. From a market data point of view, the two services really are separate at this time. Climate Services is a less well-known term and needs more explanation. The term "Climate Services" was actively promoted by the World Meteorological Organisation (WMO) at the World Climate Conference in 2009 as part of a "Global Framework for Climate Services." Since then various attempts have been made to define the purpose (if not the content) of Climate Services. Definitions of purpose generally include reference to "providing information or tools" to "decision makers" to help "mitigate, adapt to or manage risks" arising from "existing climatic conditions or from possible climate change". Both meteorological and hydrological data and services are included within the definition of Climate Services. The various definitions include references to proactive forecasting, preventive planning and disaster response activities and these can include both short term (weather forecasting) and long term (population displacement due to desertification) problem solving. The World Meteorological Organisation1identifies some of the many reasons why Climate Services are important to both the public and private sectors. These include:
• Anticipating changes to water quality, availability and demand
• Responding to water-related risks from extreme events
• Planning for natural disasters that may lead to crop failure and food insecurity
• Managing population displacement (migration) due to extreme events or climate change
• Supply planning for energy demand (investments in generation/distribution systems)
• Forecasting seasonal conditions for the generation of renewable energies based upon wind, solar and wave power
• Anticipating the impact of weather conditions or climate change on high-dependency resorts for tourism, hospitality and some aspects of travel
• Urban planning - what to build, where, how and to what specification based upon changing conditions
• Planning where to site transport infrastructure and hubs
• Minimizing operational disruptions to air, land and sea travel. The original market research adopted the broadest definition of purpose for Weather and Climate Services (including all of the above solutions) and translated this into a wide range of related market activities that underpin and deliver upon that purpose. Hence the segmentation within this research report into Weather Services and Climate Services, data platforms, service types, industries and markets.
1 www.wmo.int
Interim Definition, Taxonomy and Report
April 2018 Page 13 of 402
The research started with a hypothetical model of the Weather & Climate Services sector and then searched for data to either support or amend this model. The result was a pragmatic statement on Weather and Climate Services i.e. it only includes an activity and data where there is enough useful evidence to support it. The segmentation and headings used for the various activities within Weather and Climate Services are mostly derived from the data sources themselves (i.e. the user-industries) and from a need to group the evidence in a meaningful and hierarchical format. This market segmentation does deliver a quantitative baseline for the Weather & Climate Services sector (as shown by Sections 4 and 5 of this report) but it does not reflect or give a flavour of the full scope of forecasting, planning, reporting etc. activities that are conducted increasingly across many industries under the broad "umbrella" of Weather and Climate Services. To reflect the broad "needs" that Weather and Climate Services meets, the research included a brief "audit" of industry activities that, unlike the main body of the research, is unquantified. These "uses" are described in more detail in Section 32 and remain relevant enough to not require immediate updating. Once the original research was underway, it became clear that Weather Services and Climate Services should in some way be separated out for analysis. Unfortunately, most of the purchasing data sources used to compile the research data was not always clear about whether they were seeking a Weather or Climate-related solution. Therefore, the research data was split according to:
• Whether the purchaser thought that the purchase was Weather or Climate-related (i.e. it has Weather or Climate in the title), or
• Without Weather or Climate in the title, could the purchase or intent be identified as a short-term solution to a weather sensitive issue or as a longer-term challenge.
So, the original split between Weather Services and Climate Services was a pragmatic amalgam of intent and timescale. Since 2011 the data sources to support this research have increased in both quality and quantity. There is still, however, clearly uncertainty in end-user markets about the differences between the two types of services. So, separating the two sets of services in data terms is still part-science/part-art.
1.3 Defining "Commercial" Weather and Climate Services In the original research, there was also a need to distinguish between commercial and non-commercial Weather and Climate Services. Governments invest significantly in the infrastructure and research necessary to provide short and long-term Weather and Climate Service data (from air, land, sea or space), tools and analysis and in return receive (and share) data and services free of charge. So, a large proportion of the Weather and Climate Services market includes free data, tools and analysis that are "internalized" by public and private sector customers for their own purposes. This report does not attempt to quantify these services, although the money invested in them is substantial3. But this investment in infrastructure and research also supports a commercial aftermarket for Weather and Climate Services that extends the uses of, and adds value to, the freely
2 A Eurisy publication "30 Regions, Cities and SMEs Share Good Practice" Oct 2011 includes local examples where earth
observation data in used to response to challenges in the Energy, Environmental, Agricultural and Forestry sectors. 3 More information about global initiatives to leverage current levels of public investment into more effective and widely
available Climate Services (for humanitarian and economic purposes) can find this at www.wmo.int and in the WMO
publication- "Global Framework for Climate Services" 2009.
Interim Definition, Taxonomy and Report
April 2018 Page 14 of 402
available data and analysis. This is where new or bespoke needs arise, where external verification rather that internal opinion is required or where the internal expertise does not exist to process and apply the available data or analysis. So, this research is NOT intended to be an assessment of public sector investments in Weather and Climate research, but an analysis of the traceable commercial "after-market" that follows on from these investments, the resulting research and subsequent national and international policy agendas. The research is based upon a complex methodology that uses multiple sources of data to derive statistically significant market numbers in terms of value (€m), volume (transactions) and market growth (%). This is described in more detail in Section 3. This methodology has been applied to many "difficult-to-measure" industry activities including other space-related opportunities for earth observation like Carbon Markets. Following the advice given at a UK Space Conference (2011) the focus is on uncovering "markets that do not have Space in the title." Since 2011 this research methodology has been applied to equally complex sectors and markets like climate change adaptation, the green economy, geo-services, cyber security and design.
1.4 Segmenting Commercial Weather and Climate Services It was recognized that many of the Weather and Climate Service solutions identified above often required multiple services, multiple data sources and may be conducted over several years by several suppliers. These services may be purchased as a single contract or as several services combined. The previous report (D2.1) reported on the individual data platforms, however through the MARCO project, another platform called “Mixed Services” has been added. The research segments the Weather and Climate Services Aftermarket in a variety of ways. The first is by data platform, where the options are now Airborne, Land, Marine, Space and Mixed Services: Air Services
Refers to earth observation via airborne systems - Fixed & Rotary winged manned and unmanned aircraft and air ships
Land Services
Refers to earth observation via land-based systems like land-based radar, weather stations, atmospheric sampling and arctic survey.
Marine Services
Refers to earth observation via Sea-based systems i.e. marine craft both surface and underwater, buoys and sea bed systems
Space Services Mixed Services
Refers to earth observation via Space craft-based systems - Including satellites and space stations. Refers to a mixture or combination of the other four platforms.
The second level of segmentation is by service type, of which there are eight that can be fully differentiated and quantified. These are:
Interim Definition, Taxonomy and Report
April 2018 Page 15 of 402
Advisory Services
Advisory services, risk assessment and decision support tools provided to public and private sector organisations relevant to global weather, climate and climate change. For example, risk assessment for the long-term location of nuclear power stations.
Data Management
Provision of calibrated data sets, data archiving, data certification and data sales for global weather, climate and climate change applications. For example, the provision of validated data sets to consultancies for further analysis.
Measurement
Instruments and technologies for measurement and calibration for global weather, climate and climate change applications. For example, the provision of assistance and advice in the assembly of sensing arrays for ground-based weather stations.
Modelling
Modelling of data, both certified and non-certified for global weather, climate and climate change. For example, the modelling of collated data from the arctic survey in order to predict the most likely rate of degradation of the polar ice cap.
Operation
Collection and provision of raw data for global weather, climate and climate change applications i.e. the provision of raw date to media weather centres.
Other Consulting
Consulting services for global weather, climate and climate change not elsewhere covered i.e. the provision of advice on corporate statements to share-holders on corporate policy towards climate change. "Other Consulting" often includes more general consulting services about corporate responses to the challenges arising from specific weather and climate data (whether purchased separately or processed internally) and also more specialist services (incorporation of new data sets).
Processing & Re-Analysis
Provision of data analysis and retrieval services including data mining tools, for global weather, climate and climate change i.e. the provision of essential climate variable models to academia.
Publication
General publication of analysis findings for global weather, climate and climate change i.e. the assembly of publications on climate forecasts based on data and analysis for both private and public sector organisations.
The research measured each of these services individually, although it is well known that the different services complement one another and are often purchased together. Each service type was then segmented into Industries that reflected WHERE in the global economy they were being purchased. An assessment of the data sources and collaboration with MARCO partners has enabled us to identify 27 broad Industry/economic sectors that
Interim Definition, Taxonomy and Report
April 2018 Page 16 of 402
reflect the full range of current Weather and Climate Services interests. These are listed below and described in more detail in the Glossary.
• Agriculture
• Biotech
• Built Environment
• Business Services
• Communications
• Civil Engineering Sector NEC
• Defence
• Education & Training
• Exploration, Mines and Quarries
• Food & Drink
• Forestry & Timber
• Health Care & Hospitals
• Hospitality
• Legal & Financial
• Logistics
• Manufacturing
• News Publishing and Journalism
• Not Elsewhere Classified
• Processing Industry NEC
• Operational Services
• Pharmaceuticals
• Public & Charitable
• Renewable Energy
• Research & Development
• Retailing & Wholesale
• Tourism & Leisure
• Utilities
It was felt that analysis at the Industry level might be too "broad brush" so these in turn were segmented into more easily understood or more accessible markets (138 in total). These markets are listed at Appendix A and some of the less obvious ones are described in more detail in the Glossary. We also included 380 applications as new column to the dataset and sub-divided according to the previous activity heading of Advisory, Data Management, Measurement, Modelling, Operations, Consulting, Publications and Processing, Re-analysis etc. Applications are effectively solutions that draw on data/information from a range of sources (Land, Satellite, Air and Sea), which is why the “Mixed” category was added to the platform list. By combining the different segments of Weather and Climate Services (Platform, Service, Industry and Market) a data template of 6815 market options was created and then populated for 181 countries (45 countries returned no data) to create the global analysis. Since 2011, the research sources have improved to the point that now data is available on almost all countries. The global analysis of this data is the focus of Section 4 of this report, where the Weather & Climate Services sector is measured for value, transactional volume and growth and differentiated by platform, service, industry and market. In Section 5 the focus is at the international level, (28 countries of the EU) identifying the key economies for Weather and Climate Services. As this is a baseline analysis to create a context for further and deeper study of Climate Service needs and delivery, evidence outweighs commentary. But it is hoped that evidence will provoke commentary based upon experience and new market feedback. Following on from the detailed quantitative analysis in Sections 4 and 5 of the original research, Section 6 presents several findings and observations that relate both to the compilation and analysis of the Weather and Climate Services data set. This section remains relevant to the issues of quantifying a “difficult” sector like Weather & Climate Services and is essentially unchanged from D2.1.
Interim Definition, Taxonomy and Report
April 2018 Page 17 of 402
2. Methodology and Measures
2.1 Research Methodology This report shares a methodology with a much broader research programme for the Low Carbon, Renewable Energy and Environmental sector and the Adaptation Economy that has been applied across three continents for the past ten years. The methodology is highly suited to the analysis of new and evolving markets, new-to-market technologies and “difficult to measure” industries because it works beyond standard national, industrial and market classifications and looks for multiple sources of industrial-based evidence (including the triangulation of data sources) to quantify data values. The methodology relies on a core analytical process called Profiling. This is based upon a 25-year international research programme that started in Harvard University and was subsequently developed in countries across Europe. Profiling is used to track technology and market change and uses analytical data grids, business case studies and industry research to provide probabilistic and measurable evidence about how companies and economies adapt to changing market conditions. The Profiling methodology was first tested against wide ranging corporate business portfolios and then implemented in Russia under US government initiatives to create a sustainable light industrial base. Since then it has been applied to start-ups, micros, SME’s, corporates and whole industries by government, financial and professional services sectors in the US, Europe and Australasia. The methodology has been tried and tested against both new and traditional industries on three continents and more specifically, has been applied to most priority UK economic sectors at global, national, regional and local level. Recent research targets include Environment Technologies, Low Carbon Industry, Renewable Energy, the Water Industry, Adaptation Economy, Marine Environment, Green Economy and Carbon Markets. While the requirements for each industrial sector research project vary, the methodology always follows the same five key stages:
• Define - Identify, select and group the target market activities, whilst conducting an initial check for the right volume and quality of data sources
• Assemble - Populate the data measures for each market activity, carefully filtering the core data sources to ensure that confidence levels are within bounds
• Check - Apply quality assurance checks to ensure data accuracy/ consistency across market activities and different countries and, in some cases, cross-check with different sector values
• Validate - Sense-check and spot-check market data values against specific projects/authoritative sources/expert knowledge/customers or clients
• Publish - Recalculate, update confidence levels and publish research data set. Market activities are only included within this framework when there are multiple sources of reliable data. These sources are screened to remove duplicate references to any single source and then shortlisted by removing outliers and unreliable sources. This shortlist is then
Interim Definition, Taxonomy and Report
April 2018 Page 18 of 402
screened again until some consistency in value is achieved. From the remaining sources a value is then calculated and published. Values created in this way are then “reality tested” by comparing activity values within and across economic or industrial sectors, against known national specialism, against known international trade flows, recognized industry benchmarks and ultimately, government statistics (if they are available). To reflect the wide range of industries under investigation there has to be a very wide range of sources from government, private sector, institutional, industrial, trade, Advertising, HR, financial, investor, academic and other (unpublished and “traded”) sources. These are summarised at Appendix B (approximately 600 sources) but exclude many country - specific and proprietary data sources. The exclusion of sources is based on their historic reliability, particularly in the area of forecast. Many in-country sources prove to be unreliable, particularly where they do not take into account inter-trading activities between regions and countries. This is common throughout Europe and not a characteristic of only a select number of countries. The methodology is quantitative and data intensive and, therefore, very reliant on being able to identify and evaluate multiple data sources. Much of the intellectual property resides in the process for managing and selecting reliable sources that are specific to each market activity. As a result, sources are carefully managed. They are measured and rated for their accuracy and reliability over time. Multiple references to single sources are discounted from the analysis and sources that are outdated or without a measurable track record are excluded. No less than seven qualified sources showing some consistency in results are used to derive any published values. All market intelligence produced in this way is delivered with confidence levels assigned. Confidence levels are a mathematical function of the spread of values across the range of sources that we include in our analysis. Confidence levels vary by activity, geography and by forecast year. Typically, a confidence level of above 80% is achievable, which means that corroborative sources vary around the mean value by +/- 20%. Since the original Weather & Climate Services sector research in 2011, this methodology has become much more widely documented and audited and, as a result, government work conducted using this methodology now qualifies as official statistics, having met the requisite standards. Extracts from the methodology documents, that are relevant to this research, can be provided upon request.
2.2 Defining the Key Measures In this report four key measures are used - Activity Value, Transaction Volume, Growth and Confidence Levels. Each one is explained briefly below. Transaction Volume and Activity Value Value and Volume are often (but not always) two sides of the same coin and in this research are inextricably linked. Within this report a transaction is a sale of either a product, service or product/service combination to another party. "Sale" is the operative word, because this research only considers Climate Services activities that have a financial "footprint". It does not include transactions that are provided free or are exchanged between organisations at no cost. Neither does the research include as part of its forecasts the potential value of services still under development i.e. that have not yet reached the market.
Interim Definition, Taxonomy and Report
April 2018 Page 19 of 402
So, delivery of a due diligence report on the climate risk of a project investment for a water company would be a transaction with a value (monetary) and a volume (of 1) i.e. a contract between two parties for a particular outcome. In some cases, long term multi-project contracts are placed that include multiple transactions over an extended period, in which case additional data sources are used (primarily from the industry concerned) to analyse and disaggregate the contract numbers into transactional values and volumes. In order to measure values and volumes a large number of data sources are used to maximise the accuracy of the output. Usually a source tends to state either volume or value, as their reasons for reporting are usually different. In addition, it is often the case that a source that is known to us to be reliable in reporting volume (say a data confidence rate of 80%) will be unreliable when reporting value (say a data confidence of 65% or less). This is why a large number of sources are reported for each line of data that is compiled - different sources are always used in different combinations to calculate each key measure4. A simple example of consulting multiple sources might be where we know that there were 35 investments above £1m each placed in the water purification sector in 2009/10 totaling £250m (we know this from the water sector); the fund management sector reports that £3.8m was spent on due diligence risk analysis in the water purification sector and the legal sector reports between 28 and 35 due diligence contracts for the water purification sector. Together, these sources enable an intelligent estimate of both value and volume for different but related market activities. A further example might be where for the purposes of corporate governance, major corporate organisations commission external consultants to provide ten-year risk mitigation advice to the main board on the implications of climate change. The consulting sector data shows that in 2010/11 250 major corporate organisations have commissioned this kind of work (the consulting data rarely shows work value for commercial reasons). The investor relations and fund management sector data shows that overall £8.75m was spent on this kind of work and in addition the sector-specific trade associations data reports independently that some £9.2m has been spent. By triangulating data from the different sources it is possible to arrive at highly accurate estimates of value and volume that are just not possible from consulting a single source, however authoritative that source may be within its own sector. Growth Growth is a multi-year measure that includes historical AND forecast growth. The growth measure is derived from live, rapidly changing and multi-sourced data links and is specifically based upon growth in the market value of existing Climate Service activities. Growth is generally a measure of increased market opportunity and can be used for trend analysis, comparison across different markets or as a moving indicator of market confidence (growth time series). The source data for growth forecasts varies enormously and can produce very unsettling and unreliable results if not handled carefully. This is why multiple sources are used, specific to individual activities, and then processed to exclude the outlying high and low estimates until a more consensual set of sources is selected, from which a growth estimate is then calculated. Using this method, it is possible to generate different growth forecasts (high,
4 The number of sources per line of data can vary between 230 (mature sectors/larger economies) and 24 (emergent
sectors/smaller economies). Generally speaking, the higher the number of sources the higher the confidence level that we
assign to the data.
Interim Definition, Taxonomy and Report
April 2018 Page 20 of 402
medium, low) with different risk/confidence levels. This research uses a conservative growth forecast. Confidence Levels All of the above data values are created by the intelligent use and transformation of other primary and secondary data sources. Data sources are carefully managed by measuring and rating their accuracy and reliability over time and by excluding sources that are outdated or without a measurable track record. No less than seven qualified sources are ever used and often, as is the case for this research, the final list of sources is much higher than this. A mean value is then calculated from these selected values and assigned a confidence level. What level of importance should you assign to the data within this report? The answer to that is in the confidence levels for this report, have been calculated for activity value, transaction volume and growth, by country and by industry. The detailed results are shown at Appendix C but, in summary, the global confidence level for all values, aggregated by Platform (Figure 1), Service Type (Figure 2) or Industry (Figure 3) is between 77-84%5. Figure 1: Confidence Levels for Platform by Key Measure
Figure 2: Confidence Levels for Service by Key Measure
Figure 3: Confidence Levels for Industry by Key Measure
5 Confidence levels vary at the individual country level, but these differences "net out" at the global level
Interim Definition, Taxonomy and Report
April 2018 Page 21 of 402
In each case these charts show the confidence level on the horizontal axis, the key measure on the vertical axis and each bubble represents one of the options i.e. Land, Air, Marine or Space. The size of each bubble represents the comparative value (£m) of that option. What these charts demonstrate is that while the distribution (size and positioning of options) may vary quite widely, reflecting the differences in activities and sources, the variance is within quite a narrow band. The final Confidence Level relates to the splitting of the data sources between weather Services and Climate Services. This ranges between 60% and 90% depending upon the platform, industry, market, service or country. Overall the mean figure is 75%, which means the separated values for each (within the total value) may vary within +/- 25%. This mean figure was 75% for the original research and remains at 75%. This suggests that the level of clarity around the division between Weather and Climate Services in the source literature has not substantially changed since 2011 - hence the need for projects like MARCO. Confidence Levels specific to this report can be found in Appendix D. Extended Methodology available in Deliverable D2.1 in Appendix J. Import? Export methodology available in Appendix L of this report.
3. Uses of Weather and Climate Services In Section 2.2 it was suggested that there was a danger that focusing solely upon how Weather and Climate Services are delivered may detract from the ways in which industries are using Weather and Climate Services. To overcome this an audit was conducted as part of the original research of "uses" from the core data sources for this study. The audit was conducted by checking predominantly purchasing sources of data to identify a description of the services purchased. The audit consists of a subjective assessment of uses that have been aggregated under the following 26 headings:
• Corporate Governance
• Insurance Purposes
• Corporate Planning Long Term
• Estates Locational Planning
• Content for Information- Giving Services
• Forward Crop Planning
• Investment Planning
• Infrastructure Planning
• Service Provision Planning
• Major Capital Project Planning
• Irrigation & Drainage Planning
• Research Programmes
• Disaster Recovery Planning
• Health & Safety Services
• Futures Market Data
• Humanitarian Relief planning
• Exploration Planning
• Installation Redundancy Planning
• Regulatory Services (Land Cover)
• Forensic Services
• Border Management & Planning
• Long Term Operations Planning
• Long Range Product Planning
• Educational
• Resource Planning
• Environmental Planning
These headings were then applied to the original 114 markets for Weather and Climate Services and where there was evidence that a "use" was applicable to a market a "1" was noted against the market. Unlike the original analysis of data platforms, services, industries etc. that has been updated and replicated in Sections 4 and 5 of this report, no attempt was
Interim Definition, Taxonomy and Report
April 2018 Page 22 of 402
made, then or now, to quantify either the volume of the above usages or their financial value. The audit was used only to illustrate the:
• Types of needs that Weather and Climate Services fulfill (to demonstrate that the wider research in this report has understood and captured the main uses of Weather and Climate Services), and
• Degree to which these needs are shared across different markets (to validate the industries and markets included as part of the research).
The audit showed that the most frequent usages of Weather and Climate Services were for Corporate Governance (public and shareholder accountability), Insurance, Corporate Planning and Investment Planning - functions that apply to most larger organisations and that are evident for almost all of the markets included in this study. The most specific uses of Weather and Climate Services were for:
• Forward Crop Planning (Arable, Livestock, Forestry, Timber Processing, Government, Charitable, Research and General Consulting markets)
• Exploration Planning (Water, Waste Management, Photovoltaic, Petrochemical, Oil & Gas Exploration, Mines & Quarries, Civil Engineering and General Consulting), and
• Border Management (Legal, Defence, Public Services and General Consultancy). The frequency of the listed 26 uses of Climate Services is shown at Figure 4. Figure 4: Frequency of Climate Service Uses
The audit also showed that some markets (Consultancy, Government, Public Services, Charities and Business Services) have a very broad need for Climate Services and that the needs for other markets (Financial Investments, Leisure, Tourism etc.) can be quite narrow. Table 1 shows the markets with the broadest range of needs.
112 112 110 110 108
97 9589 87 84 80 78 75
6256
18 16 14 13 13 11 11 9 9 9 6
Interim Definition, Taxonomy and Report
April 2018 Page 23 of 402
Table 1: Markets with the Broadest Range of Climate Services Needs
Frequency of use, however, should not be confused with the value of particular services or of specific markets. This information about the uses of Climate Services is really a qualitative backdrop for the quantitative analysis that follows.
What is interesting, about this early audit work and the questions that it posed is the fit with current funded projects specifically targeted at the challenges of qualifying and quantifying both met and un-met needs for Climate Services.
Industry Market Total
Business Services Consultancy (General) 26
Business Services Other Professional Business Services . 26
Public & Charitable Bodies Public Services 21
Public & Charitable Bodies Local Government 20
Renewable Energy Photovoltaic & Solar 20
Built Environment Civil Engineering 18
Education & Training Public Sector Education 18
Manufacturing Petrochemical 17
Public & Charitable Bodies Charitable Bodies 16
Util ities Energy Supply (Gas and Electricity) 16
Education & Training Large Private Educational Establishments 16
Manufacturing Aerospace and Aeronautical (Batch Production) 15
Interim Definition, Taxonomy and Report
April 2018 Page 24 of 402
4. Global Weather & Climate Services
4.1 Introduction In this section of the report the global market for the Weather & Climate Services sector is quantified using the key measures of value, transaction volume and growth, with trade flows (import and export figures). The global Weather & Climate Services market is segmented by data platform, services, industry, markets and NACE codes. The main analysis is of 2016/17 data, but some historical analysis is included.
4.2 Weather & Climate Services Historic Growth The global Weather & Climate Services sector was first measured in 2010/11. At that time, it was estimated to be £26.6bn or €36.6bn using the initial taxonomy and definition. The previous report (D2.1) provided historical data back to 2010/11, however the integration of a Mixed Services Platform has limited the availability of data for this report to 2014/15, which allows us to see a 3-year historic growth pattern. This will be updated with the 2017/18 market figures to give a better picture in D2.3. The new taxonomy and definition has been retrofit to previous years, which is why the size of the market for previous years in this report varies from the D2.1 report. Using the MARCO definition and taxonomy, the global Weather and Climate Service market has grown from €53.9bn in 2014/15 to €63.5bn by 2016/17 as shown by Figure 5.
Figure 5: Weather & Climate Services €m
Historical growth in the Weather & Climate Services sector has been 7.9% in 2014/15 and 8.6% 2015/16.
Figure 6: Weather Services €m
Weather Services was first estimated to be €26.9bn in 2014/15. This has increased to €29bn by 2016/17.
Figure 7: Climate Services €m
Climate Services was first estimated to be €29.4bn in 2014/15. This increased to €35.8bn by 2016/17.
Interim Definition, Taxonomy and Report
April 2018 Page 25 of 402
Overall, Climate Services since 2014/15 has slightly increased its share of the market compared with Weather Services. Climate Services accounted for 54.5% of the total market in 2015/16, 55.6% in 2015/16 and 56.6% of the total market in 2016/17. This indicates that the more traditional Weather Services have been growing slightly slower over that period than the emerging Climate Services market. The previous study suggested that Weather Services and Climate Services were growing at the same rate, this new information about what is actually going on is due to the improved definition of the sector.
4.3 Climate and Weather Services by Data Platform From this point on in the analysis all figures relate to the latest data i.e. 2016/17 and compares Climate and Weather Services. The global value of Weather and Climate Services is split across the five data platforms - Airborne, Land Based, Marine in Situ and Space being the four key platforms and Mixed Services being combinations of the previous four. In Figure 8 for Climate Services, Land Based Services accounts for €12.7bn or 36%, followed by Airborne €9.1bn (26%), Space €8.1bn (23%), Mixed €3bn (8%) and Marine €2.8bn (8%). This compares with Weather Services Land €9.7bn or 33%, followed by Airborne €7.4bn (25%), Space €6.1bn (21%), Mixed Services €3.6bn (12%) and Marine €2.3bn (8%). Figure 8: Value by Data Platform €m
Interim Definition, Taxonomy and Report
April 2018 Page 26 of 402
The global volume of transactions for Weather and Climate Services is estimated at 16.8m, of which 7.0m are Climate Services and 9.7m are Weather Services. Figure 9 shows that Climate Services Land Based Services accounts for 2.6m transactions or 37%, followed by Airborne 1.9m (27%), Space 1.6m (23%), Marine 580,000 (8%) and Mixed 360,000 (5%). For Weather Services Land accounts for 3.6m transactions or 37%, followed by Airborne 2.6m (27%), Space 2.2m (23%), Marine 790,000 (8%) and Mixed 500,000 (5%). Figure 9: Transaction Volume by Data Platform
4.4 Climate and Weather Services by Service Type The second segmentation level for global Climate and Weather Services is by Service Type.
Figure 10: Value by Service Type Climate and Weather Services €m
Figure 10 shows that for Climate Services, Climate Advisory Services at €8.4bn (24%) and Other Consulting at €7.9bn (22%) are the highest values services, followed by Processing & Re-Analysis (12%), Modelling (11%), Measurement (9%), Operation (8%), Publication (7%) and Data Management (6%).
The percentages per Service Type are broadly similar for Weather Services.
Interim Definition, Taxonomy and Report
April 2018 Page 27 of 402
Figure 11: Transactions by Service Type Climate and Weather Services
Figure 11 shows that for Climate Services, Climate Advisory Services at 1.7m transactions (24%) and Other Consulting at 1.3m (21%) are the highest volume services, followed by Processing & Re-Analysis (12%), Modelling (12%), Measurement (10%), Operation (8%), Publication (8%) and Data Management (6%).
The percentages per Service Type are also broadly similar for Weather Services.
Figure 12 compares the historical values for Climate Services for each Service Type from 2014/15 to 2016/17. Figure 12: Climate Services Historical Growth Trend for Service Types €m
4.5 Weather and Climate Services by Industry The third segmentation level for global Weather and Climate Services is by Industry (see Glossary for brief Industry definitions). These Industries are, in turn, made up of different markets (varying from 1-26 for each industry) and they will be explored in more detail in sub section 4.6.
Interim Definition, Taxonomy and Report
April 2018 Page 28 of 402
Figure 13 shows the distribution of global sales of Climate and Weather Services for each of the 27 different Industries for 2016/17. The top 10 industries for Climate Services account for €23bn or 64% of the total. These are: Built Environment (€3.2bn); Renewable Energy (€3.1bn); Public & Charitable Bodies (€2.8bn); News, Publishing & Journalism (€2.7bn); Legal & Financial (€2.6bn); Exploration, Mines & Quarries (€2.2bn), Utilities (€2.1bn); Agriculture (€1.6bn); Forestry & Timber (€1.5bn) and Food and Drink (€1.3bn). The top 10 industries for Weather Services account for €19.4bn or 67% of the total. These are: Legal & Financial (€3.4bn); Public & Charitable Bodies (€3.2bn); Renewable Energy (€2.7bn); Utilities (€2.5bn); Pharmaceuticals (€1.5bn); Operational Services (€1.4bn); Built Environment (€1.3bn); Health Care and Hospitals (€1.3bn); Defence (€1.2bn) and Business Services (€1bn). Compared with the previous segmentations by Platform and by Service, industries end-users show much more significant differences between Climate and Weather Services.
Interim Definition, Taxonomy and Report
April 2018 Page 29 of 402
Figure 13: Climate and Weather Services by Industry End-User €m
Interim Definition, Taxonomy and Report
April 2018 Page 30 of 402
In Figure 14 the same data is shown, but this time as a percentage for each end-user industry for 2016/17. Figure 14: Climate and Weather Services by Industry End-User %
Interim Definition, Taxonomy and Report
April 2018 Page 31 of 402
Figure 15 explores the different industrial needs for Climate and Weather Services as a percentage of the total. Some industries like Agriculture, Hospitality, Tourism & Leisure and News, Publishing & Journalism are more focused on Climate Services as a percentage of their needs, compared with Defence, Legal & Financial, Retailing and Wholesale and Business Services who are more focused on Weather Services. Some of these results may appear surprising i.e. Agriculture and demand for Weather Services, but industry demand patterns will reflect the “commoditisation” of some weather services, as free services and new apps continue to enter and dominate the market. The full Climate Services details of each of the 27 industries included in this analysis is captured in a series of dashboards at Appendix J.
Interim Definition, Taxonomy and Report
April 2018 Page 32 of 402
Figure 15: Industrial split by Climate and Weather Services
Interim Definition, Taxonomy and Report
April 2018 Page 33 of 402
Figure 16 shows the historical sales values for Climate Services for the period 2014/15 to 2016/17. These figures suggest that global demand for Climate Services by Industry are well established and not subject to rapid or significant change. Figure 16: Historical Climate Services Sales by Industry €m
Interim Definition, Taxonomy and Report
April 2018 Page 34 of 402
4.6 Weather and Climate Services by Industry and Markets Each of the 27 industries is segmented into more distinctive markets. In Figure 17 the top ten industries (identified above) are divided into markets for global Climate Services using stacked bar charts. Table 2 Ranks the Top 20 markets for global Climate Services. Figure 17: Top 10 Industries for Climate Services split by Market €m 2016/17
Interim Definition, Taxonomy and Report
April 2018 Page 35 of 402
Table 2: Top 20 Global Climate Services Markets 2016/17 €m
The top 10 industry markets for Climate Services account for €14.4bn or 40% of the 2016/17 total. The top 20 industry markets for Climate Services account for €21.1bn or 59% of total sales in 2016/17.
The total number of industry markets is currently 129, so 16% of the industry markets account for 59% of the Climate Services value. In Figure 18 the top ten industries (identified above) are divided into markets for global Weather Services using stacked bar charts. Table 3 Ranks the Top 20 markets for global Weather Services.
Public and Charitable Bodies Local Government 1,623.6
News Publishing and Journalism Multi Media and Broadcasting Sector 1,412.1
Exploration, Mines and Quarries Oil and Gas Exploration 1,395.8
Multi-Industry Location Planning for Large Establishments 1,330.5
Agriculture Arable 1,323.4
Utilities Water Supply 1,180.2
Forestry and Timber Forestry Corporates 1,127.3
Built Environment Construction 1,091.7
Hospitality Hotels and Catering 893.9
News Publishing and Journalism News Papers and Periodicals 847.5
Public and Charitable Bodies Public Services 722.9
Exploration, Mines and Quarries Mines and Quarries 716.2
Utilities Energy Supply (Gas Electricity) 649.7
Health Care and Hospitals Hospitals 620.9
Food and Drink Food Production (In-Line Process Manufacture) 606.4
Legal and financial Re Insurance 581.8
Tourism and Leisure Operation of Leisure Facilities 537.2
Renewable Energy Geothermal 503.0
Interim Definition, Taxonomy and Report
April 2018 Page 36 of 402
Figure 18: Top 10 Industries for Weather Services split by Market €m 2016/17
Interim Definition, Taxonomy and Report
April 2018 Page 37 of 402
Table 3: Top 20 Global Weather Services Markets 2016/17 €m The top 10 industry markets for Weather Services account for €11bn or 38% of the 2016/17 total. The top 20 industry markets for Weather Services account for €16bn or 56% of total sales in 2016/17.
The full listing for all 129 markets is included at Appendix F.
Industry Market
Weather
Services €mPublic and Charitable Bodies Local Government 1,858.6
Renewable Energy Wind 1,639.1
Multi-Industry Location Planning for Large Establishments 1,584.1
Utilities Water Supply 1,415.0
Public and Charitable Bodies Public Services 820.7
Built Environment Civil Engineering 763.8
Legal and financial Re Insurance 746.9
Utilities Energy Supply (Gas Electricity) 742.1
Business Services Consultancy (General) 722.9
Defence Contractors for Defence Projects 693.1
Healthcare and Hospitals Hospitals 607.9
Exploration, Mines and Quarries Oil and Gas Exploration 588.0
Pharmaceuticals Pharmaceuticals (In-Line Process Manufacture) 567.8
Legal and financial Future Analysts 554.6
Operational Services Airport Servicing and Operations 535.4
4.7 Weather and Climate Services by NACE Codes The kMatrix taxonomy of data is built from the “bottom up” rather than the “top down”, this means that the data is not fixed and allows reporting in different formats. The previous sections have looked at the data in terms of Industry, however in D4.5 the taxonomy was mapped to NACE codes. We can now explore the Climate Services and Weather Services at this level of reporting. Figure 19 shows the distribution of global sales of Climate and Weather Services for each of the 17 different NACE codes for 2016/17. The top 10 NACE Codes for Climate Services account for €29.2bn or 82% of the total. These are: Electricity, Gas, Steam & Air Conditioning (€3.9bn); Information & Communication (€3.6bn); Public Administration & Defence (€3.5bn); Construction (€3.4bn); Agriculture, Forestry & Fishing (€3.1bn); Manufacturing (€2.9bn); Financial & Insurance (€2.6bn); Accommodation & Food (€2.5bn); Mining and Quarrying (€2.2bn) and Transport & Storage (€1.7bn). The top 10 NACE Codes for Weather Services account for €23.4bn or 80% of the total. These are: Public Administration & Defence (€4.4bn); Electricity, Gas, Steam & Air Conditioning (€3.6bn); Financial & Insurance (€3.4bn); Manufacturing (€3.3bn); Professional, Scientific & Technical (€1.6bn); Water Supply, Sewerage & Waste Management (€1.6bn); Construction (€1.5bn); Information & Communication (€1.4bn): Human Health (€1.3bn) and Agriculture, Forestry and Fishing (€1.2bn). NACE end-users show significant differences between Climate and Weather Services, for example although the top 5 NACE Codes make up 56% of the Weather Services market, the top 4 NACE Codes account for 51%. Those 4 NACE Codes dominate the market, such dominance is not present in the Climate Services market.
Interim Definition, Taxonomy and Report
April 2018 Page 39 of 402
Figure 19: Climate and Weather Services by NACE Code End-User €m
Interim Definition, Taxonomy and Report
April 2018 Page 40 of 402
In Figure 20 the same data is shown, but this time as a percentage for each end-user NACE code for 2016/17. Figure 20: Climate and Weather Services by NACE End-User %
Interim Definition, Taxonomy and Report
April 2018 Page 41 of 402
Figure 21 explores the different NACE needs for Climate and Weather Services as a percentage of the total. Some NACE Codes, like Agriculture, Forestry & Fishing; Accommodation & Food; Arts, Entertainment & Recreation and Information & Communication are more focused on Climate Services as a percentage of their needs, compared with Professional, Scientific & Technical; Wholesale & Retail; Financial & Insurance and Public Administration & Defence who are more focused on Weather Services. As for the Industry split, some of these results may appear surprising i.e. Agriculture and demand for Weather Services, but NACE demand patterns will reflect the “commoditisation” of some weather services, as free services and new apps continue to enter and dominate the market. The full Climate Services details of each of the 17 NACE Codes included in this analysis is captured in a series of dashboards at Appendix J.
Interim Definition, Taxonomy and Report
April 2018 Page 42 of 402
Figure 21: NACE Code split by Climate and Weather Services
Interim Definition, Taxonomy and Report
April 2018 Page 43 of 402
Figure 22 shows the historical sales values for Climate Services for the period 2014/15 to 2016/17. These figures suggest that global demand for Climate Services by NACE Code are well established and not subject to rapid or significant change. Figure 22: Historical Climate Services Sales by NACE Code €m
Interim Definition, Taxonomy and Report
April 2018 Page 44 of 402
4.8 Weather and Climate Services by NACE Codes and Markets Each of the 17 NACE Codes is segmented into more distinctive markets. In Figure 23 the top ten NACE Codes (identified above) are divided into markets for global Climate Services using stacked bar charts. Table 4 Ranks the Top 20 markets for global Climate Services. Figure 23: Top 10 NACE Codes for Climate Services split by Market €m 2016/17
Interim Definition, Taxonomy and Report
April 2018 Page 45 of 402
Table 4: Top 20 Global Climate Services Markets 2016/17 €m
The top 10 NACE Code markets for Climate Services account for €14.4bn or 40% of the 2016/17 total. The top 20 NACE Code markets for Climate Services account for €21.1bn or 59% of total sales in 2016/17.
NACE Code Market
Climate
Services €mConstruction Civil Engineering 1,978.2
Electricity, Gas, Steam & Air Conditioning Wind 1,912.3
Public Administration & Defence Local Government 1,623.6
Information & Communication Multi Media and Broadcasting Sector 1,412.1
Mining and Quarrying Oil and Gas Exploration 1,395.8
Multi-Code Location Planning for Large Establishments 1,330.5
Multi-Code Arable 1,323.4
Water Supply, Sewerage & Waste Management Water Supply 1,180.2
Information & Communication News Papers and Periodicals 847.5
Public Administration & Defence Public Services 722.9
Mining and Quarrying Mines and Quarries 716.2
Electricity, Gas, Steam & Air Conditioning Energy Supply (Gas Electricity) 649.7
Human Health Hospitals 620.9
Accommodation & Food Food Production (In-Line Process Manufacture) 606.4
Financial & Insurance Re Insurance 581.8
Arts, Entertainment and Recreation Operation of Leisure Facilities 537.2
Electricity, Gas, Steam & Air Conditioning Geothermal 503.0
Interim Definition, Taxonomy and Report
April 2018 Page 46 of 402
In Figure 24 the top ten NACE Codes (identified above) are divided into markets for global Climate Services using stacked bar charts. Table 5 Ranks the Top 20 markets for global Climate Services. Figure 24: Top 10 NACE Codes for Weather Services split by Market €m 2016/17
Interim Definition, Taxonomy and Report
April 2018 Page 47 of 402
Table 5: Top 20 Global Weather Services Markets 2016/17 €m
The top 10 NACE Code markets for Weather Services account for €11bn or 38% of the 2016/17 total. The top 20 NACE Code markets for Weather Services account for €16bn or 56% of total sales in 2016/17.
NACE Code Market
Weather
Services €mPublic Administration & Defence Local Government 1,858.6
Electricity, Gas, Steam & Air Conditioning Wind 1,639.1
Multi-Code Location Planning for Large Establishments 1,584.1
Water Supply, Sewerage & Waste Management Water Supply 1,415.0
Public Administration & Defence Public Services 820.7
Construction Civil Engineering 763.8
Financial & Insurance Re Insurance 746.9
Electricity, Gas, Steam & Air Conditioning Energy Supply (Gas Electricity) 742.1
4.9 Global Market Segmentation In Section 4.6 the top ten industry users of Climate and Weather Services were analyzed in terms of their constituent markets. They can also be analyzed by service type. Table 6 is a pivot chart that maps the 27 end-user industries by the seven service types for Climate Services in 2016/17. The table values are colour-coded (heat- mapped) from Blue (low) to Red (High). This table colour-coding confirms the top 10 industry end-users for Climate Services (above) and also confirms that the highest value service types are Climate Advisory Service and Other Consulting. Table 6: Industry by Service Type for Climate Services 2016/17 €m
Interim Definition, Taxonomy and Report
April 2018 Page 49 of 402
Figure 25 shows the percentage for each service type for the top ten Industries for Climate Services. It shows that Climate Advisory can range from 17-40% by industry, with Other Consulting varying from 12-31% of the total by industry. Industry need for specific Climate Services, therefore, vary across industries and within industries. Figure 25: Top 10 Industries by Service Type for Climate Services 2016/17 (%)
Interim Definition, Taxonomy and Report
April 2018 Page 50 of 402
Table 7 follows the same conventions as Table 6, but this time for Weather Services in 2016/17. The colour-coding in Table 7 confirms the top 10 industry end-users for Weather Services (above) and confirms that the highest value service types are also Climate Advisory Service and Other Consulting. Table 7: Industry by Service Type for Weather Services 2016/17 €m
Interim Definition, Taxonomy and Report
April 2018 Page 51 of 402
Figure 26 shows the percentage for each service type for the top ten Industries for Weather Services. It shows that Climate Advisory can range from 17-37% by industry, with Other Consulting varying from 10-30% of the total by industry. Industry need for specific Weather Services, therefore, also vary across industries and within industries. Figure 26: Top 10 Industries by Service Type for Weather Services 2015/ 16 (%)
Interim Definition, Taxonomy and Report
April 2018 Page 52 of 402
A comparison of Figures 25 and 26 shows that:
• Climate Advisory and Consulting Services for Climate Services consistently account for a slightly higher percentage of the top ten industry total
• Service type percentages are similar for industries that are included in the top ten for both Climate and Weather Services i.e. Legal & Financial and Built Environment
In Section 4.8 the top ten NACE Code users of Climate and Weather Services were analyzed in terms of their constituent markets. They can also be analyzed by service type. Table 8 is a pivot chart that maps the 17 end-user NACE Codes by the seven service types for Climate Services in 2016/17. The table values are colour-coded (heat- mapped) from Blue (low) to Red (High). This table colour-coding confirms the top 5 NACE Code end-users for Climate Services (above) and also confirms that the highest value service types are Climate Advisory Service and Other Consulting. Table 8: NACE Code by Service Type for Climate Services 2016/17 €m
Interim Definition, Taxonomy and Report
April 2018 Page 53 of 402
Figure 27 shows the percentage for each service type for the top ten NACE Codes for Climate Services. It shows that Climate Advisory can range from 14-30% by NACE Code, with Other Consulting varying from 12-29% of the total by NACE Code. NACE Code need for specific Climate Services, therefore, vary across NACE Codes and within NACE Codes. Figure 27: Top 10 NACE Codes by Service Type for Climate Services 2016/17 (%)
Interim Definition, Taxonomy and Report
April 2018 Page 54 of 402
Table 9 follows the same conventions as Table 8, but this time for Weather Services in 2016/17. The colour-coding in Table 9 confirms the top 5 NACE Code end-users for Weather Services (above) and confirms that the highest value service types are also Climate Advisory Service and Other Consulting. Table 9: NACE Code by Service Type for Weather Services 2016/17 €m
Interim Definition, Taxonomy and Report
April 2018 Page 55 of 402
Figure 28 shows the percentage for each service type for the top ten NACE Codes for Weather Services. It shows that Climate Advisory can range from 13-29% by NACE Code, with Other Consulting varying from 12-28% of the total by NACE Code. NACE Code need for specific Weather Services, therefore, also vary across NACE Codes and within NACE Codes. Figure 28: Top 10 NACE Codes by Service Type for Weather Services 2015/ 16 (%)
Interim Definition, Taxonomy and Report
April 2018 Page 56 of 402
4.10 Global Growth In Section 4.2 historical annual growth in Weather & Climates Services was shown to increase from 7.9% to 8.6% between 2014/15 and 2016/17. The forecast growth rate to 2024/25 is shown at Figure 29. This shows a steady annual increase in growth, continuing the historical trend. Values are per financial year. Figure 29: Forecast Global Annual Growth in Weather & Climate Services (%) to 2024/25
The forecast growth rate applies equally to Platform Types (Section 4.3) and Activity Types (Section 4.4). There are some small, but not significant variations at the Industry and Market levels. Forecasts for Climate and Weather Services separately do show some significant differences (see Figure 30), with the most significant growth being experienced by Climate Services. Figure 30: Forecast Global Annual Growth in Climate and Weather Services (%) to 2024/25
The one remaining analysis option for global Weather and Climate Services is by country and that is included in the next section.
Interim Definition, Taxonomy and Report
April 2018 Page 57 of 402
5. International Weather and Climate Services
5.1 International Weather and Climate Services In the previous section the focus was initially on global Weather and Climate Services and then focused on different segmentations of the global market for both Climate and Weather Services. In Section 5 the focus is on geographic analysis - Global, European Region, European Union and then by individual country within the European Union. Figure 31 shows the split of Weather and Climate Services across the five global regions. Asia accounts for 41% of the market, followed by Americas (29%) and Europe (25%). This proportion by global region has not changed significantly since this research began in 2010/11. Figure 31: Weather & Climate Services Sales by Global Region 2016/17
In recent and related studies into Environmental/Low Carbon and Carbon Finance markets the Asian share of the market has been 38% and 36% respectively. At 41% of the total, this suggests higher than average demand for Weather & Climate Services in Asia. The 28 countries of the European Union account for €12.9bn or 20.5% of the total for Weather & Climate Services i.e. 81% of the European regional total. Figure 32 splits Weather & Climate Services into Climate and Weather for the global regions. The sales values for Europe are €9bn and €7.5bn respectively. Figure 32: Climate and Weather Services Sales Compared by Global Region 2016/17
The 28 countries of the European Union account for 20.5% of global Climate Services and 20.9% of Weather Services.
Interim Definition, Taxonomy and Report
April 2018 Page 58 of 402
Figure 33 shows sales value for the top 15 countries for Climate Services in 2016/17. These countries account for €25.8bn or 72% of the global market for Climate Services
Figure 33: Top 15 Countries for Climate Services 2016/17 €m
Interim Definition, Taxonomy and Report
April 2018 Page 59 of 402
Figure 34 shows sales value for the top 15 countries for Weather Services in 2016/17. These are the same top 15 countries as for Climate Services and they account for €25.2bn or 72% of the global market for Weather Services.
Figure 34: Top 15 Countries for Weather Services 2016/17 €m
Interim Definition, Taxonomy and Report
April 2018 Page 60 of 402
Figure 35 shows Import and Export values for the top 15 countries for Climate Services in 2016/17. The available exports are those which are accessible under usual market conditions and vary between 49.7%-50.5% of the Total Export Market.
Figure 35: Top 15 Countries for Climate Services Imports and Exports 2016/17 €m
Interim Definition, Taxonomy and Report
April 2018 Page 61 of 402
Figure 36 shows Import and Export values for the top 15 countries for Weather Services in 2016/17. The available exports are those which are accessible under usual market conditions and vary between 19.7%-20.1% of the Total Export Market, much lower than for Climate Services.
Figure 36: Top 15 Countries for Weather Services Imports and Exports 2016/17 €m
Interim Definition, Taxonomy and Report
April 2018 Page 62 of 402
Of the 226 countries and economic territories analyzed for this report no data was found for just seven countries. This compares with 45 countries that showed no observable or significant value in the original research in 2010/11. A full listing of countries in rank order is shown at Appendix I.
5.2 European Union for Climate and Weather Services The EU 28 Countries account for €12.9bn of the Weather & Climate Services market. Figure 37 shows how this is split between Climate Services €7.3bn (55% of the total) and Weather Services €6.1bn (45% of the total). Figure 37: EU 28 Countries for Climate and Weather Services 2016/17 €m
The Import and Export figures for the 28 EU Countries are illustrated in Figure 38 and show that the EU Import figure is higher than Export for Weather Services and Climate Services. There is more available Export market in Climate Services than Weather Services. The export figures are those which we are currently able to separate out from Weather & Climate Services. The value for Exports for the W&CS market as a whole are higher than the sum of Weather Services and Climate Services, this is because of the presence of activities we are not yet able to separate into “Weather” or “Climate”. As the market matures, we would expect to be able to separate the activities more easily. Figure 38: EU 28 Countries for Climate and Weather Services 2016/17 Imports and Exports €m
Interim Definition, Taxonomy and Report
April 2018 Page 63 of 402
The EU value of Weather and Climate Services is split across the five key data platforms - Airborne, Land, Marine, Space and Mixed Services. In Figure 39 for Climate Services, Land Based Services accounts for €2.8bn or 38%, followed by Airborne €1.8bn (24%), Space €1.6bn (21%), Mixed €0.6bn (9%) and Marine €0.6bn (8%). This compares with Weather Services Land €2.2bn or 35%, followed by Airborne €1.5bn (24%), Space €1.2bn (20%), Mixed €0.8bn (13%) and Marine €0.5bn (8%). These ratios across the four platforms are very similar (but not identical) to the global ratios in Section 4.3. Figure 39: EU 28 Countries for Climate and Weather Services by Platform 2016/17 €m
Figure 40 gives the Climate Services Import and Export data for the EU 28 countries by Platform. The highest Imports and Exports are seen in Land Based Services (€825m Imports and €686m Exports), followed by Airborne Services (€537 Imports and €445 Exports). All Platforms have good available Export markets of 50%. Figure 40: EU 28 Countries Import/Export Data for Climate Services by Platform 2016/17 €m
Figure 41 gives the Weather Services Import and Export data for the EU 28 countries by Platform. As for Climate Services, the highest Imports and Exports are seen in Land Based Services (€646m Imports and €534m Exports), followed by Airborne Services (€430m
Interim Definition, Taxonomy and Report
April 2018 Page 64 of 402
Imports and €363 Exports). All Platforms have lower available exports markets than Climate Services, of around 20%. Figure 41: EU 28 Countries Import/Export Data for Weather Services by Platform 2016/17 €m
Figure 42 shows the seven service types for Climate Services, with Climate Advisory Services at €1.7bn (23%) and Other Consulting at €1.7bn (23%) as the highest values services, followed by Processing & Re-Analysis (12%), Modelling (11%), Measurement (9%), Operation (8%), Publication (7%) and Data Management (7%). In comparison, for Weather Services, Climate Advisory Services is €1.4bn (22%) and Other Consulting at €1.3bn (22%) are the highest values services, followed by Processing & Re-Analysis (12%), Modelling (12%), Measurement (9%), Operation (9%), Publication (8%) and Data Management (7%). Figure 42: EU 28 Countries for Climate and Weather Services by Service 2016/17 €m
Interim Definition, Taxonomy and Report
April 2018 Page 65 of 402
The total EU transactions in 2016/17 for Climate Services was estimated at 1.4m and for Weather Services the estimate was 0.4m. The significant difference between the two classes is because the figure is for “traded services” i.e. services which include a monetary transaction. Weather Services have a high proportion of free services, which are not shown in the figures here, whereas Climate Services have a lower proportion of free services. Figure 43 shows that, for Climate Services, Climate Advisory Services at 344,000 transactions (24%) and Other Consulting at 314,000 (22%) are the highest volume services, followed by Processing & Re-Analysis (12%), Modelling (11%), Measurement (9%), Operation (8%), Publication (8%) and Data Management (6%). Figure 43 also shows that for Weather Services, Climate Advisory Services at 472,000 transactions (24%) and Other Consulting at 440,000 (22%) are the highest volume services, followed by Processing & Re-Analysis (12%), Modelling (11%), Measurement (9%), Operation (8%), Publication (8%) and Data Management (6%). Figure 43: EU 28 Countries for Climate and Weather Services by Service 2016/17 Transactions
The distribution of both value and volume follows an almost identical pattern for both Climate and Weather Services. Figure 44 gives the Climate Services Import and Export data for the EU 28 countries by Service. By far the highest Imports and Exports are seen in Climate Advisory Services (23% of both imports and exports) and Other Consulting (23% of both imports and exports).
Interim Definition, Taxonomy and Report
April 2018 Page 66 of 402
Figure 44: EU 28 Countries Import/Export Data for Climate Services by Service 2016/17 €m
Figure 45 gives the Weather Services Import and Export data for the EU 28 countries by Service. As for Climate Services, the highest Imports and Exports are seen in Climate Advisory Services (22% for both imports and exports) and Other Consulting (22% for both imports and exports). Figure 45: EU 28 Countries Import/Export Data for Weather Services by Service 2016/17 €m
The third segmentation level for EU Climate and Weather Services (following the pattern of analysis in Section 4) is by Industry. Figure 46 shows the distribution of EU sales of Climate and Weather Services for each of the 27 different Industries.
Interim Definition, Taxonomy and Report
April 2018 Page 67 of 402
The top 10 industries for Climate Services account for €4.7bn or 64% of the total. These are: Built Environment (€670m); Renewable Energy (€639m); Public & Charitable Bodies (€534m); Legal & Financial (€533m); News, Publishing & Journalism (€522m); Exploration, Mines & Quarries (€453m), Utilities (€403m); Agriculture (€347m); Forestry & Timber (€305m) and Food & Drink (€275m). The top 10 industries for Weather Services account for €4.0bn or 66% of the total. These are: Legal & Financial (€702m); Public & Charitable Bodies (€669m); Renewable Energy (€567m); Utilities (€486m); Pharmaceuticals (€294m); Operational Services (€289m); Built Environment (€287m); Health Care & Hospitals (€265m); Defence (€255m) and Exploration, Mines & Quarries (€216m). The industry segmentation for the EU is very similar to the global analysis in Section 4, with many of the same industries appearing in the top 10 for both Climate and Weather Services. Differences occur in climate services where Legal and Financial and News, Publishing and Journalism switch places. Weather Services sees Exploration, Mines and Quarries and Business Services switch for tenth place. Figure 46: EU 28 Countries for Climate and Weather Services by Industry 2016/17 €m
Figure 47 illustrates the Climate Services Import/Export data for the 28 EU countries by Industry. The top 10 Import and Exports industries for Climate Services account for €1.4bn or 64.1% of the total imports and €1.2bn or 64.2% of exports. These are: Built Environment (9.1%); Renewable Energy (8.8%); Public & Charitable Bodies (7.7%); Legal & Financial (7.4%);
Interim Definition, Taxonomy and Report
April 2018 Page 68 of 402
News, Publishing & Journalism (6.9%); Exploration, Mines & Quarries (6.2%), Utilities (5.5%); Agriculture (4.5%); Forestry & Timber (4.1%) and Food & Drink (3.8%). Figure 47: EU 28 Countries Import/Export Data for Climate Services by Industry 2016/17 €m
Figure 48 illustrates the Weather Services Import/Export data for the 28 EU countries by Industry. The top 10 Import and Exports industries for Weather Services account for €1.0bn or 55.4% of the total imports and €1.2bn or 79.3% of exports. These are: Legal & Financial (13.8%); Public & Charitable Bodies (13.2%); Renewable Energy (11.0%); Utilities (9.3%); Pharmaceuticals (5.9%); Built Environment (5.8%); Operational Services (5.7%); Health Care and Hospitals (5.2%); Defence (5.0%) and Exploration, Mines & Quarries (4.5%).
Interim Definition, Taxonomy and Report
April 2018 Page 69 of 402
Figure 48: EU 28 Countries Import/Export Data for Climate Services by Industry 2016/17 €m
The fourth segmentation level for EU Climate and Weather Services (following the pattern of analysis in Section 4) is by NACE Code. Figure 49 shows the distribution of EU sales of Climate and Weather Services for each of the 17 different NACE Codes. The top 10 NACE Codes for Climate Services account for €6.0bn or 82% of the total. These are: Electricity, Gas, Steam & Air Conditioning (€788m); Public Administration & Defence (€718m); Construction (€713m); Information & Communication (€709m); Agriculture, Forestry & Fishing (€652m); Manufacturing (€586m); Financial & Insurance (€534m); Accommodation & Food (€532m); Mining and Quarrying (€453m) and Transport & Storage (€344m). The top 10 NACE Codes for Weather Services account for €4.9bn or 80% of the total. These are: Public Administration & Defence (€924m); Electricity, Gas, Steam & Air Conditioning (€744m); Financial & Insurance (€702m); Manufacturing (€696m); Construction (€340m); Professional, Scientific & Technical (€328m); Water Supply, Sewerage & Waste Management (€309m); Information & Communication (€288m); Agriculture, Forestry and Fishing (€269m) and Human Health (€265m). The NACE Code segmentation for the EU is very similar to the global analysis in Section 4, with many of the same NACE Codes appearing in the top 10 for both Climate and Weather Services. NACE end-users show significant differences between Climate and Weather Services, for example although the top 5 NACE Codes make up 56% of the Weather Services market, the top 4 NACE Codes account for 50%. Those 4 NACE Codes dominate the market, such dominance is not present in the Climate Services market.
Interim Definition, Taxonomy and Report
April 2018 Page 70 of 402
Figure 49: EU 28 Countries for Climate and Weather Services by NACE Code 2016/17 €m
Figure 50 illustrates the Climate Services Import/Export data for the 28 EU countries by NACE Code. The top 10 Import and Exports NACE Codes for Climate Services account for €1.8bn or 82.1% of the total imports and €1.5bn or 82.1% of exports. These are: Electricity, Gas, Steam & Air Conditioning (10.8%); Public Administration & Defence (9.7%); Construction (9.7%); Information & Communication (9.5%); Agriculture, Forestry & Fishing (8.6%); Manufacturing (8.0%); Accommodation & Food (7.5%), Financial & Insurance (7.4%); Mining and Quarrying (6.2%) and Transport & Storage (4.7%).
Interim Definition, Taxonomy and Report
April 2018 Page 71 of 402
Figure 50: EU 28 Countries Import/Export Data for Climate Services by NACE Code 2016/17 €m
Figure 51 illustrates the Weather Services Import/Export data for the 28 EU countries by NACE Code. The top 10 Import and Exports NACE Codes for Weather Services account for €1.4bn or 79.8% of the total imports and €1.2bn or 79.9% of exports. These are: Public Administration & Defence (15.1%); Electricity, Gas, Steam & Air Conditioning (12.0%); Financial & Insurance (11.5%); Manufacturing (11.5%); Construction (6.0%); Professional, Scientific & Technical (5.4%), Water Supply, Sewerage & Waste Management (5.0%); Information & Communication (4.7%); Agriculture, Forestry and Fishing (4.5%) and Human Health (4.4%).
Interim Definition, Taxonomy and Report
April 2018 Page 72 of 402
Figure 51: EU 28 Countries Import/Export Data for Weather Services by NACE Code 2016/17 €m
Interim Definition, Taxonomy and Report
April 2018 Page 73 of 402
Table 10 summarises the key measures for each of the 28 countries of the EU, starting with Weather & Climate Services as a whole, then Weather Services, Climate Services and then measures that relate purely to Climate Services - Climate as a percentage of the total sector, Imports, Exports and Available Exports, Forecast Growth to 2024/25 and transaction volumes. Table 10 shows that forecast growth rates (based upon the more conservative figures) for Climate Services are similar across all EU countries and that Climate Services accounts for between 55.7-57.0% of the sector total for all countries. Table 10: Summary Table 28 EU Countries 2016/17
The countries in Table 10 have deliberately not been ranked, but the leading positions of Germany, the UK, France, Spain and Italy should not surprise anyone. Each country in this table is shown in more detail as both a dashboard and table of additional data at Appendices J and K. The Table 10 format is replicated for each country but includes industry-level and NACE Code-level data.
6.1 General Comments There are a surprising number of data sources available to conduct research of this type, they are just not focused on measuring Weather and Climate Services from an economic/market perspective. This made the first pass at defining a previously unquantified industry more robust than we anticipated for the original research. From our experience of revisiting other industries and sectors that we had defined and measured for the first time, we believed in 2011 that future investigations were likely to unlock more data sources and increase confidence levels beyond 82%. In 2017, it is true that there are more data sources of increasing quality, however, some of the key difficulties in defining and capturing the differences between Weather and Climate Services remain. In the original research we found what we expected to find i.e. Weather and Climate Services has a traditional market structure and global distribution of market share i.e. its shape is determined by the national industry mix that it serves as well as by public policy agendas towards climate change. The highest value activities in this study (and the previous report) reflect those most referred to as socio-economic sectors in the current literature references to Weather and Climate Service markets i.e. agriculture, urban planning, energy and water resource management, transport etc. The most significant omission from most other published references was the financial/legal and Insurance/Re-Insurance markets. This research identifies how significant those global markets really are. In general, the analysis in Section 4 (both then and now) shows that the applications for Weather and Climate Services and the number of available markets are both broader than most of the original literature suggested. The ranking of leading economies is almost what we anticipated from related studies in the environmental/low carbon field, but with a small bias towards demand in the Far East. In the original research it was uncertain whether this would be a continuing trend or just related to the effects of the economic downturn in the US and Europe. Further monitoring has confirmed this trend into 2016/17. While the original research was a good first step, it was recognized that there were still some limitations within the data sources and the methodology applied: 1. The study only included fee-paying transactions i.e. activities where there is an economic
footprint to be followed. This does not understate the "value" of what has been included (or its annual growth), but it certainly understates the "volume" of transactions by excluding free provision of data/data exchanges etc.
2. There was limited transparency in global public sector purchasing sources - hence our rather limited breakdown in values and volumes between government and public service markets. To create greater granularity in this area (including better data on non-fee-paying activities) would require a more in-house or consultative approach to data collection.
3. As always, we did not know what we did not know. It is possible that our insistence on
only including market activities that can be verified by multiple data sources has excluded some emerging markets or service applications that emit "weak" but growing economic signals. These should become evident through future monitoring.
Interim Definition, Taxonomy and Report
April 2018 Page 75 of 402
4. Defining Weather Services and Climate Services separately was (and still is) a delicate
and partly interpretative operation where source materials do not always clearly differentiate between the two. The 55/45% split between Weather and Climate is a top line number that varies significantly industry by industry, but not very significantly by country for the top 15 economies. So, the methods applied are sensitive enough to identify differences and variations but still include a possible error level of up to +/- 25%. Further work may be able to reduce this potential error level.
6.2 General Findings What the original research did provide was a strong evidence base for the value and growing economic importance of Weather and Climate Services. Platform data can be clearly differentiated from the source materials so that the relevant importance of Space data (for example) can be singled out from the whole. As was suspected (and now demonstrated) the market was (and remains) dominated by the leading economies. Compared with other sector studies for similar markets the top 15 countries are the "usual suspects," but with India ranked ahead of Japan. Typically, the top seven countries account for 50-53% of the global total. For Climate Services the value was (and remains) higher at 72%, perhaps reflecting the key role played by the leading economies in leading the response to climate change. The research confirmed that the leading markets/competitors for improving economic performance in Weather and Climate Services were no different to most other economic sectors. The research suggested that there were more similarities than differences in how the leading economies used Weather and Climate Services, but there is a future need for more data and qualitative research about international differences, i.e. use of data platforms and service mix, and institutional purchasing patterns and national competition. For Service Types the research demonstrated that Data Management represents only 6% of the total value for Climate Services and Operational Data accounts for 8% i.e. between 86% and 94% of all value is ADDED to the data, irrespective of which platform that data is drawn from. This finding still reflects the current situation where much Weather and Climate Services data is provided free, thereby reducing the overall market impact of Data Management services. It is not clear from the original research what the full economic impact of free data had on the market for Weather and Climate Services, however, we were confident that it would be possible to model market impacts for making more/less data free. It would need a more rigorous analysis of whether market uses are mandatory, critical or discretionary; it would need a robust quantification for these market uses; it would require a wider analysis of the impact of new (free) data tools on consulting markets (the DIY option) and it would invite cross references to data service values in related information markets - but it would be possible to development a modelling rule-set to explore what the impacts might be. The analysis of the content of "Other Consulting" activities identified a clear and growing market for explaining the "need" of, and benefits from, purchasing other Weather and Climate Services. As with other environmentally-based agendas, the need to map both corporate and supply chain impacts or dependencies on climate change were becoming increasingly important. Over time, we would expect the need for "Other Consulting" to
Interim Definition, Taxonomy and Report
April 2018 Page 76 of 402
decline and the proportion of Advisory services to increase, but there is no evidence of this in the 2016/17 updated data. The industries analysis showed that the public sector and charities (including NGOs) accounted for less than 8% of market value. The NACE Code analysis showed that Public Administration and Defence accounted for less than 10%. This did appear to be a lower than average reflection of the importance attached to Climate Services by the public sector, but was probably an accurate reflection of fee-paying v. in-house or non-commercial activity. What was, perhaps, new from the research was the identification of a much wider set of industries with a need for Weather and Climate Services and the differentiated needs for both. The research identified extremely healthy historical and forecast growth rates. This was (and remains) a reflection of the economic and social drivers for Weather and Climate Services and continues to buck current market trends in Europe and the US. Forecast growth was much higher than for most of the global environmental and low carbon goods and services that we had researched - the exception being some of the renewable energies. Some of this, was due to the increasing degree to which Climate Services was becoming a mandatory/critical part of the corporate governance/corporate responsibility agenda. The analysis of market/industry and market/NACE Code uses of Weather and Climate Services showed a very wide variation in use/needs - much wider, perhaps, than first thought when this research was originally commissioned. This analysis provided a "window" into what was driving the adoption of and growth in, Weather and Climate Services in different areas of the global economy and revealed a much richer commercial landscape than originally anticipated. There is much consultative work still to be done to quantify these market uses and to explore/expand the emerging niches contained within them. The Import and Export data has identified interesting patterns between Climate Services and Weather Services. The value of imports and exports varies significantly between industries; NACE Codes; Platforms and Services, but broadly in line with the overall value of each measure, as would be expected. Imports are about 30% of the size of the market and exports around 25% of the market for both Climate Services and Weather Services, no matter which angle you look at the market from (be it spilt by platform, NACE Code, industry or service). It is when we look at the available exports that we see significant differences between Climate Services and Weather Services. The available exports are a measure of the proportion of the export market which is available for penetration under the normal cost of sales for the sector i.e. not “buying market”. The available export market for Climate Services is 50%, whereas for Weather Services it is only 20%. This is indicative of the maturation of the Weather Services market, compared to the emerging Climate Services market. Long-term monitoring of this metric via initiative such as the Observatory would be beneficial to tracking market maturation and available demand, key indicators of market health. So, while there were some necessary limitations in what the original research objectives revealed, there was and still is, a wealth of evidence that supports a healthy economic or business case for both Weather and Climate Services.
Interim Definition, Taxonomy and Report
April 2018 Page 77 of 402
Appendix A Industry Markets
Industry Market
Agriculture Arable
Agriculture Arable
Agriculture Live Stock
Biotech Batch Production
Biotech In-Line Process Manufacture
Biotech Manufacturing Assembly
Biotech Multi Process
Biotech Project Oriented Production
Built Environment Civil Engineering
Built Environment Construction
Built Environment Large Developments
Business Services Advertising
Business Services Advertising and Marketing .
Business Services Consultancy (General)
Business Services Other Professional Business Services .
Civil Engineering Sector Not Elsewhere Classified Location Planning for large establishments
Communications Communications .
Communications Communications Infrastructure
Communications Telecoms
Defence Contractors for Defence Projects
Defence Operations Base Development and Planning
Defence Other Defence Services Providers
Education and Training Large Private Educational Establishments
Education and Training Public Sector Education
Education and Training Specialist Training for Climate Services
Education and Training Training Services
Exploration, Mines and Quarries Geological Stability and Change for Operations
Exploration, Mines and Quarries Mines and Quarries
Exploration, Mines and Quarries Oil and Gas Exploration
Food and Drink Food ('Fast')
Food and Drink Food (Generic - but not Production or Catering)
Food and Drink Food and Beverage Supply Servicing
Food and Drink Food Production (Batch Production)
Food and Drink Food Production (In-Line Process Manufacture)
Food and Drink Food Production (Manufacturing Assembly)
Food and Drink Processing and Manufacturing Operations Bases
Forestry and Timber Forestry Corporates
Forestry and Timber Forestry Planning
Forestry and Timber Timber Processing
Health Care and Hospitals Health Care .
Health Care and Hospitals Hospitals
Health Care and Hospitals Locational and Operational Management
Health Care and Hospitals Medical Clinics
Hospitality Hotels and Catering .
Hospitality Location Planning for large establishments
Hospitality Restaurant
Legal and Financial Accountancy
Legal and Financial Banking
Legal and Financial Building Society (Savings, Mutual Credit Associations)
Interim Definition, Taxonomy and Report
April 2018 Page 78 of 402
Industry Market
Legal and Financial Credit Card Operations
Legal and Financial Financial Investments
Legal and Financial Futures Analysts
Legal and Financial Insurance
Legal and Financial Law
Legal and Financial Other Financial Services .
Legal and Financial Pension Funds
Legal and Financial Re Insurance
Legal and Financial Risk Mitigation Services
Logistics Airline Operators
Logistics Distribution and Logistics Management
Logistics Freight Forwarders
Logistics Freight Transportation by Air
Logistics Freight Transportation by Land
Logistics Freight Transportation by Rail
Logistics Freight Transportation by Sea
Logistics Large Goods and Vehicle Storage
Logistics Large Mail Delivery Corporations
Logistics Mailing/Packaging Houses (e.g. Direct Marketing Services)
Logistics Operations Planning
Logistics Passenger Transportation by Air
Logistics Passenger Transportation by Land
Logistics Passenger Transportation by Sea
Logistics Rail Operators
Logistics Shipping Line Operators
Manufacturing Aerospace and Aeronautical (Batch Production)
Manufacturing Aerospace and Aeronautical (Manufacturing Assembly)
Manufacturing Aerospace and Aeronautical (Project Oriented Production)
Public Administration & Defence Contractors for Defence Projects
Public Administration & Defence Other Defence Services Providers
Public Administration & Defence Charitable Bodies
Public Administration & Defence Local Government
Public Administration & Defence Public Services
Public Administration & Defence Operations Base Development and Planning
Public Administration & Defence Location Planning for large establishments
Transport & Storage Airline Operators
Transport & Storage Distribution and Logistics Management
Transport & Storage Mailing/Packaging Houses (e.g. Direct Marketing Services)
Transport & Storage Freight Transportation by Air
Transport & Storage Freight Transportation by Land
Transport & Storage Freight Transportation by Sea
Transport & Storage Freight Transportation by Rail
Transport & Storage Passenger Transportation by Air
Transport & Storage Passenger Transportation by Land
Transport & Storage Passenger Transportation by Sea
Transport & Storage Large Goods and Vehicle Storage
Transport & Storage Shipping Line Operators
Transport & Storage Freight Forwarders
Transport & Storage Rail Operators
Transport & Storage Large Mail Delivery Corporations
Transport & Storage Airport Servicing and Operations
Transport & Storage Operations Planning
Water Supply, Sewerage & Waste Management Waste Management
Water Supply, Sewerage & Waste Management Water Supply
Wholesale & Retail Large Multi Site Retailers
Wholesale & Retail Merchandising
Wholesale & Retail Retailing .
Wholesale & Retail Large Wholesale Corporates
Wholesale & Retail Commercial R&D
Wholesale & Retail Location Planning for large establishments
Interim Definition, Taxonomy and Report
April 2018 Page 83 of 402
Appendix C Selected Sources
ABS - Atlantic Broadcasting System Association of Naval Aviation British Cement Association
ADSIP Research Centre Association of Play Industries British Concrete Masonry Association
Advanced Portfolio Technologies Association of Rooflight Manufacturers British Constructional Steelw ork Association
Advanced Technologies Inc Association of Tank & Cistern Manufacturers British Fire Protection Systems Association
Aerospace Technology Atlantic Marine Trades Association British Foundry Association
Aggregatemarket Atmospheric Research and Information Centre British Glass Manufacturers Association
Airport Operators' Association Australasian Institute of Marine Surveyors British Hard Metals Association
Air-Scene UK Australian Graduate School of Management Annual Report DBritish Institute of Architectural Technologists
Alfred Wegener Institute Foundation for Polar & Marine Research Australian International Marine Export Group British Marine Equipment Association (BMEA),
allbizreport Australian Marine Industries Federation British Marine Finfish Association
Alliance for Marine Remote Sensing Canada Australian Marine Sciences Association British Maritime Law Association
Aluminium Federation Australian Research Centre for Aerospace Automation British Metals Castings Association
Aluminium Stockholders Association Australian Shipbuilders Association British Metals Federation
AMA Research Australian Stock Market and Historical Data Page British Non-Ferrous Metals Federation
American Fisheries Society Autoclaved Aerated Concrete Products Association British Plastics Federation
American Institute of Aeronautics and Astronautics (AIAA) Aviation International British Precast Concrete Federation
American Society of Naval Engineers Aviation Week British Pump Manufacturers Association
AMRC Avitop British Quality foundation
Anakonda AVMARK British Rigid Urethane Foam Manufacturers Association
Anchin, Block & Anchin LLP BAA British Security Industry Association
Annual Report Gallery BAC Marketing Equities Research Page British Stainless Steel Association
Arboricultural Association BAE Systems British Steel Strip Products
Architectural Association (AA) School of Architecture Bank Rate Monitor British Wood Preserving & Damp Proofing Association
Architectural Cladding Association Barnes Reports BSRIA The Building Services Research and Information Association
Aruvian Research BARRA Bureau of International Recycling
Association for Environment Conscious Building BART International Business & Commercial Aviation
Association for Project Management Bathroom Manufacturers Association Buttonw ood Financial Resources
Association for Specialist Fire Protection BLT Financial Group Cadvantage
Association for the Conservation of Energy Boardroom Insider Canadian Marine Manufacturers Association Canada
Association of Average Adjusters Bond Basics CANNEX
Association of Builders' Hardw are Manufacturers Bondtrac Financial Information Caribbean Marine Association
Association of Building Component Manufacturers Ltd Brain Wave Cast Metals Development
Association of Building Engineers BRE Building Research Establishment Cavity Foam Bureau
Association of Consulting Engineers Brick Development Association CBOT
Association of Facilities Engineers Bridge Information Systems CCN New sNet
Association of Interior Specialists Briefing by Charter Media Cement Admixtures Association
Association of Loading & Elevating Equipment Manufacturers British Airport Services and Equipment Association Census Department (US)
Association of Manufacturers of Domestic Appliances British Blind & Shutter Association Central Statistical Office (UK)
Association of Marine Products & Services British Board of Agrement Centre for Alternative Technology
Interim Definition, Taxonomy and Report
April 2018 Page 84 of 402
Centre for Window & Cladding Technology Cornhill EMEC, the European Marine Equipment Council
CERAM Research Council for the Protection of Rural England (CPRE) Empire State Marine Trades Association
Chartered Institute of Building Council for the Protection of Rural Wales (CPRW) Energy Industries Council
Chartered Institute of Environmental Health Council of Forest Industries Engineering Construction Industry Association
Chartered Institute of Housing Country by Country registered data sources Engineering Employers Federation
Chartered Institute of Purchasing & Supply CRSP (Center for Research in Security Prices) Engineering Industries Association
Chartered Institution of Building Services Engineers CSA Engineering Manufacturers Association
Chartered Society of Designers CSC EPRO European Association of Plastics Recycling
Chicago Board of Trade CSI ESPIN Stock Charts
Chicago Mercantile Exchange CU Time Series Repository ESRC Data Archive
Chinese Society of Naval Architects & Marine Engineers Currency Management, Inc. Eurisol (UK) Ltd
CIA Daily Stocks Euro Monitor
CIRIA Daiw a's Information Bank Euromoney Institutional Investor PLC
CISCO - Futures research and data Danaher Corporation European Federation for Spec. Prods & Applications in Structures
CITB-ConstructionSkills Data and Program Library Services at Wisconsin European Liquid Roofing Association
Citibase Data Monitor European Organisation for Packaging and the Environment
Civil Aviation Authority (CAA) Data Used in Research Papers at the Federal Reserve Bank of St. Louis. European Regions Airline Association
Civil engineering contractors Association DataMerge Financing Resources for Entrepreneurs European Small Business Alliance
Clay Pipe Development Association Datastream International European Space Agency
Clay Roof Tile Council Defense Manufacturers Association European Space Agency
Cliometric Society Defense New s Eurotrader Strategies
CNNfn Deloitte & Touche Peerscape Expanded Polystyrene Cavity Insulation Association
Coastal Resources Center Design & Industries Association External Wall Insulation Association
Commodity Resource Corp. Deutsche Bank List of the Prices of 60 German Stocks Faciva
CommodityTrader.Net Dialog FACTIVA
Concrete Society Ltd Disclosure Federal Filings Business New s
Concrete Tile Manufacturers Association Dow Jones Business Directory Federal Reserve Bank of Minneapolis
Confederation of Aerial Industries Dun & Bradstreet Federal Reserve Bank of New York
Confederation of British Industry EADS Federal Reserve Bank of Philadelphia
Confederation of British Metal forming EADS Federation for the Repair & Protection of Structures
Confederation of Construction Specialists Ecological Design Association (EDA) Federation of British Hand Tool Manufacturers
Confederation of European Aerospace Societies (CEAS) Ed Yardeni's Chart Room Federation of Finnish Technology Industries
Connecticut Marine Trades Association Edgar Online.Com from Cybernet Data Systems Federation of Master Builders
Construct UK E-Investor Federation of Piling Specialists
Construction Confederation Electrical Contractors Association Federation Of The Electronics Industry
Construction Employers Federation Electrical Installation Equipment Manufacturers Asssociation Fibre Cement Manufacturers Association
Construction Products Association Electrical Insulation Association Finance Online
Consumers Association Electronic Data Interchange (Construction) Ltd Financial Post
Contract Flooring Association E-Line Financials Financial Technologies International
Interim Definition, Taxonomy and Report
April 2018 Page 85 of 402
Financial Times IBC Data Institutor Logic
Fire Protection Association Icomia : International Council of Marine Industry Associations Inter-American Development Bank
Fire Resistant Glass & Glazed Systems Association Icon Group International, Inc. Interior Decorators & Designers Association
FISH IDD Intermediate Technology Development Group
Flat Glass Manufacturers Association IFAInformation International Air Transport Association (IATA)
Flat Roofing Alliance IMCA - International Marine Contractors Association International Association of Dredging Companies
Flight International IMPA International Marine Purchasing Association International Association of Producers of Insurance and Reinsurance
Florida Aquatic Plant Management Society Independent Defense Media Association International Council of Marine Industry Associations (ICOMIA)
Forecast International Indian Space Research Organisation International Economics Information
Forests Forever Industry Research group International Federation of Shipmasters' Associations
Fortitude INFO-MINE International Institute of Marine Surveyors
Fortune Magazine Online Information Echo International institutes of technology
Freedonia Group ING Bank International International Marine Certif ication Institute Belgium
Freight Transport Association Institute for Defense & Government Advancement (IDGA) International Monetary Fund
Frost & Sullivan Institute for Naval Automation Italy International Ship Electric Service Association (Ises) Ltd
Futures Guide Institute for the Study of Naval Architecture Italy International Universities
Futures Price Data Institute of Architectural Ironmongers International Waterproofing Association
GBQ/Nesser Consulting Group Institute of Builders Merchants Internet Securities, Inc.
General Electric Company Institute of Building Control Internet Securities.
Glass and Glazing Federation Institute of Civil Engineers InterQuote - Continuous Quotes
Global Financial Data Institute of Clerks of Works of Great Britain Intex Solutions - CMO data
Global Industry Analysts Institute Of Corrosion InvestorGuide
Global Recycling Netw ork Institute of electrical & Mechanical engineers Investor's Diary
Glued Laminated Timber Association Institute of Management consultants Investors Free Forum
GMID Institute of Marine Engineering, Science and Technology (Small Ships) InvestorSquare
Gold Coast Marine Industry Association Institute Of Marine Engineers InvestorSquare
Grow th Stock Gazette Institute Of Metal Finishing IQPC Defence
Guild of Architectural Ironmongers Institute Of Petroleum IRIN
Gypsum Products Development Association Institute of Plumbing JAL Trading
Health Estate Facilities Management Association Institute of Recycling Jane's Information Group Ltd
Heating & Ventilating Contractors Association Institution of Civil Engineers Jane's International
Helaba Trust Institution of Electrical Engineers Japan Aerospace Exploration Agency
Holt's Daily Stock Market Report Institution of Fire Engineers Japan Marine Engineers' Association
Honeyw ell International Inc. Institution of Gas Engineers and Managers (IGEM) Japan Naval Architecture Institute
Hoovers Online Institution of Highw ays & Transportation Journal of Applied Econometric Data Archive
Hot Water Association (HWA) Institution of Incorporated Engineers JP Morgan
Houseboat Association of America Institution of Lighting Engineers Kansai Society of Naval Architects
I/B/E/S Analyst Earnings Forecasts Institution of Mechanical Engineers Kensington Management Company
Ibbotson Associates Institution of Structural Engineers Key Note Publications Ltd
Interim Definition, Taxonomy and Report
April 2018 Page 86 of 402
Key Publishing McGladrey & Pullen LLP National Marine Representatives Association
Knight Capital Mead Data Central Lexis/Nexis National Master Tile Fixers Association
Koku Shimbun Sha Mechanical and Metal Trades Confederation National Oil Recyclers Association
Korea Aerospace Research Institute (KARI) Media Logic Economic Indicators National Physical Laboratory
LCCS Merrill Lynch OnLine NATO Undersea Research Centre Italy
L. T. Institute of Finance Metal Cladding & Roofing Manufacturers Association Ltd NCS
L-3 Communications Holdings, Inc. Micropal NDIA’s National DefenseLandscape Institute Midas Online Neptune Association Netherlands
Leading Edge Management Consultancy Ltd. Ministry of Economy and Public Works and Services of Argentina NETw orth by Quicken
Lehman Brothers Mintel New York Stock Exchange
LIFFE MIT Stock Price Data Nihon Marinenjiniaringu Gakkai
Marine Studies and Environmental Research Centre Plymouth NASDAQ Piper Jaffray
Marine Trades Association National Association of Marine Surveyors (NAMS) Plastic Bag Association
Marine Trades Association of Maryland National Association of Marine Surveyors, Inc. U.S.A. Plastic Pipe Manufacturers Society
Maritime Law Association of Australia and New Zealand National Bureau of Economic Research Plastics Window Federation
Market and Business Development National Defense Industry Association Plimsoll Publishing Ltd.
Market and Business Development National Federation of Building Trade Employees PMpublishing's Daily Option Summary
Market Guide National Federation of Roofing Contractors Ltd Polyethylene Foam Insulation Association
Market Paradigm National Federation of Terrazzo, Marble & Mosaic Specialists Ports & Terminals Group
MarketEdge National GRP Cladding Federation Pow der Actuated Systems Association
MarketPlayer National House-Building Council NHBC Prestressed Concrete Association
MarketTrak National Housing Federation Price Waterhouse
Massachusetts Marine Trades Association National Inspection Council for Electrical Installation Contracting Primark
MATIF National Insulation Association Pristine Day Trader
MBD National Marine Electronics Association Professional Naval Engineering Council Argentina
MBD National Marine Manufacturers Association Public Register's Annual Report Service (PRARS)
Interim Definition, Taxonomy and Report
April 2018 Page 87 of 402
QBL Shipping Australia Limited Temple Group United Technologies Corporation
QSRMC (The Quality Scheme for Ready Mixed Concrete) Short Term Stock Selector TFC Financial Charts University of Waterloo
Queensland Seafood Industry Association Silicon Investor Thales Value Investing
Quote.com SilverPlatter The Aerospace Research Institute Venture Capital Resource Library
Quoteline Snapdata International Group The Boeing Company Venture Capital World Online
Recruitment & Employment Confederation Ltd Society For Underw ater Technology The British Marine Federation Vortex Volatility Chart Library
Recyclers w orld Society of Accredited Marine Surveyors (SAMS) The European Recovered Paper Council (ERPC) Wall Street Directory
Reed Business Information Society of British Aerospace Companies The Housing Corporation Wall Street Discount Corporation
Reed Construction Data Society of British Gas Industries The Institute Of Diesel & Gas Turbine Engineers Wall Street Net
Relevant Aerospace and Engineering University Centres InSociety of Chief Electrical & Mechanical Engineers The Institute Of Logistics & Transport WallStreeter.Com
Remade Netw ork UK Society of Consulting Marine Engineers and Ship Surveyors The Institution Of Mechanical Engineers Waste Watch
ResearchandMarkets Society Of Maritime Industries The International Union of Marine Insurance (IUMI) Wilcoxon Research
Researchmag Society of Naval Architects & Marine Engineers The Mining Company WOQATS
Rhode Island Marine Trades Association Solar Energy Society (Uk Section) The Motley Fool World Bank
RICS Solar Trade Association Ltd The National Building Specif ication (NBS) World Ship Trust
RNCOS Stainless Steel Advisory Service (SSAS) The National Marine Educators Association World Wide Quote
ROUSSIN Standard & Poors The Nautical Institute WRAP
Royal Aeronautical Society Standard & Poors Compustat The Oil Companies International Marine Forum (OCIMF) Write Partnership
Royal Air Force Standard & Poors Equity Investor Services The Royal Institution Of Naval Architects XCOR Aerospace Inc
Royal Bank of Canada Statistics Canada The Scottish Association for Marine Science (SAMS) Zacks Investment Research
Royal Incorporation of Architects Steel Lintel Manufacturers Association The Scottish Environment Protection Agency (SEPA) Zinc Information Centre
Royal Institute of British Architects Stock Advisory New sletter The Shephard Press
Rye, Man & Gor Securities Stock Commando The Steel Construction Institute
Salomon Brothers Stock Data Corporation Thermal Insulation Contractors Association
San Diego Daily Transcript. Stock Investors' Fraud Resource Thermal Insulation Manufacturers and Suppliers Association
Scottish Building Employers Federation Stock Research (From Spain) TheStreet.com
Scottish Ecological Design Association (SEDA) Stock Smart Thomson Reuters
Scottish Homes StockMaster Timber & Brick Information Council
Scripps Institution of Oceanography Stockpicks.com Timber Trade Federation
Scuba Industries Trade Association StockSense Tow n & Country Planning Association
SEC Database StockSite TRADA Technology Ltd
Securities Data Corporation Stock-Talk.com Transport Research Laboratory
SecurityAPL Current Quote Server Stockw arrants.com TRINET America
SELECT - Electrical Contractors Association of Scotland Stone Federation TurboMachinery International
Shephard Group Structural Precast Association UK Marine & Coastguard Agency
Ship Builders & Ship Repairers Association Surfrat Quotes UK Steel Association
Ship Research Institute Suspended Access Equipment Manufacturers Association UNECE
Shipbuilders' Association of Japan Sw imming Pools & Allied Trades Association Ltd Union of Construction, Allied Trades & Technicians
Shipbuilding Engineering Society Russia Telescan United States Naval Institute
Interim Definition, Taxonomy and Report
April 2018 Page 88 of 402
Appendix D Confidence Levels
The following charts map confidence levels for each of the core measures - activity value, transaction and growth - by country and by industry for Climate Services. The core measure appears on the vertical axis and the confidence level appears on the horizontal axis. The size of the bubble reflects the relative value of the activity. D1: Growth by Industry
D2: Value by Industry
Interim Definition, Taxonomy and Report
April 2018 Page 89 of 402
D3: Volume by Industry
D4: Growth by Country
Interim Definition, Taxonomy and Report
April 2018 Page 90 of 402
D5: Value by Country
D6: Volume by Country
Interim Definition, Taxonomy and Report
April 2018 Page 91 of 402
Appendix E Global Industry Analysis for Climate Services
E1a: Agriculture
Interim Definition, Taxonomy and Report
April 2018 Page 92 of 402
E1b: Agriculture
Interim Definition, Taxonomy and Report
April 2018 Page 93 of 402
E2a: Biotech
Interim Definition, Taxonomy and Report
April 2018 Page 94 of 402
E2b: Biotech
Interim Definition, Taxonomy and Report
April 2018 Page 95 of 402
E3a: Built Environment
Interim Definition, Taxonomy and Report
April 2018 Page 96 of 402
E3b: Built Environment
Interim Definition, Taxonomy and Report
April 2018 Page 97 of 402
E4a: Business Services
Interim Definition, Taxonomy and Report
April 2018 Page 98 of 402
E4b: Business Services
Interim Definition, Taxonomy and Report
April 2018 Page 99 of 402
E5a: Civil Engineering Sector Not Elsewhere Classified
Interim Definition, Taxonomy and Report
April 2018 Page 100 of 402
E5b: Civil Engineering Sector Not Elsewhere Classified
Interim Definition, Taxonomy and Report
April 2018 Page 101 of 402
E6a: Communications
Interim Definition, Taxonomy and Report
April 2018 Page 102 of 402
E6b: Communications
Interim Definition, Taxonomy and Report
April 2018 Page 103 of 402
E7a: Defence
Interim Definition, Taxonomy and Report
April 2018 Page 104 of 402
E7b: Defence
Interim Definition, Taxonomy and Report
April 2018 Page 105 of 402
E8a: Education and Training
Interim Definition, Taxonomy and Report
April 2018 Page 106 of 402
E8b: Education and Training
Interim Definition, Taxonomy and Report
April 2018 Page 107 of 402
E9a: Exploration, Mines and Quarries
Interim Definition, Taxonomy and Report
April 2018 Page 108 of 402
E9b: Exploration, Mines and Quarries
Interim Definition, Taxonomy and Report
April 2018 Page 109 of 402
E10a: Food and Drink
Interim Definition, Taxonomy and Report
April 2018 Page 110 of 402
E10b: Food and Drink
Interim Definition, Taxonomy and Report
April 2018 Page 111 of 402
E11a: Forestry and Timber
Interim Definition, Taxonomy and Report
April 2018 Page 112 of 402
E11b: Forestry and Timber
Interim Definition, Taxonomy and Report
April 2018 Page 113 of 402
E12a: Health Care and Hospitals
Interim Definition, Taxonomy and Report
April 2018 Page 114 of 402
E12b: Health Care and Hospitals
Interim Definition, Taxonomy and Report
April 2018 Page 115 of 402
E13a: Hospitality
Interim Definition, Taxonomy and Report
April 2018 Page 116 of 402
E13b: Hospitality
Interim Definition, Taxonomy and Report
April 2018 Page 117 of 402
E14a: Legal and Financial
Interim Definition, Taxonomy and Report
April 2018 Page 118 of 402
E14b: Legal and Financial
Interim Definition, Taxonomy and Report
April 2018 Page 119 of 402
E15a: Logistics
Interim Definition, Taxonomy and Report
April 2018 Page 120 of 402
E15b: Logistics
Interim Definition, Taxonomy and Report
April 2018 Page 121 of 402
E16a: Manufacturing
Interim Definition, Taxonomy and Report
April 2018 Page 122 of 402
E16b: Manufacturing
Interim Definition, Taxonomy and Report
April 2018 Page 123 of 402
E17a: News, Publishing and Journalism
Interim Definition, Taxonomy and Report
April 2018 Page 124 of 402
E17b: News, Publishing and Journalism
Interim Definition, Taxonomy and Report
April 2018 Page 125 of 402
E18a: Not Elsewhere Classified
Interim Definition, Taxonomy and Report
April 2018 Page 126 of 402
E18b: Not Elsewhere Classified
Interim Definition, Taxonomy and Report
April 2018 Page 127 of 402
E19a: Operational Services
Interim Definition, Taxonomy and Report
April 2018 Page 128 of 402
E19b: Operational Services
Interim Definition, Taxonomy and Report
April 2018 Page 129 of 402
E20a: Pharmaceuticals
Interim Definition, Taxonomy and Report
April 2018 Page 130 of 402
E20b: Pharmaceuticals
Interim Definition, Taxonomy and Report
April 2018 Page 131 of 402
E21a: Processing Industry Not Elsewhere Classified
Interim Definition, Taxonomy and Report
April 2018 Page 132 of 402
E21b: Processing Industry Not Elsewhere Classified
Interim Definition, Taxonomy and Report
April 2018 Page 133 of 402
E22a: Public and Charitable Bodies
Interim Definition, Taxonomy and Report
April 2018 Page 134 of 402
E22b: Public and Charitable Bodies
Interim Definition, Taxonomy and Report
April 2018 Page 135 of 402
E23a: Renewable Energy
Interim Definition, Taxonomy and Report
April 2018 Page 136 of 402
E23b: Renewable Energy
Interim Definition, Taxonomy and Report
April 2018 Page 137 of 402
E24a: Research and Development
Interim Definition, Taxonomy and Report
April 2018 Page 138 of 402
E24b: Research and Development
Interim Definition, Taxonomy and Report
April 2018 Page 139 of 402
E25a: Retailing and Wholesale
Interim Definition, Taxonomy and Report
April 2018 Page 140 of 402
E25b: Retailing and Wholesale
Interim Definition, Taxonomy and Report
April 2018 Page 141 of 402
E26a: Tourism and Leisure
Interim Definition, Taxonomy and Report
April 2018 Page 142 of 402
E26b: Tourism and Leisure
Interim Definition, Taxonomy and Report
April 2018 Page 143 of 402
E27a: Utilities
Interim Definition, Taxonomy and Report
April 2018 Page 144 of 402
E27b: Utilities
Interim Definition, Taxonomy and Report
April 2018 Page 145 of 402
Appendix F Global Market Values by Industry and NACE Code
F1: Industry
Interim Definition, Taxonomy and Report
April 2018 Page 146 of 402
Interim Definition, Taxonomy and Report
April 2018 Page 147 of 402
Interim Definition, Taxonomy and Report
April 2018 Page 148 of 402
Interim Definition, Taxonomy and Report
April 2018 Page 149 of 402
F2: NACE Code
Interim Definition, Taxonomy and Report
April 2018 Page 150 of 402
Interim Definition, Taxonomy and Report
April 2018 Page 151 of 402
Interim Definition, Taxonomy and Report
April 2018 Page 152 of 402
Interim Definition, Taxonomy and Report
April 2018 Page 153 of 402
Appendix G Global NACE Code Analysis for Climate Services
G1a: Accommodation and Food
Interim Definition, Taxonomy and Report
April 2018 Page 154 of 402
G1b: Accommodation and Food
Interim Definition, Taxonomy and Report
April 2018 Page 155 of 402
G2a: Agriculture, Forestry and Fishing
Interim Definition, Taxonomy and Report
April 2018 Page 156 of 402
G2b: Agriculture, Forestry and Fishing
Interim Definition, Taxonomy and Report
April 2018 Page 157 of 402
G3a: Arts, Entertainment and Recreation
Interim Definition, Taxonomy and Report
April 2018 Page 158 of 402
G3b: Arts, Entertainment and Recreation
Interim Definition, Taxonomy and Report
April 2018 Page 159 of 402
G4a: Construction
Interim Definition, Taxonomy and Report
April 2018 Page 160 of 402
G4b: Construction
Interim Definition, Taxonomy and Report
April 2018 Page 161 of 402
G5a: Education
Interim Definition, Taxonomy and Report
April 2018 Page 162 of 402
G5b: Education
Interim Definition, Taxonomy and Report
April 2018 Page 163 of 402
G6a: Electricity, Gas, Steam and Air Conditioning
Interim Definition, Taxonomy and Report
April 2018 Page 164 of 402
G6b: Electricity, Gas, Steam and Air Conditioning
Interim Definition, Taxonomy and Report
April 2018 Page 165 of 402
G7a: Financial and Insurance
Interim Definition, Taxonomy and Report
April 2018 Page 166 of 402
G7b: Financial and Insurance
Interim Definition, Taxonomy and Report
April 2018 Page 167 of 402
G8a: Human Health
Interim Definition, Taxonomy and Report
April 2018 Page 168 of 402
G8b: Human Health
Interim Definition, Taxonomy and Report
April 2018 Page 169 of 402
G9a: Information and Communication
Interim Definition, Taxonomy and Report
April 2018 Page 170 of 402
G9b: Information and Communication
Interim Definition, Taxonomy and Report
April 2018 Page 171 of 402
G10a: Manufacturing
Interim Definition, Taxonomy and Report
April 2018 Page 172 of 402
G10b: Manufacturing
Interim Definition, Taxonomy and Report
April 2018 Page 173 of 402
G11a: Mining and Quarrying
Interim Definition, Taxonomy and Report
April 2018 Page 174 of 402
G11b: Mining and Quarrying
Interim Definition, Taxonomy and Report
April 2018 Page 175 of 402
G12a: Other Services
Interim Definition, Taxonomy and Report
April 2018 Page 176 of 402
G12b: Other Services
Interim Definition, Taxonomy and Report
April 2018 Page 177 of 402
G13a: Professional, Scientific and Technical
Interim Definition, Taxonomy and Report
April 2018 Page 178 of 402
G13b: Professional, Scientific and Technical
Interim Definition, Taxonomy and Report
April 2018 Page 179 of 402
G14a: Public Administration and Defence
Interim Definition, Taxonomy and Report
April 2018 Page 180 of 402
G14b: Public Administration and Defence
Interim Definition, Taxonomy and Report
April 2018 Page 181 of 402
G15a: Transport and Storage
Interim Definition, Taxonomy and Report
April 2018 Page 182 of 402
G15b: Transport and Storage
Interim Definition, Taxonomy and Report
April 2018 Page 183 of 402
G16a: Water Supply, Sewerage and Waste Management
Interim Definition, Taxonomy and Report
April 2018 Page 184 of 402
G16b: Water Supply, Sewerage and Waste Management
Interim Definition, Taxonomy and Report
April 2018 Page 185 of 402
G17a: Wholesale and Retail
Interim Definition, Taxonomy and Report
April 2018 Page 186 of 402
G17b: Wholesale and Retail
Interim Definition, Taxonomy and Report
April 2018 Page 187 of 402
Appendix H All Industries and NACE Codes by Platform & Service for Global Climate Services
H1: Industry split by Platform
Interim Definition, Taxonomy and Report
April 2018 Page 188 of 402
H2: Industry split by Service
Interim Definition, Taxonomy and Report
April 2018 Page 189 of 402
H3: NACE Code split by Platform
Interim Definition, Taxonomy and Report
April 2018 Page 190 of 402
H4: NACE Code split by Service
Interim Definition, Taxonomy and Report
April 2018 Page 191 of 402
Appendix I Global Country Analysis for Climates Services
Country W&C Total €mWeather
Services €mClimate
Services €m
Climate
Services
Imports €m
Climate
Services
Exports €m
Climate
Available
Exports €mAfghanistan 23.1 10.5 13.1 3.9 3.2 1.6
Albania 18.8 8.6 10.7 3.2 2.6 1.3
Algeria 196.5 90.5 109.9 32.6 27.5 13.8
American Samoa 0.4 0.2 0.2 0.1 0.1 0.0
Andorra 2.0 0.9 1.1 0.3 0.3 0.1
Angola 46.5 21.3 26.3 8.1 6.4 3.2
Anguilla 0.1 0.1 0.1 0.0 0.0 0.0
Antigua and Barbuda 0.7 0.3 0.4 0.1 0.1 0.0
Argentina 550.4 254.0 306.9 89.7 77.0 38.5
Armenia 16.0 7.3 9.0 2.6 2.2 1.1
Aruba 1.8 0.8 1.0 0.3 0.3 0.1
Australia 581.5 246.6 329.9 98.4 81.7 40.7
Austria 279.3 128.1 156.9 46.3 39.7 19.8
Azerbaijan 40.5 18.3 23.2 7.0 5.9 2.9
Bahamas 6.3 2.9 3.6 1.1 0.9 0.4
Bahrain 18.2 8.2 10.4 3.0 2.6 1.3
Bangladesh 348.5 157.5 199.4 60.9 50.2 25.2
Barbados 5.7 2.6 3.3 1.0 0.8 0.4
Belarus 92.0 42.1 51.9 15.6 13.2 6.6
Belgium 389.8 176.9 221.9 65.4 56.1 27.9
Belize 2.2 1.0 1.3 0.4 0.3 0.2
Benin 7.8 3.6 4.4 1.3 1.1 0.5
Bermuda 5.5 2.5 3.1 0.9 0.8 0.4
Bhutan 3.6 1.6 2.0 0.6 0.5 0.3
Bolivia 22.4 10.2 12.7 3.8 3.2 1.6
Bosnia and Herzegovina 29.5 13.5 16.6 5.1 4.1 2.1
Botswana 17.9 8.2 10.1 3.0 2.4 1.2
Brazil 1,686.3 763.1 963.3 297.7 239.4 119.5
British Virgin Isles 0.7 0.3 0.4 0.1 0.1 0.1
Brunei 8.1 3.7 4.6 1.4 1.2 0.6
Bulgaria 68.1 30.9 38.7 11.7 9.5 4.7
Burkina Faso 19.5 9.0 10.9 3.3 2.8 1.4
Burundi 4.5 2.1 2.6 0.8 0.6 0.3
Cambodia 34.1 15.6 19.2 5.8 4.7 2.4
Cameroon 37.1 16.9 21.0 6.4 5.1 2.5
Canada 1,040.7 478.2 583.5 172.4 143.8 72.4
Cape Verde 2.7 1.3 1.5 0.5 0.4 0.2
Cayman Islands 1.8 0.8 1.0 0.3 0.3 0.1
Central African Republic 5.0 2.3 2.9 0.9 0.7 0.4
Chad 19.2 8.7 10.9 3.3 2.7 1.4
Chile 230.1 104.3 131.2 40.1 32.8 16.3
China 9,692.8 4,429.7 5,471.5 1,673.6 1,374.4 687.6
Colombia 436.8 196.6 251.1 71.9 61.8 30.9
Comoros 0.5 0.2 0.3 0.1 0.1 0.0
Congo 3.0 1.4 1.7 0.5 0.4 0.2
Congo, Democratic Republic of 47.0 21.4 26.6 8.1 6.7 3.4
Saint Vincent and the Grenadines 0.4 0.2 0.2 0.1 0.1 0.0
Samoa 1.1 0.5 0.6 0.2 0.2 0.1
San Marino 1.0 0.5 0.6 0.2 0.1 0.1
Sao Tome and Principe 0.2 0.1 0.1 0.0 0.0 0.0
Saudi Arabia 270.7 124.5 151.7 46.3 37.5 18.9
Senegal 18.2 8.4 10.2 3.1 2.6 1.3
Serbia 29.7 13.5 16.9 5.1 4.2 2.1
Seychelles 0.7 0.3 0.4 0.1 0.1 0.0
Sierra Leone 5.7 2.6 3.3 1.0 0.8 0.4
Singapore 140.4 64.5 78.7 22.8 20.3 10.1
Slovakia 94.0 42.9 53.1 15.8 13.4 6.7
Slovenia 42.2 19.2 23.9 7.3 6.1 3.0
Solomon Islands 0.8 0.4 0.4 0.1 0.1 0.1
Somalia 5.0 2.3 2.9 0.9 0.7 0.4
South Africa 517.5 235.7 293.3 88.8 75.4 37.6
South Korea 1,024.3 468.4 577.8 177.3 145.4 72.3
Spain 1,297.2 588.3 739.0 219.0 179.3 89.7
Sri Lanka 86.9 39.6 49.3 14.7 12.4 6.3
St Helena 0.0 0.0 0.0 0.0 0.0 0.0
St Pierre and Miquelon 0.1 0.0 0.0 0.0 0.0 0.0
Sudan 72.5 33.3 40.8 12.0 10.0 5.0
Suriname 2.7 1.2 1.5 0.5 0.4 0.2
Swaziland 6.3 2.9 3.6 1.1 0.9 0.5
Sweden 328.4 148.6 187.5 55.6 47.5 23.6
Switzerland 302.2 137.7 171.1 52.1 43.1 21.6
Syria 62.0 28.2 35.2 10.6 8.5 4.3
Taiwan 665.0 301.0 379.9 116.6 96.6 48.2
Interim Definition, Taxonomy and Report
April 2018 Page 195 of 402
Country W&C Total €mWeather
Services €mClimate
Services €m
Climate
Services
Imports €m
Climate
Services
Exports €m
Climate
Available
Exports €mTajikistan 9.5 4.3 5.4 1.6 1.3 0.7
Tanzania 27.8 12.7 15.7 4.7 4.0 2.0
Thailand 603.8 274.0 343.7 103.2 84.0 42.3
Togo 9.7 4.4 5.5 1.7 1.4 0.7
Tokelau 0.0 0.0 0.0 0.0 0.0 0.0
Tonga 0.3 0.1 0.2 0.1 0.0 0.0
Trinidad and Tobago 11.1 5.0 6.2 1.9 1.6 0.8
Tunisia 86.9 39.6 49.3 14.3 12.3 6.2
Turkey 531.5 243.6 299.0 87.1 73.8 37.1
Turkmenistan 30.9 14.1 17.4 5.0 4.4 2.2
Turks and Caicos Island 0.3 0.1 0.1 0.0 0.0 0.0
Tuvalu 0.0 0.0 0.0 0.0 0.0 0.0
Uganda 48.3 21.9 27.6 8.2 6.8 3.4
UK 2,036.1 1,113.9 1,152.8 349.1 285.9 143.7
Ukraine 329.2 150.1 186.3 56.6 47.1 23.4
United Arab Emirates 80.1 36.4 45.6 14.0 11.5 5.7
United States 12,162.1 5,543.5 6,887.4 2,013.0 1,698.1 855.8
Uruguay 59.9 27.2 34.0 10.1 8.4 4.2
Uzbekistan 45.3 20.8 25.4 7.7 6.2 3.1
Vanuatu 0.6 0.3 0.3 0.1 0.1 0.0
Venezuela 189.6 86.2 107.7 32.9 26.9 13.5
Vietnam 268.0 123.2 150.1 45.0 37.6 18.7
Virgin Islands 2.9 1.3 1.6 0.5 0.4 0.2
Wallis and Futuna 0.6 0.3 0.3 0.1 0.1 0.0
Yemen 17.2 7.8 9.8 3.0 2.5 1.2
Zambia 13.4 6.0 7.7 2.3 1.9 1.0
Zimbabwe 29.0 13.1 16.6 4.9 4.1 2.1
Interim Definition, Taxonomy and Report
April 2018 Page 196 of 402
European Union Country Dashboards for Climate Services Appendix J
J1a: Austria
Interim Definition, Taxonomy and Report
April 2018 Page 197 of 402
J1b: Austria
Interim Definition, Taxonomy and Report
April 2018 Page 198 of 402
J1c: Austria
Interim Definition, Taxonomy and Report
April 2018 Page 199 of 402
J1d: Austria
Interim Definition, Taxonomy and Report
April 2018 Page 200 of 402
J1e: Austria
Interim Definition, Taxonomy and Report
April 2018 Page 201 of 402
J2a: Belgium
Interim Definition, Taxonomy and Report
April 2018 Page 202 of 402
J2b: Belgium
Interim Definition, Taxonomy and Report
April 2018 Page 203 of 402
J2c: Belgium
Interim Definition, Taxonomy and Report
April 2018 Page 204 of 402
J2d: Belgium
Interim Definition, Taxonomy and Report
April 2018 Page 205 of 402
J2e: Belgium
Interim Definition, Taxonomy and Report
April 2018 Page 206 of 402
J3a: Bulgaria
Interim Definition, Taxonomy and Report
April 2018 Page 207 of 402
J3b: Bulgaria
Interim Definition, Taxonomy and Report
April 2018 Page 208 of 402
J3c: Bulgaria
Interim Definition, Taxonomy and Report
April 2018 Page 209 of 402
J3d: Bulgaria
Interim Definition, Taxonomy and Report
April 2018 Page 210 of 402
J3e: Bulgaria
Interim Definition, Taxonomy and Report
April 2018 Page 211 of 402
J4a: Croatia
Interim Definition, Taxonomy and Report
April 2018 Page 212 of 402
J4b: Croatia
Interim Definition, Taxonomy and Report
April 2018 Page 213 of 402
J4c: Croatia
Interim Definition, Taxonomy and Report
April 2018 Page 214 of 402
J4d: Croatia
Interim Definition, Taxonomy and Report
April 2018 Page 215 of 402
J4e: Croatia
Interim Definition, Taxonomy and Report
April 2018 Page 216 of 402
J5a: Cyprus
Interim Definition, Taxonomy and Report
April 2018 Page 217 of 402
J5b: Cyprus
Interim Definition, Taxonomy and Report
April 2018 Page 218 of 402
J5c: Cyprus
Interim Definition, Taxonomy and Report
April 2018 Page 219 of 402
J5d: Cyprus
Interim Definition, Taxonomy and Report
April 2018 Page 220 of 402
J5e: Cyprus
Interim Definition, Taxonomy and Report
April 2018 Page 221 of 402
J6a: Czech Republic
Interim Definition, Taxonomy and Report
April 2018 Page 222 of 402
J6b: Czech Republic
Interim Definition, Taxonomy and Report
April 2018 Page 223 of 402
J6c: Czech Republic
Interim Definition, Taxonomy and Report
April 2018 Page 224 of 402
J6d: Czech Republic
Interim Definition, Taxonomy and Report
April 2018 Page 225 of 402
J6e: Czech Republic
Interim Definition, Taxonomy and Report
April 2018 Page 226 of 402
J7a: Denmark
Interim Definition, Taxonomy and Report
April 2018 Page 227 of 402
J7b: Denmark
Interim Definition, Taxonomy and Report
April 2018 Page 228 of 402
J7c: Denmark
Interim Definition, Taxonomy and Report
April 2018 Page 229 of 402
J7d: Denmark
Interim Definition, Taxonomy and Report
April 2018 Page 230 of 402
J7e: Denmark
Interim Definition, Taxonomy and Report
April 2018 Page 231 of 402
J8a: Estonia
Interim Definition, Taxonomy and Report
April 2018 Page 232 of 402
J8b: Estonia
Interim Definition, Taxonomy and Report
April 2018 Page 233 of 402
J8c: Estonia
Interim Definition, Taxonomy and Report
April 2018 Page 234 of 402
J8d: Estonia
Interim Definition, Taxonomy and Report
April 2018 Page 235 of 402
J8e: Estonia
Interim Definition, Taxonomy and Report
April 2018 Page 236 of 402
J9a: Finland
Interim Definition, Taxonomy and Report
April 2018 Page 237 of 402
J9b: Finland
Interim Definition, Taxonomy and Report
April 2018 Page 238 of 402
J9c: Finland
Interim Definition, Taxonomy and Report
April 2018 Page 239 of 402
J9d: Finland
Interim Definition, Taxonomy and Report
April 2018 Page 240 of 402
J9e: Finland
Interim Definition, Taxonomy and Report
April 2018 Page 241 of 402
J10a: France
Interim Definition, Taxonomy and Report
April 2018 Page 242 of 402
J10b: France
Interim Definition, Taxonomy and Report
April 2018 Page 243 of 402
J10c: France
Interim Definition, Taxonomy and Report
April 2018 Page 244 of 402
J10d: France
Interim Definition, Taxonomy and Report
April 2018 Page 245 of 402
J10e: France
Interim Definition, Taxonomy and Report
April 2018 Page 246 of 402
J11a: Germany
Interim Definition, Taxonomy and Report
April 2018 Page 247 of 402
J11b: Germany
Interim Definition, Taxonomy and Report
April 2018 Page 248 of 402
J11c: Germany
Interim Definition, Taxonomy and Report
April 2018 Page 249 of 402
J11d: Germany
Interim Definition, Taxonomy and Report
April 2018 Page 250 of 402
J11e: Germany
Interim Definition, Taxonomy and Report
April 2018 Page 251 of 402
J12a: Greece
Interim Definition, Taxonomy and Report
April 2018 Page 252 of 402
J12b: Greece
Interim Definition, Taxonomy and Report
April 2018 Page 253 of 402
J12c: Greece
Interim Definition, Taxonomy and Report
April 2018 Page 254 of 402
J12d: Greece
Interim Definition, Taxonomy and Report
April 2018 Page 255 of 402
J12e: Greece
Interim Definition, Taxonomy and Report
April 2018 Page 256 of 402
J13a: Hungary
Interim Definition, Taxonomy and Report
April 2018 Page 257 of 402
J13b: Hungary
Interim Definition, Taxonomy and Report
April 2018 Page 258 of 402
J13c: Hungary
Interim Definition, Taxonomy and Report
April 2018 Page 259 of 402
J13d: Hungary
Interim Definition, Taxonomy and Report
April 2018 Page 260 of 402
J13e: Hungary
Interim Definition, Taxonomy and Report
April 2018 Page 261 of 402
J14a: Ireland
Interim Definition, Taxonomy and Report
April 2018 Page 262 of 402
J14b: Ireland
Interim Definition, Taxonomy and Report
April 2018 Page 263 of 402
J14c: Ireland
Interim Definition, Taxonomy and Report
April 2018 Page 264 of 402
J14d: Ireland
Interim Definition, Taxonomy and Report
April 2018 Page 265 of 402
J14e: Ireland
Interim Definition, Taxonomy and Report
April 2018 Page 266 of 402
J15a: Italy
Interim Definition, Taxonomy and Report
April 2018 Page 267 of 402
J15b: Italy
Interim Definition, Taxonomy and Report
April 2018 Page 268 of 402
J15c: Italy
Interim Definition, Taxonomy and Report
April 2018 Page 269 of 402
J15d: Italy
Interim Definition, Taxonomy and Report
April 2018 Page 270 of 402
J15e: Italy
Interim Definition, Taxonomy and Report
April 2018 Page 271 of 402
J16a: Latvia
Interim Definition, Taxonomy and Report
April 2018 Page 272 of 402
J16b: Latvia
Interim Definition, Taxonomy and Report
April 2018 Page 273 of 402
J16c: Latvia
Interim Definition, Taxonomy and Report
April 2018 Page 274 of 402
J16d: Latvia
Interim Definition, Taxonomy and Report
April 2018 Page 275 of 402
J16e: Latvia
Interim Definition, Taxonomy and Report
April 2018 Page 276 of 402
J17a: Lithuania
Interim Definition, Taxonomy and Report
April 2018 Page 277 of 402
J17b: Lithuania
Interim Definition, Taxonomy and Report
April 2018 Page 278 of 402
J17c: Lithuania
Interim Definition, Taxonomy and Report
April 2018 Page 279 of 402
J17d: Lithuania
Interim Definition, Taxonomy and Report
April 2018 Page 280 of 402
J17e: Lithuania
Interim Definition, Taxonomy and Report
April 2018 Page 281 of 402
J18a: Luxembourg
Interim Definition, Taxonomy and Report
April 2018 Page 282 of 402
J18b: Luxembourg
Interim Definition, Taxonomy and Report
April 2018 Page 283 of 402
J18c: Luxembourg
Interim Definition, Taxonomy and Report
April 2018 Page 284 of 402
J18d: Luxembourg
Interim Definition, Taxonomy and Report
April 2018 Page 285 of 402
J18e: Luxembourg
Interim Definition, Taxonomy and Report
April 2018 Page 286 of 402
HJ19a: Malta
Interim Definition, Taxonomy and Report
April 2018 Page 287 of 402
J19b: Malta
Interim Definition, Taxonomy and Report
April 2018 Page 288 of 402
J19c: Malta
Interim Definition, Taxonomy and Report
April 2018 Page 289 of 402
J19d: Malta
Interim Definition, Taxonomy and Report
April 2018 Page 290 of 402
J19e: Malta
Interim Definition, Taxonomy and Report
April 2018 Page 291 of 402
J20a: Netherlands
Interim Definition, Taxonomy and Report
April 2018 Page 292 of 402
J20b: Netherlands
Interim Definition, Taxonomy and Report
April 2018 Page 293 of 402
J20c: Netherlands
Interim Definition, Taxonomy and Report
April 2018 Page 294 of 402
J20d: Netherlands
Interim Definition, Taxonomy and Report
April 2018 Page 295 of 402
J20e: Netherlands
Interim Definition, Taxonomy and Report
April 2018 Page 296 of 402
J21a: Poland
Interim Definition, Taxonomy and Report
April 2018 Page 297 of 402
J21b: Poland
Interim Definition, Taxonomy and Report
April 2018 Page 298 of 402
J21c: Poland
Interim Definition, Taxonomy and Report
April 2018 Page 299 of 402
J21d: Poland
Interim Definition, Taxonomy and Report
April 2018 Page 300 of 402
J21e: Poland
Interim Definition, Taxonomy and Report
April 2018 Page 301 of 402
J22a: Portugal
Interim Definition, Taxonomy and Report
April 2018 Page 302 of 402
JH22b: Portugal
Interim Definition, Taxonomy and Report
April 2018 Page 303 of 402
J22c: Portugal
Interim Definition, Taxonomy and Report
April 2018 Page 304 of 402
J22d: Portugal
Interim Definition, Taxonomy and Report
April 2018 Page 305 of 402
J22e: Portugal
Interim Definition, Taxonomy and Report
April 2018 Page 306 of 402
J23a: Romania
Interim Definition, Taxonomy and Report
April 2018 Page 307 of 402
J23b: Romania
Interim Definition, Taxonomy and Report
April 2018 Page 308 of 402
J23c: Romania
Interim Definition, Taxonomy and Report
April 2018 Page 309 of 402
J23d: Romania
Interim Definition, Taxonomy and Report
April 2018 Page 310 of 402
J23e: Romania
Interim Definition, Taxonomy and Report
April 2018 Page 311 of 402
J24a: Slovakia
Interim Definition, Taxonomy and Report
April 2018 Page 312 of 402
J24b: Slovakia
Interim Definition, Taxonomy and Report
April 2018 Page 313 of 402
J24c: Slovakia
Interim Definition, Taxonomy and Report
April 2018 Page 314 of 402
J24d: Slovakia
Interim Definition, Taxonomy and Report
April 2018 Page 315 of 402
J24e: Slovakia
Interim Definition, Taxonomy and Report
April 2018 Page 316 of 402
J25a: Slovenia
Interim Definition, Taxonomy and Report
April 2018 Page 317 of 402
J25b: Slovenia
Interim Definition, Taxonomy and Report
April 2018 Page 318 of 402
J25c: Slovenia
Interim Definition, Taxonomy and Report
April 2018 Page 319 of 402
J25d: Slovenia
Interim Definition, Taxonomy and Report
April 2018 Page 320 of 402
J25e: Slovenia
Interim Definition, Taxonomy and Report
April 2018 Page 321 of 402
J26a: Spain
Interim Definition, Taxonomy and Report
April 2018 Page 322 of 402
J26b: Spain
Interim Definition, Taxonomy and Report
April 2018 Page 323 of 402
J26c: Spain
Interim Definition, Taxonomy and Report
April 2018 Page 324 of 402
J26d: Spain
Interim Definition, Taxonomy and Report
April 2018 Page 325 of 402
J26e: Spain
Interim Definition, Taxonomy and Report
April 2018 Page 326 of 402
J27a: Sweden
Interim Definition, Taxonomy and Report
April 2018 Page 327 of 402
J27b: Sweden
Interim Definition, Taxonomy and Report
April 2018 Page 328 of 402
J27c: Sweden
Interim Definition, Taxonomy and Report
April 2018 Page 329 of 402
J27d: Sweden
Interim Definition, Taxonomy and Report
April 2018 Page 330 of 402
J27e: Sweden
Interim Definition, Taxonomy and Report
April 2018 Page 331 of 402
J28a: UK
Interim Definition, Taxonomy and Report
April 2018 Page 332 of 402
J28b: UK
Interim Definition, Taxonomy and Report
April 2018 Page 333 of 402
J28c: UK
Interim Definition, Taxonomy and Report
April 2018 Page 334 of 402
J28d:UK
Interim Definition, Taxonomy and Report
April 2018 Page 335 of 402
J28e: UK
Interim Definition, Taxonomy and Report
April 2018 Page 336 of 402
Appendix K European Union Country Tables for Climate Services
K1a: Austria
Interim Definition, Taxonomy and Report
April 2018 Page 337 of 402
K1b: Austria
Interim Definition, Taxonomy and Report
April 2018 Page 338 of 402
K2a: Belgium
Interim Definition, Taxonomy and Report
April 2018 Page 339 of 402
K2b: Belgium
Interim Definition, Taxonomy and Report
April 2018 Page 340 of 402
K3a: Bulgaria
Interim Definition, Taxonomy and Report
April 2018 Page 341 of 402
K3b: Bulgaria
Interim Definition, Taxonomy and Report
April 2018 Page 342 of 402
K4a: Croatia
Interim Definition, Taxonomy and Report
April 2018 Page 343 of 402
K4b: Croatia
Interim Definition, Taxonomy and Report
April 2018 Page 344 of 402
K5a: Cyprus
Interim Definition, Taxonomy and Report
April 2018 Page 345 of 402
K5b: Cyprus
Interim Definition, Taxonomy and Report
April 2018 Page 346 of 402
K6a: Czech Republic
Interim Definition, Taxonomy and Report
April 2018 Page 347 of 402
K6b: Czech Republic
Interim Definition, Taxonomy and Report
April 2018 Page 348 of 402
K7a: Denmark
Interim Definition, Taxonomy and Report
April 2018 Page 349 of 402
K7b: Denmark
Interim Definition, Taxonomy and Report
April 2018 Page 350 of 402
K8a: Estonia
Interim Definition, Taxonomy and Report
April 2018 Page 351 of 402
K8b: Estonia
Interim Definition, Taxonomy and Report
April 2018 Page 352 of 402
K9a: Finland
Interim Definition, Taxonomy and Report
April 2018 Page 353 of 402
K9b: Finland
Interim Definition, Taxonomy and Report
April 2018 Page 354 of 402
K10a: France
Interim Definition, Taxonomy and Report
April 2018 Page 355 of 402
K10b: France
Interim Definition, Taxonomy and Report
April 2018 Page 356 of 402
K11a: Germany
Interim Definition, Taxonomy and Report
April 2018 Page 357 of 402
K11b: Germany
Interim Definition, Taxonomy and Report
April 2018 Page 358 of 402
K12a: Greece
Interim Definition, Taxonomy and Report
April 2018 Page 359 of 402
K12b: Greece
Interim Definition, Taxonomy and Report
April 2018 Page 360 of 402
K13a: Hungary
Interim Definition, Taxonomy and Report
April 2018 Page 361 of 402
K13b: Hungary
Interim Definition, Taxonomy and Report
April 2018 Page 362 of 402
K14a: Ireland
Interim Definition, Taxonomy and Report
April 2018 Page 363 of 402
K14b: Ireland
Interim Definition, Taxonomy and Report
April 2018 Page 364 of 402
K15a: Italy
Interim Definition, Taxonomy and Report
April 2018 Page 365 of 402
K15b: Italy
Interim Definition, Taxonomy and Report
April 2018 Page 366 of 402
K16a: Latvia
Interim Definition, Taxonomy and Report
April 2018 Page 367 of 402
K16b: Latvia
Interim Definition, Taxonomy and Report
April 2018 Page 368 of 402
K17a: Lithuania
Interim Definition, Taxonomy and Report
April 2018 Page 369 of 402
K17b: Lithuania
Interim Definition, Taxonomy and Report
April 2018 Page 370 of 402
K18a: Luxembourg
Interim Definition, Taxonomy and Report
April 2018 Page 371 of 402
K18b: Luxembourg
Interim Definition, Taxonomy and Report
April 2018 Page 372 of 402
K19a: Malta
Interim Definition, Taxonomy and Report
April 2018 Page 373 of 402
K19b: Malta
Interim Definition, Taxonomy and Report
April 2018 Page 374 of 402
K20a: Netherlands
Interim Definition, Taxonomy and Report
April 2018 Page 375 of 402
K20b: Netherlands
Interim Definition, Taxonomy and Report
April 2018 Page 376 of 402
K21a: Poland
Interim Definition, Taxonomy and Report
April 2018 Page 377 of 402
K21b: Poland
Interim Definition, Taxonomy and Report
April 2018 Page 378 of 402
K22a: Portugal
Interim Definition, Taxonomy and Report
April 2018 Page 379 of 402
K22b: Portugal
Interim Definition, Taxonomy and Report
April 2018 Page 380 of 402
K23a: Romania
Interim Definition, Taxonomy and Report
April 2018 Page 381 of 402
K23b: Romania
Interim Definition, Taxonomy and Report
April 2018 Page 382 of 402
K24a: Slovakia
Interim Definition, Taxonomy and Report
April 2018 Page 383 of 402
K24b: Slovakia
Interim Definition, Taxonomy and Report
April 2018 Page 384 of 402
K25a: Slovenia
Interim Definition, Taxonomy and Report
April 2018 Page 385 of 402
K25b: Slovenia
Interim Definition, Taxonomy and Report
April 2018 Page 386 of 402
K26a: Spain
Interim Definition, Taxonomy and Report
April 2018 Page 387 of 402
K26b: Spain
Interim Definition, Taxonomy and Report
April 2018 Page 388 of 402
K27a: Sweden
Interim Definition, Taxonomy and Report
April 2018 Page 389 of 402
K27b: Sweden
Interim Definition, Taxonomy and Report
April 2018 Page 390 of 402
K28a: UK
Interim Definition, Taxonomy and Report
April 2018 Page 391 of 402
K28b: UK
Overall Research into redefining & measuring CS demand
392 Deliverable D4.4 Produced by kMatrix Data Services Ltd
Appendix L Methodology for Import/Export Data
L1 History of Development
International Trade provided a very strong impetus to the development of the kMatrix sector
research methodology. The ability to measure activity across international boundaries (both inbound
and outbound) is critical to estimating national competitive performance. The demand from UK
Trade and Export teams was for a methodology that could a) measure UK strengths, b) translate
these strengths into a comparative analysis with other nations, c) benchmark national performance
on a global basis and d) monitor trends in performance over time. The multi-source approach (as
described in D2.1) allows for the creation of a common sector definition across multiple countries
and, therefore, lends itself to international trade measurement and monitoring. This functionality is
central to a multi-sourced approach whose roots reach back into industrial market research and
competitive/competitor analysis methods.
Initially, the multi-sourced approach was used for “difficult-to-measure” sector definition first and international trade measurement second, thereby filling the gap left by standard industrial
classification i.e. for sectors like Space Technology and Agri-technology. But over time, the ability to
compare international performance and target export resources has meant that this methodology
has been applied to sectors that are less difficult to measure (i.e. are partially or fully covered by
industry codes) but where comparative analysis of performance is difficult.
The development story can best be told using a series of graphics that represents key points in the
ever-increasing measurement of international trade. This history runs from the more traditional
measures of exports to more sophisticated global ranking and market share analysis. Ultimately, due
to the transactional nature of many of the sources used in calculating data point values it has also
been possible to identify specific customer types and even individual customers. The measure of
(LC)EGSS sector is used for illustrative purposes.
Figure L1: Measuring Exports by Sub Sector
Initially, research
focused on being
able to replicate the
measures provided
by national statistics
for most industries
i.e. the volume of
exports by sector
and by sub sector
(Figure L1).
Figure E2 shows
(LC)EGSS exports for
the seven cities by
end destination.
Overall Research into redefining & measuring CS demand
393 Deliverable D4.4 Produced by kMatrix Data Services Ltd
Figure L2: Measuring Exports by Destination Country
Typically, this would
involve calculating
export by destination
country.
Figure L2 shows the
top 10 export
destinations for the
aggregated exports
of seven cities in
2015/16
Figure L3: The Transition from Trade to Inter-Trading
The major break-
through occurred in
2010/11 when the
methodology
progressed from
measuring single
country trade flows
to multiple country
trade flows. This
switch from a one-
to- many model to a
many-to-many
model opened
opportunities to
measure market
share (Figure L3)
Figure L4: Inter-Trading and National Trade Flows
By comparing trade
flows for multiple
countries, it became
possible to identify
those economies
that were heavily
dependent on
imports (targets) and
those that were net-
exporters
(competitors).
This enabled a
different approach to
designing and
implementing export
strategy.
Overall Research into redefining & measuring CS demand
394 Deliverable D4.4 Produced by kMatrix Data Services Ltd
Figure L5: Measuring Market Share
It also became
possible to measure
existing export
performance in
terms of share of a
country’s imports.
Share of global
exports could now
be calibrated to
share of country
market, identifying
where current trade
flows were
strongest.
Figure L6: Measuring Market Share in Relation to Country Market Demand
This meant that
efforts could be
focused on where
trade and market
growth were
strongest, which may
not be where the
volume of exports
was highest. For the
first time, qualitative
decisions about
export strategy were
made using
quantitative data.
Figure L7: Comparing Market Share as a measure of Competitive Performance
The transition to
Inter-Trading also
made it possible to
track national
competitors (over
time) in key country
markets.
This acted as a
barometer of UK
performance and
provided the basis
for evaluating the
success of export
initiatives over time.
Overall Research into redefining & measuring CS demand
395 Deliverable D4.4 Produced by kMatrix Data Services Ltd
Figure L8: Identifying End User Groups for Targeting Exports
The latest (but not
final) stage of
development
involved using all
available intelligence
about national
markets and UK
performance to
leverage resources to
affect specific end-
user groups, either in
the public or private
sector. This required
coding of the sector
data per known
purchasing history.
Figure L9: Identifying In- Country Customer for Targeting Exports
And once an-end
user group is
identified then the
next step is to
identify, attempt to
influence or arrange
meetings with
individual In- Country
purchasers.
These are purchasers
with a known history
in a country that has
a measurable need
and already has
established and
strong trade links.
What Figures L1-9 illustrate is one of the core advantages of the multi-sourced approach i.e. its
ability to go beyond the data that official statistics provide on a national level, to create a truly global
picture of the flow of goods and services that can be used to benchmark and then improve upon
city/national competitive performance.
Overall Research into redefining & measuring CS demand
396 Deliverable D4.4 Produced by kMatrix Data Services Ltd
L.2 Assumptions
One inherent assumption in many analyses of international trade is that exports are good and
imports are the opposite - the “balance of trade” measure that is frequently used to judge economic
performance. In a world of global trade and global supply chains this is clearly not a true measure of
performance. Imports may be finished goods that compete with domestically produced goods, but
they may also be the componentry that enable completed goods to be exported and enable entire
industries to be effective. To downgrade or underestimate imports or to ignore the international
movement of unfinished goods and services is to ignore many of the ways in which industries within
major economies operate.
The example at Figure L10 demonstrates the high-level supply chain for Wind Farm operators. Each
stage or sub system could be sourced domestically, internationally or (most likely) both. Each stage
(product or service) could be provided directly to this specific supply chain or, additionally, to other
supply chains operating in the same or different countries. Assigning import or export status to only
finished goods in a complex supply chain like this is an over-simplification of how and where
economic value can be created.
Figure L10: Supply Chain for Wind Farm Operators
The kMatrix process focuses on the most complete available picture of trade flows and, therefore,
includes unfinished goods and services. To clarify, this means that:
• an import may be an unfinished good that later becomes incorporated into a further or final
product that is subsequently sold domestically or is exported
• an import may be a finished good that is “rebadged” or branded and subsequently sold domestically or is exported
• an import may be a finished “branded” good that is purchased domestically. • an export may be an unfinished good that later becomes incorporated into a further or final
product overseas that is subsequently sold domestically or is re-exported
Overall Research into redefining & measuring CS demand
397 Deliverable D4.4 Produced by kMatrix Data Services Ltd
• an export may be a finished good that is “rebadged” or branded and subsequently sold domestically or is re-exported
• an export may be a finished “branded” good that is purchased overseas.
This means that the estimation of imports/exports using the kMatrix approach is likely to a) produce
different, and often higher, numbers when compared to national statistics and b) the relationship
between imports and exports becomes more inter-relational.
A second assumption within the kMatrix research model relates to the geographic origin of an
export. For example, great care is taken to locate sector activities according to where they are
conducted rather than where they are reported. This means that a multi-site company located in the
UK may report its performance nationally, but the research process attempts to assign activities to
the region, city or sub region where they are performed i.e. the manufacturing plant in the North
West, the distribution centre in the East Midlands and the sales team in London. For an international
company, this becomes more complex, especially for how exports are reported. In the approach
taken and using the UK as an example:
• an international sale from a company in the UK to a customer in another country is registered as
a UK export i.e. it has crossed international boundaries
• a sale by a UK company that is delivered by a business unit in India to an Indian customer is
recorded as a domestic sale
• a sale by a UK company that is delivered by a business unit in India to a customer in another
country is recorded as an Indian export, despite the ultimate ownership or “nationality” of the company.
A final assumption in the compilation of export data is that it is relatively easy to see the initial (and
mostly final) destination, but it is not always so easy to track the onward transmission of (primarily)
goods. An example is exports into Hong Kong, where it is clear the volume of UK exports exceeds the
country’s demand, but it is not always clear where the final South East Asian destination might be. In
this case, no effort is made to re-allocate exports to “probable” locations.
Overall Research into redefining & measuring CS demand
398 Deliverable D4.4 Produced by kMatrix Data Services Ltd
L.3 Research Model
Imports and exports are inherently more complex to measure than domestic sales and, typically,
company data is more protected (see Figure L11). This is especially true of new or emerging sectors
where national statistics do not exist and where company surveys may be the only possible
alternative. Compiling export data for Environmental and Low Carbon has stumbled in the UK (for
example) when companies have been unwilling to share export data.
Figure L11: Challenges presented by Exports
Comment:
It is rare for companies to share detailed
information about their import/export
performance.
Public information is usually presented or
modified to protect a commercial position.
There is, therefore, no single source of
information that can be trusted to reveal
detailed import/export data.
The alternative approach is to use multiple sources to estimate exports and not to be over-reliant on
company data. Exports and imports leave multiple data trails, whether via industry reporting,
insurance, logistics, legal, procurement or other customer sources. Imports and Exports are also
calculated using both in-country and out-of-country data to ensure:
• At least one end of the transaction is recorded
• A possible cross-check on both ends of the transaction
• Descriptions about the goods and services sold and purchased are normalized across
international borders and can be accurately recorded.
The transition from measuring single trade flow (one-to-many) to measuring multiple trade flows or
inter-trading (many-to-many trading as outlined above), while massively increasing the complexity of
mapping imports and exports, has increased the number of triangulation points and has contributed
significantly to the process of compiling more robust data.
The increased complexity of mapping imports/exports means that the standard research process is
modified and encompasses two steps, leading to an estimated value (see Figure L12). The first step
estimates what is expected (using industry level data) and the second step calculates what it is
possible to confirm (using company and country level data). The difference between the two
provides the "confidence level" i.e. the level of imports or exports that can be traced as a percentage
of what the figure might be if full visibility of data was possible and if all data sources agreed.
Initially, company turnover is checked via direct sources and indirect sources. This serves as a back
check for import or export claims made by the companies. Available benchmark data also acts as an
indicator of what level of imports or exports to expect from companies of a certain turnover in
certain markets. Any deviation from this triggers additional research.
Import and export data is available from a number of sources, some directly announced by the
companies and some via external sources that include institutional, industry bodies, government,
Overall Research into redefining & measuring CS demand
399 Deliverable D4.4 Produced by kMatrix Data Services Ltd
academic as well as other sources not necessarily associated with company imports and exports
such as logistics, packaging, personnel, publicity, shipping, consulting, legal and accounting, which all
provide services to the sector and collect data directly from companies and from various parts of the
sector's supply chain. This information provides the "notional" value for imports or exports. This
provides a target figure against which to test our ability to trace actual export performance by
country.
The notional value is based upon all easily available data for companies and the industry sector. The
degree of variance between sources of data gives an indication of how accurate this initial
estimation may be. For example, if the variance is only 20% then the estimation should be better
than 80%. However, variances are often wider than this and require further analysis. The location of
data for this second step of the analysis is usually identified by the process of estimating the notional
value itself. At this point a new series of data processes and sources are used to improve the
estimate and increase the confidence level, using data triangulation. The data triangulation process
identifies in more detail which countries the imports or exports were attributed to and, therefore,
what additional country data sources need to be attached to and analysed. The new sources are
then compared for their variance and then compared with the original sources for the notional
estimate. At this stage the variance should have decreased and confidence levels increased.
This two-step process gives an overall view of the sectors import or export value. There is, however,
usually a small proportion of the most likely export value that cannot be apportioned to any country.
In some cases, this proportion of the notional export figure is often either misclassified or is an
indirect export which just cannot be seen. If it is impossible to clarify this activity, it is excluded from
the final estimate. What remains at the end of the two-step process (although, in reality, it is an
iterative process within and between steps) is an estimated value for imports and exports,
evidenced from named sources, that can be attributed to specific countries, with a confidence level
based upon the variances in the source data.
Overall Research into redefining & measuring CS demand
400 Deliverable D4.4 Produced by kMatrix Data Services Ltd
Figure L12: The Assessment of Import and Export Trading for Sectors
The quality assurance of the accuracy of import/ export data has historically been achieved through a series of blind tests that involve large exporters
sharing data with a trusted third party (like a Government Department) and kMatrix having to provide estimates of company exports using its own
processes. This is a form of competitor intelligence, the type that is practiced daily by the more competitively focused companies.
The results of these blind tests are typically within the confidence levels quoted for the research i.e. the estimated value is within +/- 15% of the actual
company number. Other ways of testing the data include case studies. In the Case Study below, the client was a Government Department and the
challenge was to reconcile two divergent versions of national exports. Ultimately, the case proved that single sourced data can often be misleading.
Low Trust Level Data
High Trust Level Data
Companies House Data
Commercial
Company Trading Data Carriers
Industry Bodies Data
Other Parallel Bodies Data
kMatrix Bench Check Data
Notional Export/Import Figure
Data Variance Analysis
Export/Import Target Country Identified
Target Country Data Sets
Triangulated Data
Data Variance Analysis
Publish Data Accuracy
Publish Final Import/Export Values Estimation
Unknown Destination/Origin Import/Export Values
Either further analysis through Aggressive profiling or reject as the Data may contain indirect import/export data or may just be inaccurate
Data Match by Target Country
i.e. personnel, publicity, Logistics, shipping Consulting and accounting
ONS Where Possible
Overall Research into redefining & measuring CS demand
401 Deliverable D4.4 Produced by kMatrix Data Services Ltd
Case Study: Using Multiple Sources to Estimate/Reconcile Export Values
The Question
The Approach:
Using the standard multi-source approach highlighted above
The Findings:
The Evidence:
Why is there a significant difference between what kMatrix reports about Israeli exports and what Israel reports about itself?
Overall Research into redefining & measuring CS demand
402 Deliverable D4.4 Produced by kMatrix Data Services Ltd